


Options trading offers dozens of strategies, but few are as elegant and often misunderstood as the calendar spread. At its simplest, a calendar spread involves selling one option in a near-term expiry and buying the same strike option in a longer-dated expiry. The two legs are identical in strike price but separated in time. That separation is where the opportunity lives.
Think of it this way. Every option has a price made up of two components: intrinsic value and time value. When implied volatility in the near-term is significantly higher than what the market expects in the long run, the near-term option becomes overpriced relative to the far-term option. The calendar spread is the tool that captures this difference.
You sell the expensive near-term option and use those proceeds to buy the relatively cheaper long-dated option. The net cost is often a small debit, or in cases of extreme short-term fear, even a small credit. Over the coming days or weeks, if the near-term panic subsides and implied volatility normalises, the short leg loses value rapidly while the long leg holds steady. That is where the profit comes from.
A calendar spread is not a directional bet. It is a bet on the mispricing of fear across time.
How The ‘Two Legs’ Work Together
The structure requires two legs traded simultaneously:
The short leg is the option you sell. This is the near-term expiry; typically a weekly or monthly contract with fewer days to expiry. Because near-term options are closer to expiry, they are acutely sensitive to market fear. During periods of turbulence, their implied volatility spikes disproportionately. You collect a premium by selling this elevated fear.
The long leg is the option you buy. This is the far-term expiry; typically a monthly or a long-dated contract with significantly more time remaining. Long-dated options carry muted implied volatility because the market believes today's panic will not persist for months. You buy this relative calm at a reasonable price.
On the NxtOption platform, both legs are placed simultaneously as a Basket order on the same underlying like NIFTY or BANKNIFTY.
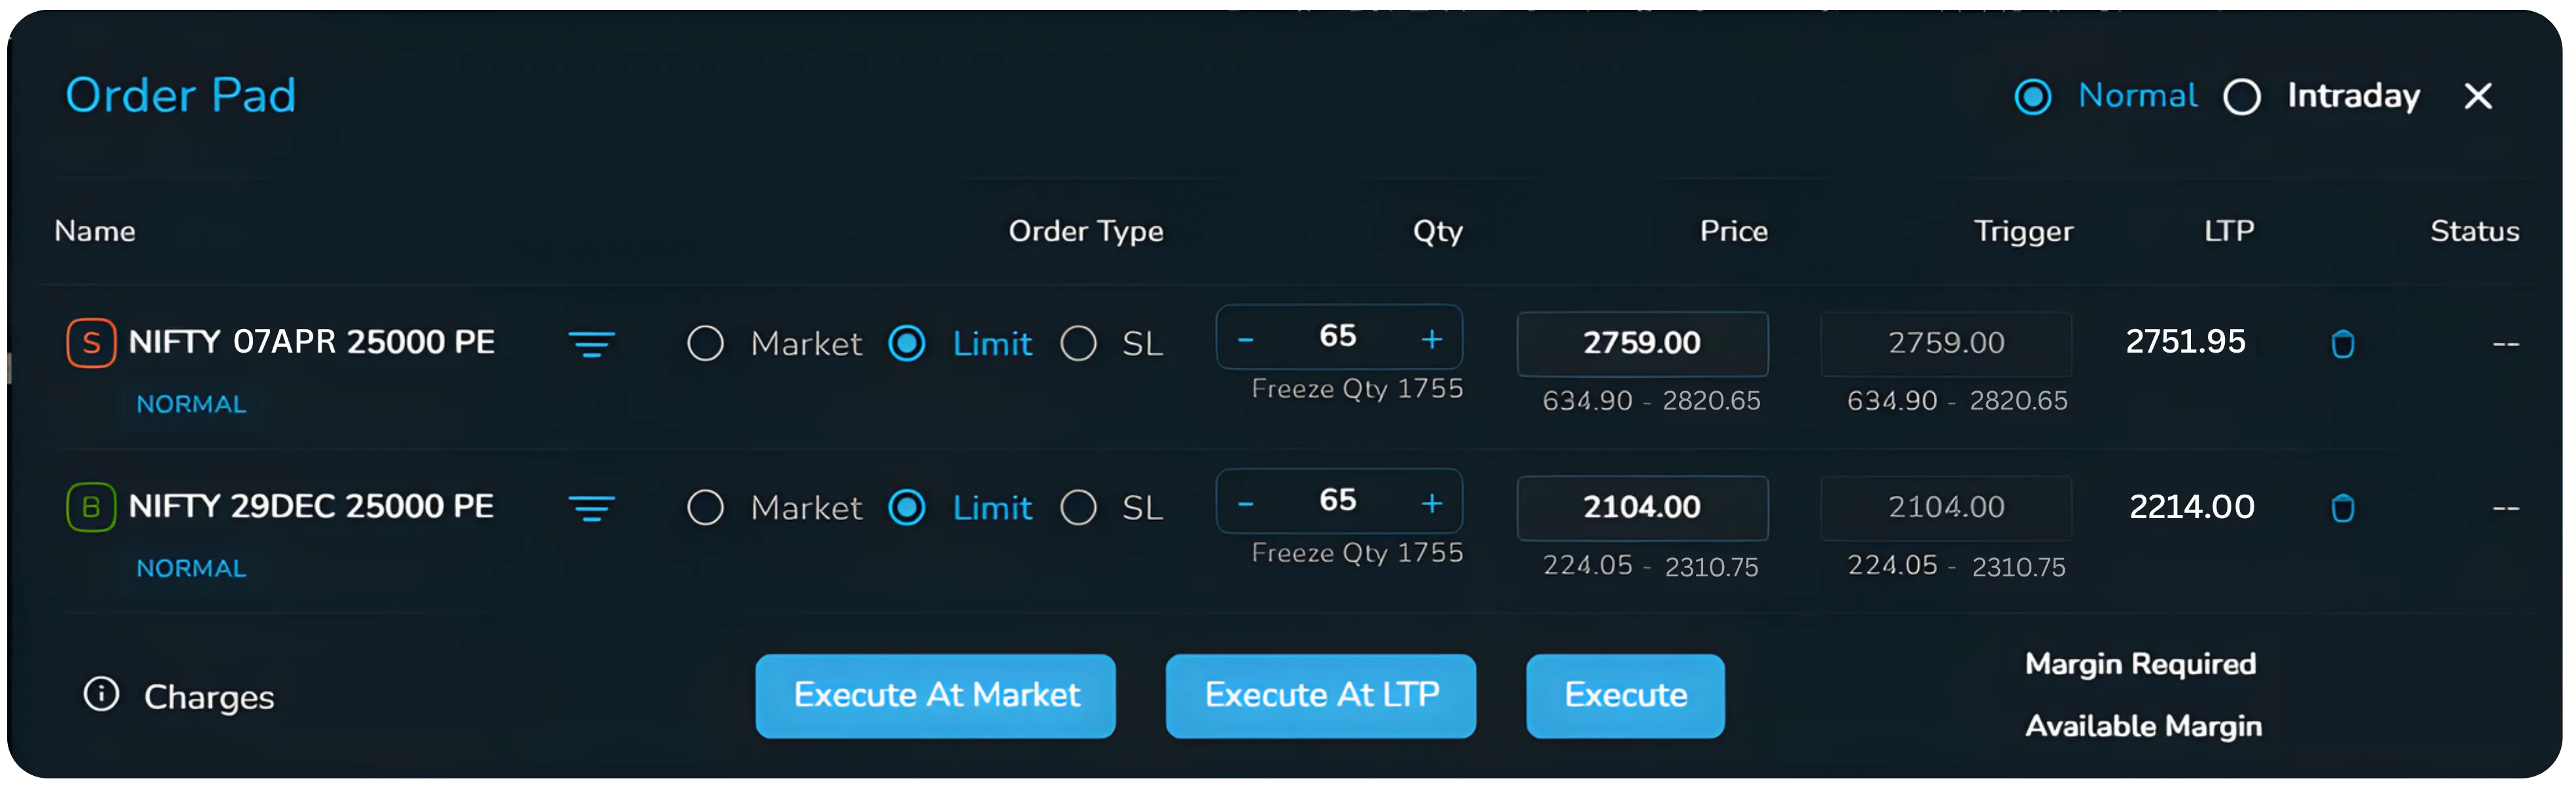
The platform shows you the net premium (debit or credit) for the combined position before you execute, making it straightforward to see your cost and maximum risk upfront.
An Example from NIFTY (April 2026)
Nifty spot: 22,225 | Strike chosen: 25,000 PE
Strategy Breakdown: Deep ITM Put Calendar Spread
What happened next?
Nifty rebounded 475 points in the following days
Short leg collapsed rapidly
High IV + near expiry — value eroded fast as volatility settled
Long leg held relatively stable
Low IV + far expiry (271 DTE) — slow time decay, position protected
Position exit details
Forward Volatility
To understand why a calendar spread makes money, you need to understand forward volatility. It is the most important concept in this strategy, and surprisingly few retail traders know it exists.
What Implied Volatility Tells You
When you see that a NIFTY option is trading at 30% implied volatility, the market is saying: I expect NIFTY to move roughly 30% annualised over the life of this option. This single number encodes the collective fear or calm of all market participants at a given moment.
Now here is the key insight. If you know the implied volatility of two different expiries on the same underlying, you can reverse-engineer what the market is implying about volatility specifically between those two expiries. This in-between number is called forward volatility.
How Forward Volatility Is Calculated
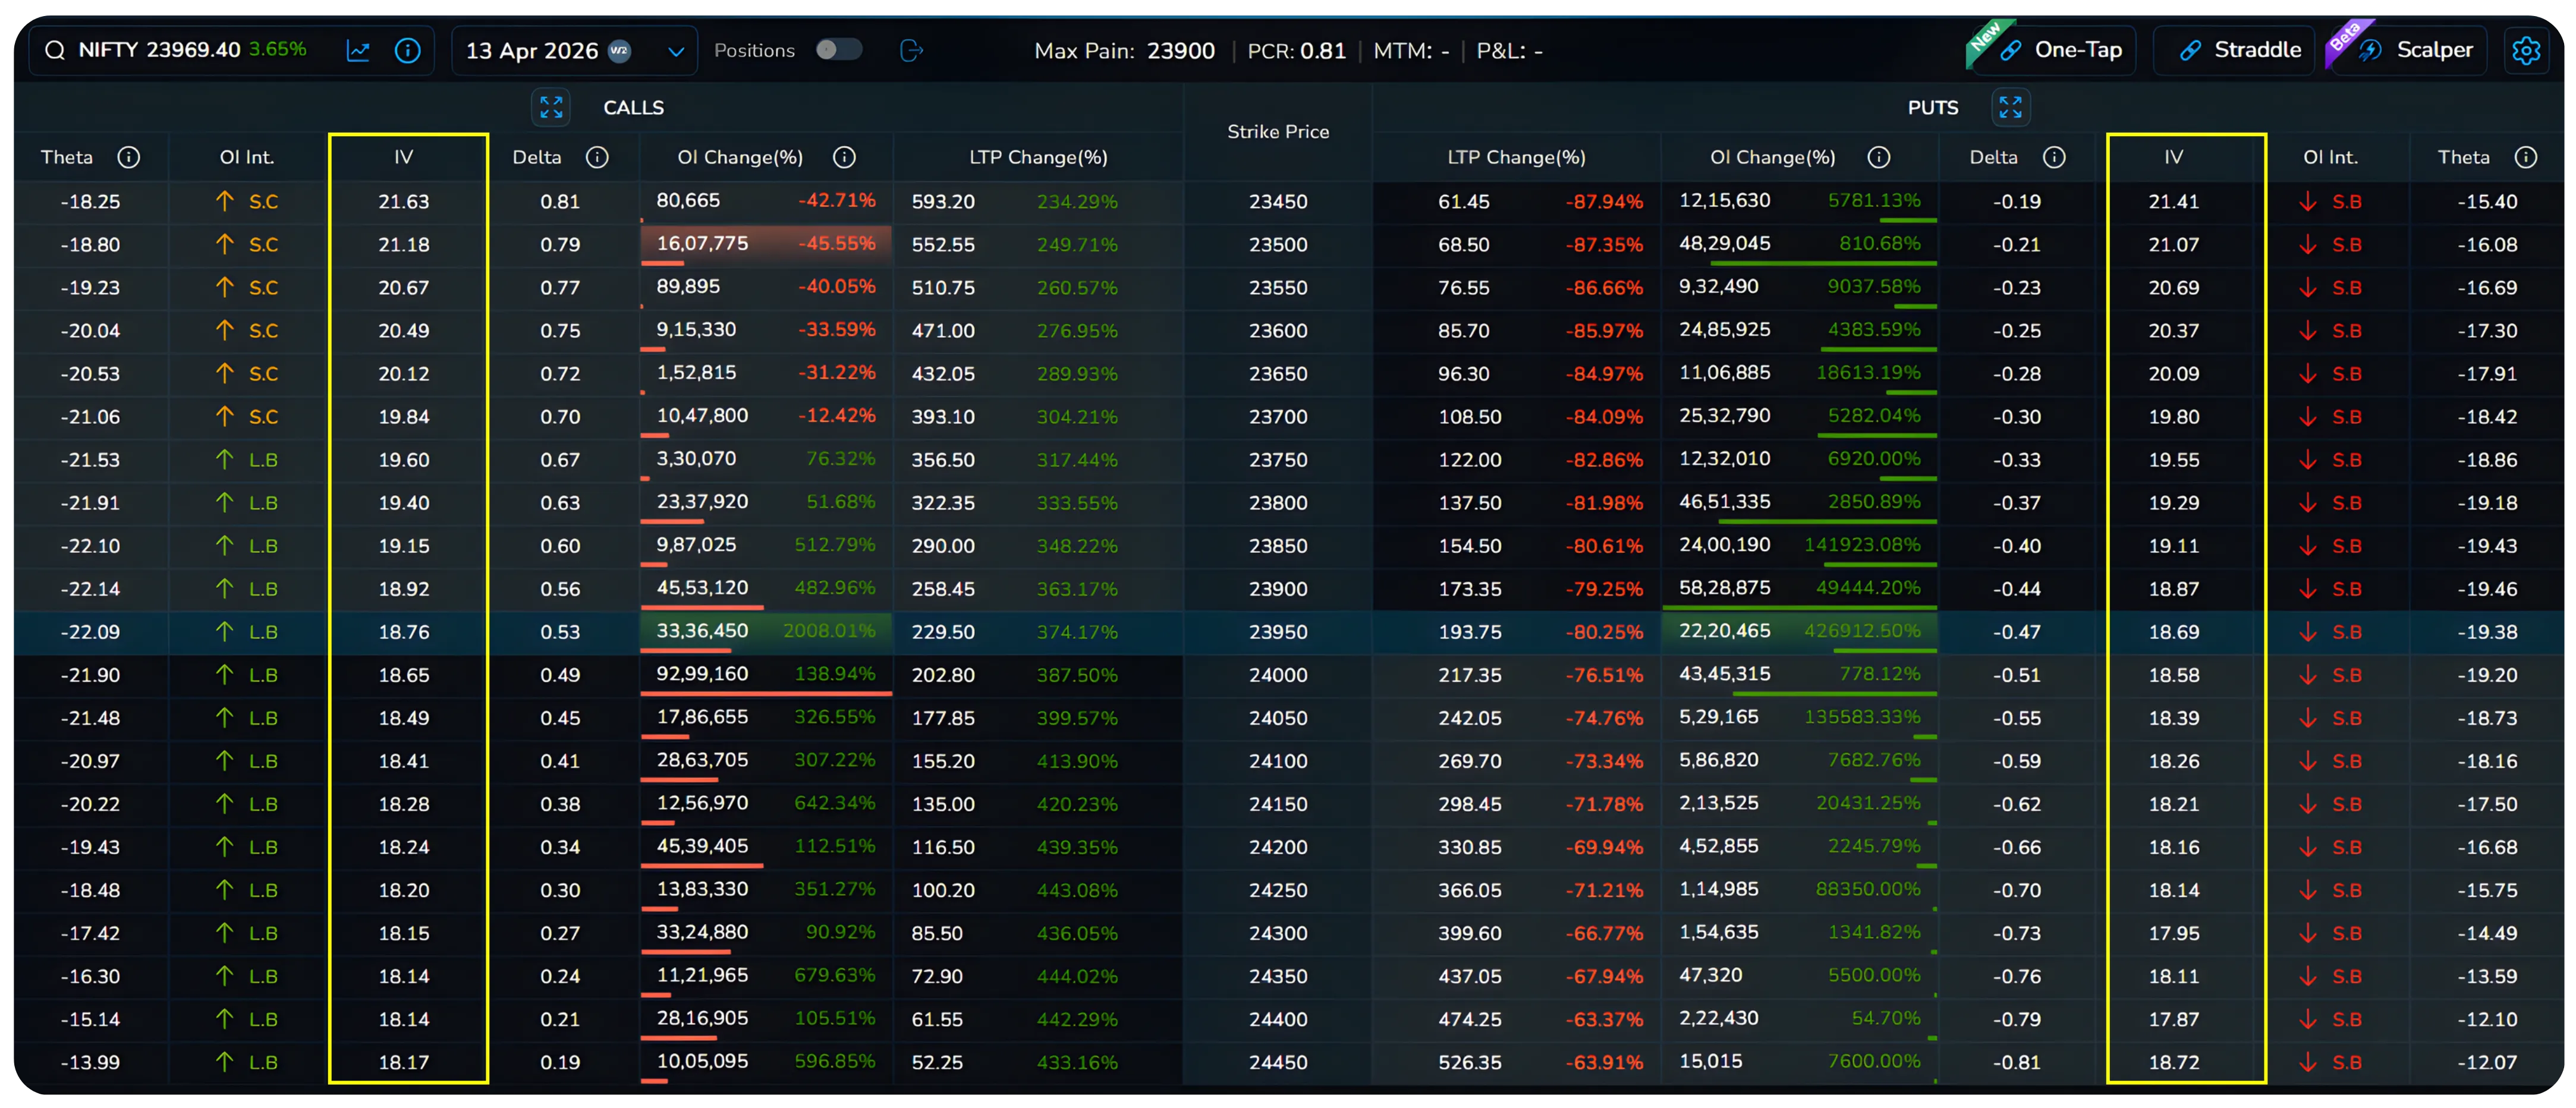
The mathematics follows from the principle that long-dated implied volatility is a blend of near-term implied volatility and the forward volatility between the two dates. If Dec IV = 14.4% and Apr 7 IV = 54.6%, the market is essentially saying: between April 7 and December, I expect only 14-15% volatility. The panic you see today is a five-day phenomenon, not a nine-month one.
Forward Volatility: Dec IV² × T(Dec) = Apr IV² × T(Apr) + Fwd Vol² × T(forward)
Fwd Vol = square root of [ (Dec IV² × T(Dec) − Apr IV² × T(Apr)) / T(forward) ]
You do not need to compute this manually. The forward factor (explained next) summarises the entire calculation into a single actionable number.
The Forward Factor
The forward factor is the ratio that tells you how much more expensive the near-term implied volatility is relative to the forward volatility. It is expressed as a percentage and is the primary signal for entering a calendar spread.
If the near-term IV is 54% and the forward volatility between the two expiries is 14%, the forward factor is (54 minus 14) divided by 14, which equals approximately 286%. This means the near-term option is pricing in 286% more fear than the long-run expectation warrants. When this gap is wide, the edge is large.
| Forward Factor | Signal | Action |
|---|---|---|
| Below 16% | Weak, no edge | Skip this setup |
| 16% to 40% | Valid, tradeable | Enter with standard sizing |
| 40% to 100% | Strong, high confidence | Enter. Good risk-reward |
| Above 100% | Exceptional, rare | Enter. Elevated panic, maximum edge |
In the NIFTY example above, the forward factor was 277%, an exceptional reading driven by the global tariff shock of April 2026. The near-term option was priced for catastrophe while the Dec option was priced for normalcy. That disconnect is precisely what the calendar spread exploits.
On NxtOption, you can view implied volatility for each expiry directly in the option chain. Checking the IV of your short leg expiry against the IV of your long leg expiry and computing the ratio is a quick mental calculation that takes seconds.
Also Read: Understanding Shift, Width, and Hedge in NxtOption Strategy Builder
How the Greeks Behave in a Calendar Spread
Greeks (Delta, Theta, Vega, and Gamma) describe how an option's price changes as market conditions shift. In a calendar spread, these four forces interact in a distinctive way that makes the strategy unique.
Delta
Delta measures how much an option's price changes for every one-point move in the underlying. A single option with a delta of minus 0.5 gains Rs. 0.50 per unit when the underlying falls one point and loses the same when it rises.
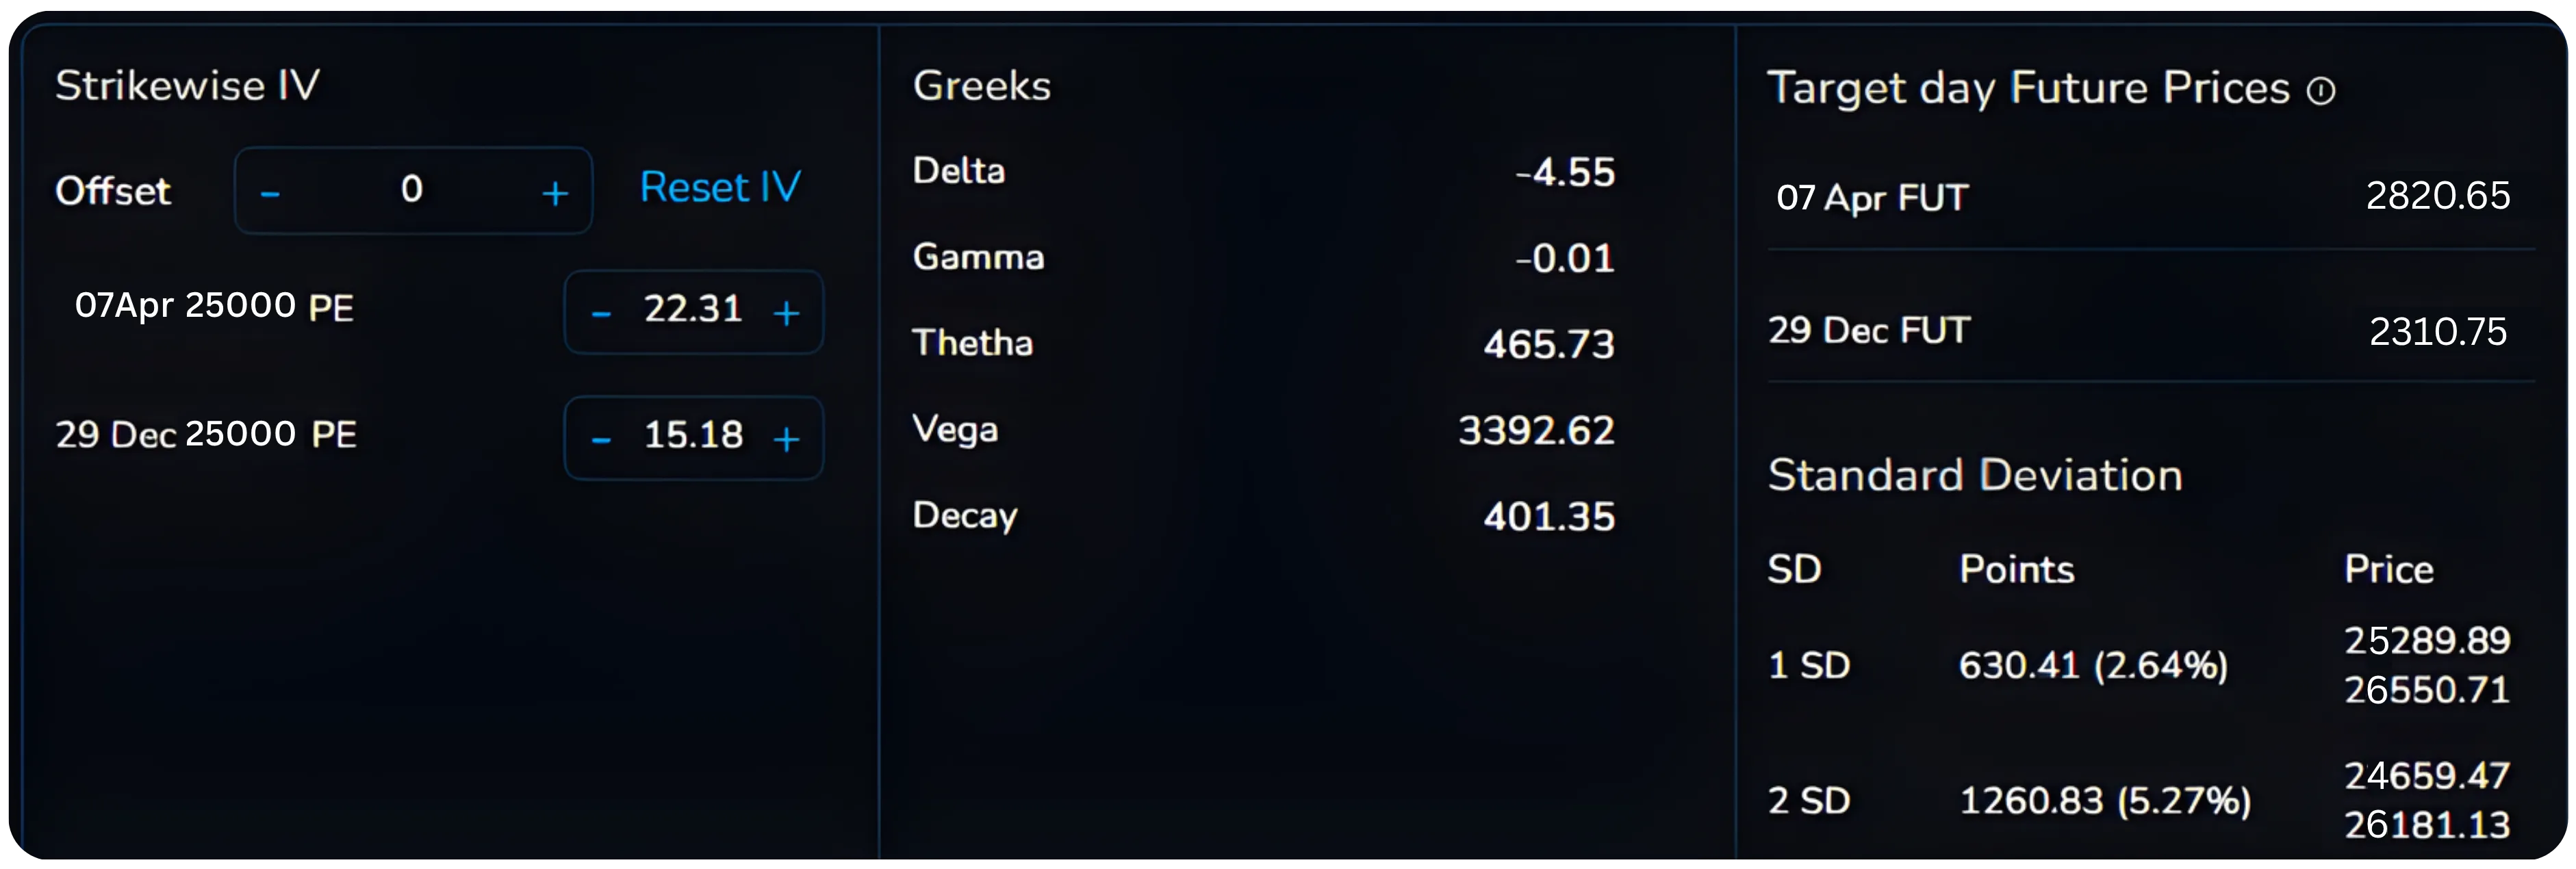
In a calendar spread, the two legs partially offset each other's delta. The short near-term option contributes positive delta (since you are short a put) while the long far-term option contributes negative delta. Depending on the strike and expiry, the net calendar delta typically falls between minus 0.3 and plus 0.3, making the position broadly neutral in direction.
This is a feature, not a bug. A well-constructed calendar spread does not require you to predict whether the market goes up or down. You are betting on time and volatility, not direction. When you trade at or near the current spot price, the delta is close to zero. A slight bullish or bearish tilt can be introduced by choosing a strike slightly above or below spot.
Theta
Theta measures the daily erosion of time value from an option's price. A theta of minus 10 means the option loses Rs. 10 of value per day purely due to the passage of time, all else equal.
This is where the calendar spread earns its living. Options decay faster as expiry approaches. With 30 days remaining, an option might decay Rs. 5 per day. With 5 days remaining, the same option might decay to Rs. 40 per day. The rate accelerates sharply inside the last two weeks.
In a calendar spread, your short leg (the near-term option) is in the zone of maximum decay. It loses time value rapidly every day. Your long leg (the far-term option) decays far more slowly because it has months of life ahead. The net calendar theta is therefore positive: you earn money simply by the passage of time, as long as the market does not move dramatically against you.
In the NIFTY 23000 PE calendar (07th Apr vs 29th Dec), the calendar position shows approximately Rs. 465.73 per lot per day in theta, meaning with every market day that passes with no major movement added to the position's value.
Vega
Vega measures how much an option's price changes for every one percentage point change in implied volatility. A vega of 50 means the option gains Rs. 50 in value per lot when IV rises by one point.
Most traders assume a calendar spread is simply long vega, that it benefits from any volatility increase. This is only partially true, and the nuance matters enormously.
A calendar spread is actually root-time flat in its vega exposure. This technical term means that in a normal volatility shock where all expiries move together in proportion to their time, the two legs roughly cancel each other out and you neither gain nor lose from pure vega movement. What you actually profit from is a non-proportional move, specifically, when the near-term IV drops faster and more sharply than the long-term IV. This is exactly what happens when a panic subsides: short-dated fear collapses while long-dated calm barely changes.
The forward volatility framework captures this precisely. When the forward factor compresses, meaning the near-term IV falls back toward the forward vol, that is when your calendar position profits most.
Gamma
Gamma measures the rate of change of delta. High gamma means that even small price moves in the underlying cause large swings in the option's delta and, consequently, its price.
Near-term options close to expiry have extremely high gamma. This is the primary risk in a calendar spread. If the underlying moves sharply (say Nifty drops 800 points overnight) the short near-term put will gain value explosively because its gamma is so high. The long far-term put will also gain, but its gamma is much lower, so it lags behind. The result is a net loss on the calendar even though both legs moved in the same direction.
This is why calendar spreads perform best in sideways or mildly trending markets. The sweet spot is when the underlying stays within a range of roughly two to three percent of the strike price through the life of the short leg. Large, sudden moves (regardless of direction) are the enemy.
| Greek | Your Exposure | What It Means for You | Good / Bad |
|---|---|---|---|
| Delta | Near zero (neutral) | Direction matters less than vol | Neutral |
| Theta | Positive (+ve) | Every passing day earns you money | Good |
| Vega | Long (muted) | Profit when near-term IV collapses | Good |
| Gamma | Short (near-term) | Large sudden moves hurt the trade | Watch carefully |
Where the Edge Really Comes From
At this point, the structure of a calendar spread is no longer just two legs across time. It is a way of reading how the market prices fear today versus how it expects that fear to evolve. When the near-term implied volatility stretches far beyond the forward expectation, and the forward factor confirms a meaningful gap, the opportunity is not theoretical, it is measurable. Add to this the way delta stays largely neutral, theta works in your favour, and vega rewards the normalisation of panic, and you begin to see why this strategy stands apart. This is where the edge lives: not in predicting direction, but in recognising mispricing across time.
This concludes Part 1 of the guide. In Part 2, we move from understanding to application, covering when to deploy call versus put calendars, how to structure deep ITM setups, how to roll positions, manage risk, and execute efficiently on NxtOption.
Disclaimer: The information provided in our blogs is for informational purposes only and should not be construed as financial, investment, or trading advice. Trading and investing in the securities market carries risk. Always conduct your own research and consult with a qualified financial advisor before making any investment decisions. Past performance is not indicative of future results. Copyrighted and original content for your trading and investing needs.
© 2026 — Tradejini. All Rights Reserved.