


The tweezer top and tweezer bottom candlestick formations can provide valuable insight into possible price trend reversals. They inform you about market momentum. This candlestick pattern occurs when the market returns to the same price point level twice in the same direction either at the price level (bottom) or at the same price level (top) without managing to break it. Basically, the market trying to continue in the same direction but is stuck at precisely the same point. In this article, we are going to consider; what these formations are signaling/indicating about market structure, how they form, and how you may be able to implement them as an effective part of your trading plan.
What Are Tweezer Patterns?
A Tweezer pattern is made up of two back-to-back candlesticks on a chart—those vertical bars that show a stock’s price for a day. These two candles either share the same high or the same low. That means, on two consecutive days, the price hit the same level and then reversed direction.
If the candle has wick
Wicks of up to 10–15% of the total candle length can be ignored, as long as the candle bodies (open and close levels) are nearly perfectly aligned.
This still preserves the core idea of the Tweezer Top pattern — a sign of indecision and a potential reversal at the top of an uptrend.
There are two types of Tweezer patterns:
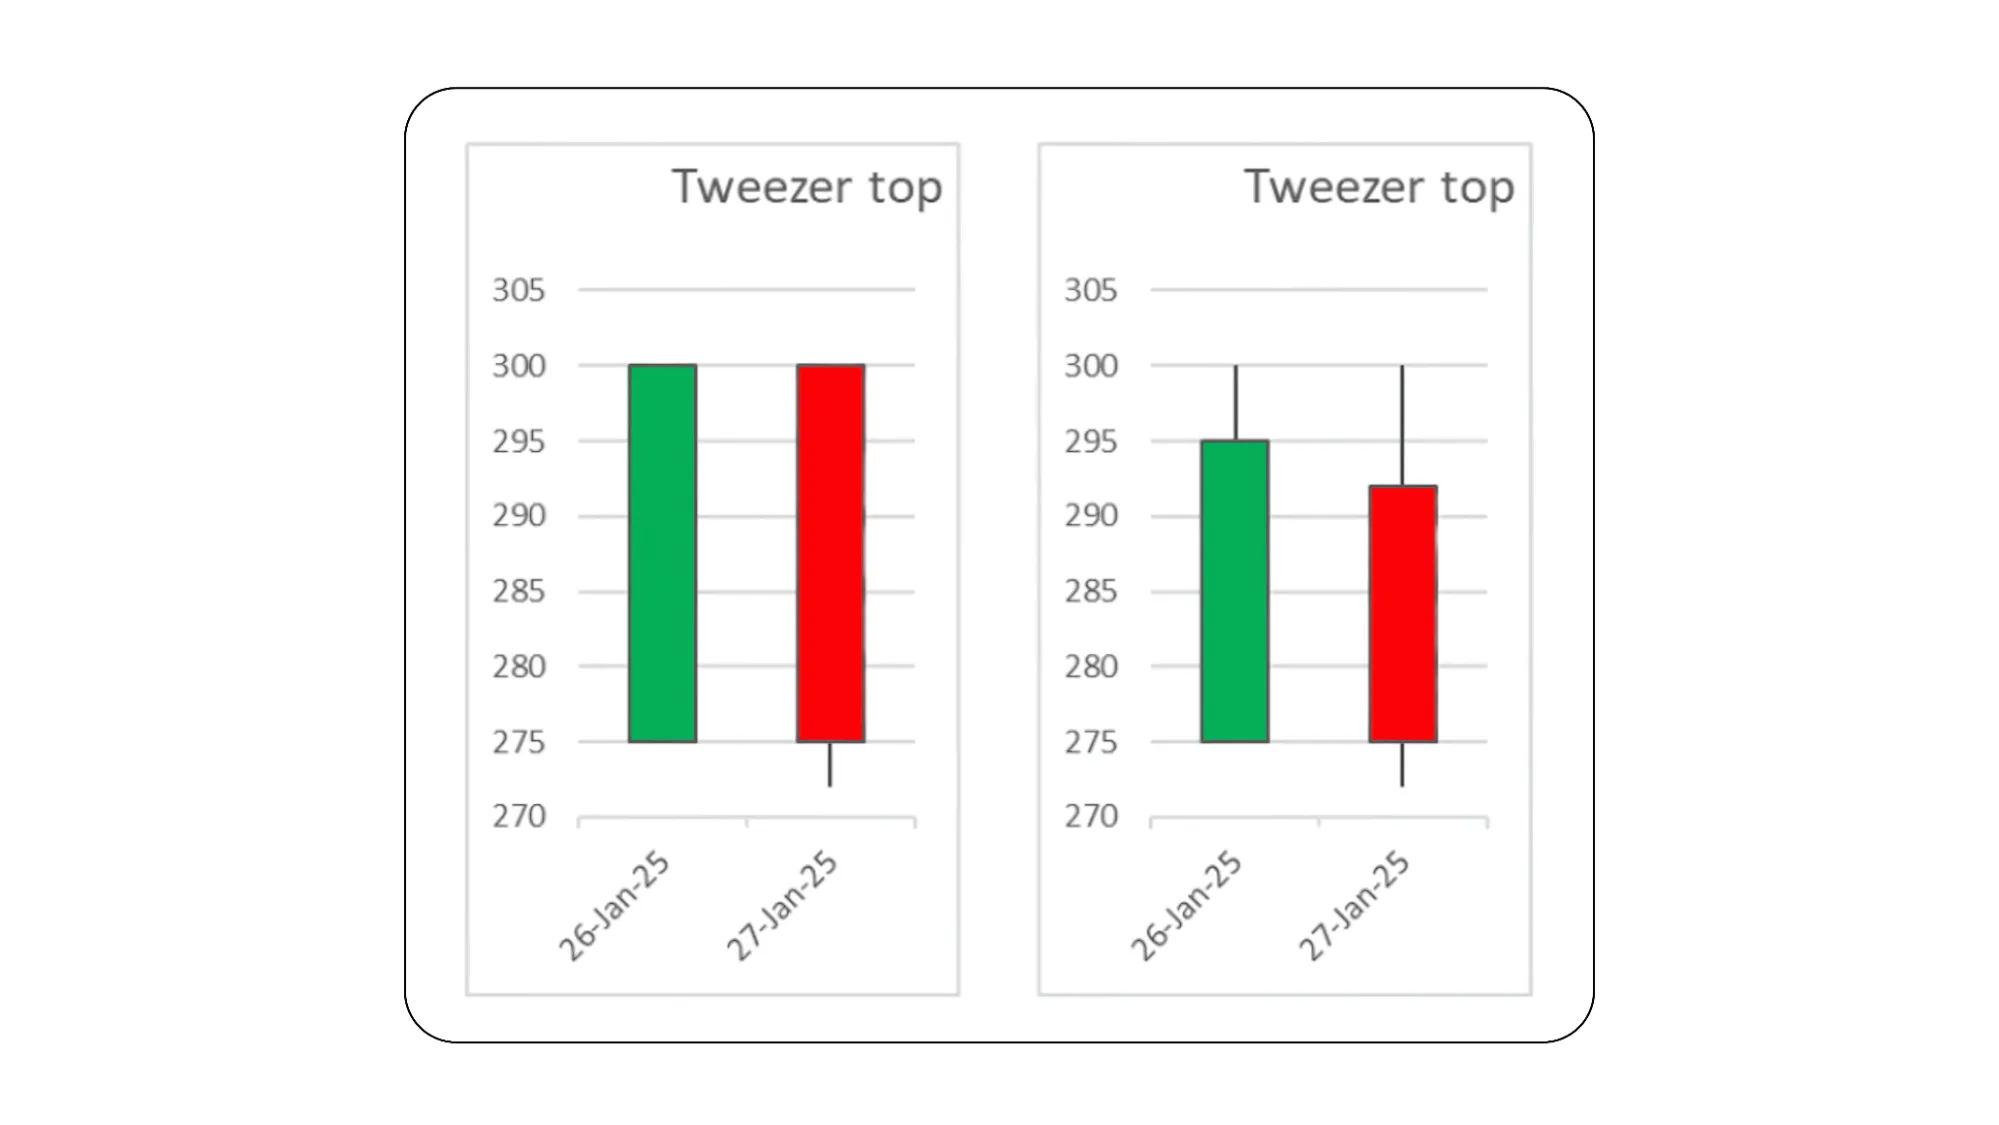
- Tweezer Top: Happens when prices are rising. The market hits a high, then the next day tries again—but fails at the same level. This could mean the buying power is fading.
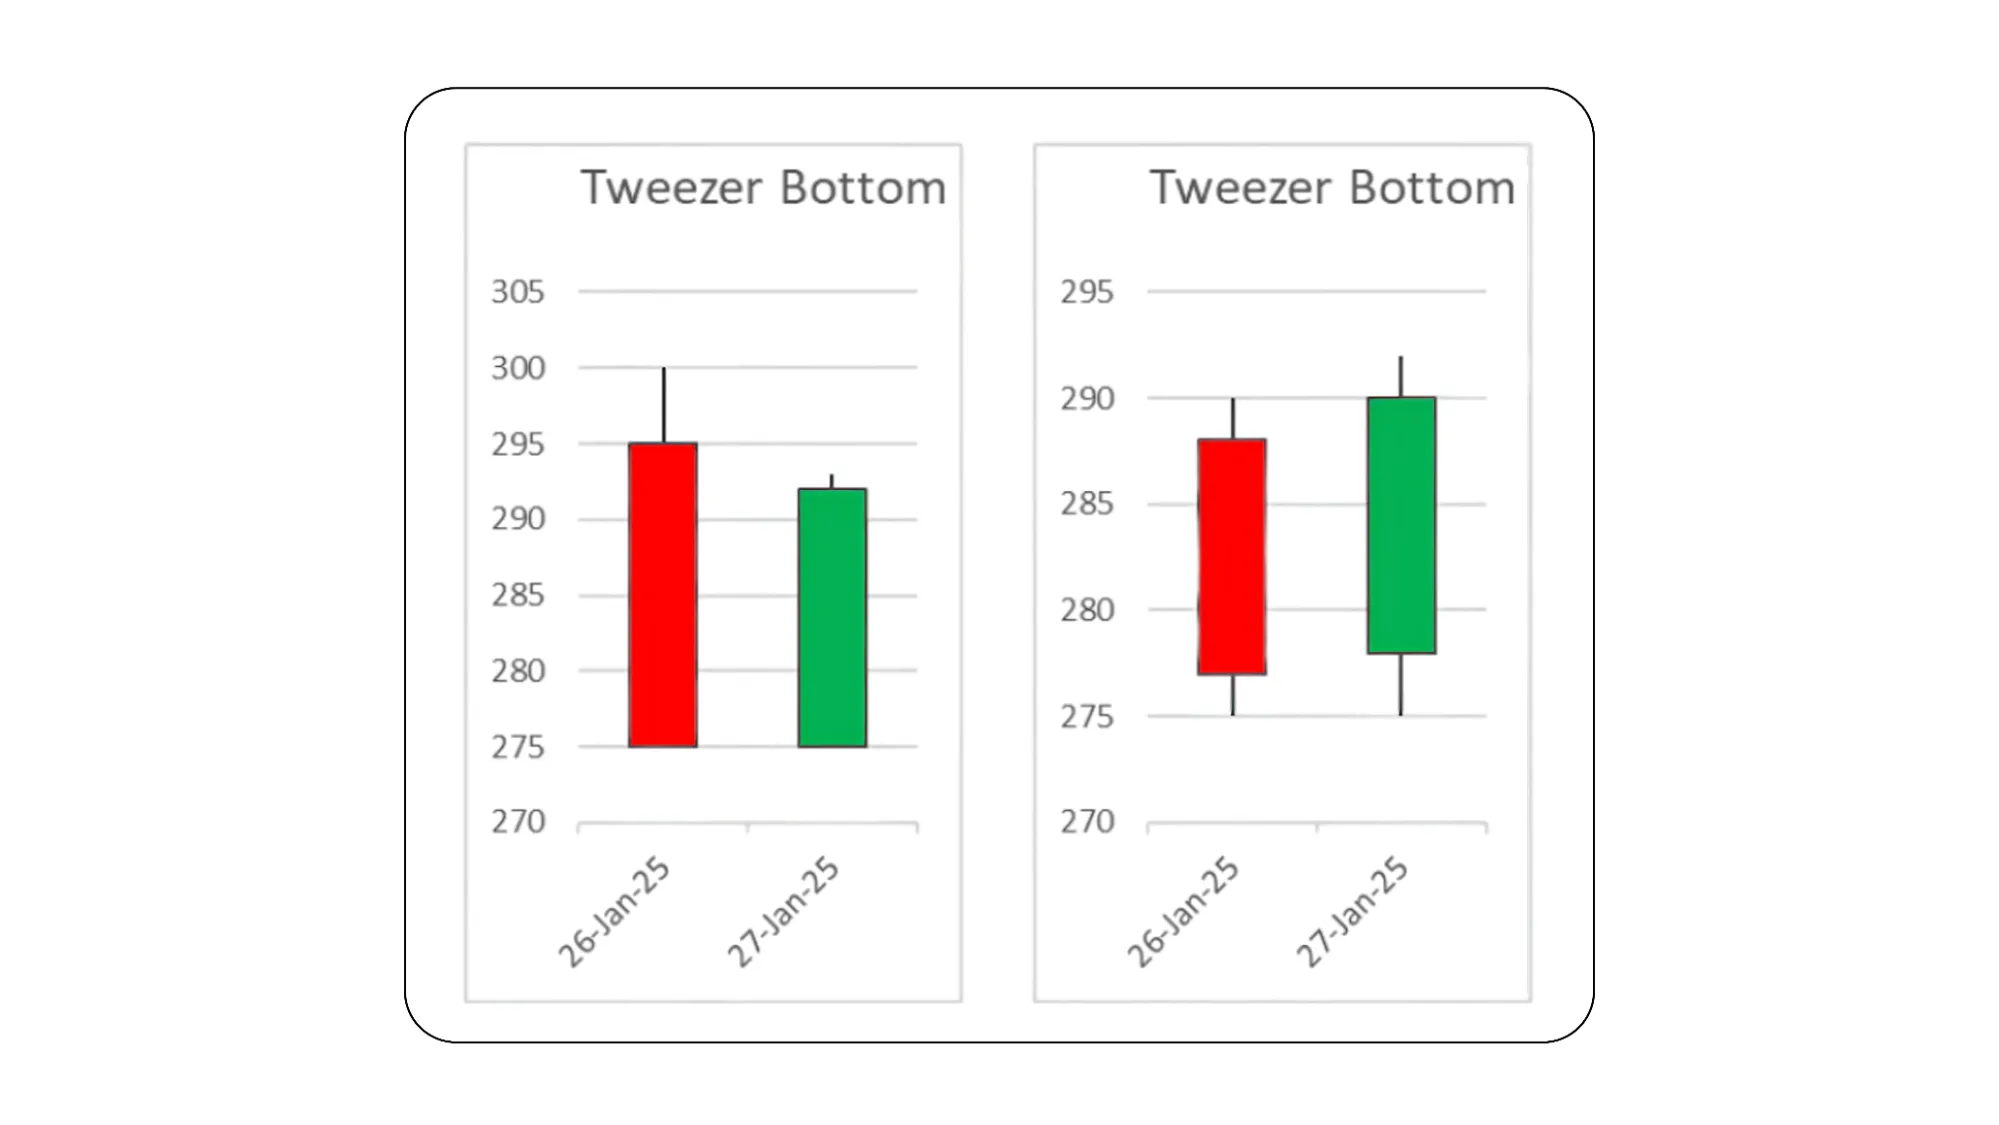
- Tweezer Bottom: Happens when prices are falling. The market hits a low, then tries again the next day—but bounces off the same level. This could mean sellers are losing steam.
In both cases, it is like the market tried knocking on the same door twice—and no one answered. That moment of hesitation might be the early sign of a change.
Tweezer Top -A Signal That the Uptrend Could Be Ending
This pattern usually appears after a strong uptrend. On day one, the price goes up. On day two, it tries to go even higher—but cannot break past the previous day’s high. Both candles have nearly the same top level.
This pattern tells us something simple buyers had a chance to push prices up again, but could not. That is often a sign that they are getting tired, and sellers might be stepping in. Traders see this as a possible early signal of a downward reversal.
Example-1
Pattern Identified:
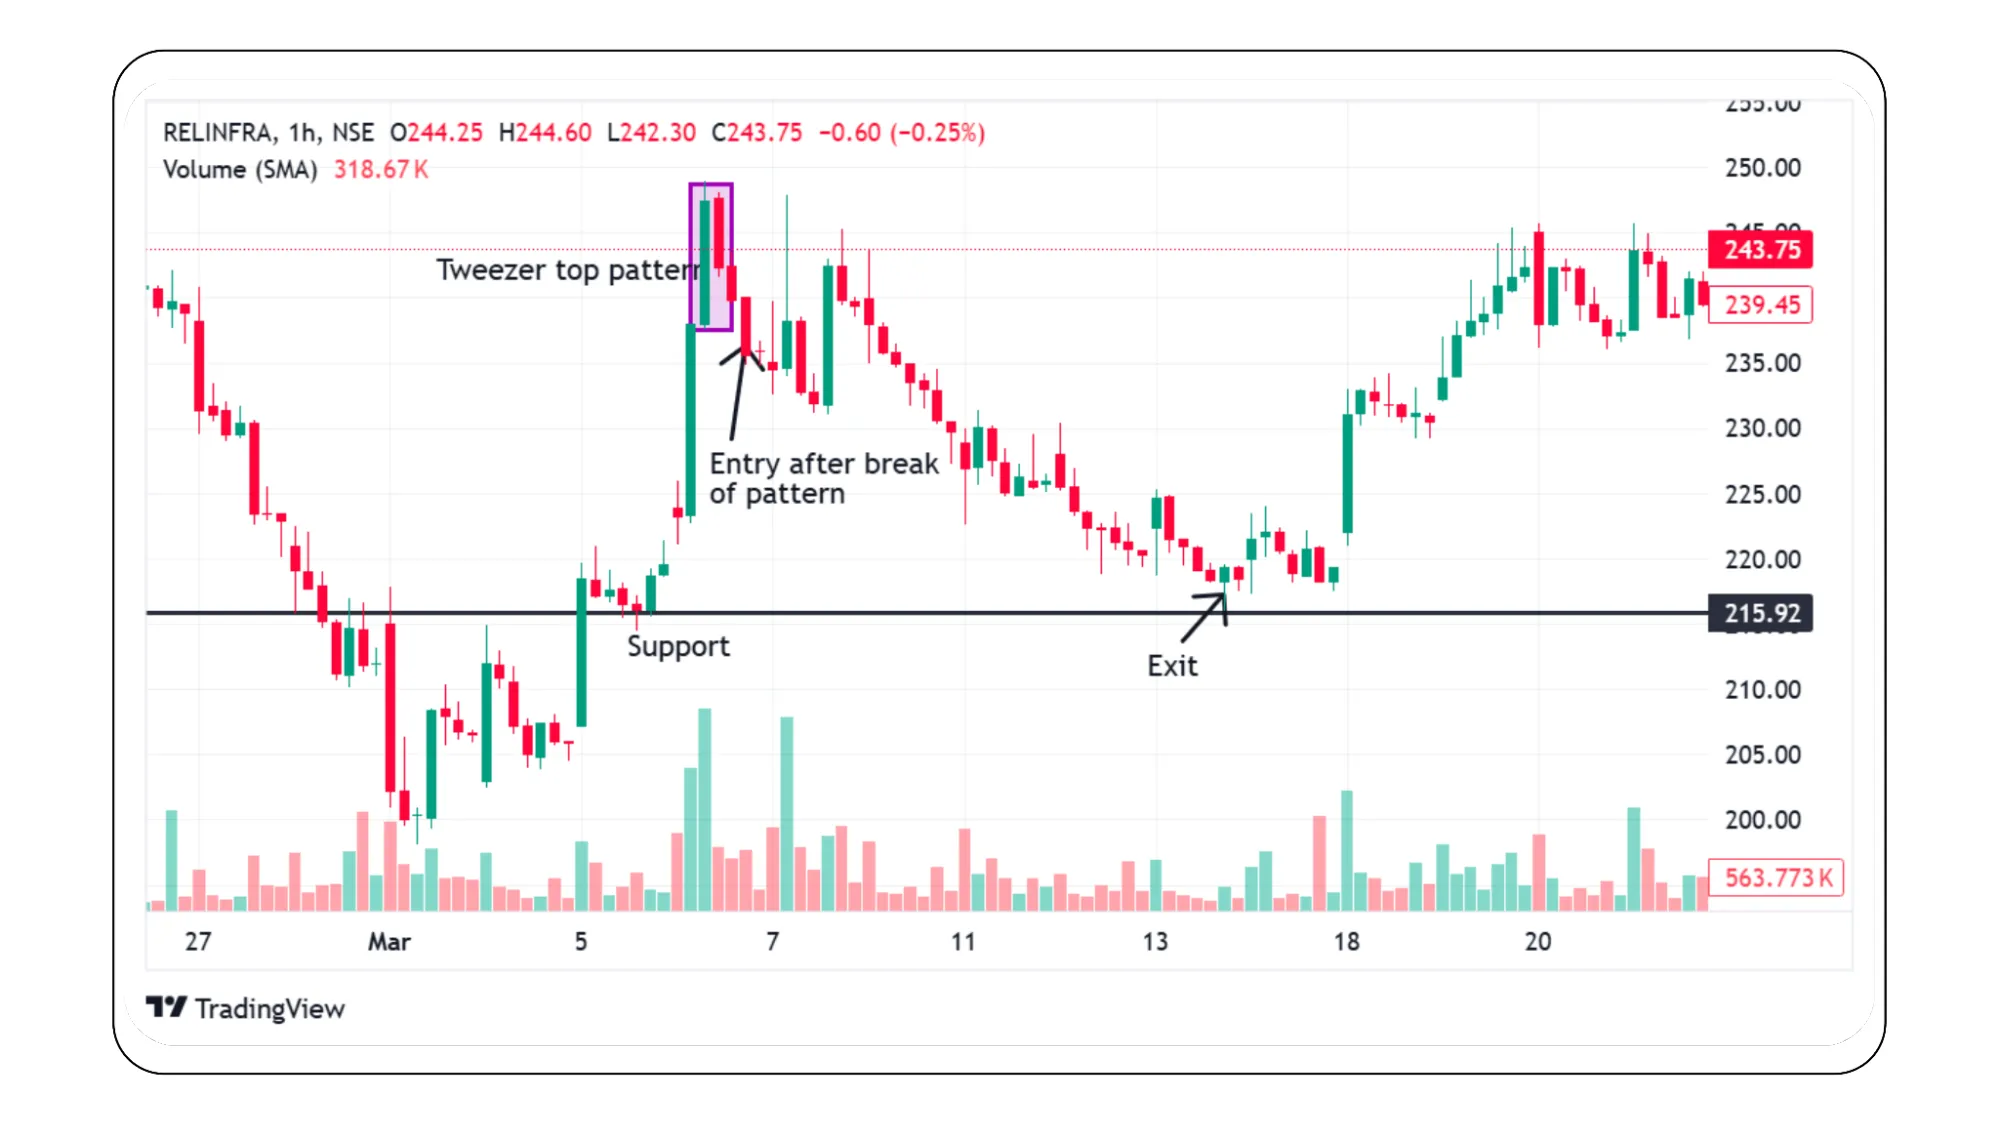
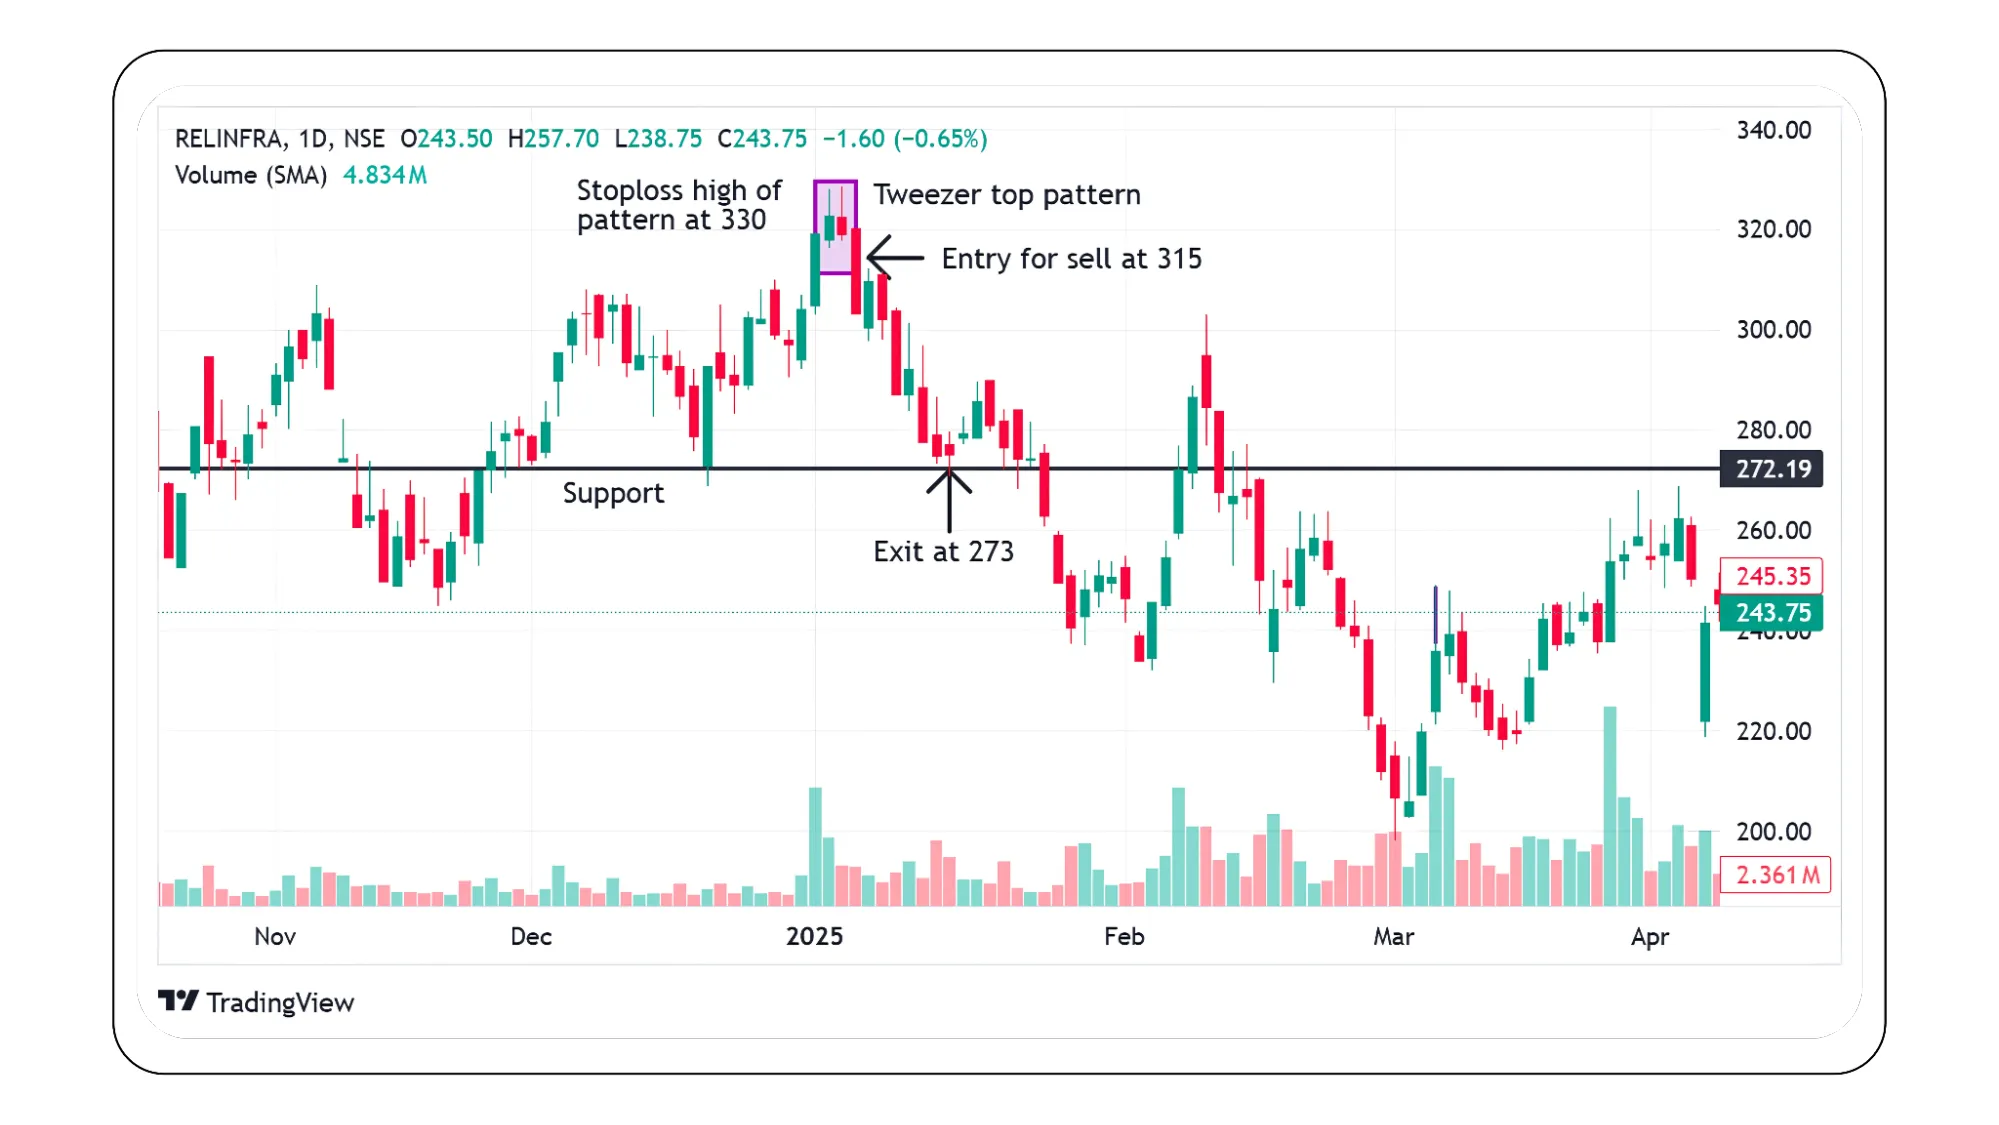
A Tweezer Top pattern formed on RELINFRA's chart on 6th March 2025, indicating potential trend reversal after an uptrend.
Trade Setup:
Entry for Sell: Triggered at ₹237, immediately after the confirmation of the pattern.
Stop Loss: Placed at ₹248, which was the high of the Tweezer Top formation. This level served as a clear invalidation point for the pattern.
Target/Exit: Reached at ₹215, where an earlier swing support was located. This support zone acted as a logical and strategic profit-taking level.
Price Movement Post Entry:
After entering the trade, the stock made a small upward swing. However, it failed to break above the Tweezer Top high, keeping the pattern intact and the trade valid.
Example -2
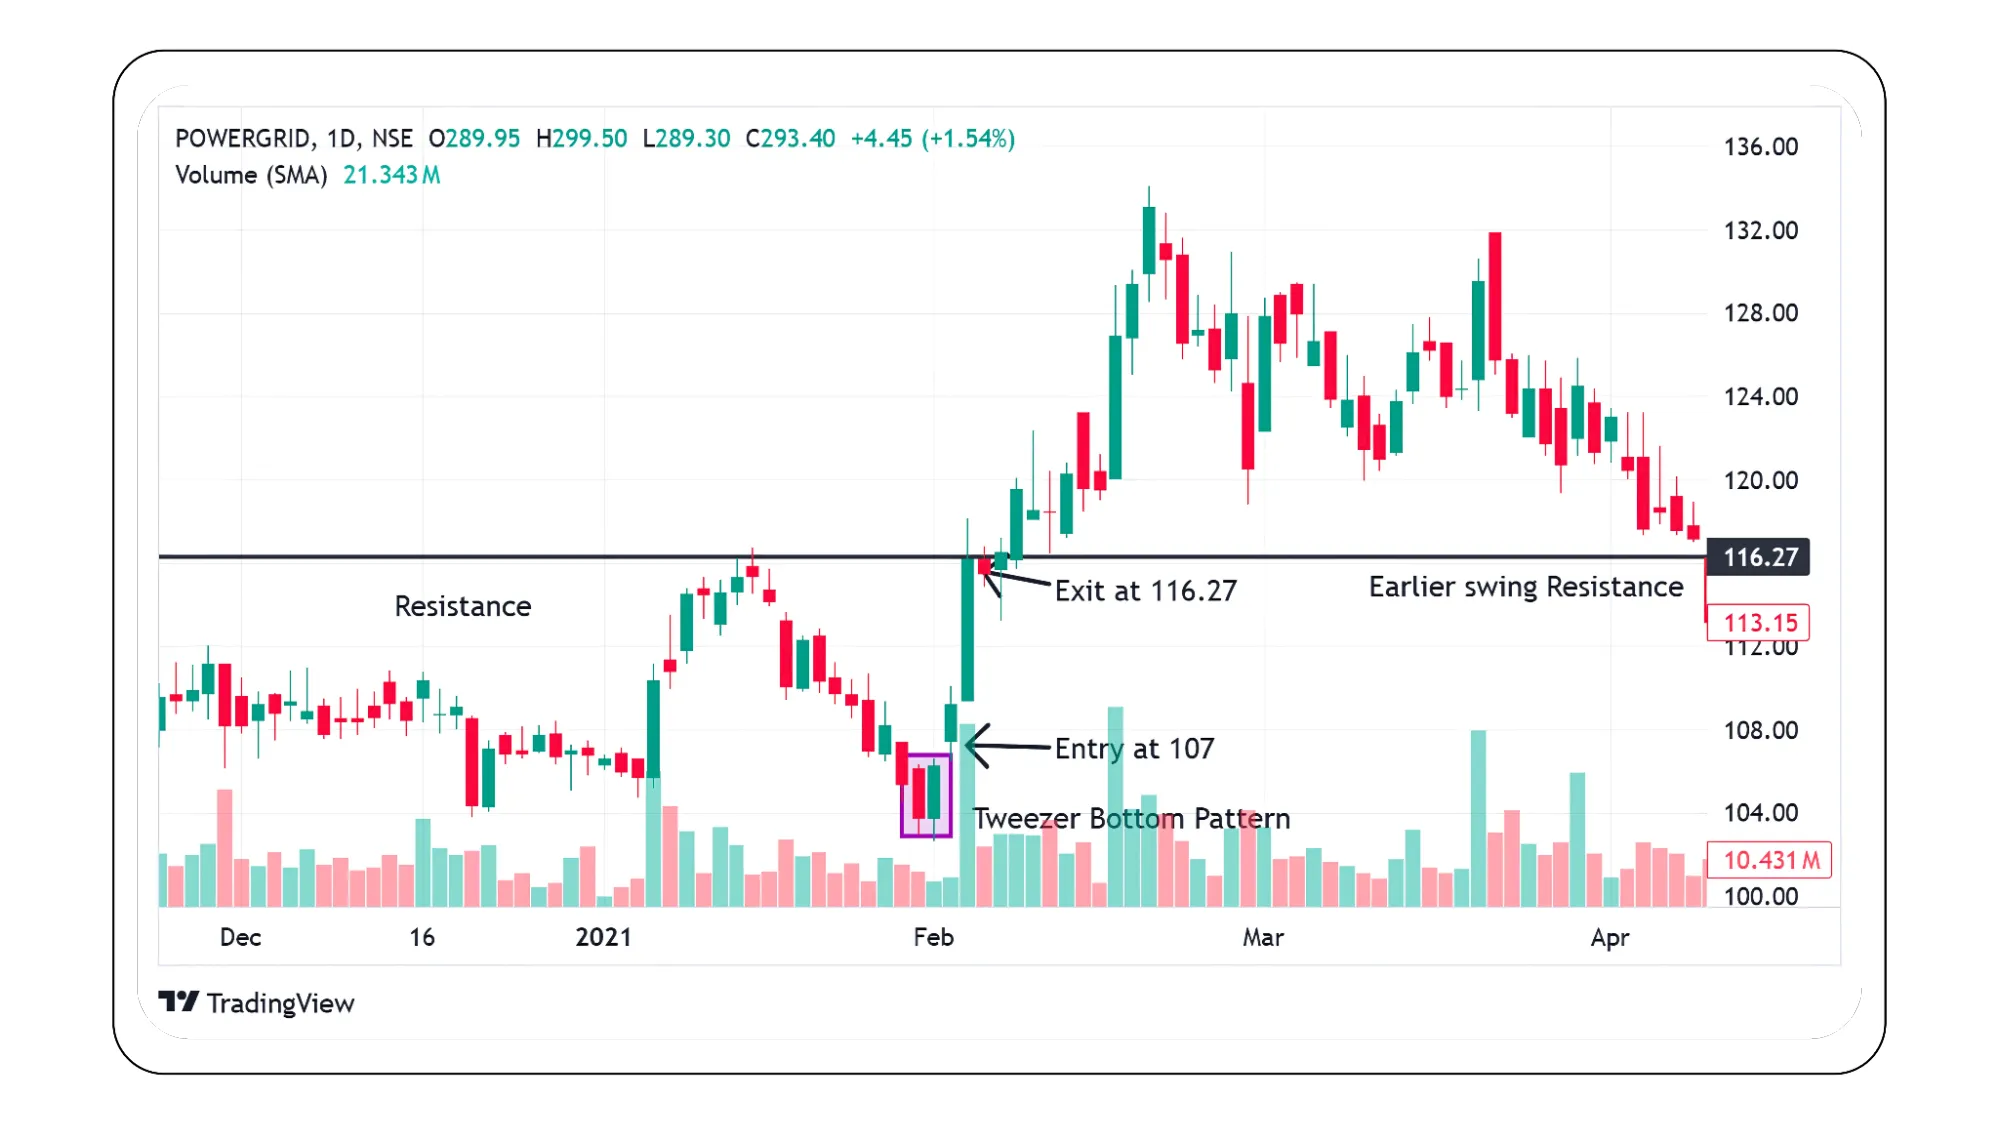
Tweezer Bottom - A Clue That the Downtrend Might Be Done
This one forms after a steady downtrend. On day one, the price falls. On day two, it tries to go even lower—but once again, it stops at the same low as the previous day.
This suggests sellers tried again to push the price down, but failed. It might mean buyers are starting to step in and take control. For traders, this can be a sign that the trend may flip upward.
Example-1
Pattern Identified:
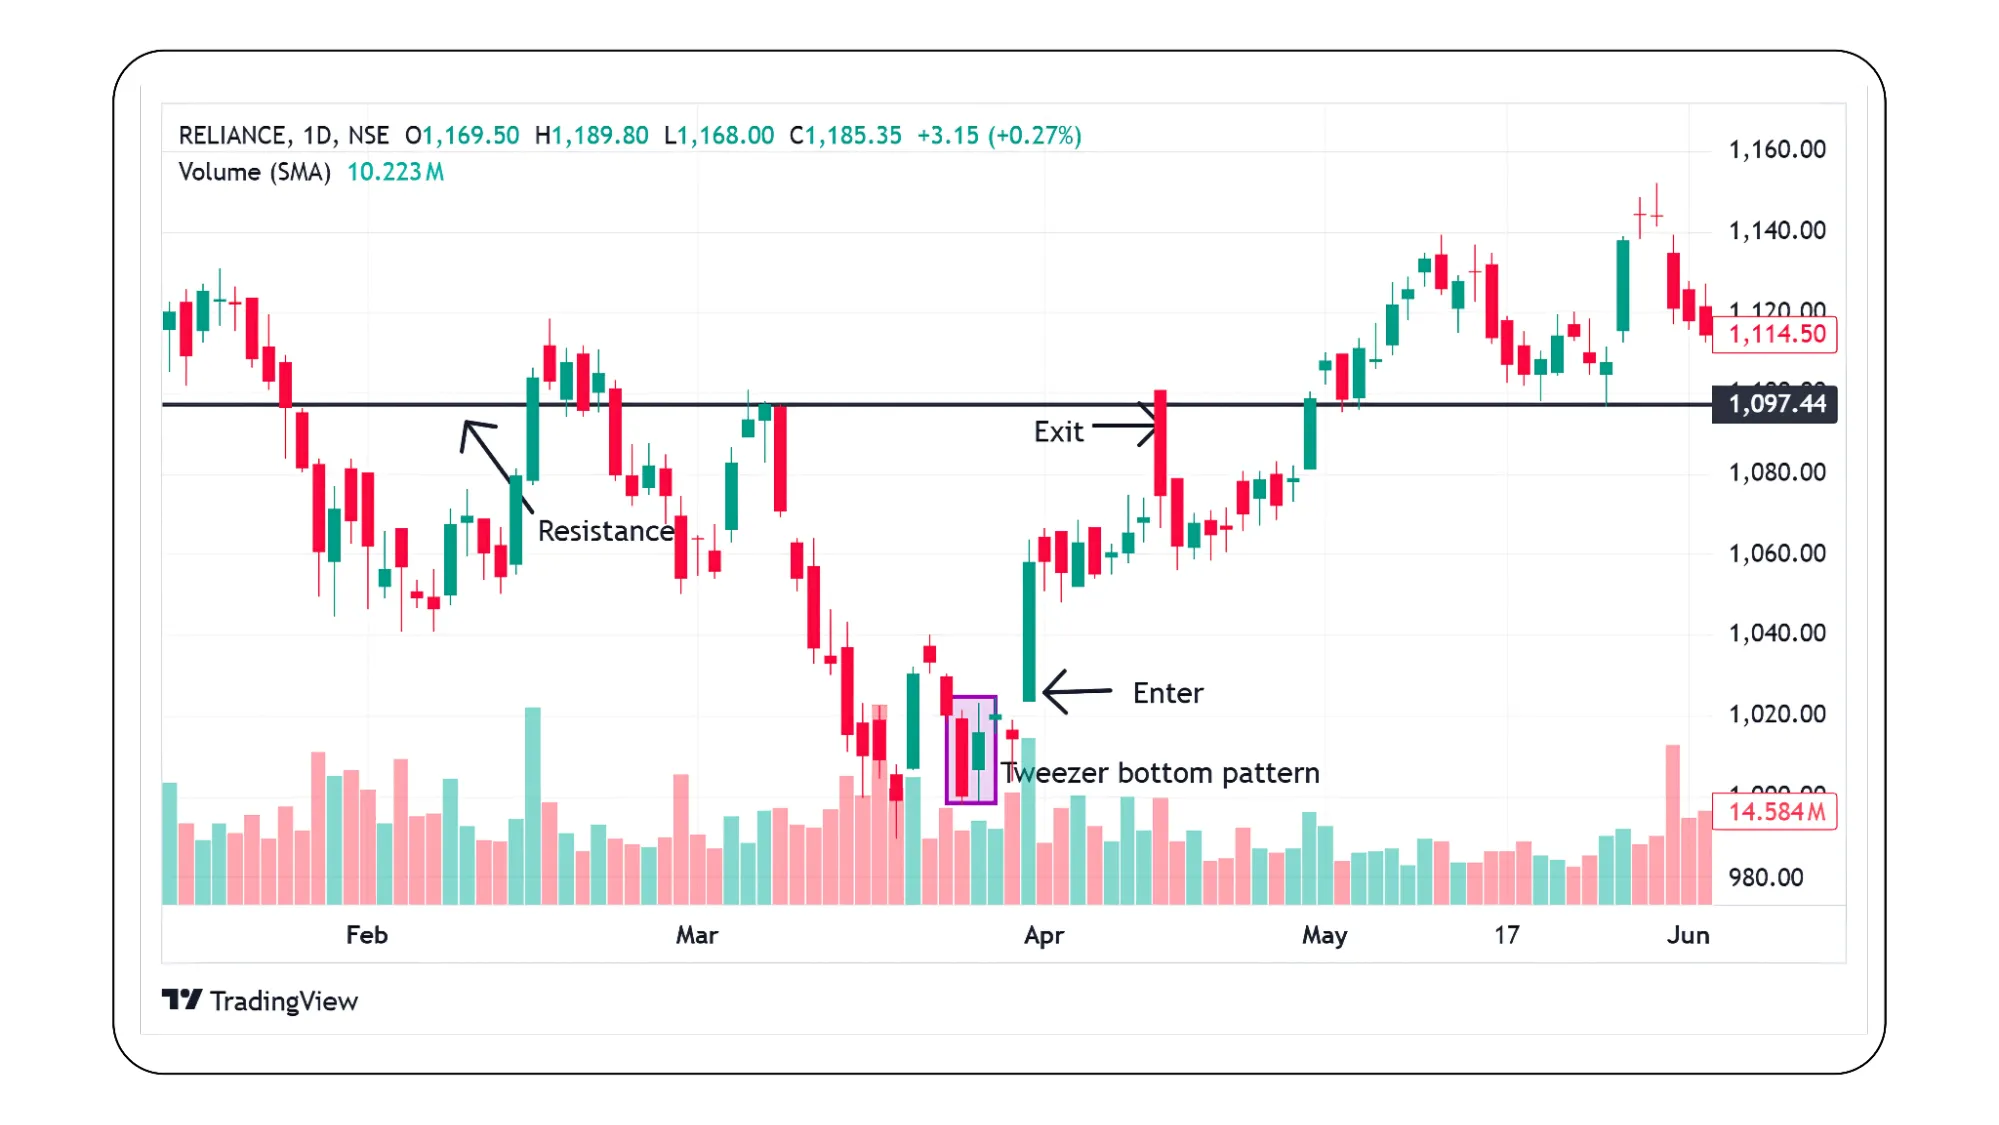
A Candlestick tweezer bottom pattern formed on Reliance's chart on 23rd March 2023, indicating a potential trend reversal after a downtrend.
Trade Setup:
Entry for Buy: Triggered at ₹1,025, immediately after the high of the Tweezer Bottom pattern was broken, confirming the reversal signal.
Stop Loss: Placed at ₹999, which was the low of the Tweezer Bottom formation. This level served as a clear invalidation point for the bullish pattern.
Target/Exit: Reached at ₹1,102, where an earlier swing resistance was located. This resistance zone acted as a logical and strategic profit-taking level. This scenario gave gain of around 77 points.
Example-1
Why These Patterns Matter
The key to these patterns is not just what they look like—but what they mean. They show a clear moment of hesitation in the market. Whether it is buyers failing to push higher or sellers failing to go lower, the message is the same one side is losing its grip.
These repeating highs or lows are often where big investors have placed orders—so when the market cannot push past those zones, it reflects a shift in power. That is why Tweezer patterns are often linked to reversals.
How to Use These Patterns Wisely
Tweezer patterns are helpful—but not always enough on their own. Acting just because you spot one can be risky. Here are a few extra checks you should make before making a move:
Volume: Did trading activity pick up? Strong volume makes the reversal more reliable.
Support or Resistance Zones: Are these patterns forming near known price barriers? That adds weight to the signal.
Market News or Trends: Is there a broader trend or news event that supports the reversal?
The Next Candle: What happens after the Tweezer matters a lot. A strong move in the new direction confirms the pattern.
Tweezer Top and Bottom patterns might seem small, but they carry powerful information. They offer a glimpse into the moment when a trend is possibly ending—and a new one might be starting.
By themselves, they are a useful signal. But when paired with volume, price action, and trendline, they become a smart way to stay one step ahead of the market.
Disclaimer: The information provided in our blogs is for informational purposes only and should not be construed as financial, investment, or trading advice. Trading and investing in the securities market carries risk. Always conduct your own research and consult with a qualified financial advisor before making any investment decisions. Past performance is not indicative of future results. Copyrighted and original content for your trading and investing needs.
©️ 2025 — Tradejini. All Rights Reserved.