


Price action often reflects decisions that traders have already executed. To understand what is developing beneath the surface, traders must analyze how market participants are positioning themselves through Open Interest. OI represents the total number of active futures and options contracts at a particular strike, and it captures where fresh exposure is entering the market and where money is exiting.
When open interest changes sharply at specific levels, it reveals a shift in sentiment and conviction long before the price reacts. This makes OI analysis a powerful tool for experienced traders who want to anticipate moves rather than respond late.
If you prefer visual learning, watch our OI Spurts walkthrough video on NxtOption. It explains how to interpret OI spurts, read OI breakdowns, and understand market sentiment in real time.
OI Spurts EXPLAINED in NXTOption | Spot Long & Short Moves Before Everyone Else | Tradejini
OI spurts occur when there is a sudden increase or decrease in the number of outstanding contracts. Such spurts indicate that new money is either entering or leaving the market. They reveal who is building long positions, who is building short positions, and whether traders are closing existing positions. Without this context, price action alone can be misleading, especially during periods of low volume, rapid volatility, or significant news events.
Also Read: The Difference Between Historical and Implied Volatility
OI Breakdown
When open interest increases, it means traders are opening new positions, whether long or short. This indicates an expanding market and rising interest. When open interest decreases, it means traders are closing positions, which may suggest uncertainty, reduced conviction, or the end of a trend.
This structure transforms open interest from a statistic into an analytical tool that helps traders understand sentiment, confirm trends, detect early warnings, and gain insights into market trends long before the stock price reacts.
Open Interest Breakdown and Market Trends
When open interest increases, it means traders are opening new positions, whether long or short. This indicates an expanding market and rising interest. When open interest decreases, it means traders are closing positions, which may suggest uncertainty, reduced conviction, or the end of a trend.
To Understand More about OI Interpretation read: How to Interpret Open Interest and Price Data: A Trader’s Guide
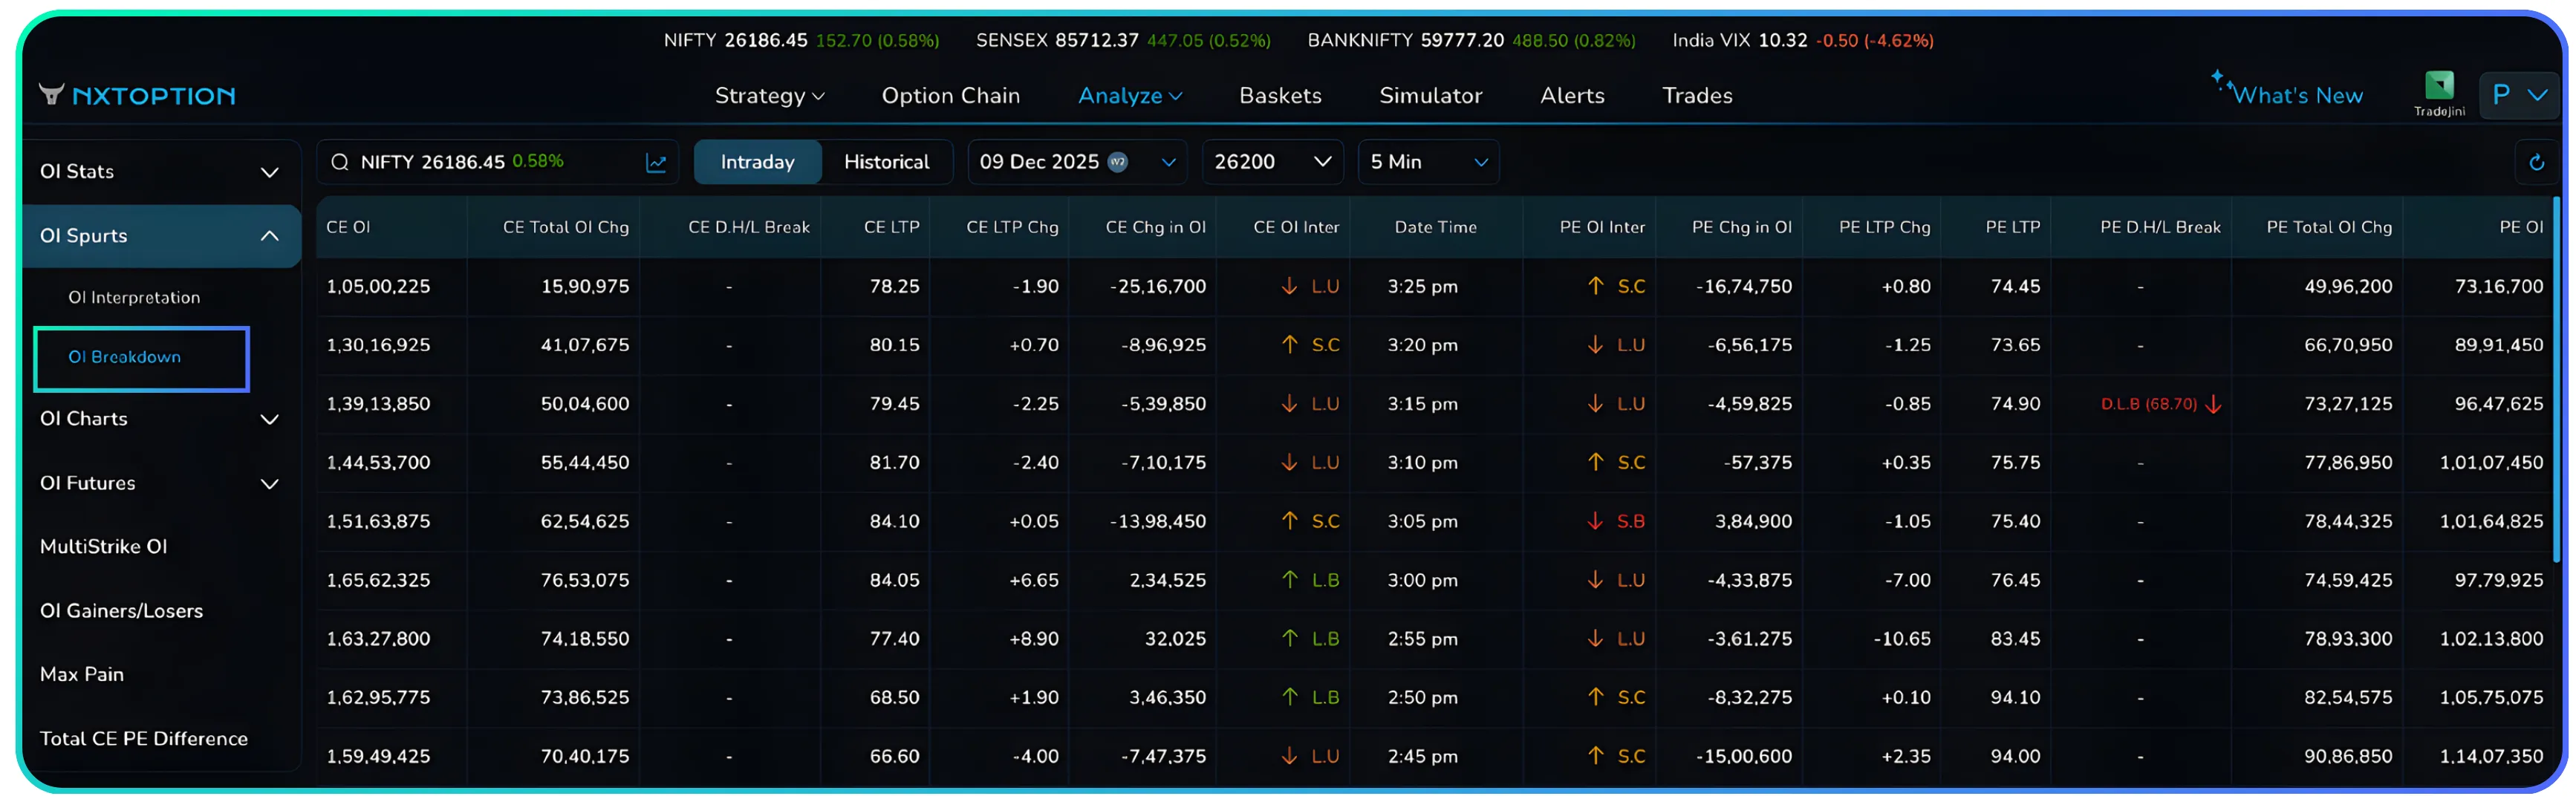
OI Breakdown Table: Intraday and Historical Evidence
OI Breakdown in NxtOption shows how intraday participation evolved, strike by strike, with timestamps. You can clearly see:
where the buildup started
when sentiment shifted
whether the move is genuine or fading
Trend days become easy to ride because you see supporting positions, not just green candles. Trap moves also become easier to avoid because you notice OI drying up. This is the difference between trading confidently vs. guessing based on charts alone.
It shows:
- Total open interest
- OI change (absolute and percentage)
- Price action and LTP changes
- Day high and day low breaks
- Interpretation tags (L.B, S.B, L.U, S.C)
- Timestamp for every update
Together, they help you read the market with conviction. The quadrant shows the immediate sentiment, while the breakdown table backs it with solid evidence.
‘If price is climbing but OI falls, you know the rally is losing steam. If price is flat but OI rises sharply, a breakout is brewing.’
You start anticipating the moves instead of reacting late.
To Learn how to Trade better with Strategy Builder read: NxtOption Strategy Builder: Automate, Analyze, and Execute Options Trades with Ease and Precision.
Practical Examples
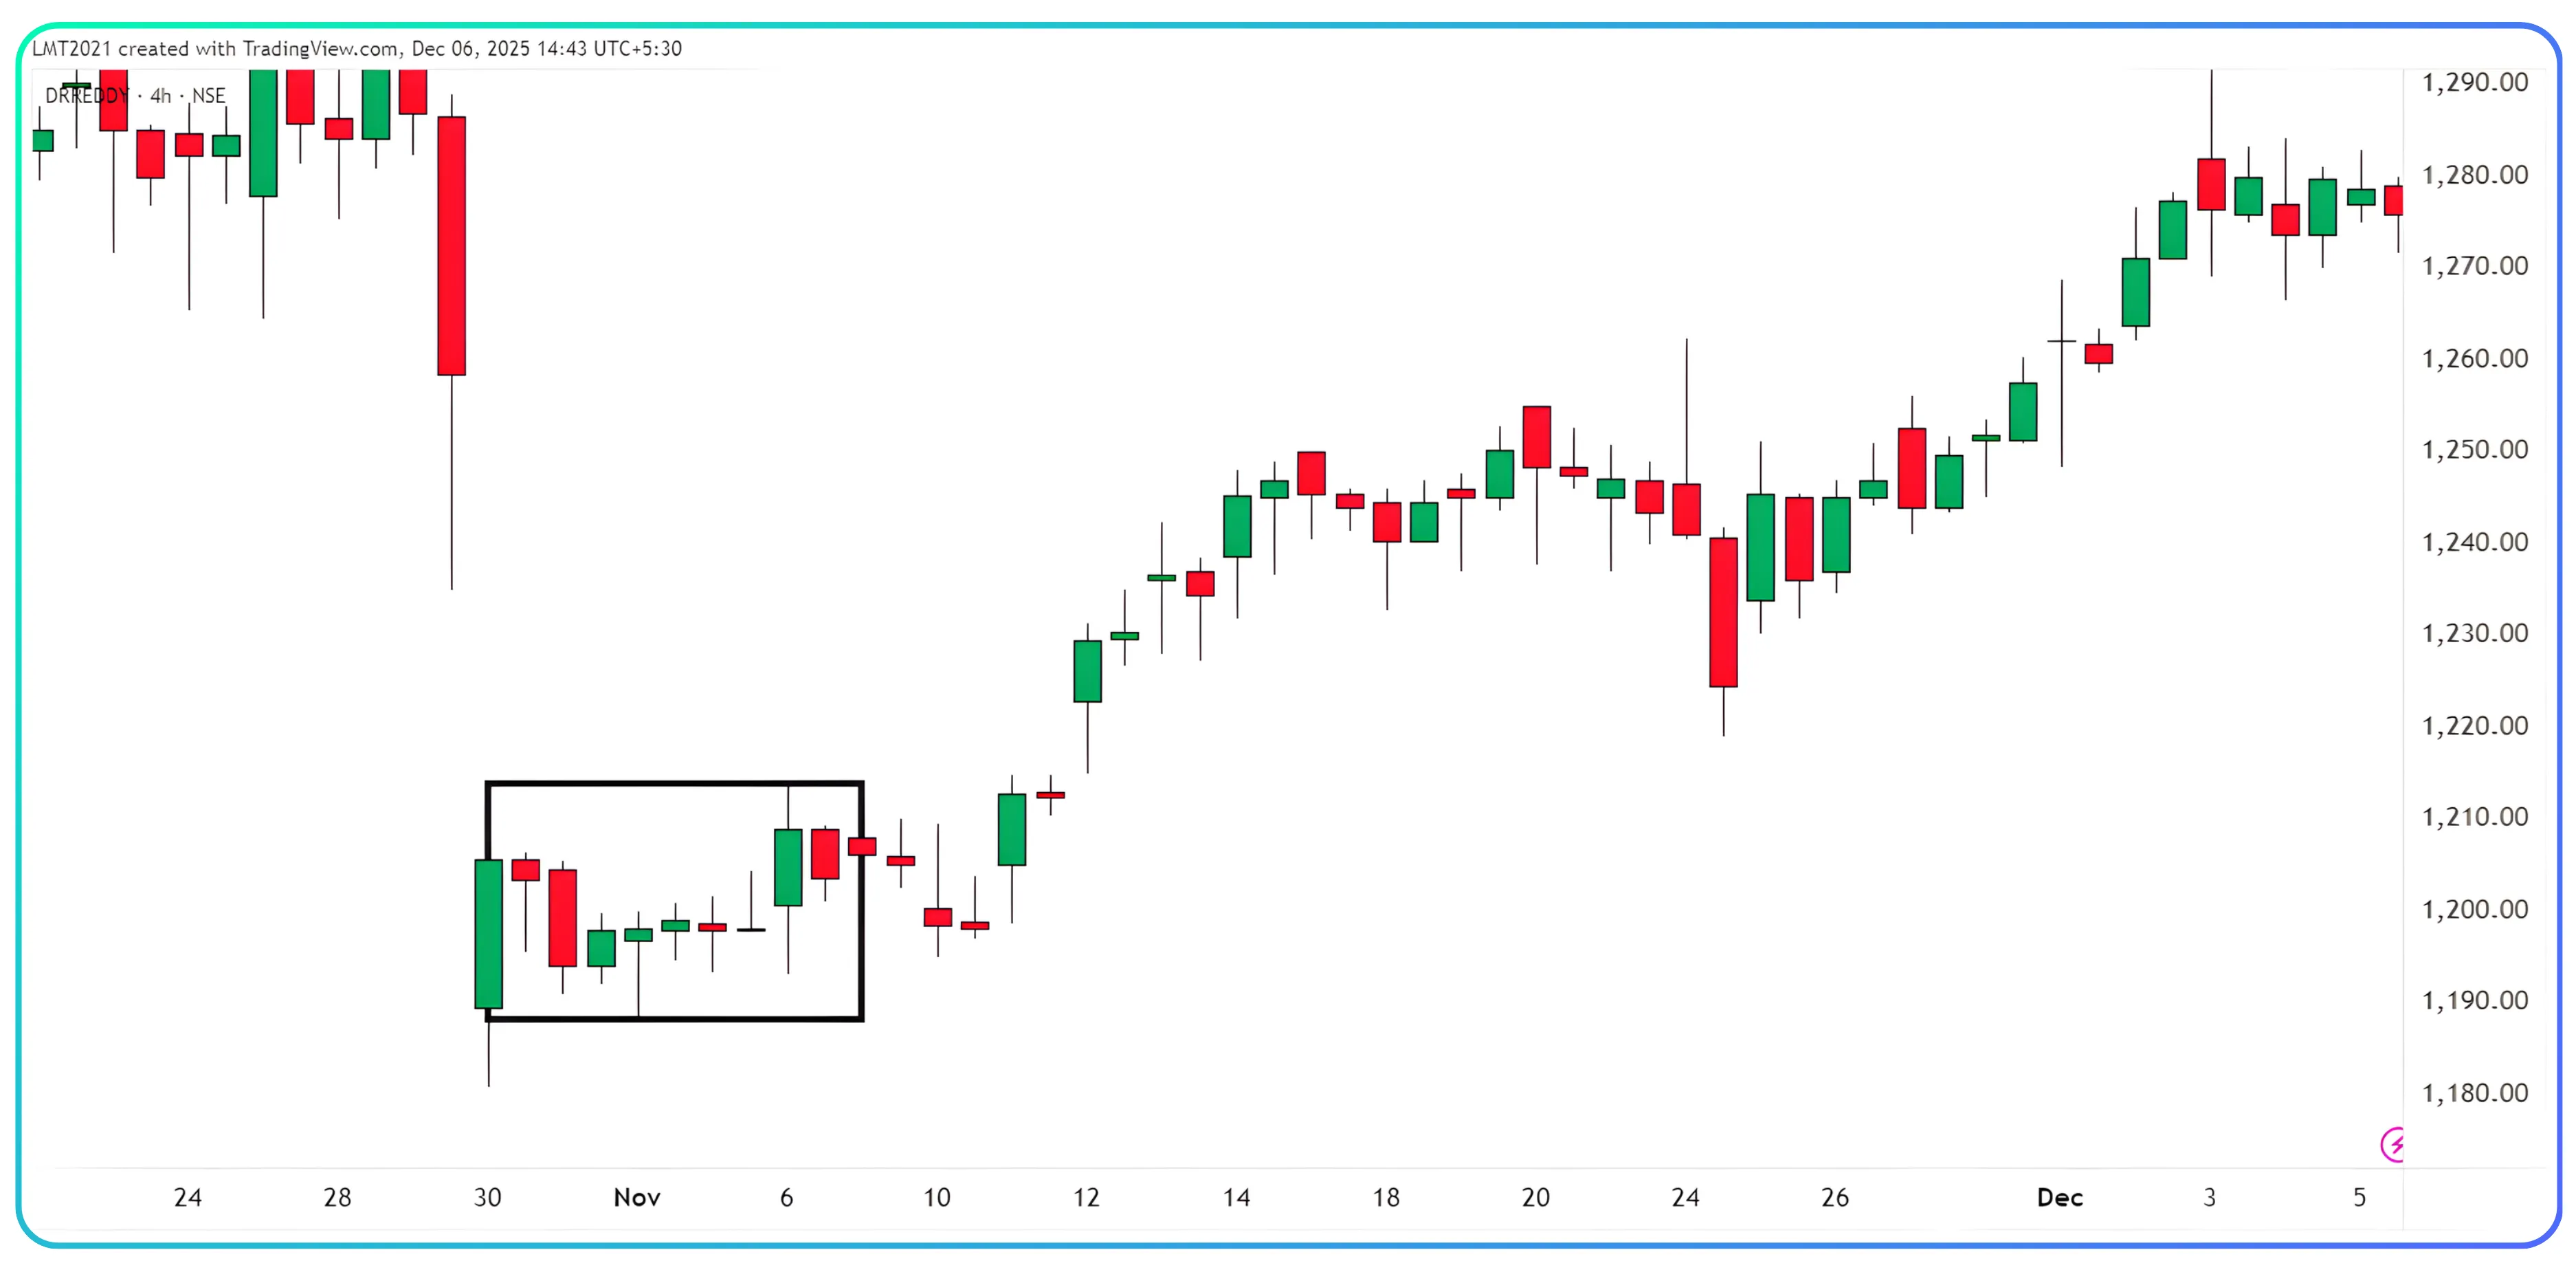
Example 1: Dr. Reddy
When Dr. Reddy traded near 1190, OI Spurts showed increasing call OI at the 1200 strike. The breakdown confirmed accumulation rather than call writing. This indicated confidence in a price rise, which later materialized when the stock reached 1230.
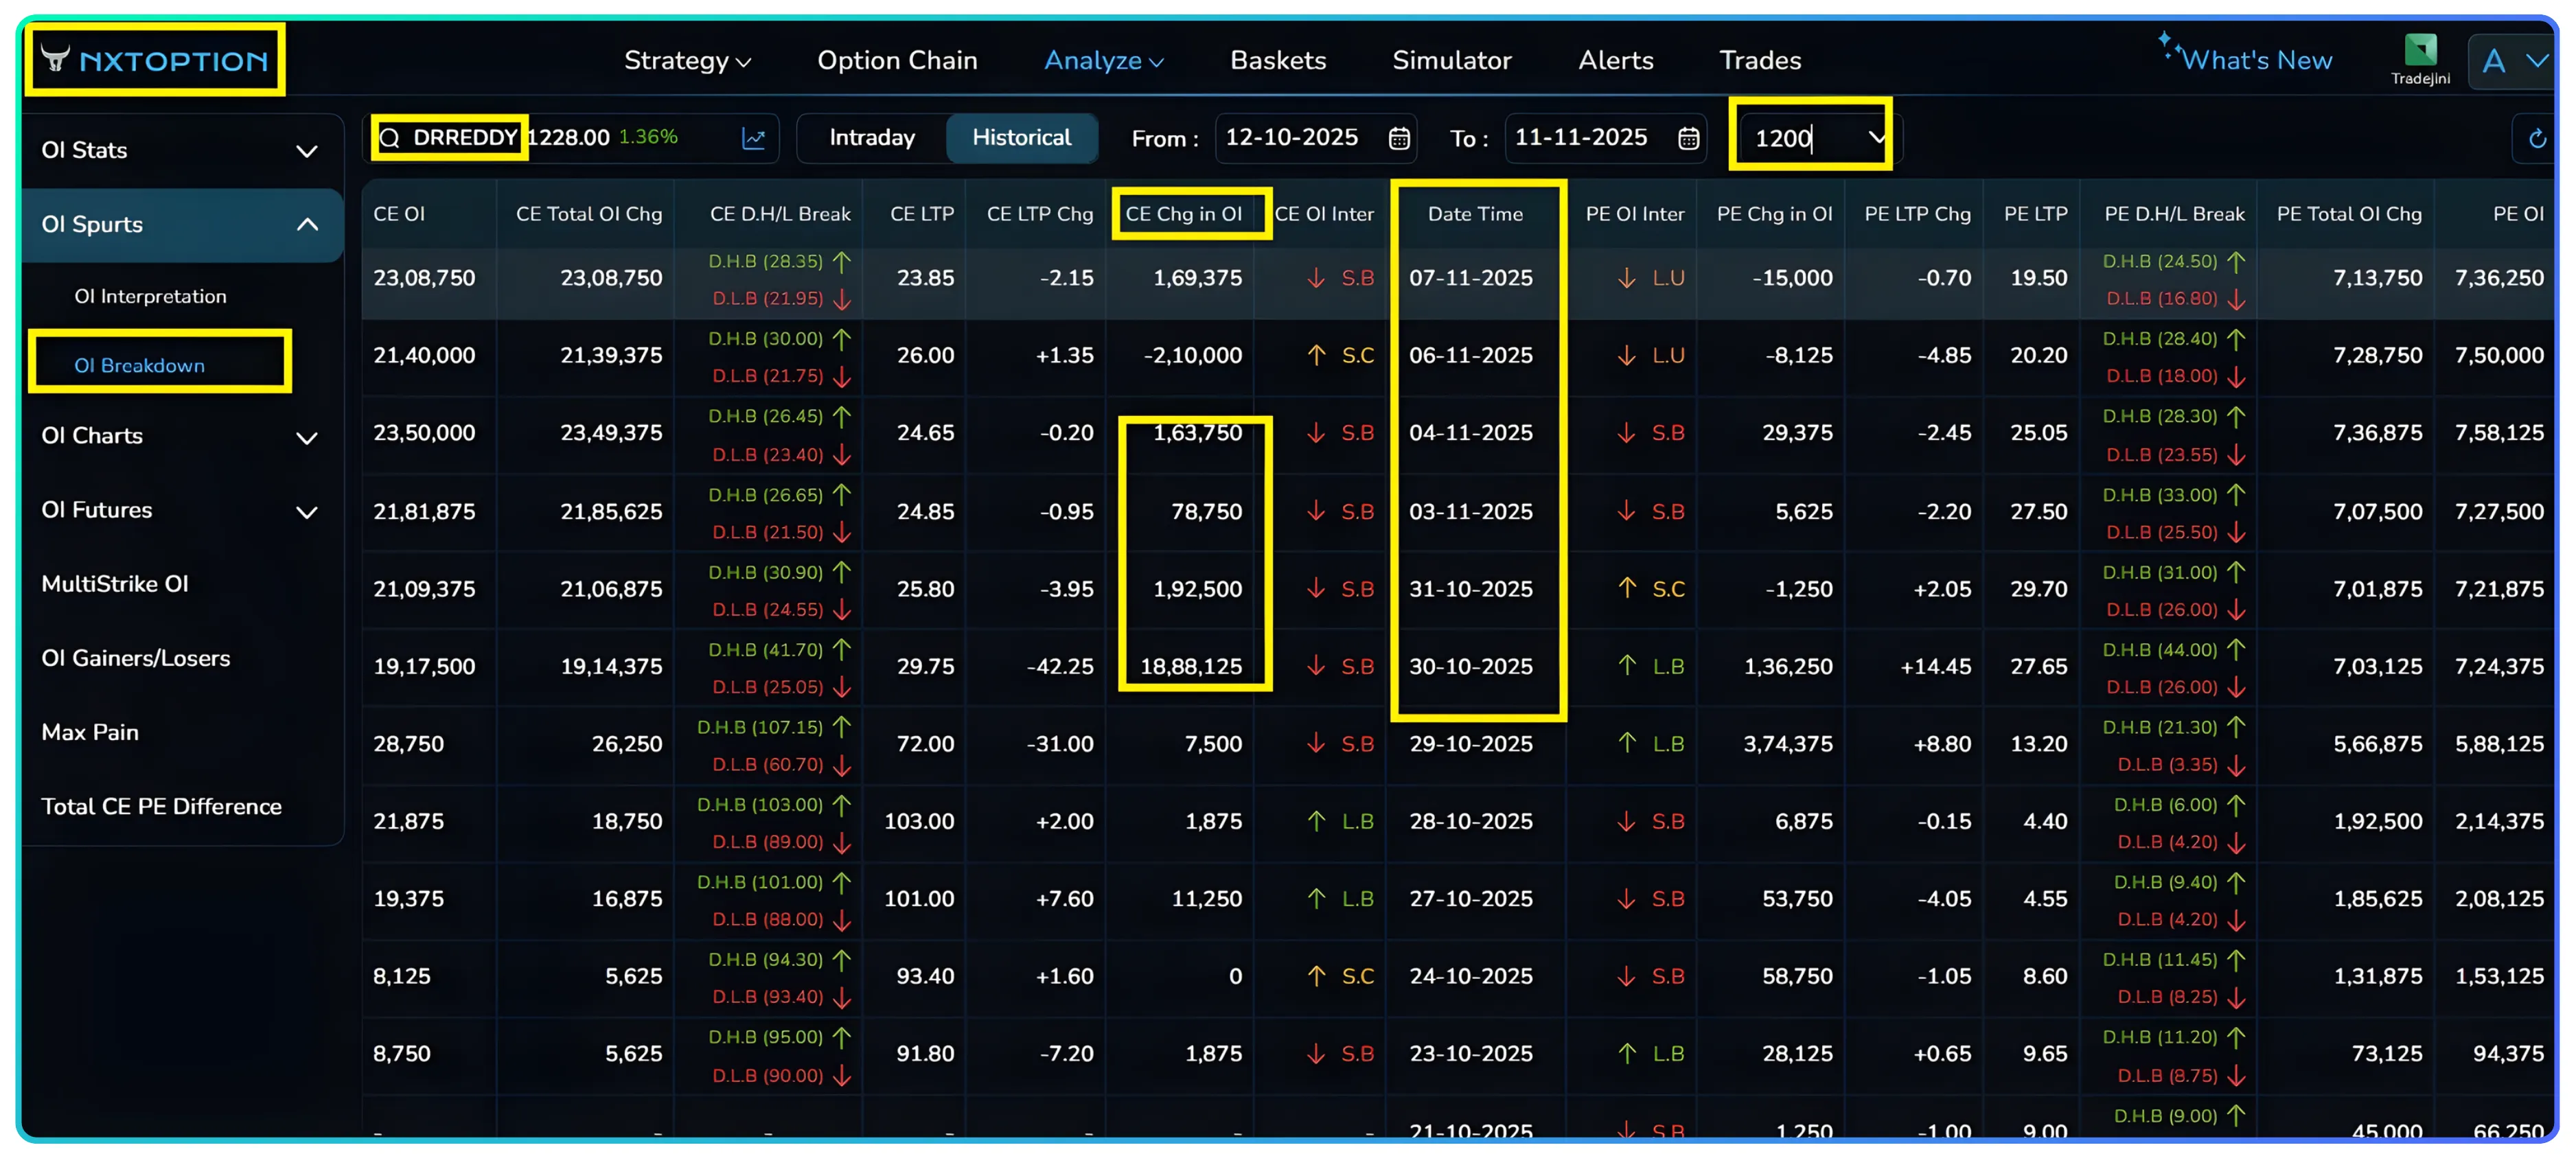
This shows how open interest increases can reveal direction before price confirms.
Example 2: PGEL
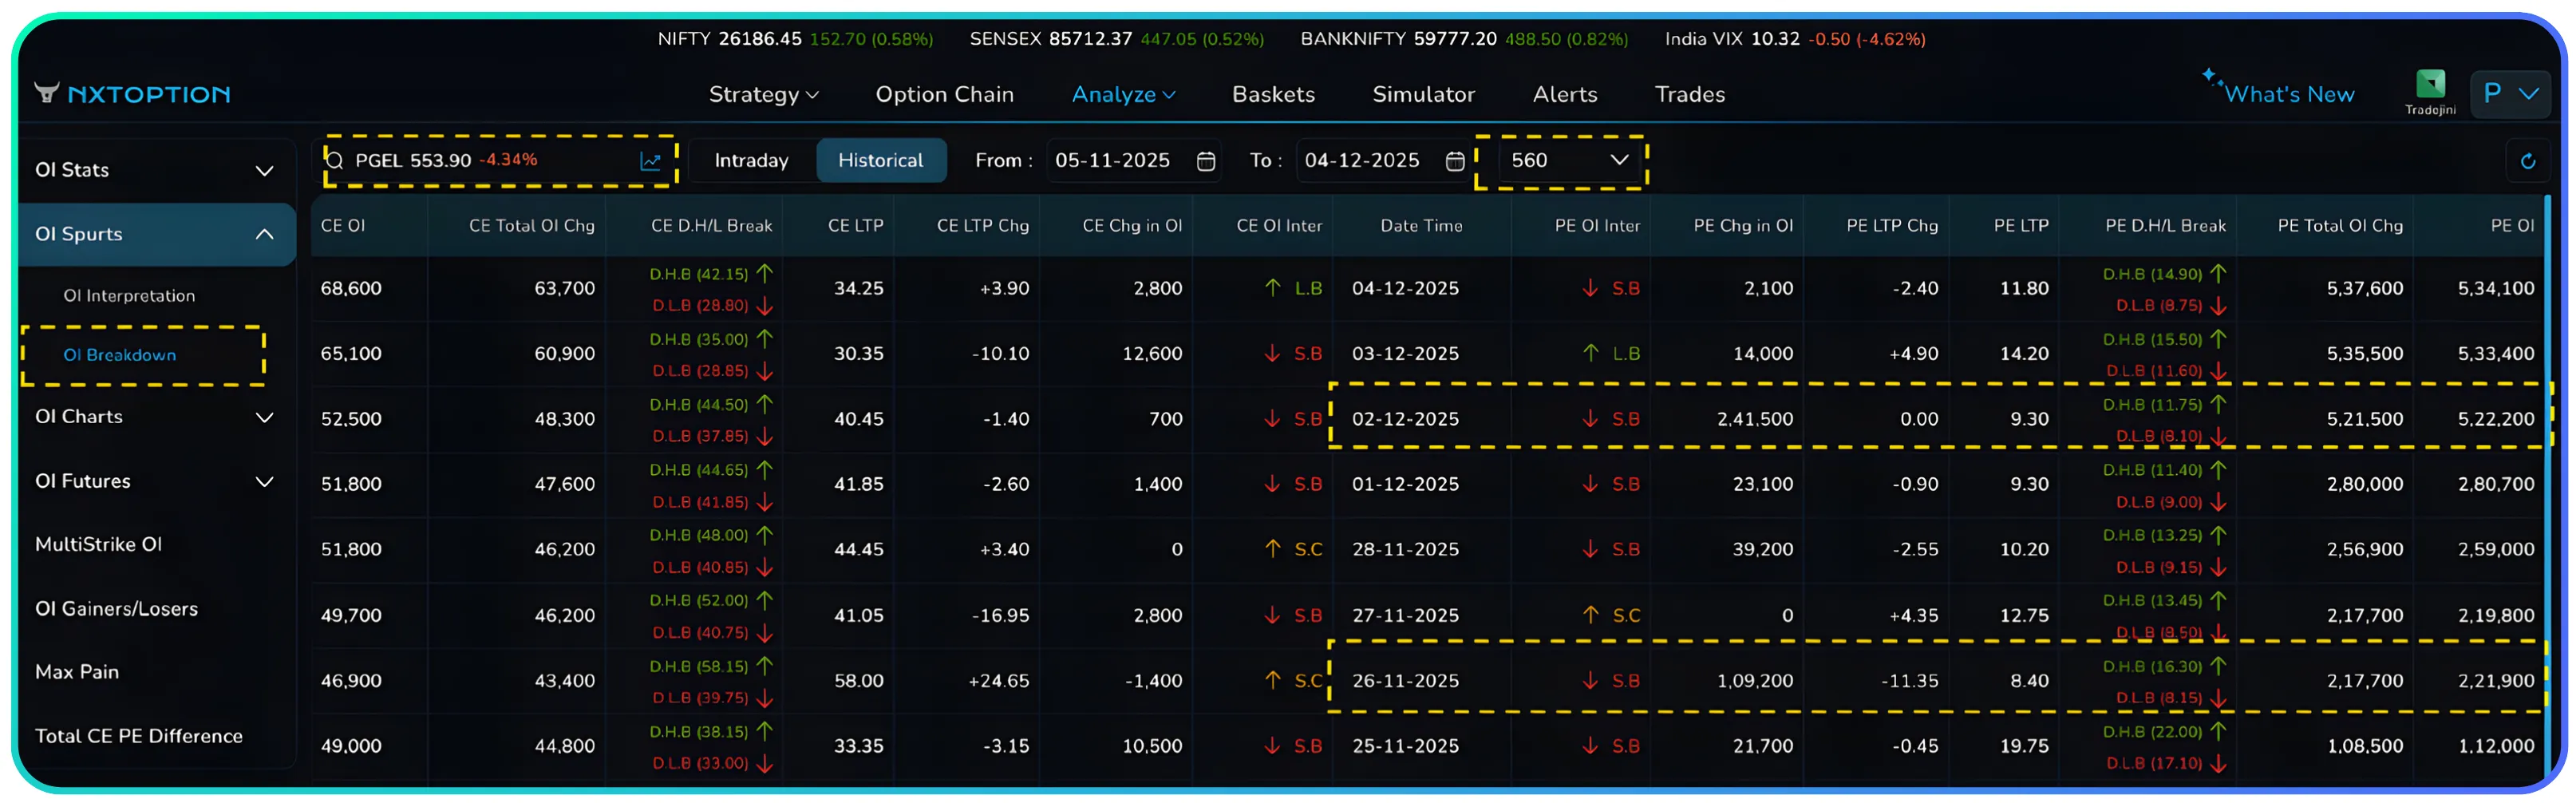
26 November: Early Bearish Sentiment
PE OI increased significantly. Put buyers absorbed liquidity. This signalled early market sentiment pointing to a downward trend. 02 December: Strong Confirmation PE OI surged again, but premiums stayed flat. This is typical when traders expect a sharp drop and are not buying options for theta
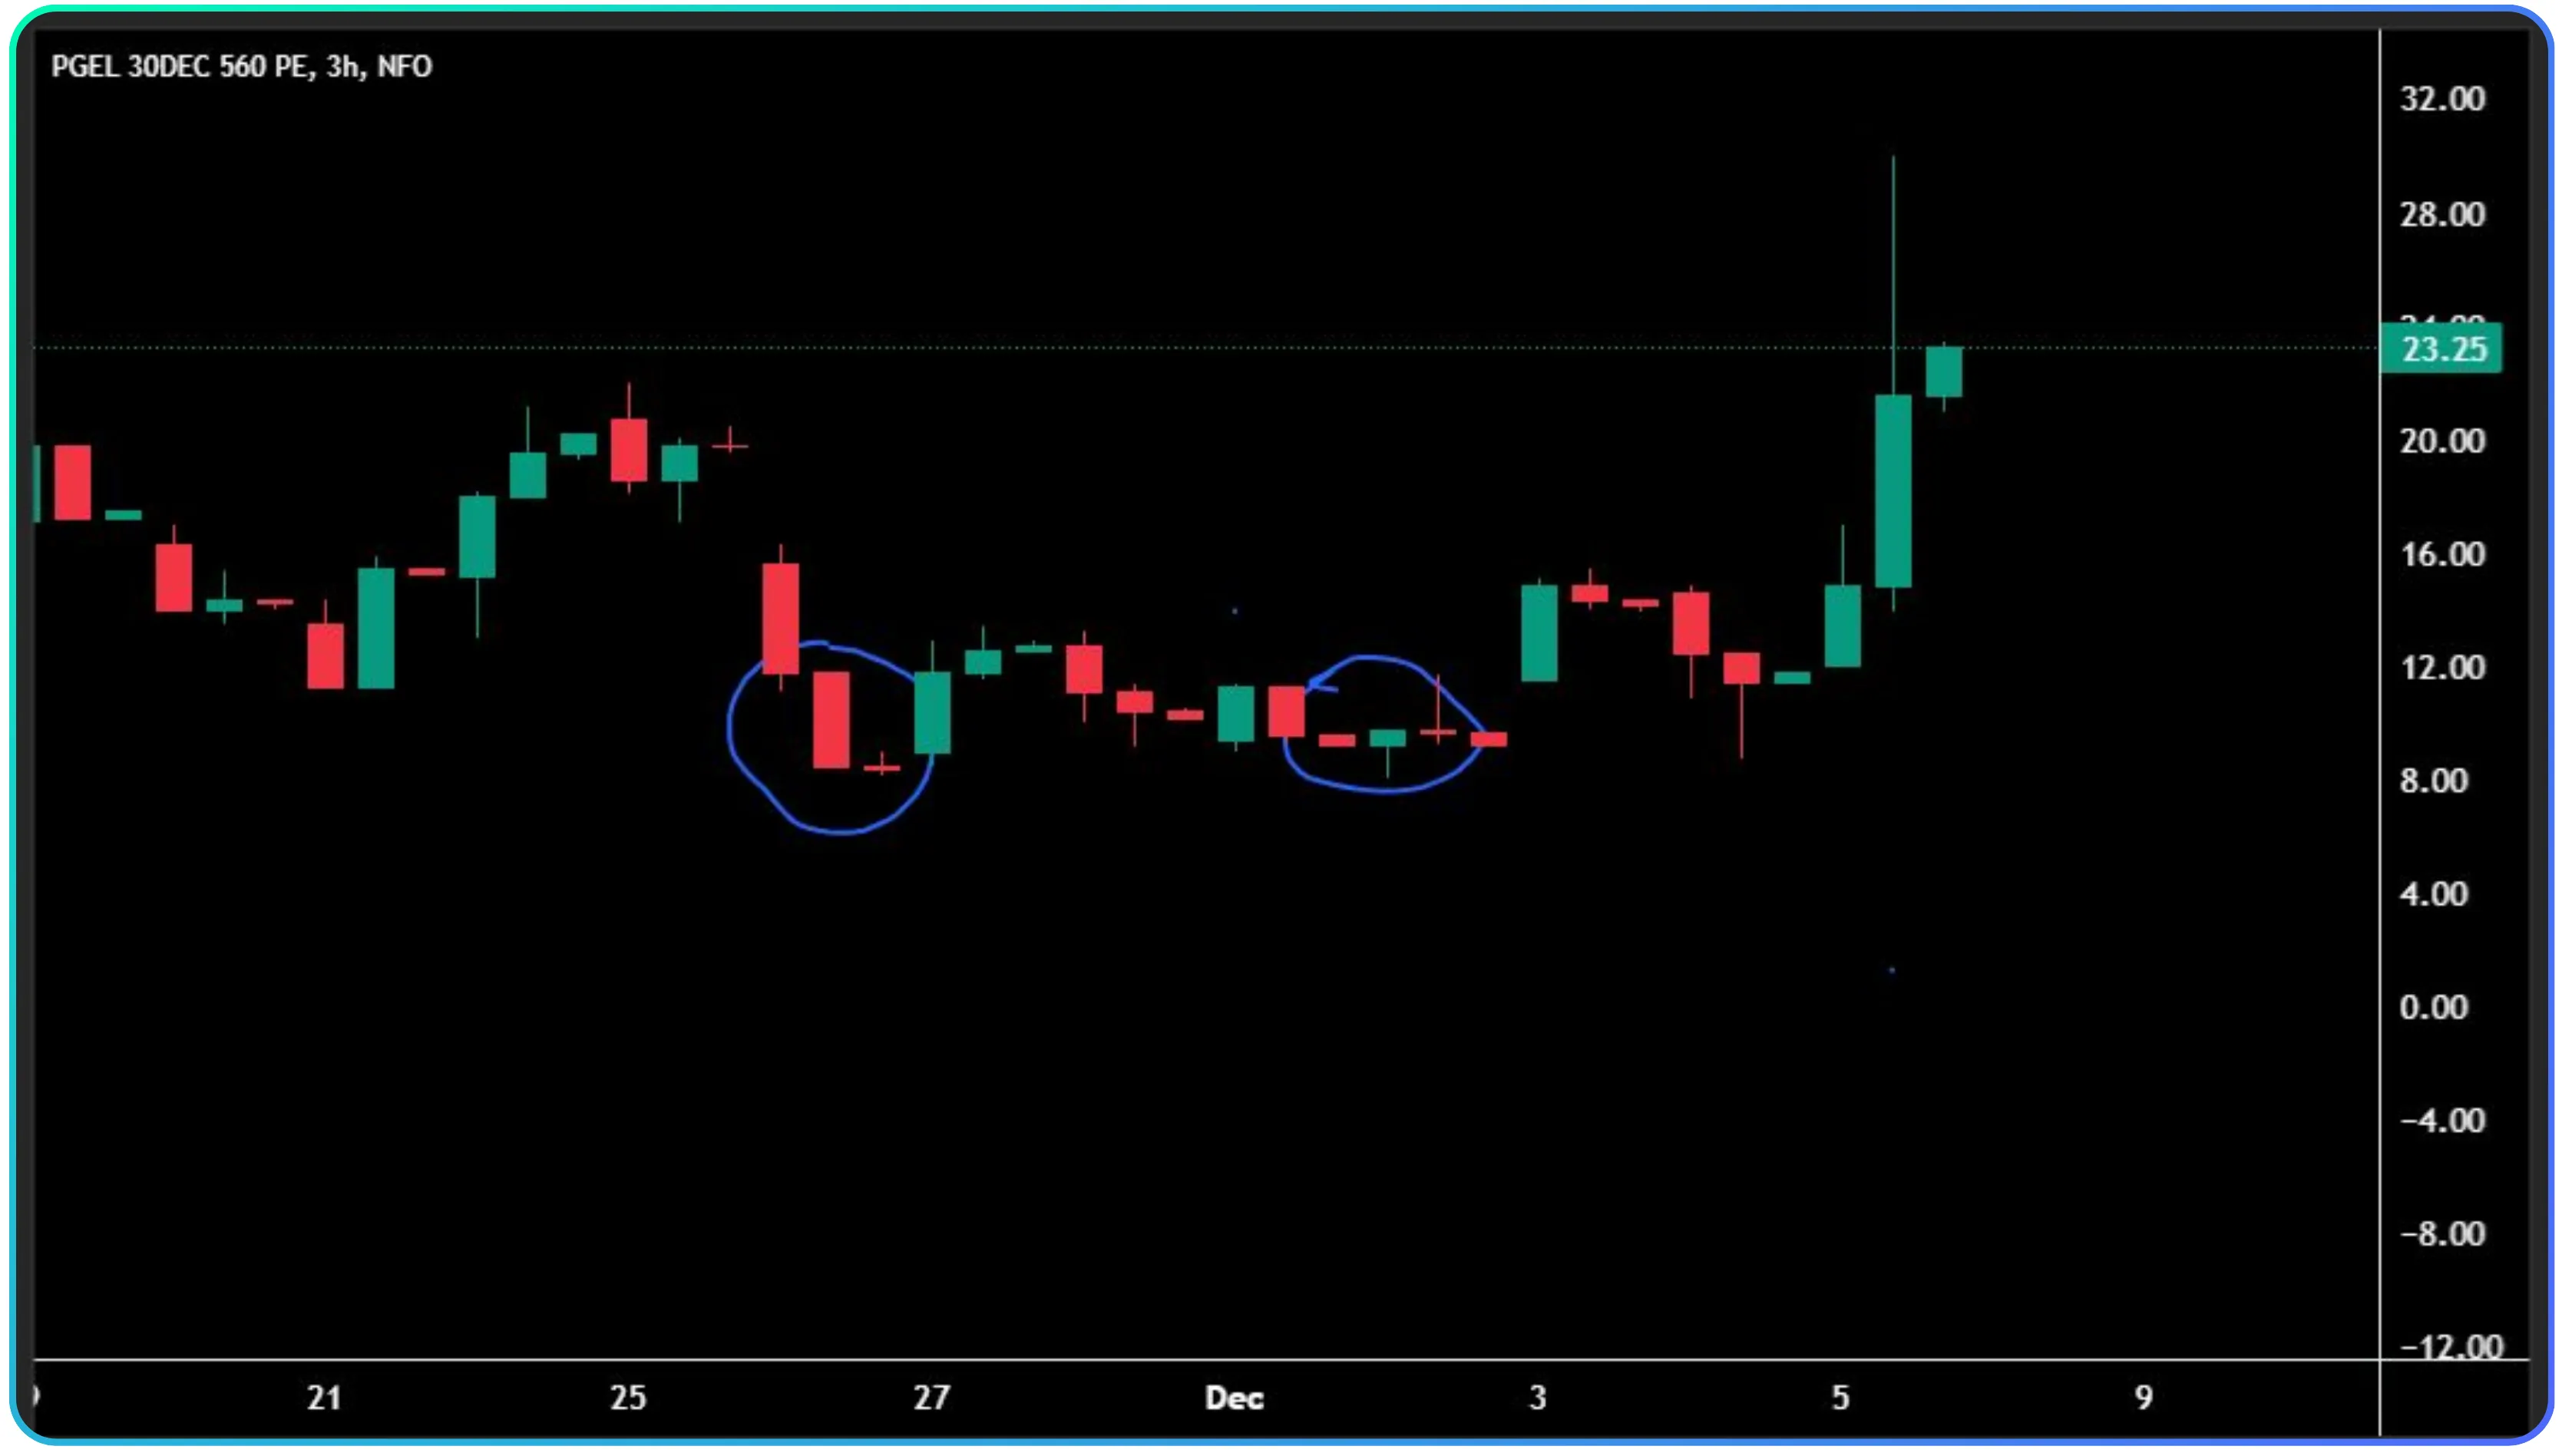
The stock later fell from 600 to 550, aligning perfectly with OI signals. This example shows how OI spurts act as an early warning tool long before the chart reveals weakness.
The Bottom Line
OI Spurts, OI Interpretation and OI Breakdown together help you see how positions are forming behind every price move. When you understand where traders are adding risk and where they are backing out, trend strength becomes clear. Instead of reacting to price, you start positioning early with conviction. It’s a practical edge that sharpens timing, improves entries, and protects you from traps.
Log in to NxtOption, open OI Spurts, and start reading the market with data-backed clarity
Disclaimer: The information provided in our blogs is for informational purposes only and should not be construed as financial, investment, or trading advice. Trading and investing in the securities market carries risk. Always conduct your own research and consult with a qualified financial advisor before making any investment decisions. Past performance is not indicative of future results. Copyrighted and original content for your trading and investing needs.
© 2025 — Tradejini. All Rights Reserved.