


If you trade in Futures & Options (F&O), you have probably heard the term ‘open interest’ (OI). It’s more than just a market statistic, it’s a valuable indicator of market sentiment, liquidity, and strength. Understanding OI can improve your trading decisions and help you gauge the overall mood of the market.
However, traders often confuse open interest with trading volume. These two metrics are different and provide different kinds of insights. Let’s break down what open interest means, how it differs from volume, and why it matters.
What is Open Interest?
In simple terms, open interest represents the total number of active contracts in the futures or options market at any given time. These are contracts that have been traded but not yet squared off (closed) or allowed to expire.
An Example
Imagine a cricket match between India and Australia at Wankhede Stadium. Each ticket sold represents a seat that is ‘open’ for the match. If one person buys a ticket and another person sells that same ticket to someone else, the total number of tickets for the match doesn’t change it’s just a transfer. But if the stadium sells new tickets, the total count of occupied seats increases.
In the stock market, think of each ticket as a contract.
- The stadium is the derivatives market.
- Buyers and sellers together form a contract (like a seat being occupied).
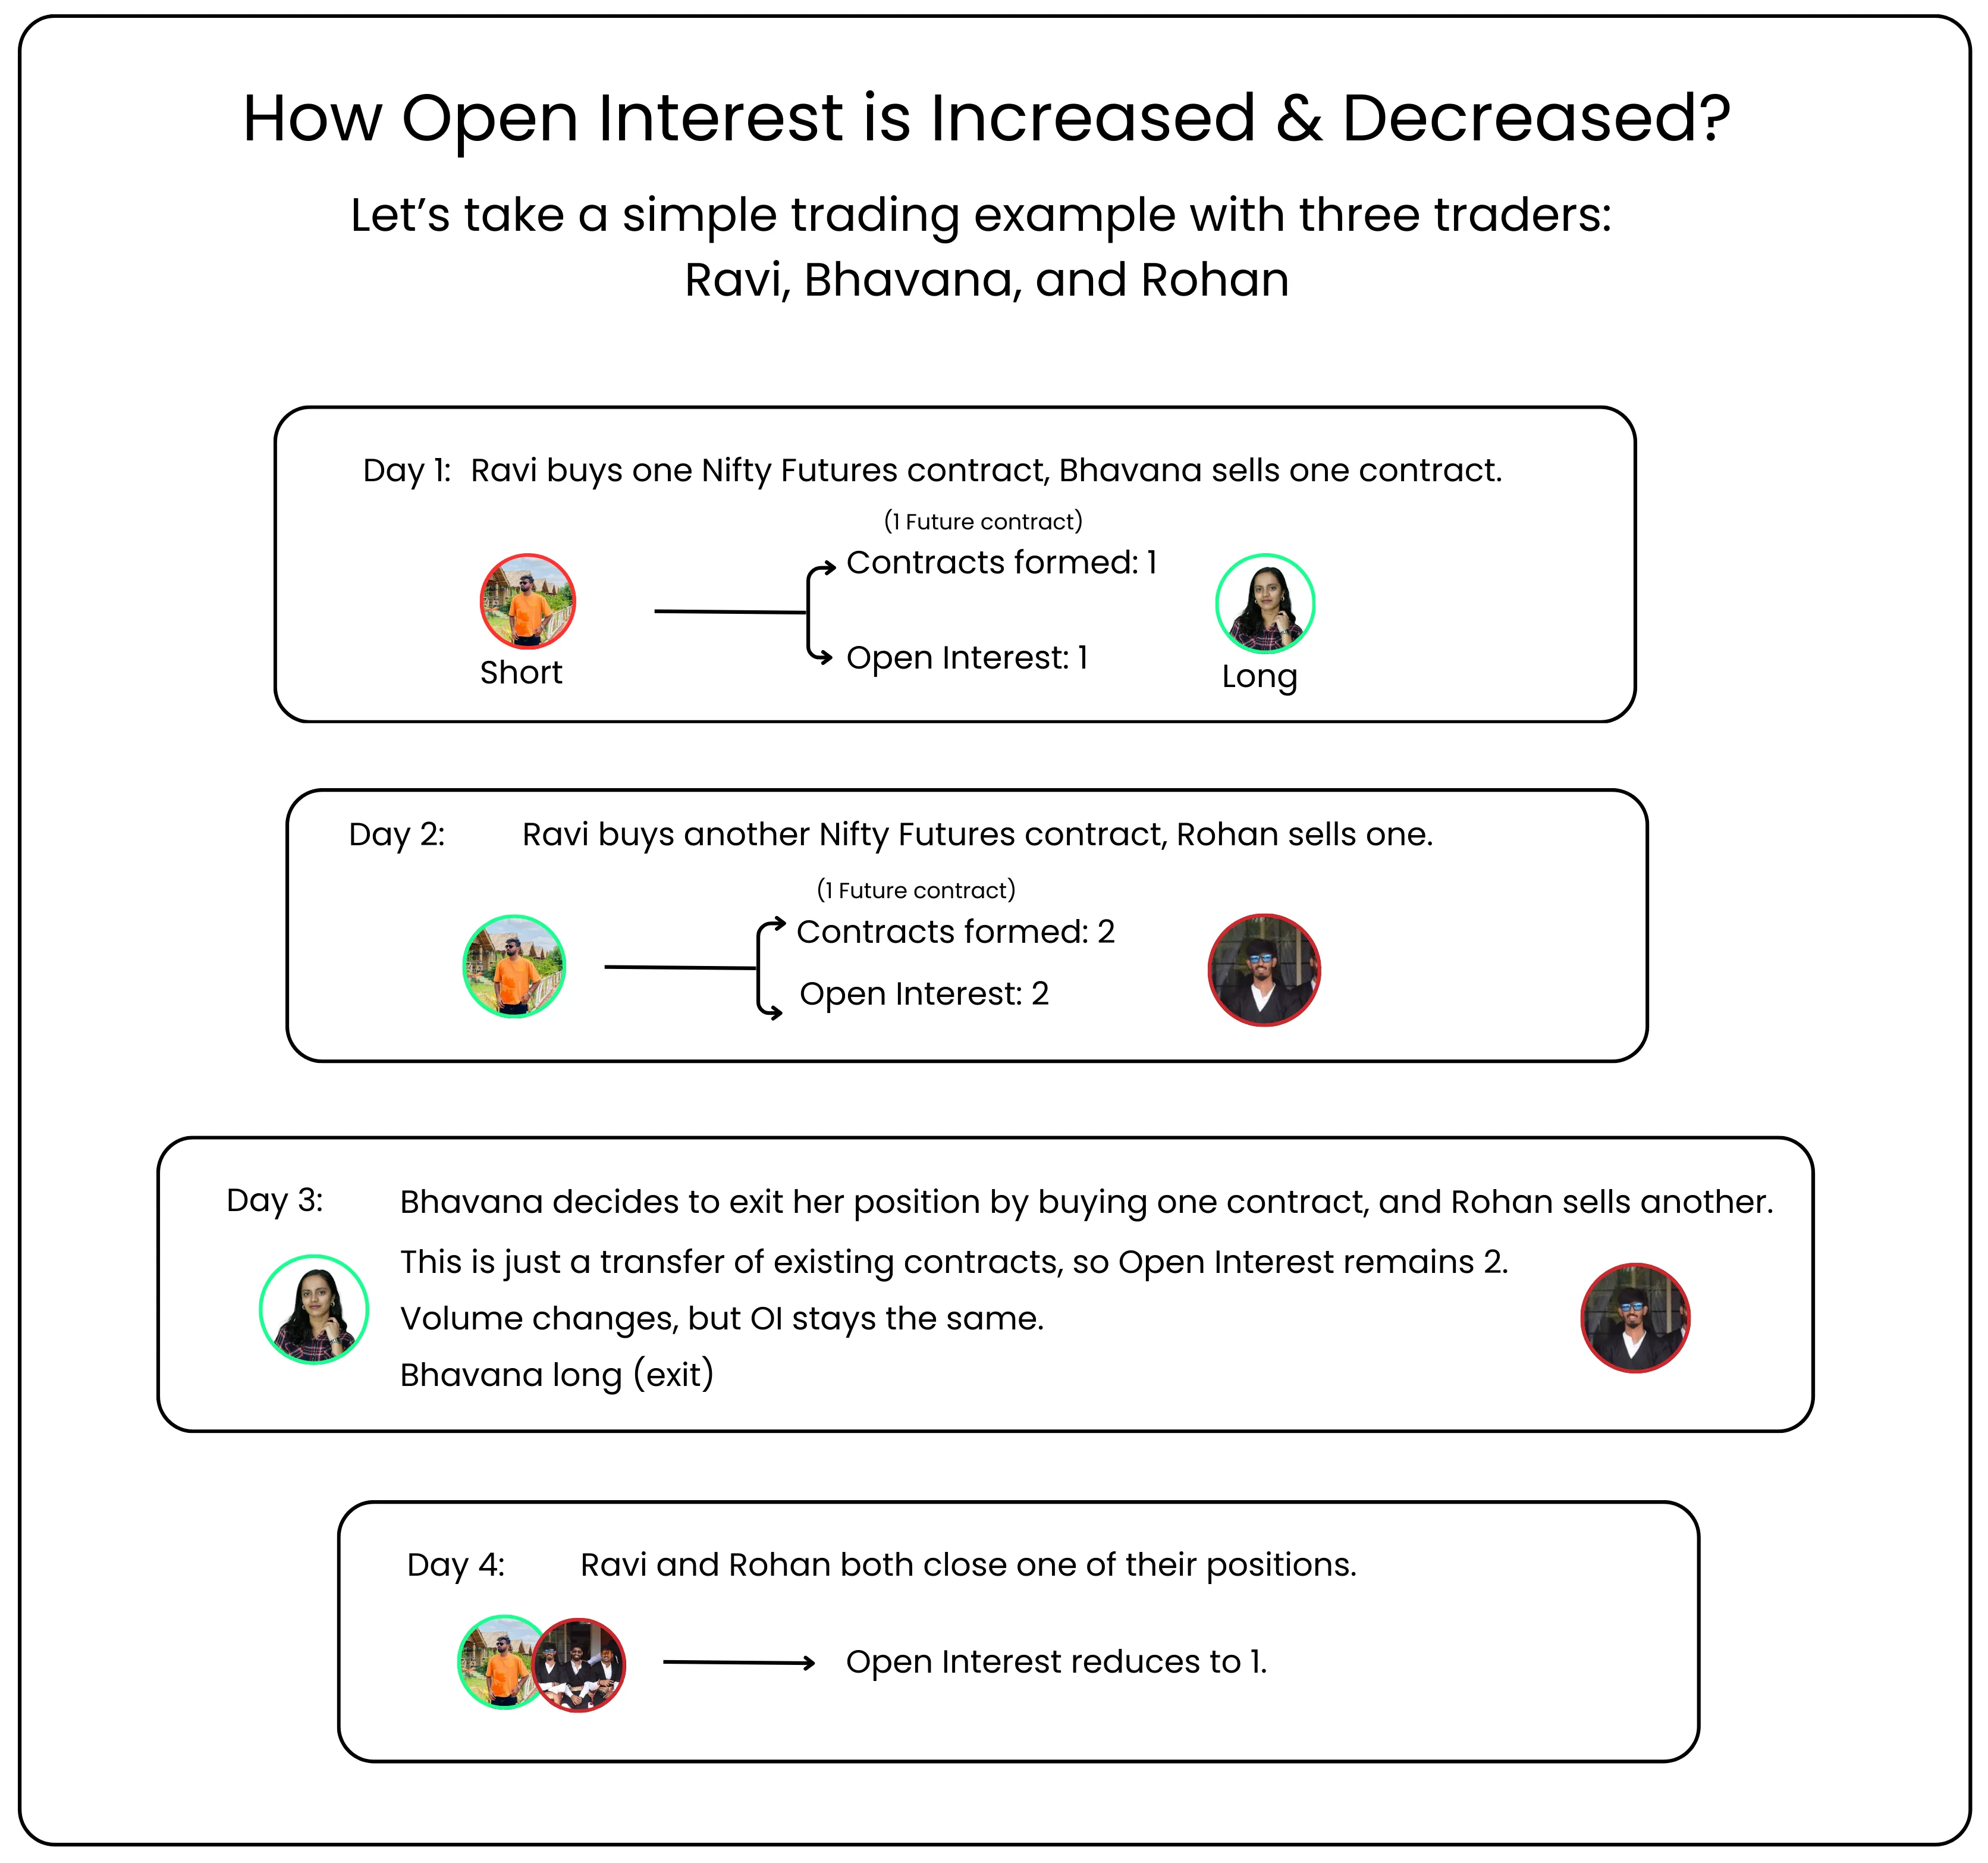
- When new buyers and sellers enter into fresh contracts, open interest goes up.
- When contracts are closed (positions are squared off), open interest falls.
- When the contract changes hands between traders without adding or removing contracts, open interest remains the same only the trading volume changes.
Also Read: Learn to Draw Accurate Trendlines in Charts
Why Does Open Interest Matter?
Open interest helps traders understand market participation and sentiment:
Rising OI + Rising Price → Indicates fresh buying and a bullish outlook.
Rising OI + Falling Price → Suggests fresh short positions and bearish sentiment.
Falling OI → Indicates positions being closed, often signalling a trend reversal or profit booking.
Which means,
High OI = High participation and liquidity.
Low OI = Low participation and weaker trends.
Open Interest vs Volume
While both OI and volume change daily, they track different things:
| Metric | Meaning | What it Shows |
|---|---|---|
| Open Interest | Number of active contracts | Ongoing market participation |
| Volume | Number of contracts traded in a day | Trading activity for the day |
Key differences:
New contracts increase both OI and volume.
Contract transfers increase volume but leave OI unchanged.
Closing positions reduces OI.
Where to Track OI
You can check open interest data on Tradejini’s CubePlus. Look for: Current OI, Change in OI, and % Change in OI.
These numbers, when studied alongside price movement, can help you identify bullish or bearish setups.
The Bottom Line
Open interest is one of the most important indicators in the derivatives segment. It shows how many contracts are still active, helping traders track market sentiment, speculation, and the strength of a trend. A sudden rise or fall in OI can reveal whether positions are being created for fresh leverage, unwound for hedging, or simply closed as profit booking. However, OI should never be analysed in isolation. The real insight comes when you combine it with price action and trading volume, which gives a clearer picture of market liquidity and potential direction.
Disclaimer: The information provided in our blogs is for informational purposes only and should not be construed as financial, investment, or trading advice. Trading and investing in the securities market carries risk. Always conduct your own research and consult with a qualified financial advisor before making any investment decisions. Past performance is not indicative of future results. Copyrighted and original content for your trading and investing needs.
© 2025 — Tradejini. All Rights Reserved.