


Pivot points are one of the most fundamental technical analysis tools for traders looking to identify key price levels throughout the trading day. In CubePlus, the mobile trading app by Tradejini, the Pivot Points feature makes it effortless to access three distinct calculation methodologies Standard, Fibonacci, and Camarilla all from a single interface. Rather than manually calculating these values or switching between multiple tools, traders can view all pivot levels instantly on any stock or instrument they're analyzing.
Pivot points rank among the most widely used intraday trading tools in India, and active traders routinely apply them to benchmark indices like Nifty and Bank Nifty to map potential support and resistance zones before the opening bell.
This blog walks through how to access Pivot Points in CubePlus, what each calculation method reveals, and how to incorporate them into your daily trading strategy.
Accessing Pivot Points in CubePlus
The first step is navigating to the stock you want to analyze. In CubePlus, you begin by searching for the instrument. Once you have entered the stock name in the search bar, CubePlus displays a list of matching instruments across different exchanges and security types.
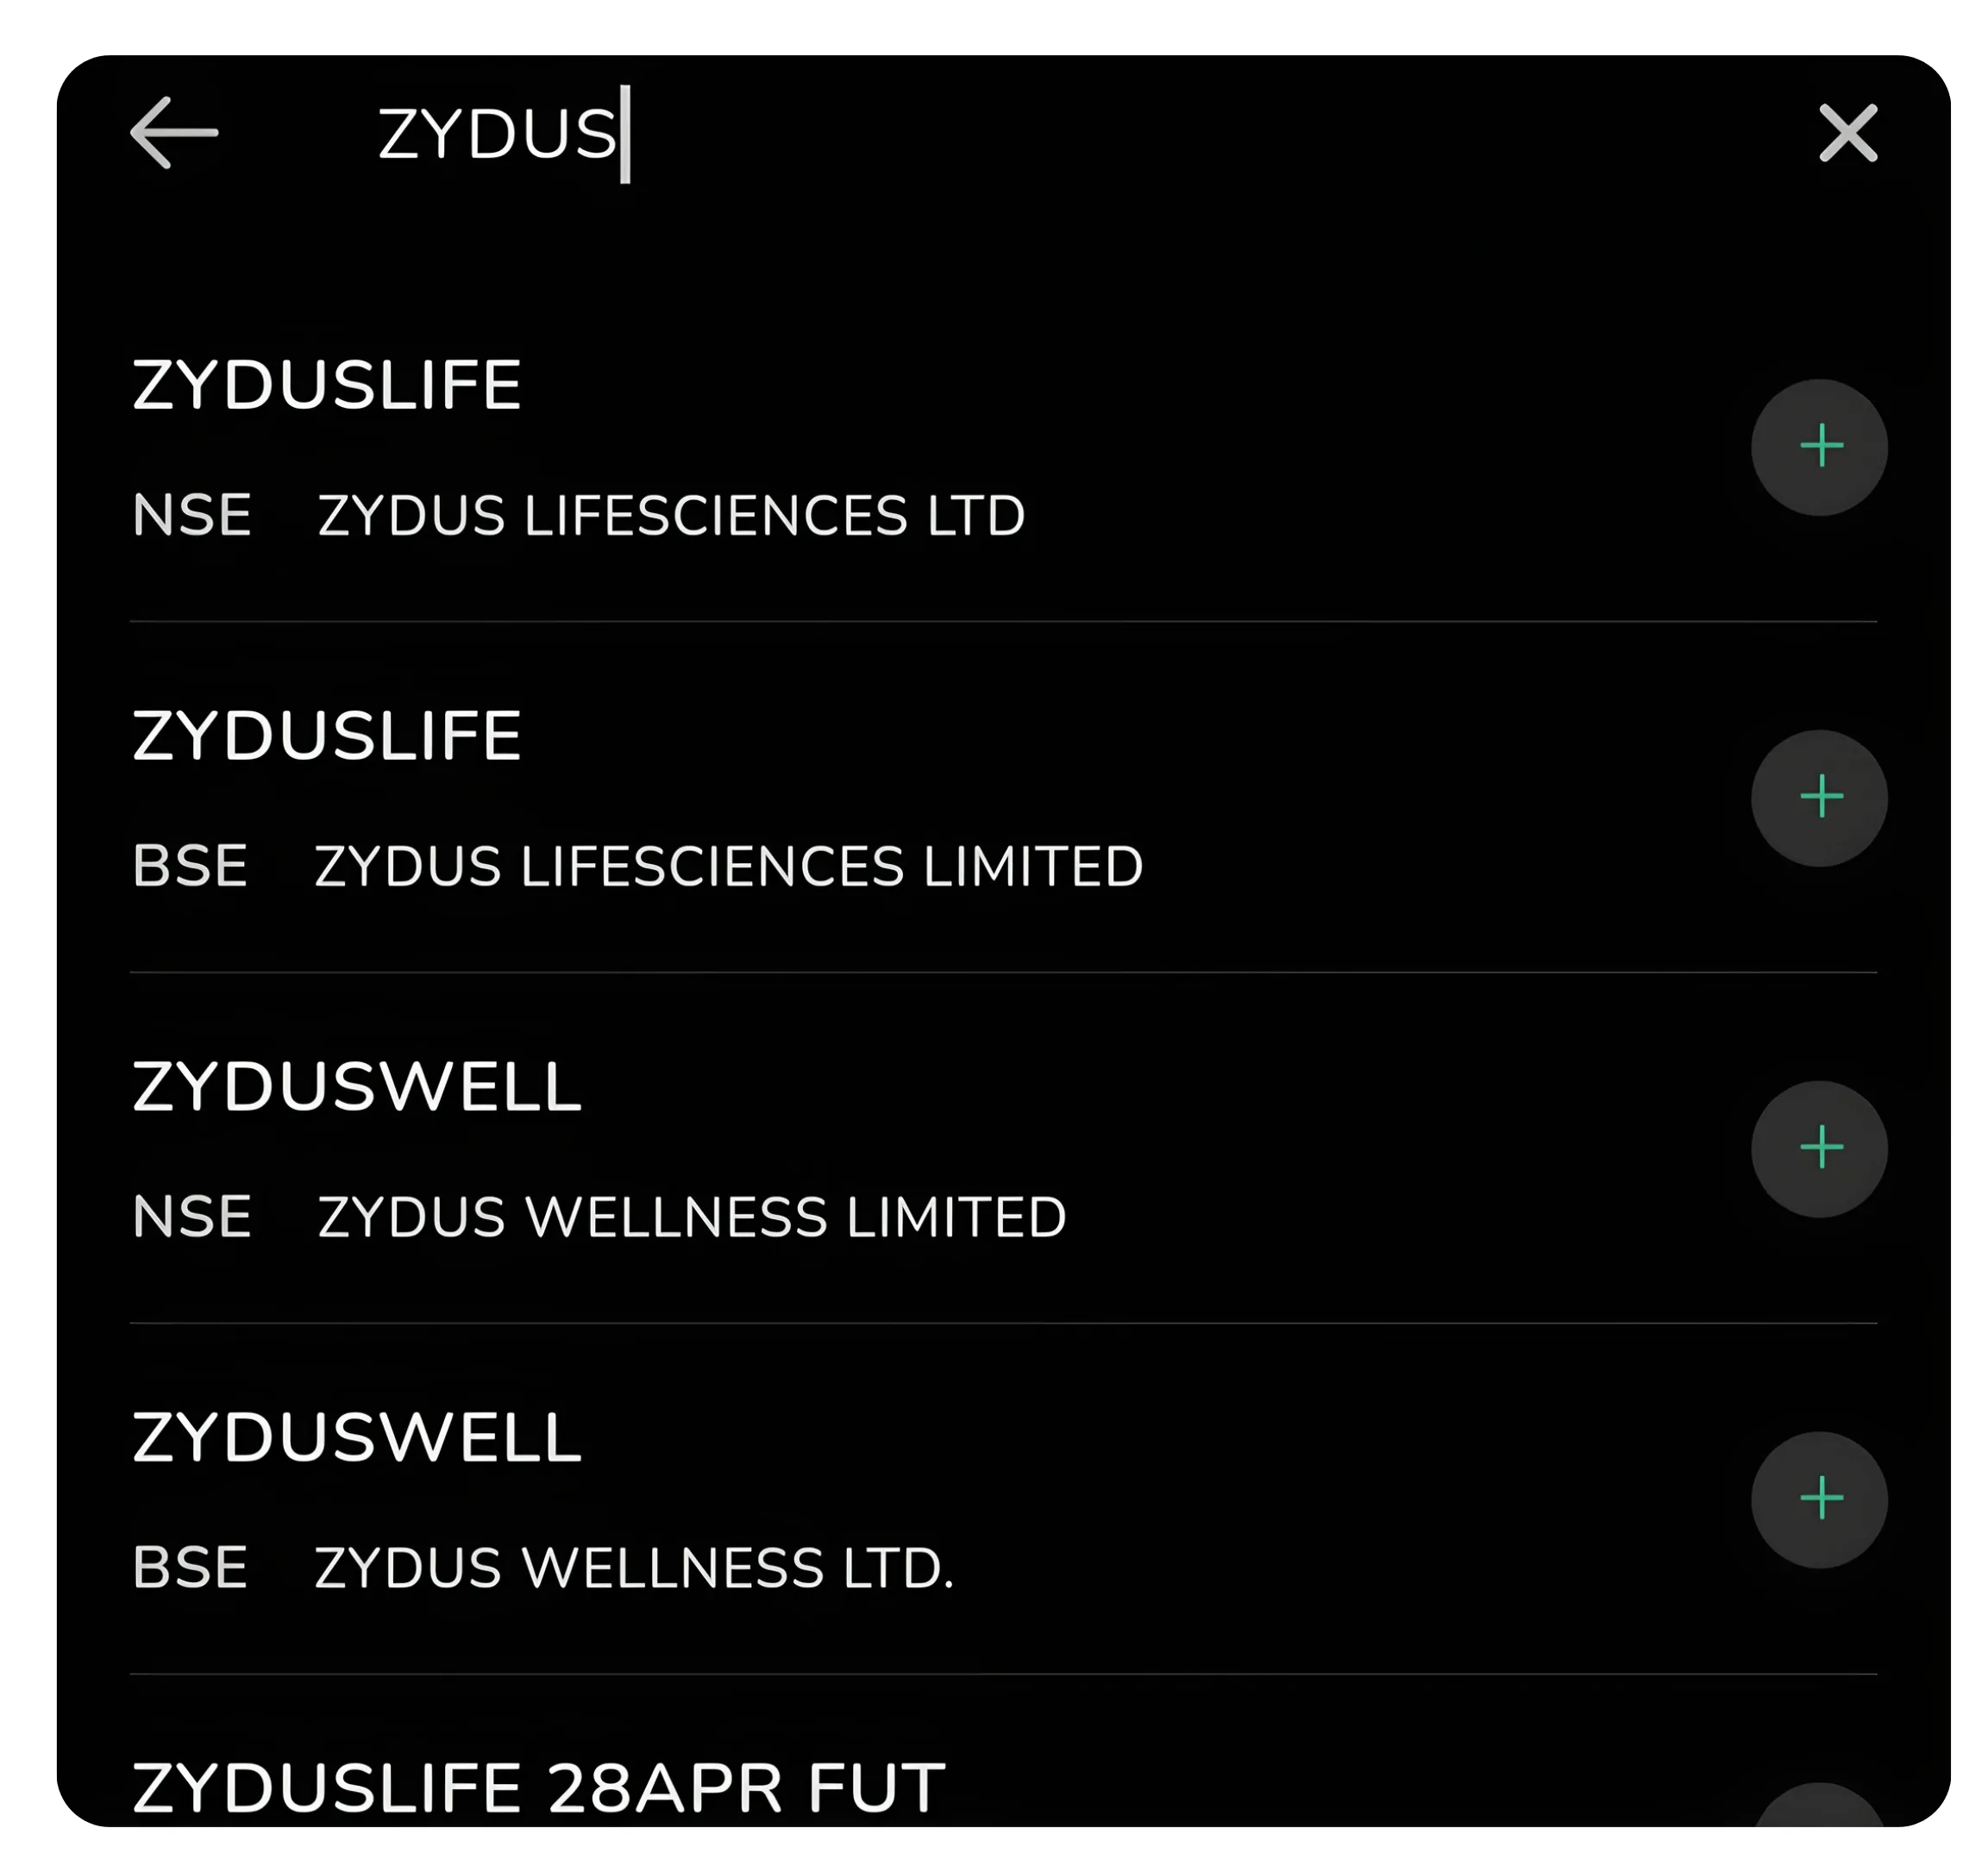
Step 1: Search for your stock in CubePlus. You'll see results across NSE, BSE, and derivatives markets.
For pivot point analysis, you'll typically select the primary equity listing. Clicking on your chosen stock takes you to the Overview page. This is the main dashboard for that instrument and shows current price, percentage change, bid-ask spread, order book depth, and key technical metrics like volume and ATP (Average Trade Price).
Navigating to the Pivot Points Tab
On the Overview page, you'll notice several tabs running horizontally across the screen. These tabs typically include Overview, Futures, Option Chain, and Pivot Points. Simply tap on the Pivot Points tab to switch to the pivot analysis view.
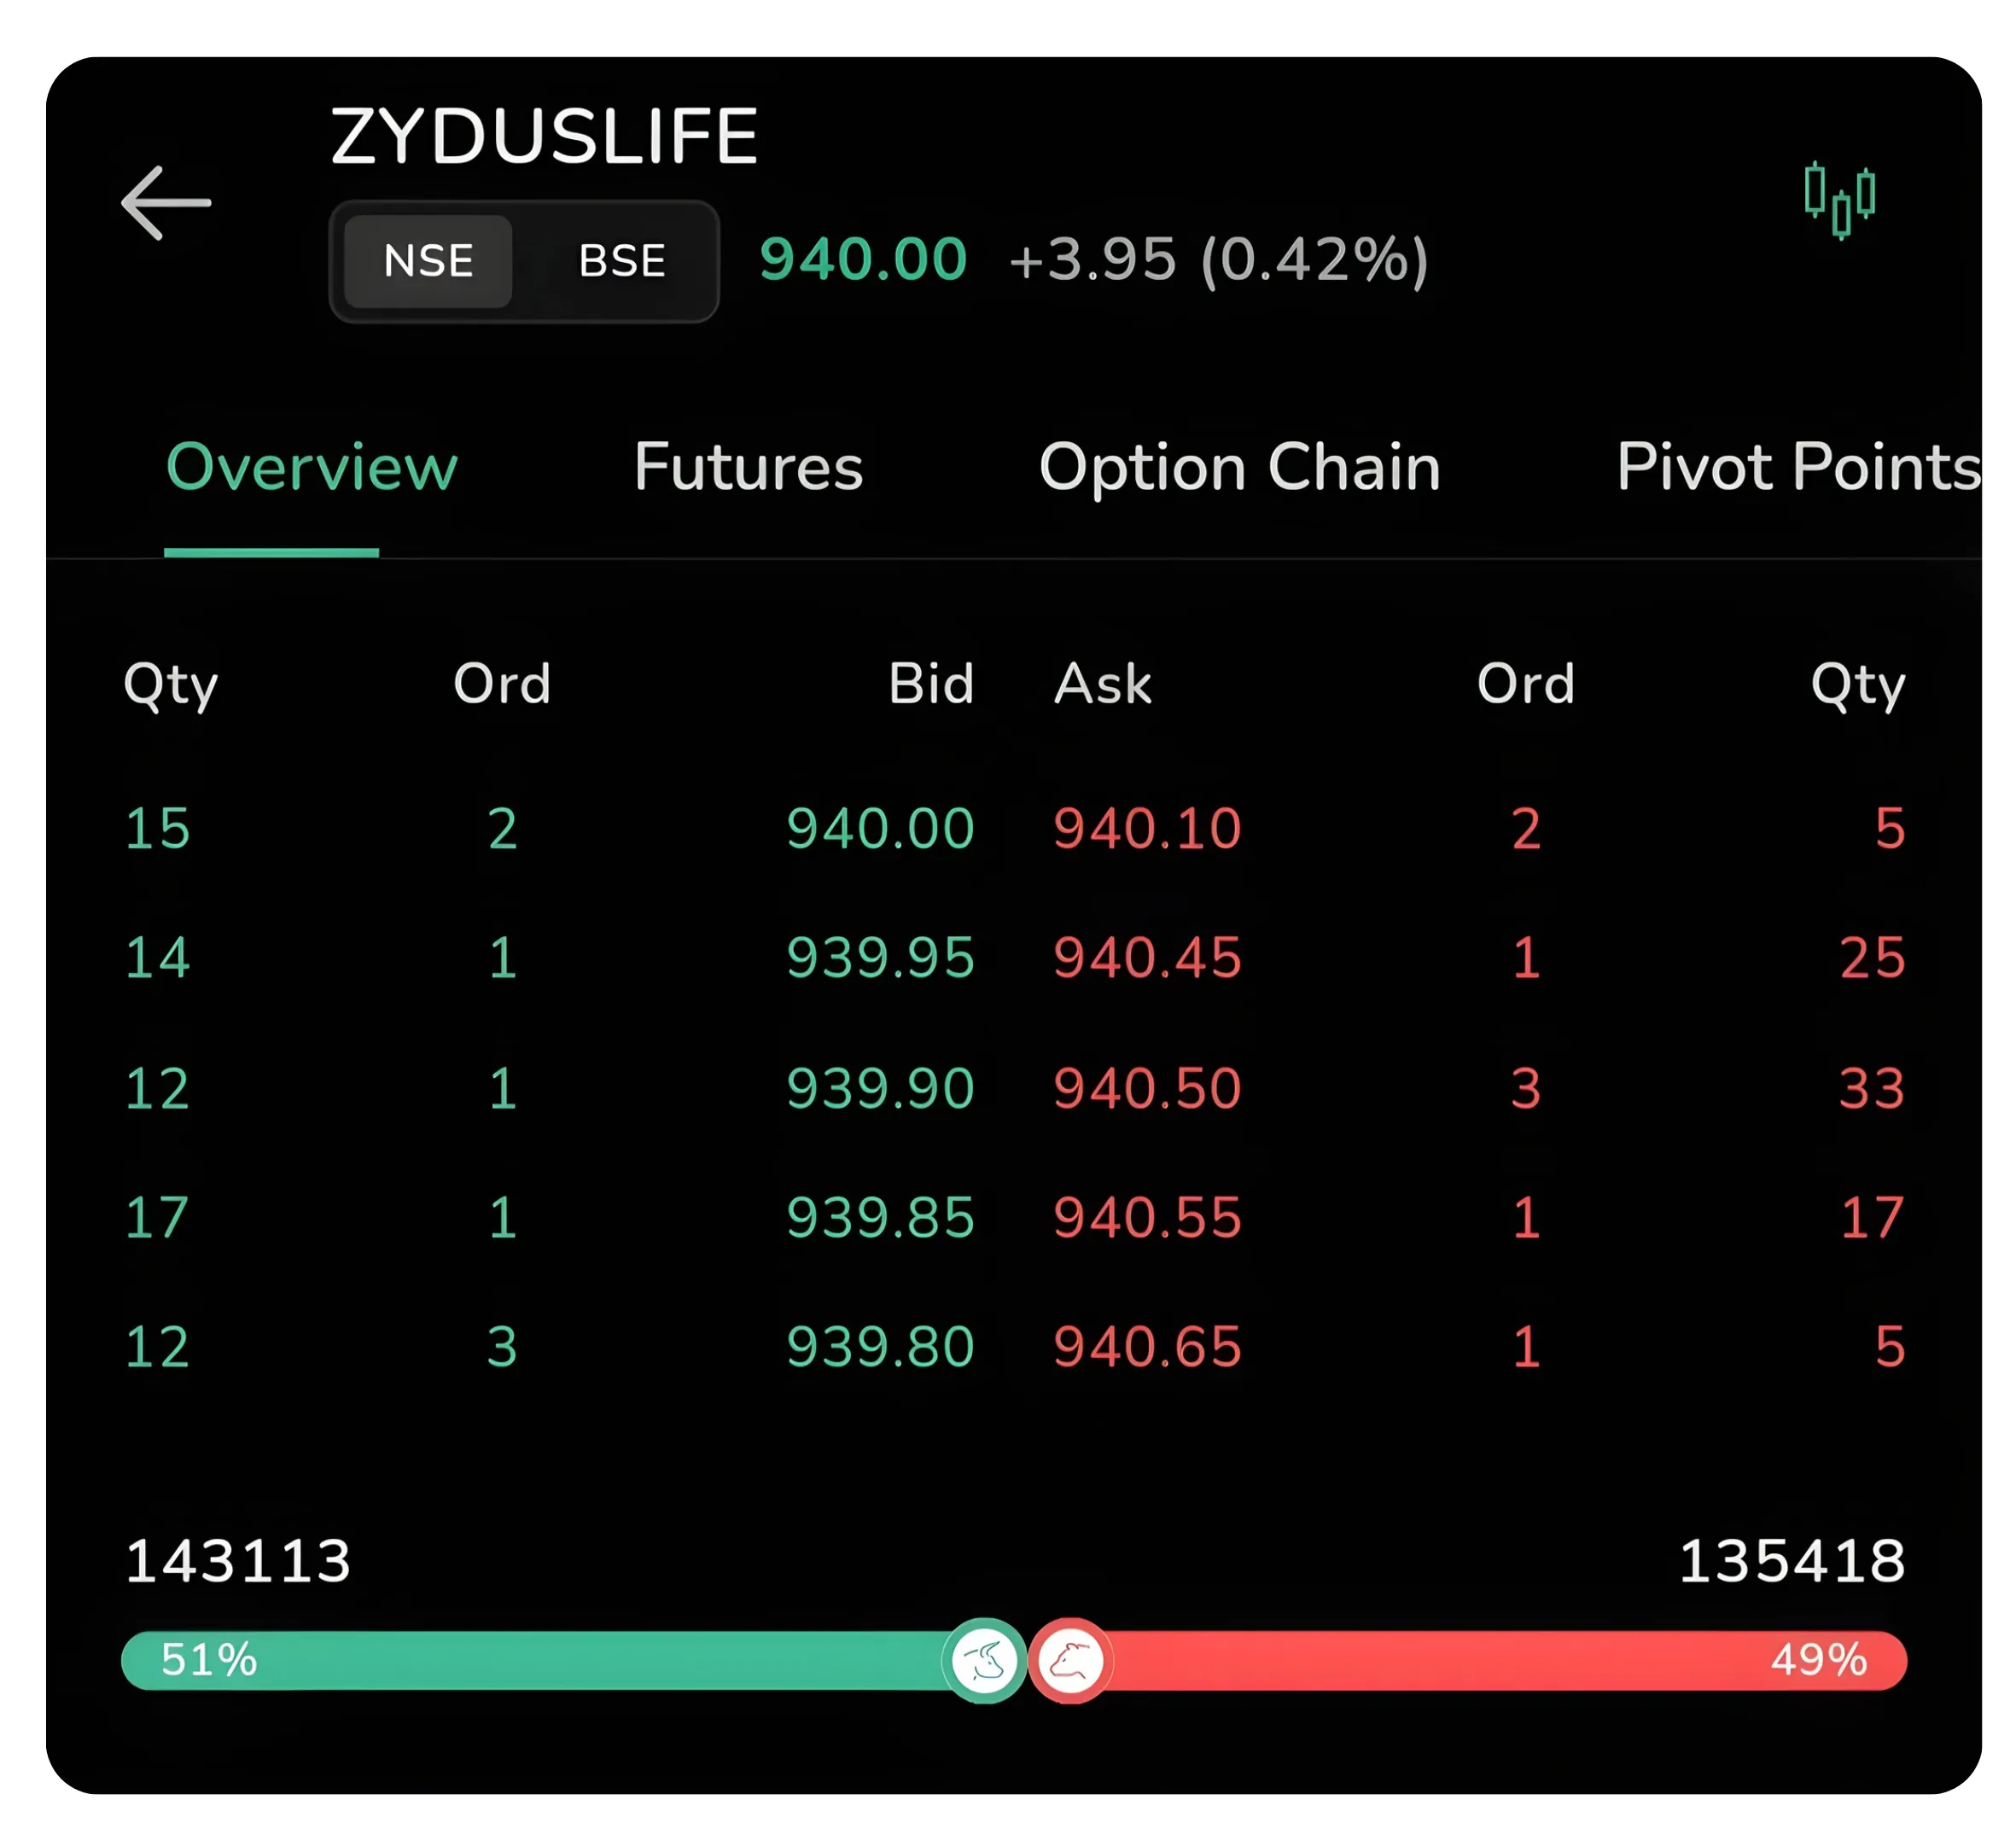
Step 2: The Overview page displays all tabs. Click on Pivot Points to access the pivot analysis tools.
View of the Pivot Points dashboard
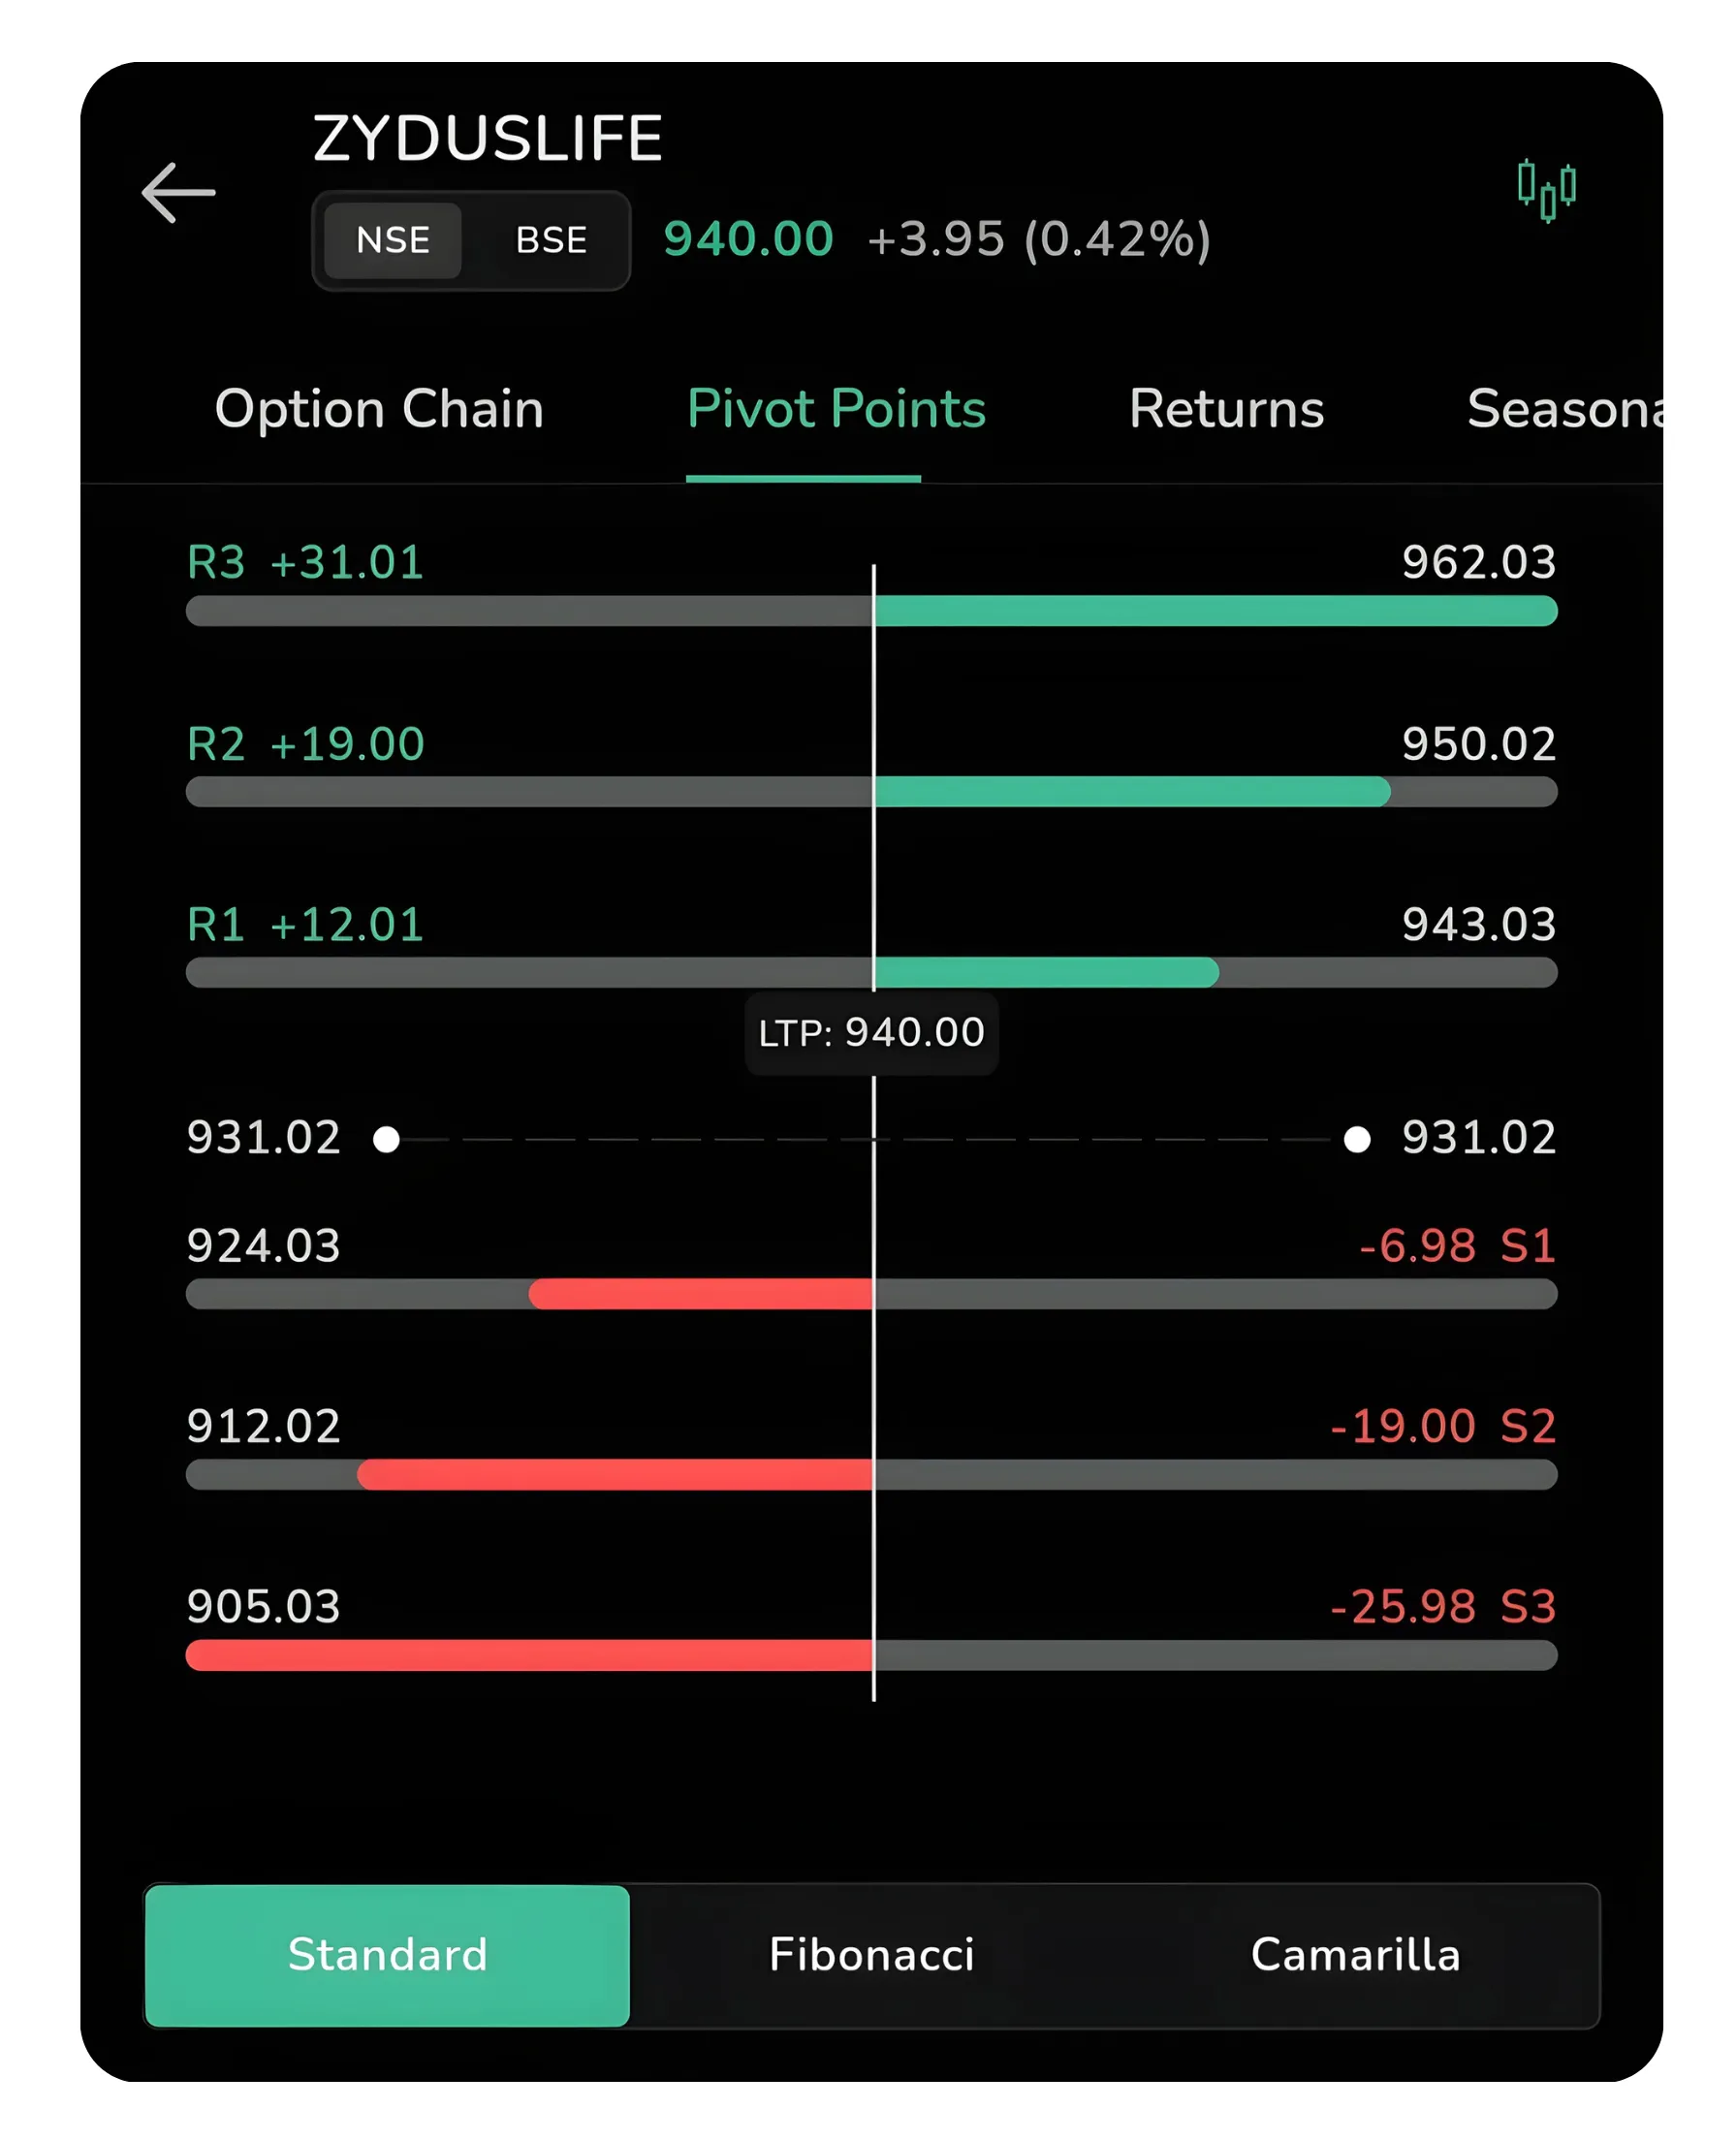
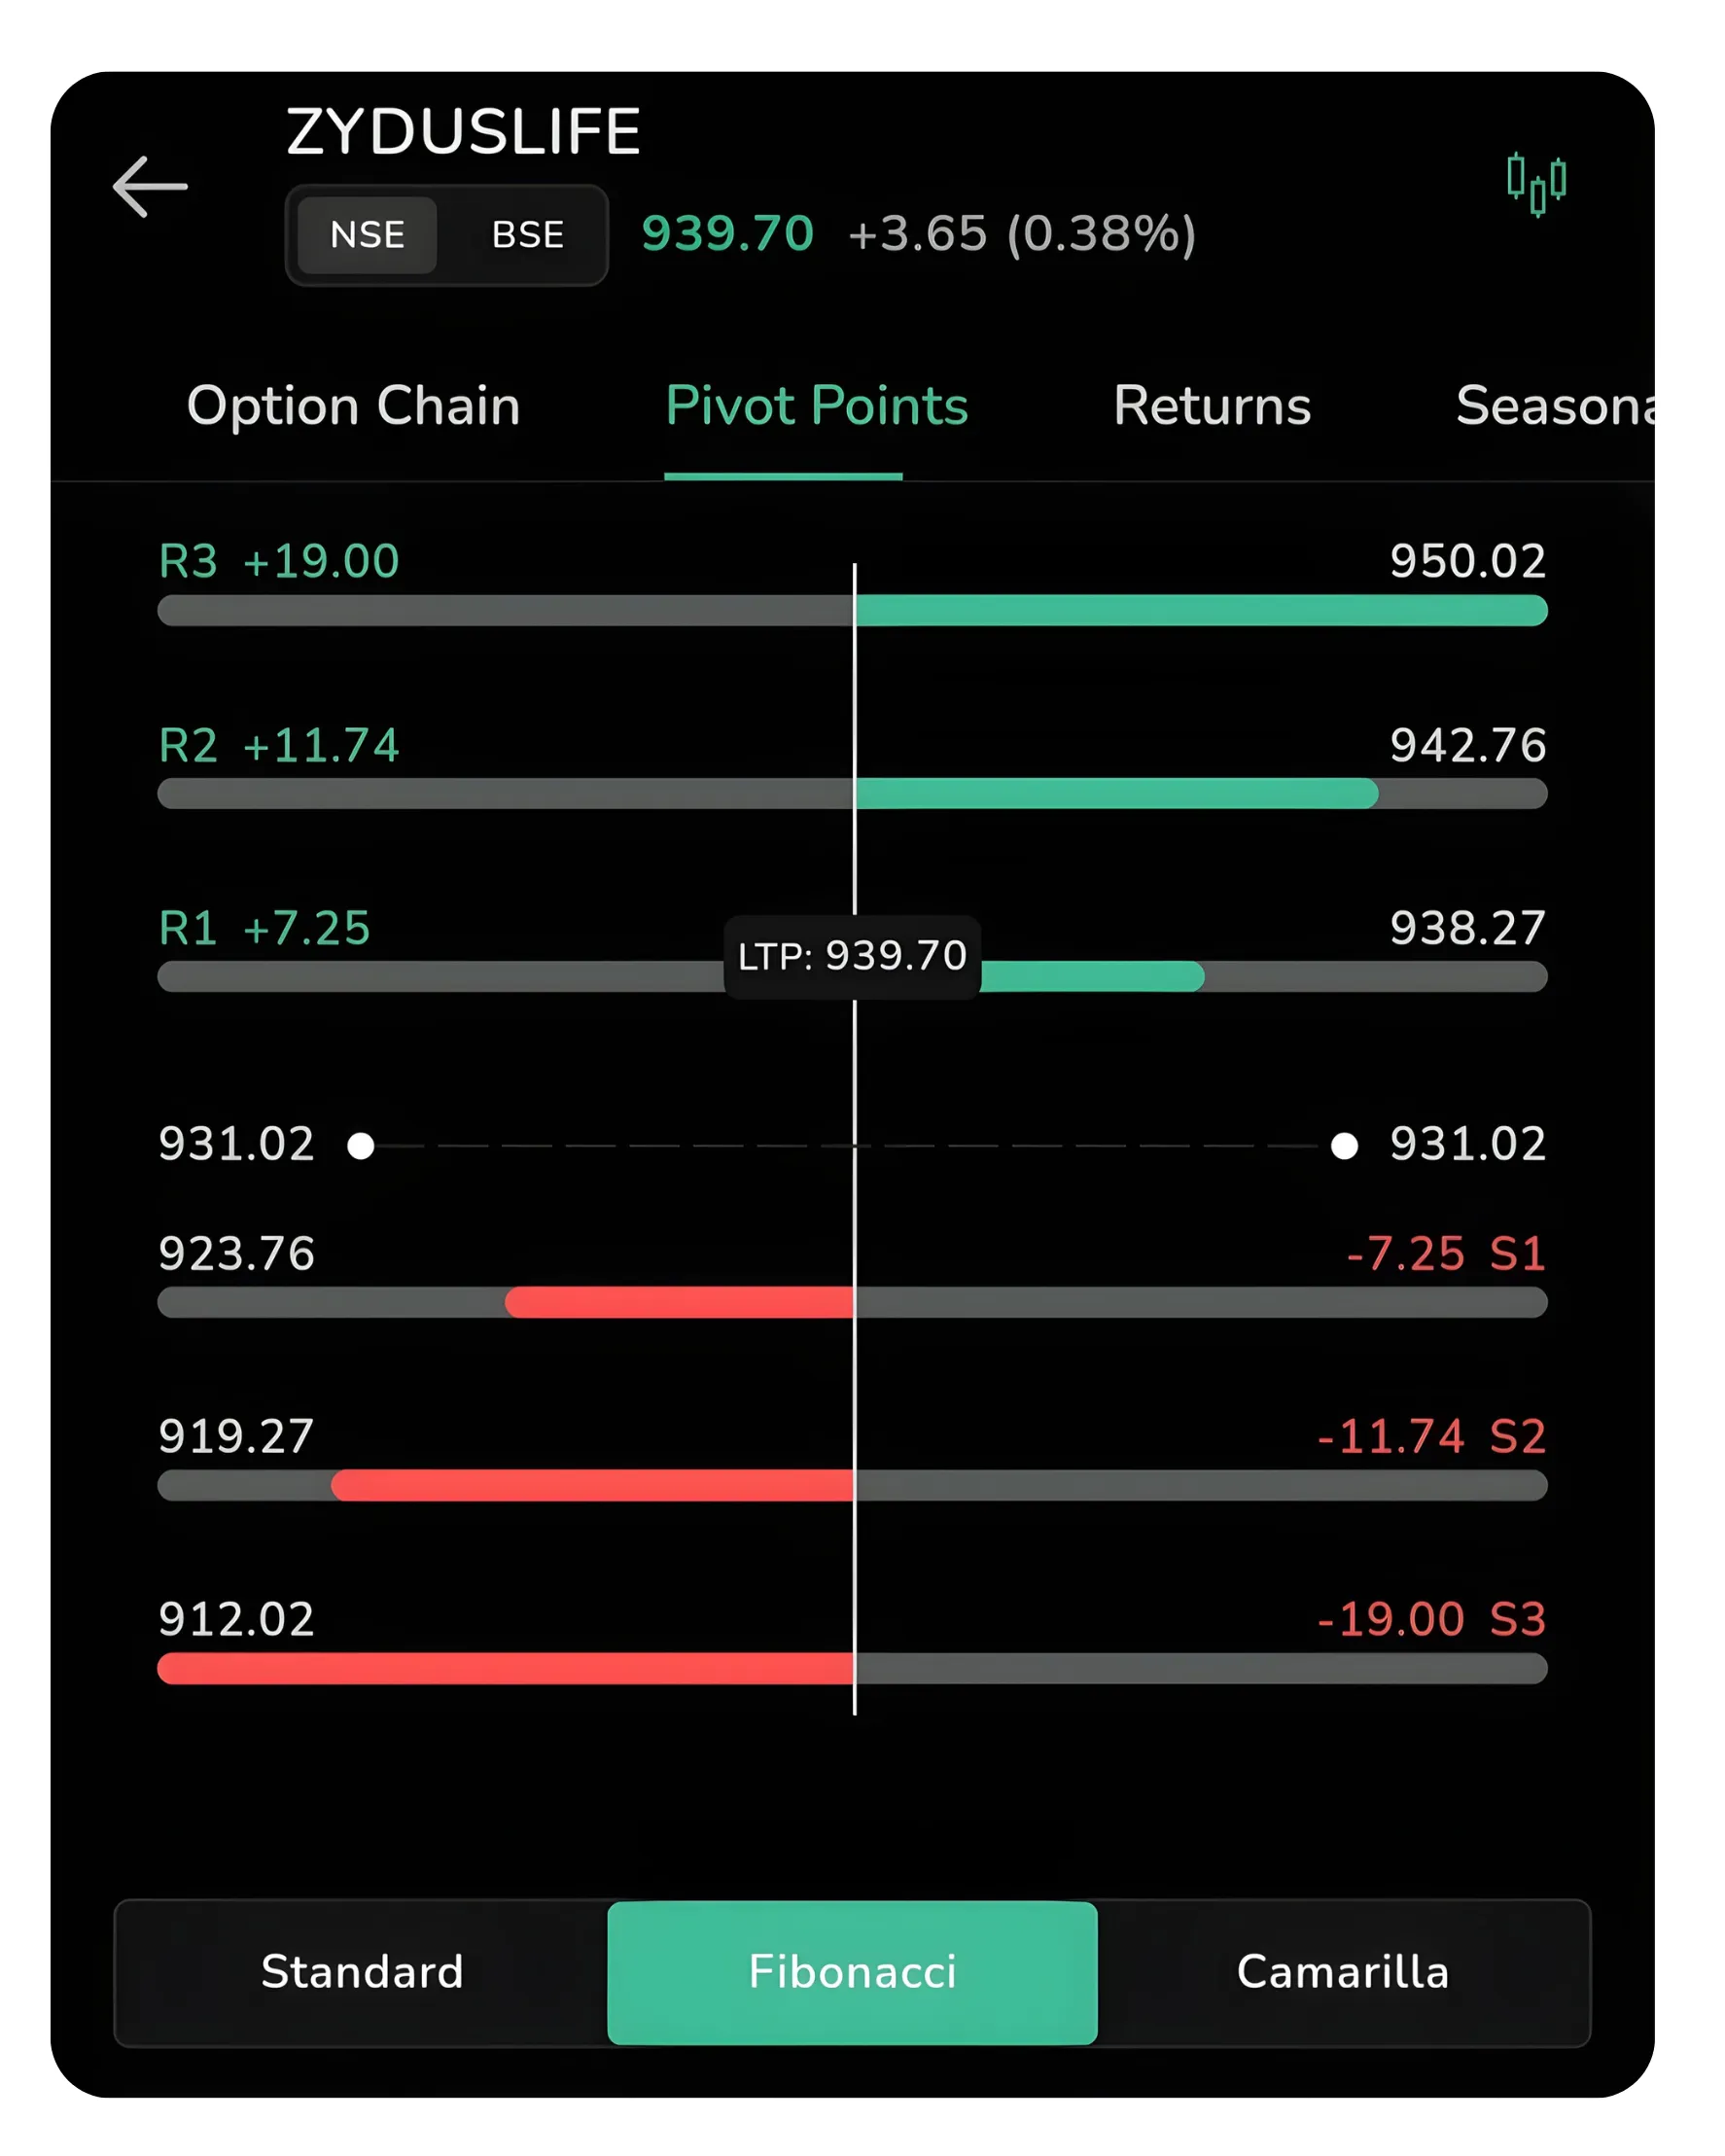
The Pivot Points tab displays all key levels across different calculation methods. Each method has a different underlying formula and reveals different levels of support and resistance based on the previous trading session's open, high, low, and close prices. At the bottom of the screen, you will see three toggle options: Standard, Fibonacci, and Camarilla. By default, Standard pivot points are displayed when you first enter the tab.
Understanding Pivot Point Levels
A pivot point is a technical analysis indicator used to determine an overall trend of the market over different time frames. The pivot point is calculated using the previous session's high, low, and closing prices. The main pivot point (often labeled as the central level) acts as the primary support and resistance level.
Support and resistance trading in India has grown considerably, and pivot points provide an objective, session-specific framework that traders across all experience levels can apply consistently without relying on subjective chart interpretation.
Resistance levels (R1, R2, R3): These extend upward from the pivot and represent price levels where traders historically observe increased selling pressure, causing the price to reverse or consolidate.
Support levels (S1, S2, S3): These extend downward from the pivot and represent price levels where buying interest tends to emerge, slowing or reversing downward price movements.
The Pivot Level: This serves as the fulcrum between supply and demand. When price trades above the pivot, it often signals bullish momentum. When price trades below the pivot, it often suggests bearish momentum.
Standard Pivot Points
The Standard (or Classical) pivot point methodology is the most widely used and oldest calculation method. It uses a straightforward formula based on the previous day's trading range: the high, low, close, and open prices. When you view Standard pivot points in CubePlus, you will see the central pivot level marked on the chart along with R1, R2, R3 above it and S1, S2, S3 below it.
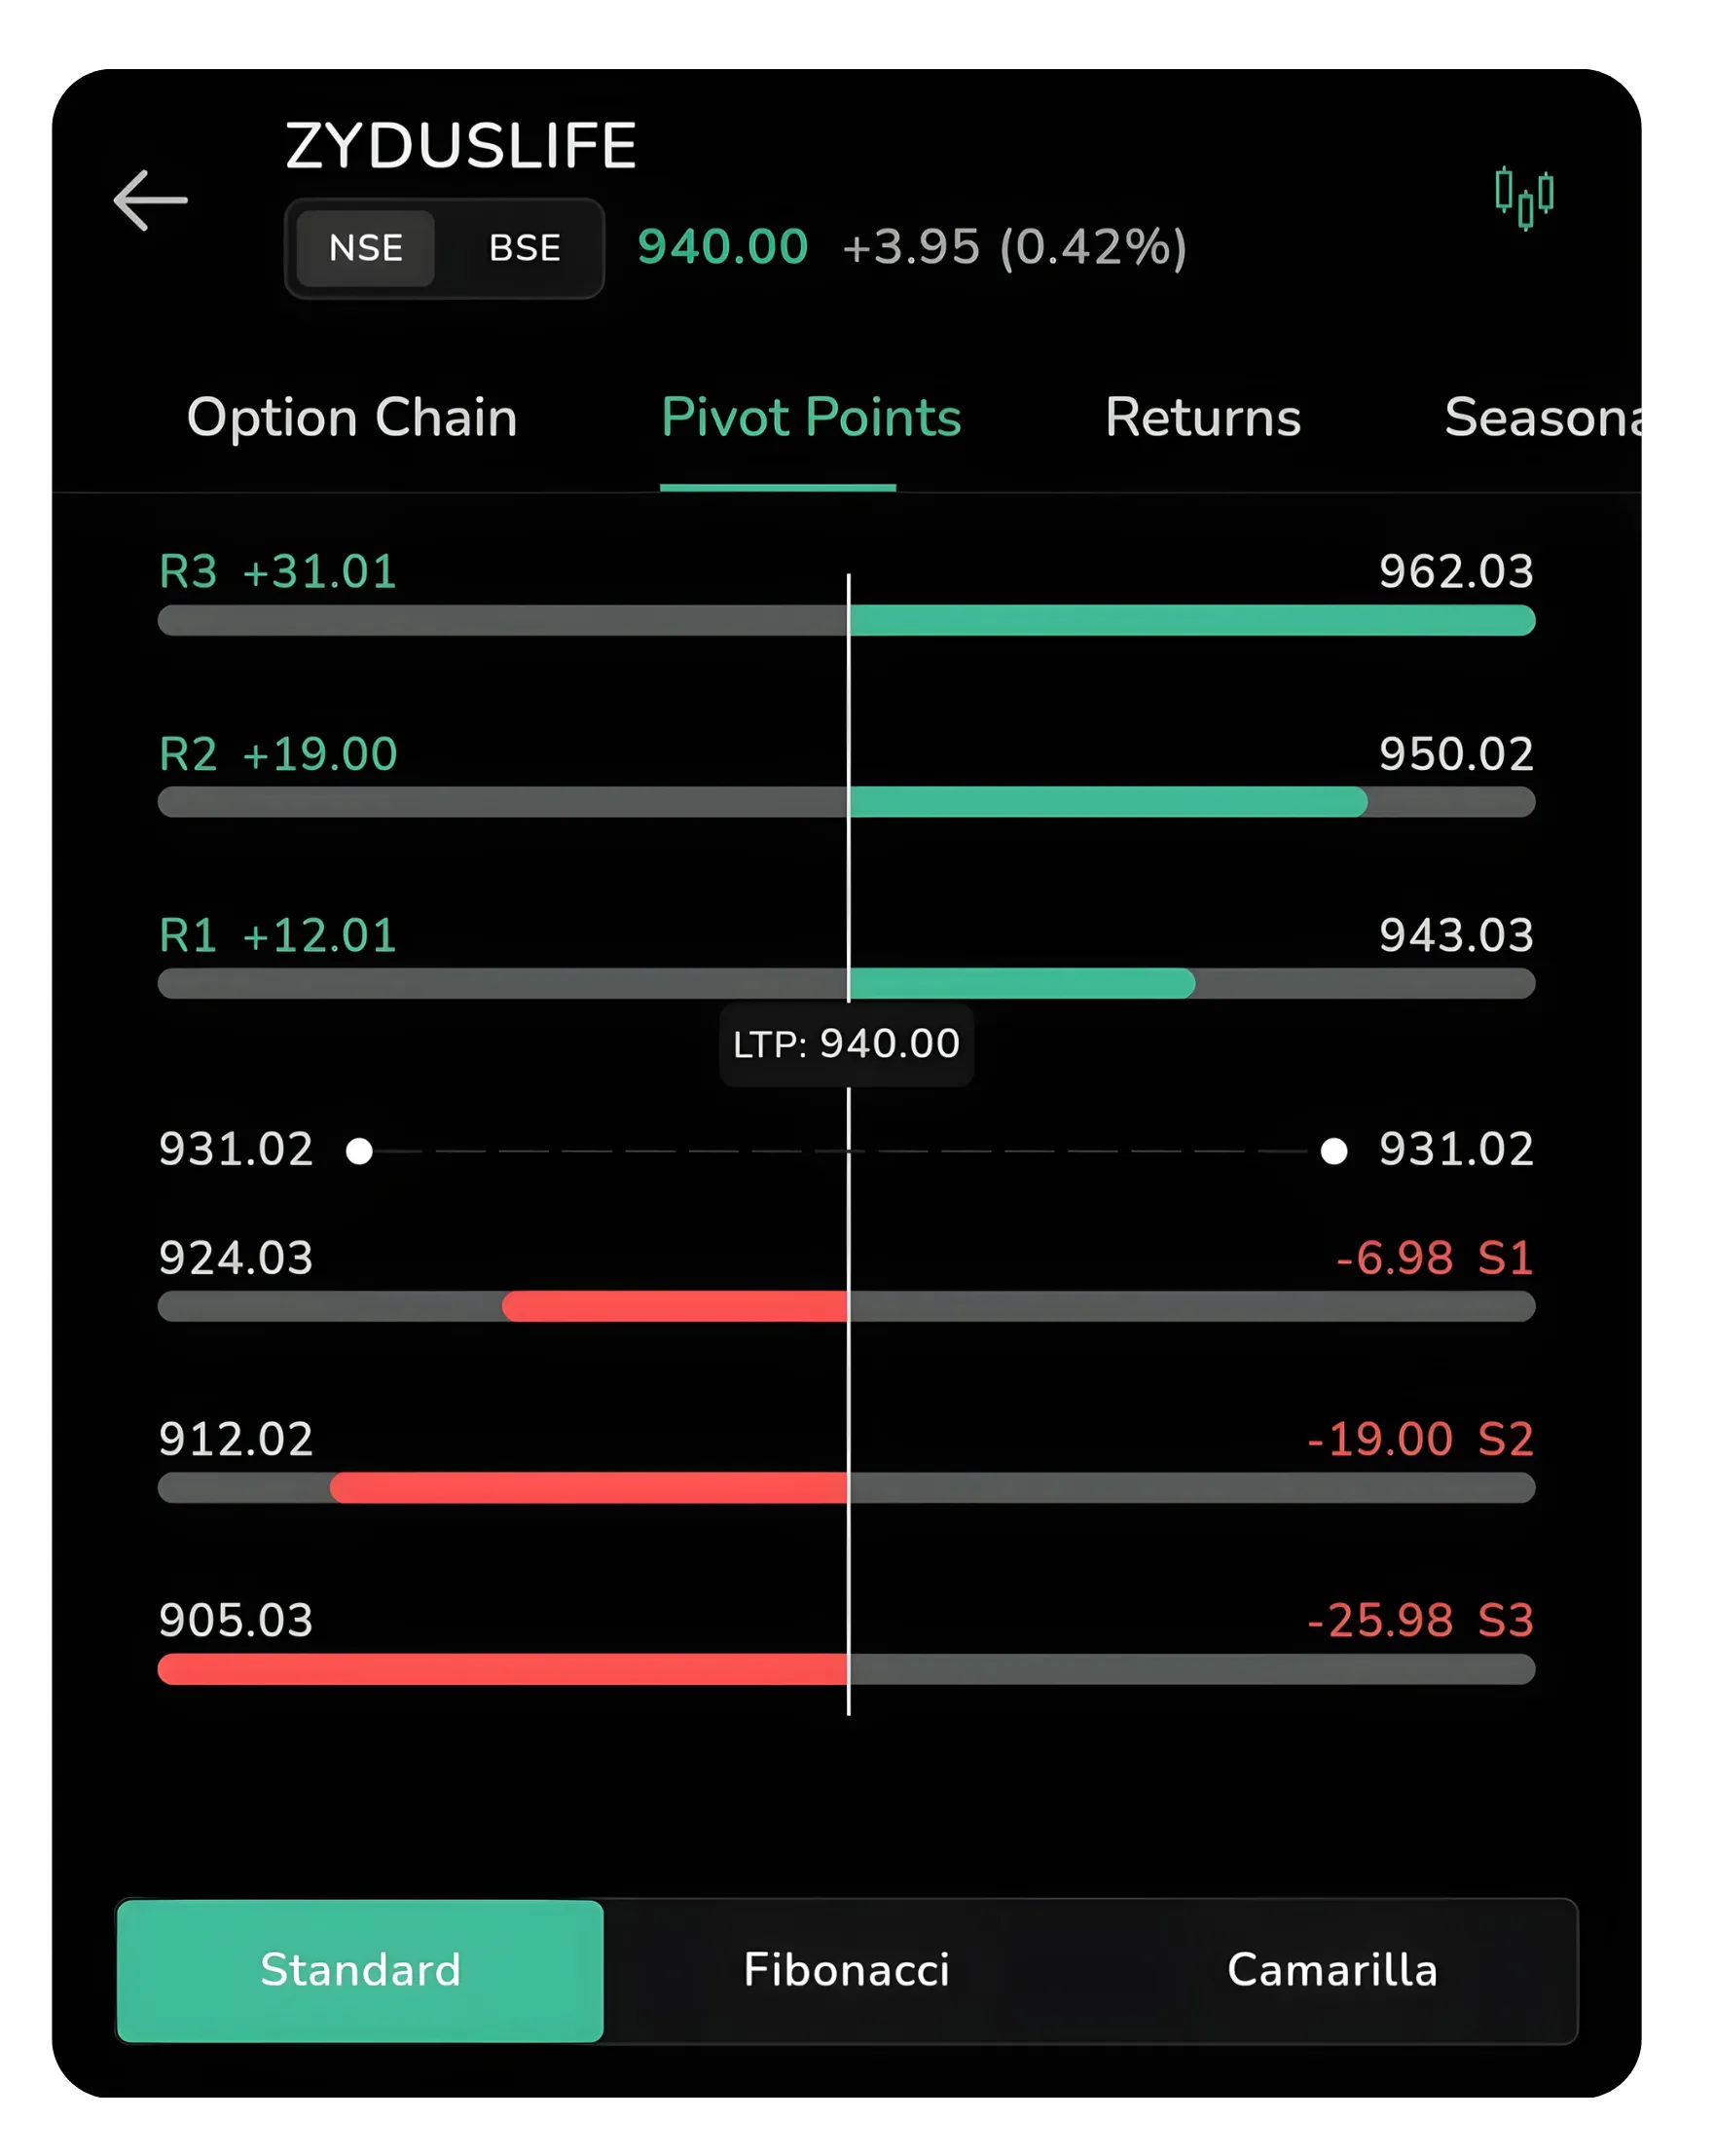
Standard Pivot Points: The central pivot is marked with R1, R2, R3 above and S1, S2, S3 below. The bars show which levels are above or below the current LTP.
Levels are evenly spaced around the pivot, reflecting a balanced, mean-reversion structure that works well in range-bound markets. The levels are calculated with equal spacing, meaning the distance from the pivot to R1 is the same as from the pivot to S1. This simplicity makes Standard pivot points intuitive for traders who are new to pivot analysis.
How Traders Use Standard Pivots
Standard pivots act as quick reference levels for intraday entries and targets. A common approach is to treat R1 and S1 as the first potential turning points during the day. If the price breaks cleanly above R1 early in the session, many traders interpret this as confirmation of bullish momentum and might look for secondary targets at R2 or R3. Conversely, a break below S1 suggests bearish momentum with targets potentially at S2 or S3.
Since Standard pivots are symmetrical around the central pivot, they work best in ranging markets where price oscillates between support and resistance. In strong trending markets, the Standard method may produce levels that are too tight or too wide, requiring traders to adjust their expectations or use additional confirmation indicators.
Fibonacci Pivot Points
Fibonacci pivot points incorporate the famous Fibonacci sequence into the pivot point calculation. Rather than using simple arithmetic, Fibonacci pivots multiply the trading range (high minus low from the previous session) by Fibonacci ratios (typically 0.382, 0.618, and 1.0) and apply these to determine support and resistance levels.
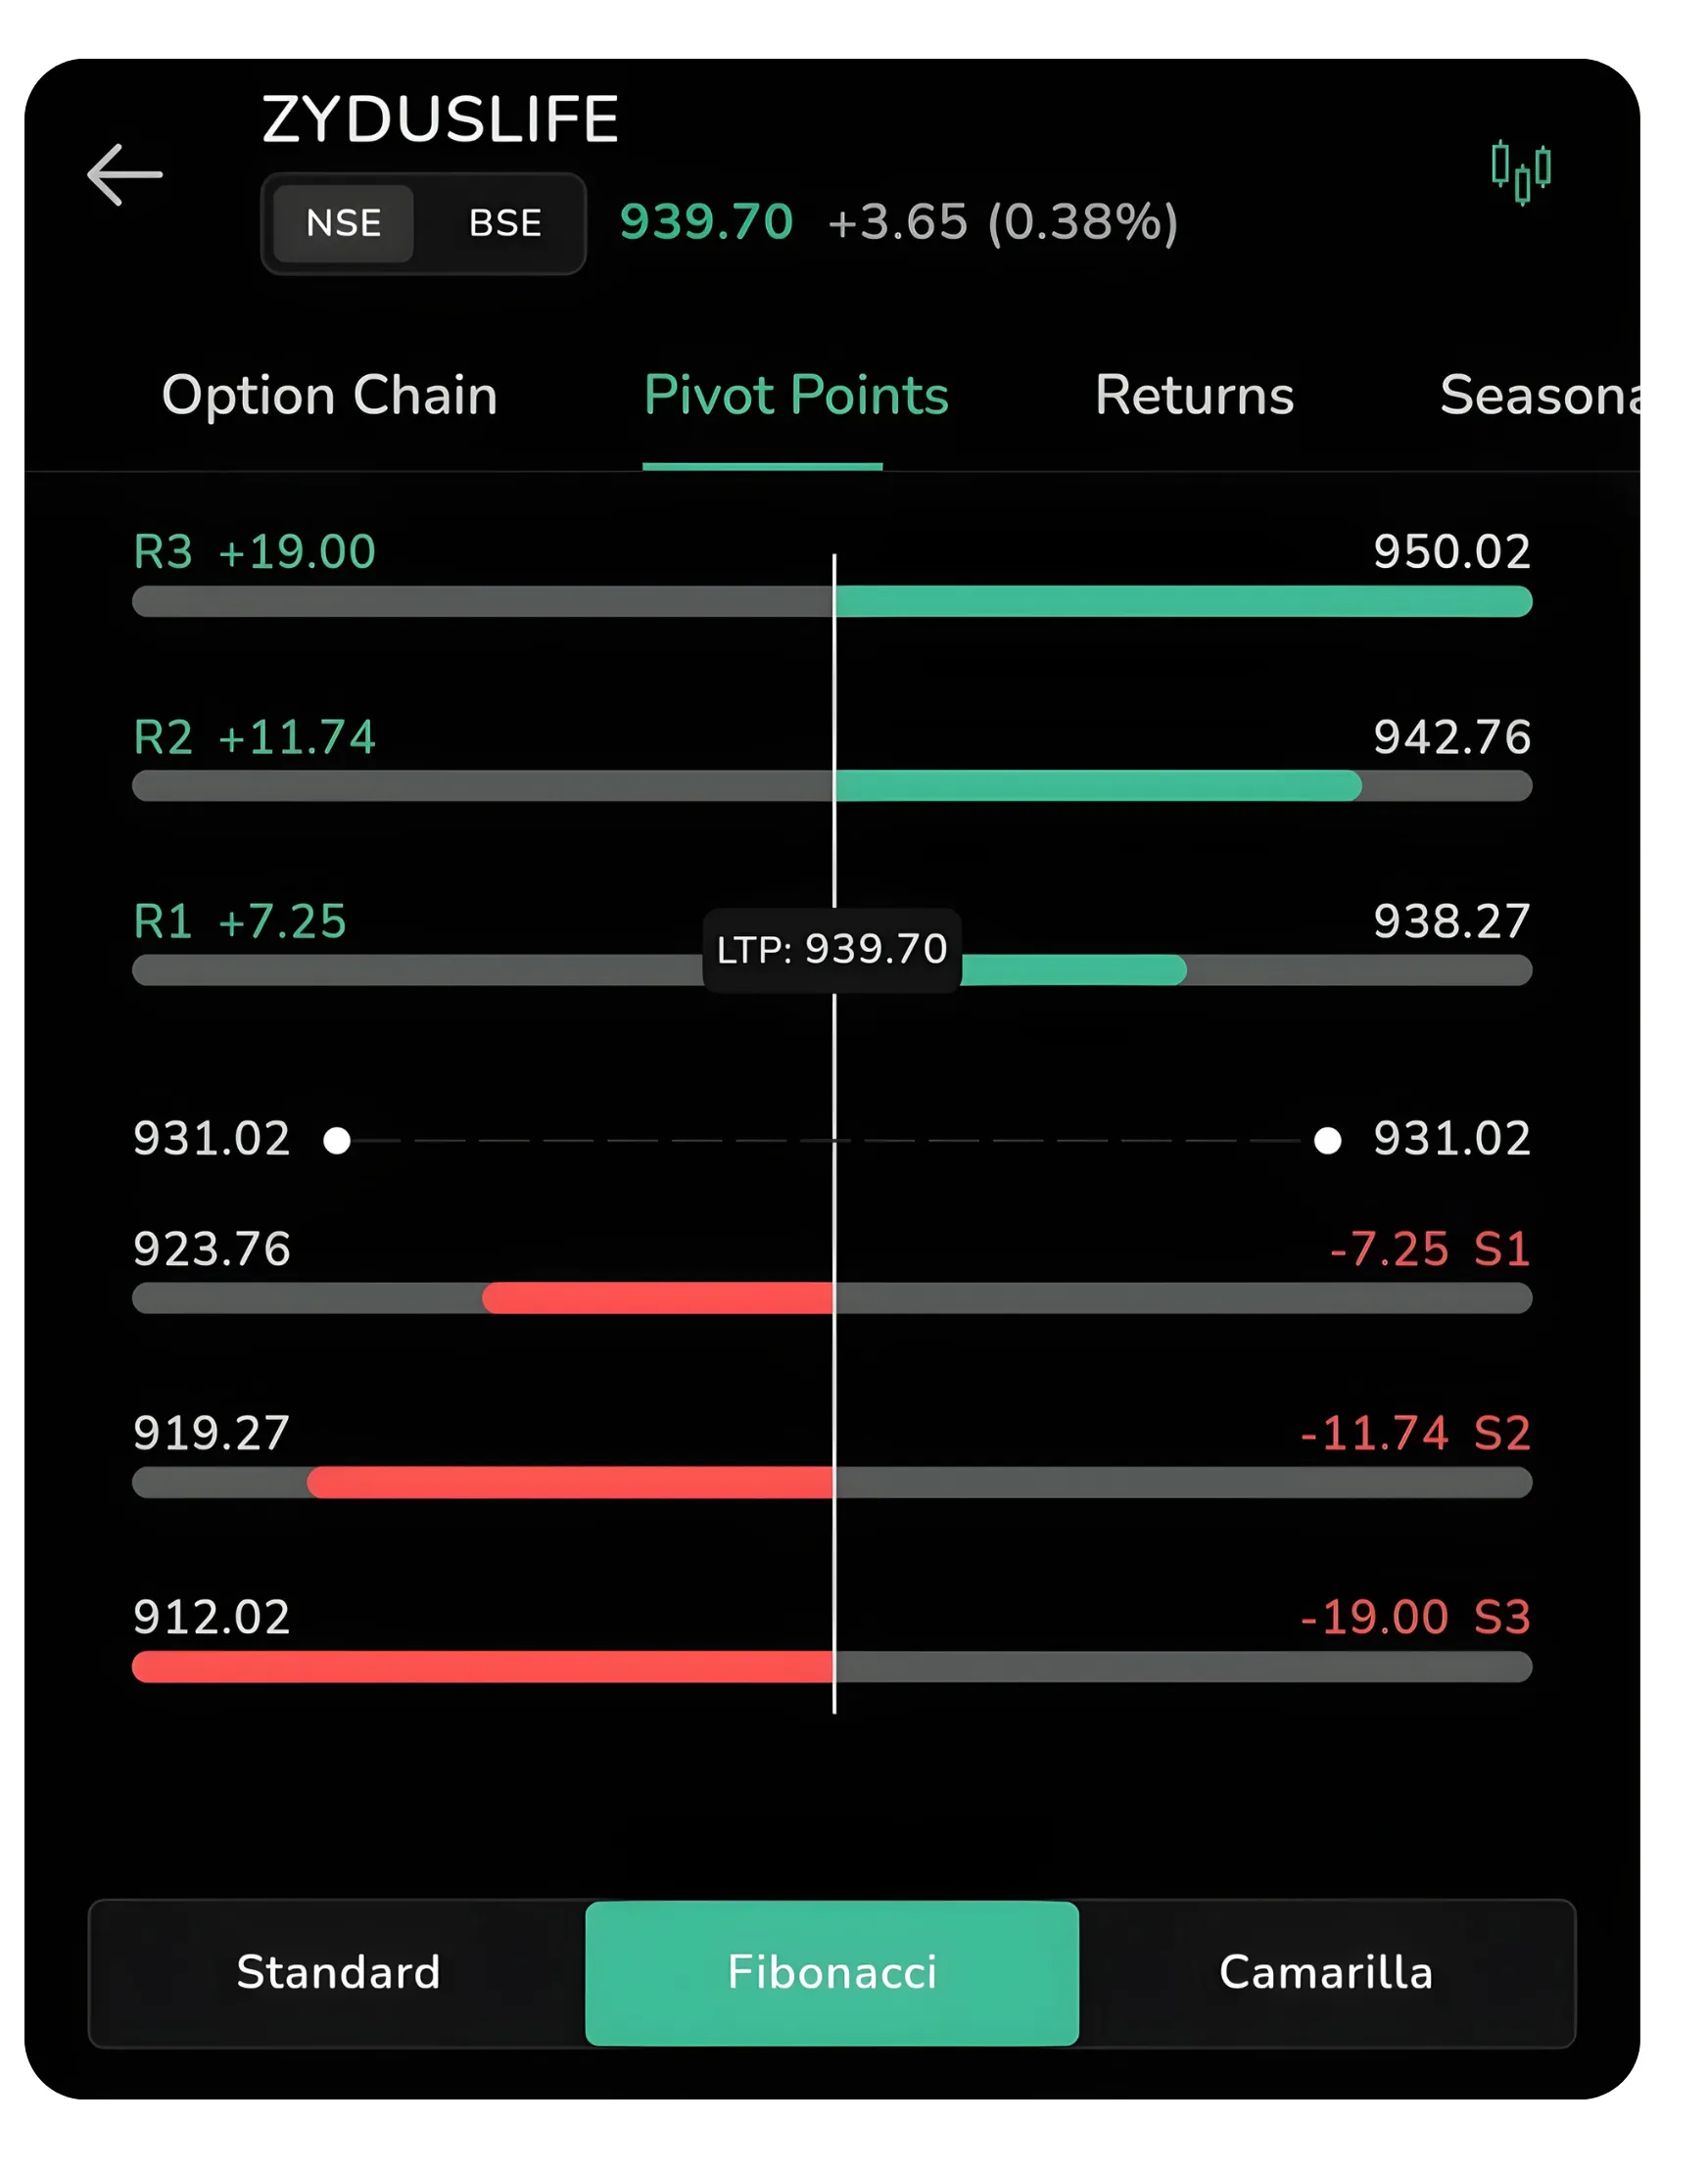
Fibonacci Pivot Points: Notice the unequal spacing of levels, reflecting Fibonacci ratios in market movements.
When you switch to the Fibonacci tab in CubePlus, the resistance and support levels shift to new positions based on this Fibonacci methodology. The visual appearance remains similar (colored bars showing levels), but the actual price levels where the bars terminate will be different from the Standard method.
Fibonacci pivot points tend to produce unequal spacing. This means R2 and R3 may be spaced farther apart than R1 and R2, and the same applies to the support levels below the pivot. This unequal distribution reflects how price trends and retracements often follow Fibonacci proportions in natural market movements.
How Traders Use Fibonacci Pivots
Fibonacci pivots are preferred in trending markets, where price often respects ratio-based extensions. Fibonacci levels often align with natural retracement and extension levels that emerge during trending moves. Many professional traders prefer Fibonacci pivots for trending markets because the unequal spacing of levels can better capture where reversals or consolidations occur in a strong directional move.
When you see price approach an R2 or R3 calculated using Fibonacci ratios, the level may have additional confluence with other Fibonacci-based indicators on your chart. This added weight can make Fibonacci pivots a more reliable reference point than Standard pivots in certain market conditions. Fibonacci pivots are particularly useful when combined with other Fibonacci analysis tools.
Also Read: After-Market Orders Explained
Camarilla Pivot Points
The Camarilla method is less commonly used than Standard or Fibonacci but is gaining traction among quantitatively minded traders. Camarilla pivots place greater emphasis on the range of the previous session and produce much tighter levels around the central pivot compared to the other two methods.
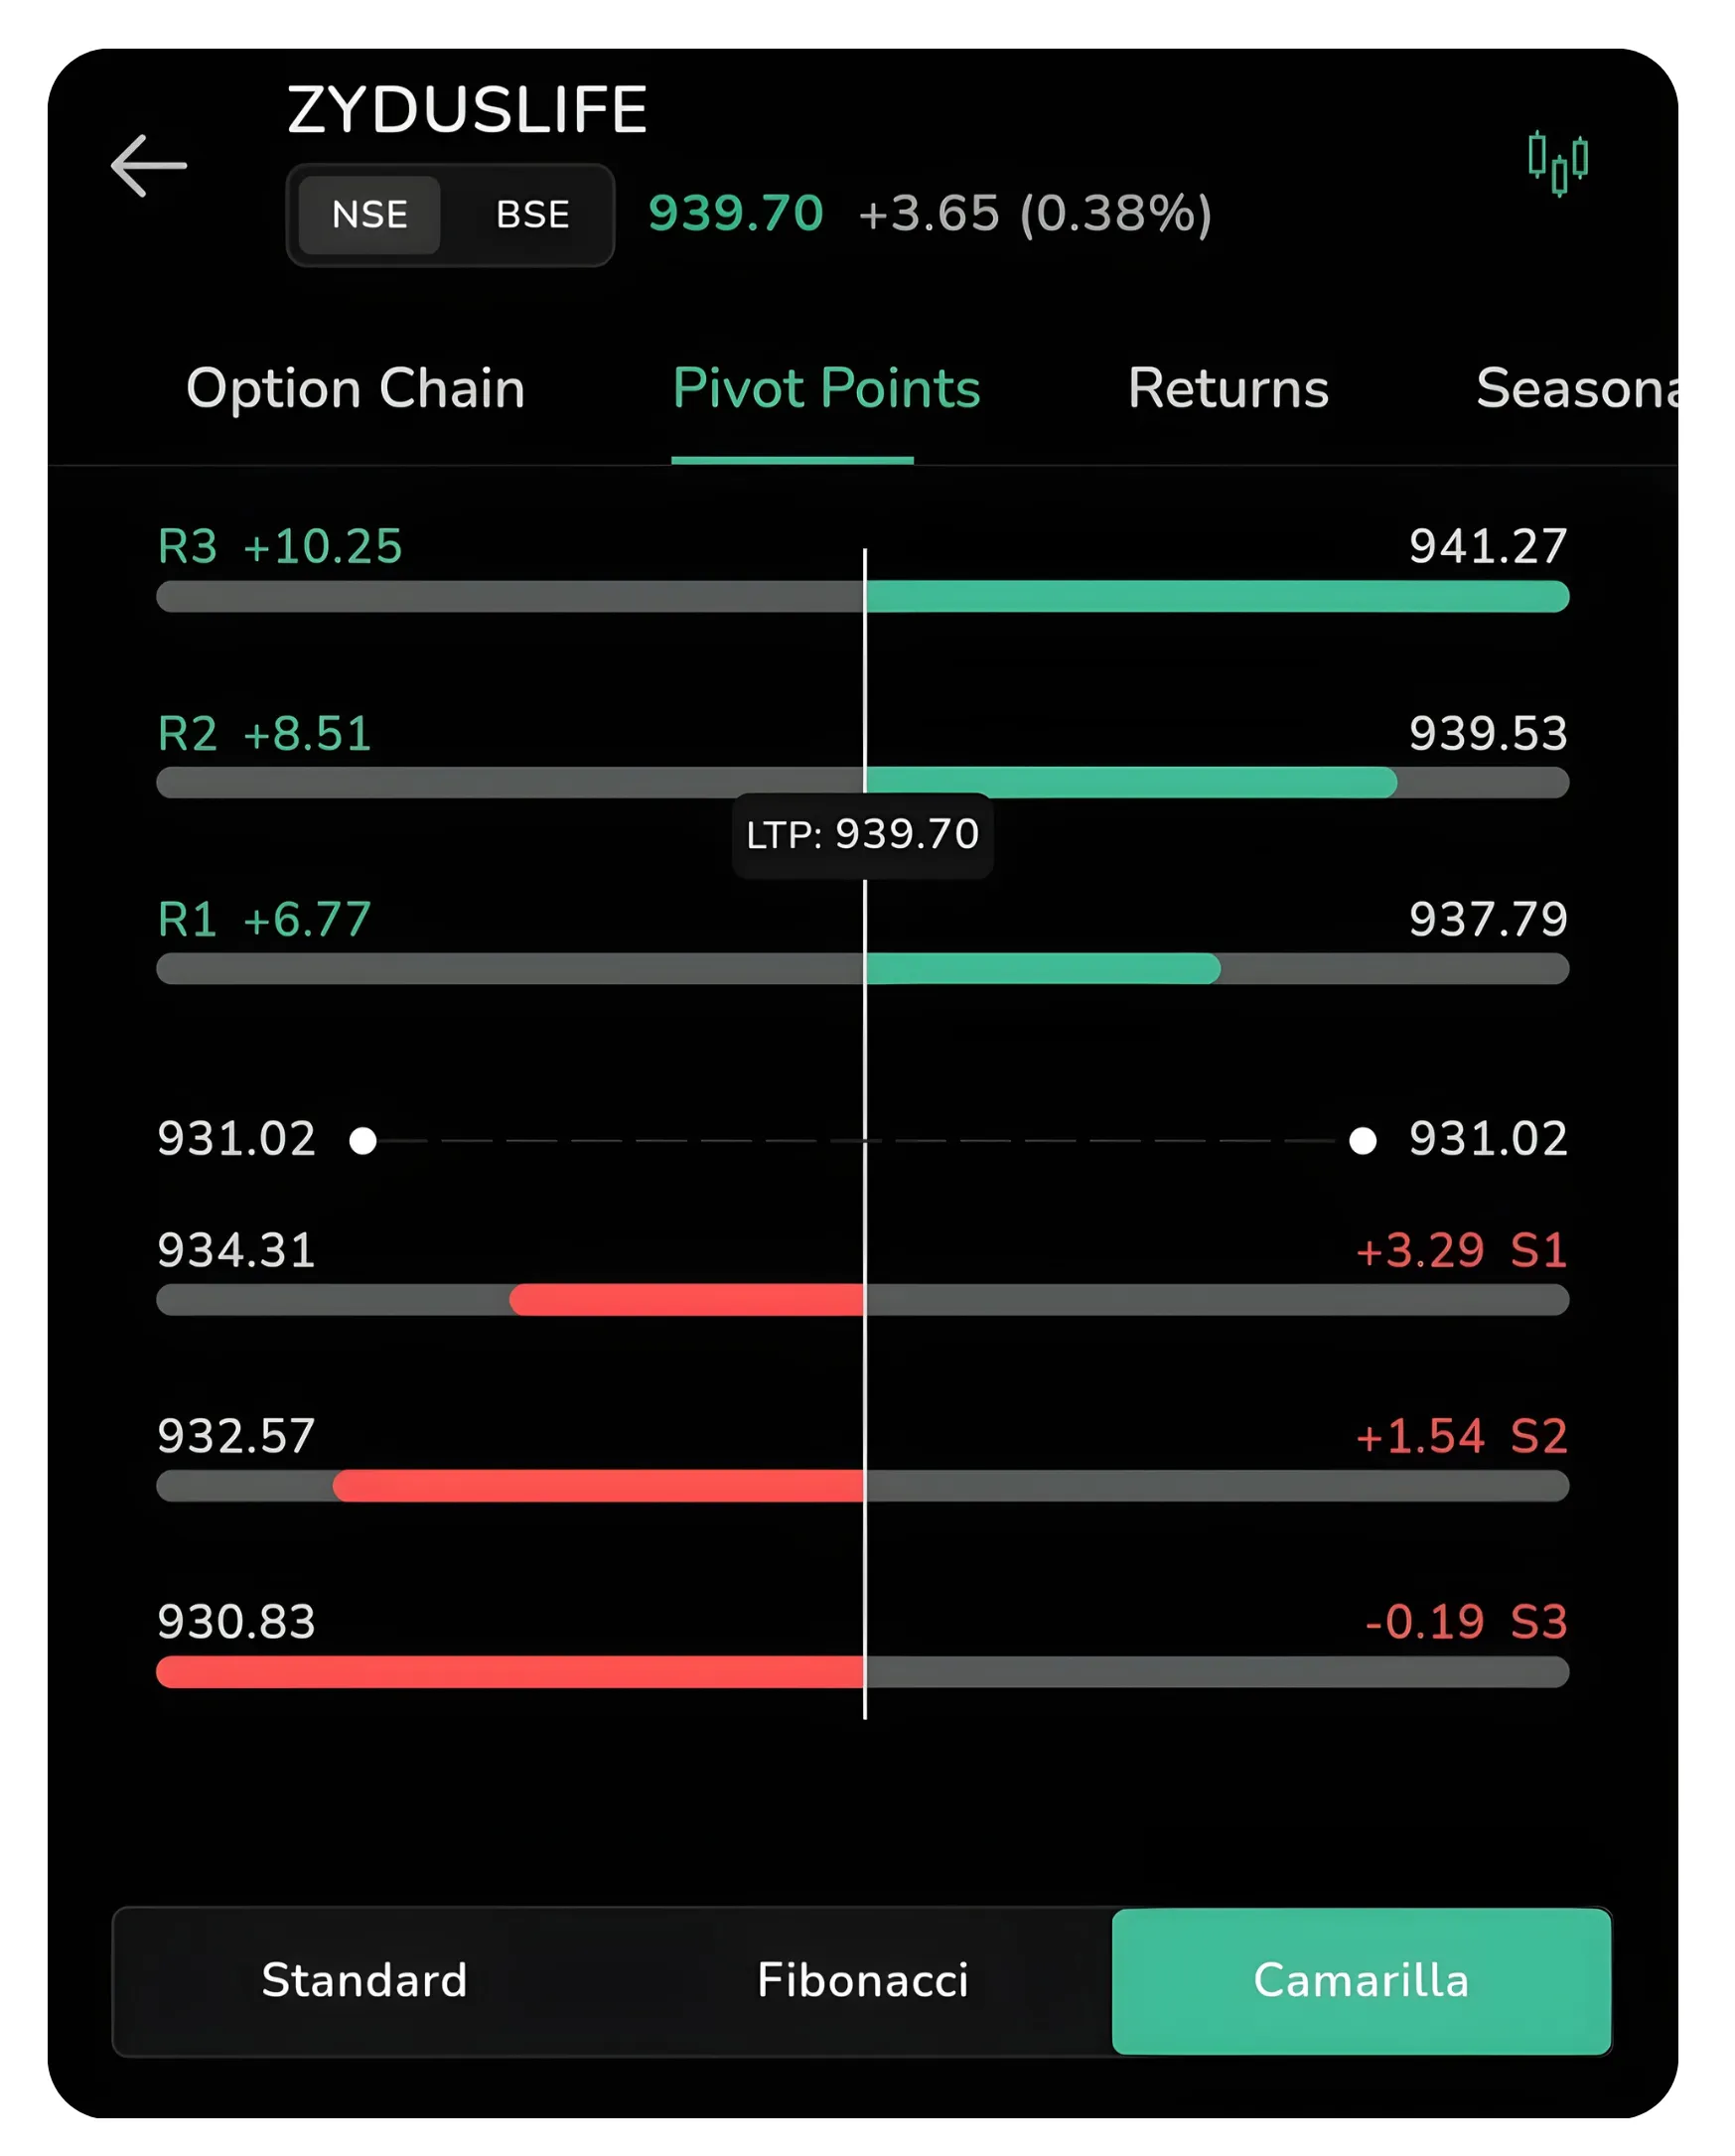
Camarilla Pivot Points: The support and resistance levels are much tighter, ideal for scalping and short-term intraday moves.
When you select the Camarilla toggle in CubePlus, you'll notice that the support and resistance levels cluster more closely around the LTP. The bars representing each level (R1, R2, R3, S1, S2, S3) are much more compressed vertically. This tighter grouping makes Camarilla pivots especially useful for scalp traders or those looking for short-term price objectives within the day.
How Traders Use Camarilla Pivots
Camarilla pivots work best for intraday trading and scalping, where capturing small price moves between tight levels is the goal. If you're trading a 15-minute or 1-hour timeframe and looking for quick entry and exit opportunities, Camarilla pivots often define the expected intraday range with remarkable accuracy. The tighter levels can help set stop losses closer to entry, reducing risk per trade while allowing for higher accuracy.
Many algorithmic traders and high-frequency operations use Camarilla pivots because of their precision. If you're trading on the CubePlus charts and notice price respect the S1 and R1 levels repeatedly, you may have found a powerful intraday trading setup using Camarilla levels. However, Camarilla pivots tend to break down in highly volatile or gap-heavy sessions, so using them in conjunction with volume or volatility confirmation is advisable.
Comparing the Three Methods
| Method | Market Assumption | Level Structure | Best Use Case |
|---|---|---|---|
| Standard | Balanced, symmetrical market | Equal spacing around pivot | General-purpose across conditions |
| Fibonacci | Harmonic price behaviour | Unequal, ratio-based spacing | Trending markets |
| Camarilla | Tight intraday predictability | Compressed, closely packed levels | Scalping & short-term trading |
In CubePlus, you have the flexibility to view all three methods instantly by switching between tabs. Many experienced traders use multiple methods as confirmation. For example, if R1 from the Standard method aligns closely with a Fibonacci resistance level, that convergence becomes a more significant turning point than either level alone.
Practical Application in Your Trading Day
Consider a real-world example: You open CubePlus on a morning and see ZYDUSLIFE trading at 940 (the LTP). You navigate to the Pivot Points tab and observe the following across all three methods.
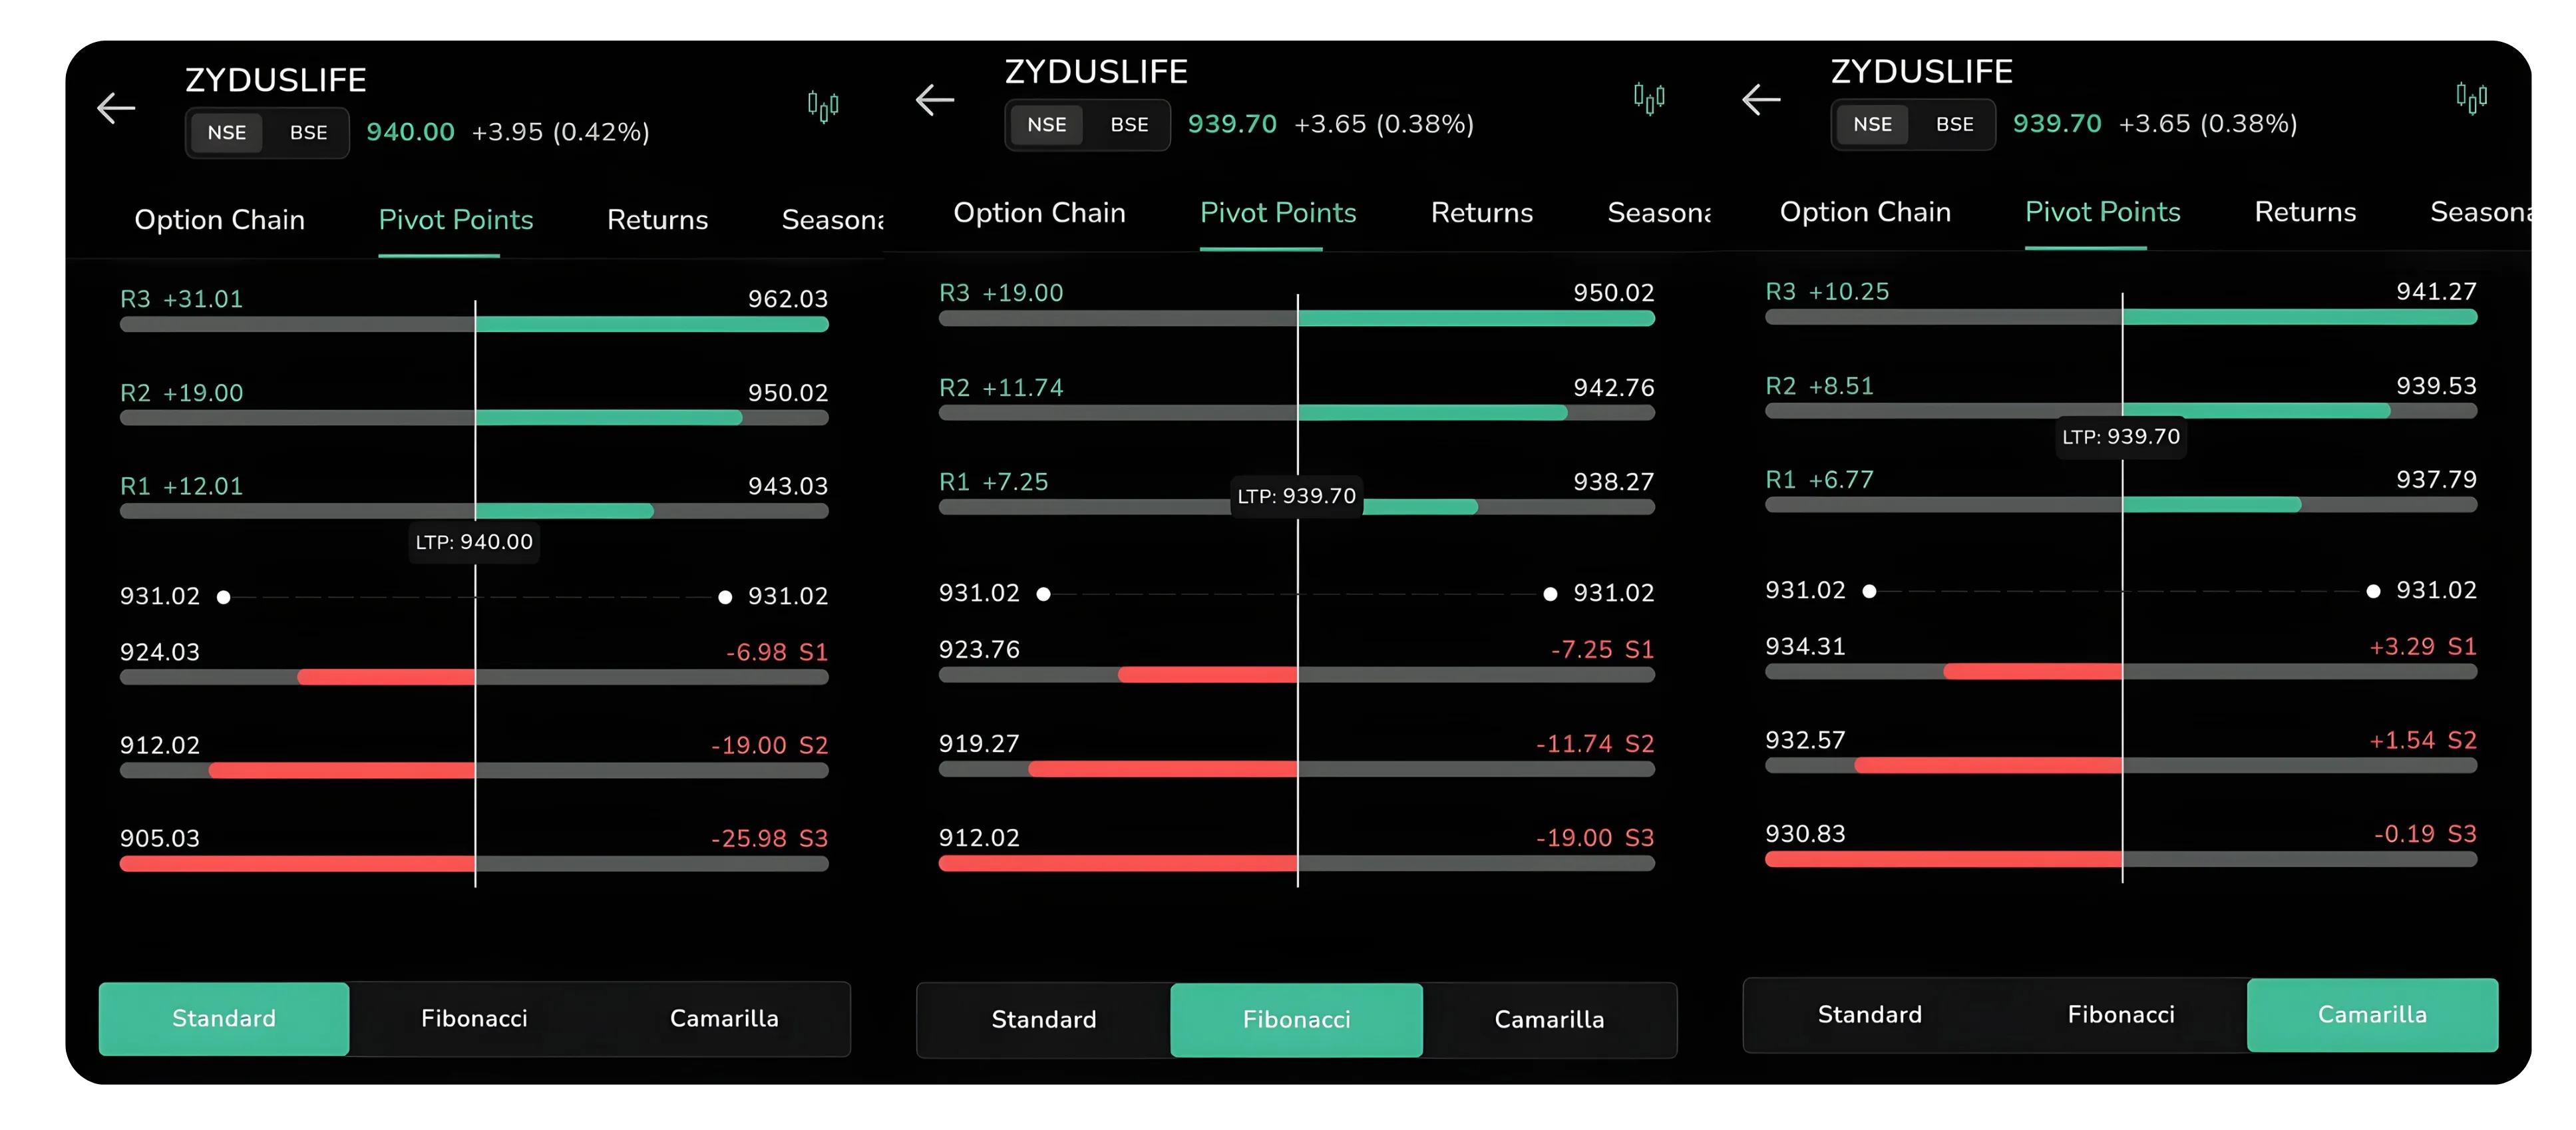
Cross-referencing all three methods gives you multiple confluence levels for high-probability trades.
At the Standard pivot calculation: The central pivot sits slightly above current price. R1 is at 942.76, and R2 is at 950.02. Your view is bullish for the day, and you decide to track whether the stock breaks above R1. If it does, you'd consider targeting R2 as your profit objective.
You switch to Fibonacci pivots: The Fibonacci R1 is at 939.53, which is actually below the current price of 940. This tells you that in Fibonacci terms, you're already in resistance territory. You adjust your outlook to expect consolidation or a minor pullback rather than a clean push higher.
Finally, you check Camarilla: The Camarilla R1 is at 941.27, and S1 is at 939.53. The Camarilla levels are very tight, suggesting the stock will oscillate in a narrow band around 940. If you're a scalper, Camarilla tells you the intraday range is tight. If you're a swing trader, Camarilla suggests the stock isn't ready for a large move and you should wait for additional confirmation.
By synthesizing all three methods, you develop a multi-lens view of the day's likely price behavior. This approach reduces the chance of being blindsided by a reversal and increases the probability of entering at logical support and exiting at logical resistance.
CubePlus stock analysis features are built to support exactly this kind of multi-method workflow, making it straightforward to cross-reference pivot data without leaving the app. As technical analysis in India matures across retail and institutional segments, structured tools like pivot points are becoming a standard part of pre-market preparation for serious intraday traders.
Pivot Points on CubePlus Charts
Beyond the dedicated Pivot Points tab, you can also view pivot point levels directly on the price chart. This integration allows you to see how price interacts with these calculated levels in real time as candles form. Many traders keep pivot levels visible on their charts throughout the trading day for quick reference without needing to switch tabs.
Pivot levels can be displayed directly on your price chart for real-time reference during the trading day.
Key Takeaways
Pivot Points in CubePlus give you instant access to three proven technical methods for identifying support, resistance, and trend direction. Standard pivots serve as a universal baseline; Fibonacci pivots cater to traders who trust harmonic market behavior; Camarilla pivots excel for high-frequency intraday trading.
Rather than choosing one method, professionals often cross-reference all three to build confluence and increase the odds of successful trade execution. By making pivot point analysis a daily habit in CubePlus, you'll develop an intuitive sense of how price respects these calculated levels and can refine your entries and exits accordingly.
Disclaimer: The information provided in our blogs is for informational purposes only and should not be construed as financial, investment, or trading advice. Trading and investing in the securities market carries risk. Always conduct your own research and consult with a qualified financial advisor before making any investment decisions. Past performance is not indicative of future results. Copyrighted and original content for your trading and investing needs.
© 2026 — Tradejini. All Rights Reserved.