


NMDC is India’s largest iron ore producer and a central pillar of the country’s steel supply chain. With mining operations concentrated in Chhattisgarh and Karnataka, the company supplies high-grade iron ore to major domestic steelmakers and retains one of the lowest-cost mining profiles in the industry. As a PSU under the Ministry of Steel, NMDC operates long-life deposits and runs fully mechanized mines, giving it a scale and cost advantage that few global miners enjoy.
NMDC, India's largest merchant iron ore producer, holds mining leases and operates multiple large iron ore mines primarily in Chhattisgarh (Bailadila Complex: Bacheli & Kirandul, and Deposit 10/11A) and Karnataka (Donimalai, Kumaraswamy)
Total Mining Holdings and Reserves
As India’s largest miner, NMDC sits at the centre of the India steel supply chain, and any NMDC iron ore producer analysis starts with understanding how its ore quality, scale and logistics shape domestic steelmaking.
- As of FY2025, NMDC’s disclosed mining capacity is about 55 million tonnes per annum, with actual annual production about 45 million tonnes.
- Proven/potential reserves remaining under NMDC’s control (all mines combined) are estimated at over 1,400 million tonnes of iron ore across its various leases in Chhattisgarh and Karnataka.
Recent Extraction
- FY2025 target/actual: Aiming for 55 million tonnes output, with actual production expected to be close to 50–52 million tonnes if operational disruptions are avoided.
- YTD (up to October 2025): Cumulative iron ore production stands at 26.47 million tonnes (April–October 2025).
- Monthly run-rate: Most recent months’ production ranges between 3.4–4.3 million tonnes per month.
Remaining Resource/Life
- At the current extraction rate (45–50 MT/year), the remaining proven reserves imply a life of 25–30+ years for NMDC’s existing mines.
Brief Summary Table
| Segment | Estimated Reserves | FY25 Production | Remaining Mine Life |
|---|---|---|---|
| Chhattisgarh | 1,200 MT | 33 MT (FY25) | 35+ years |
| Karnataka | 250 MT | 17 MT (FY25) | 15+ years |
| Total (est.) | 1,400 MT | 50 MT (FY25) | 25–30+ years |
NMDC continues to expand its capacities and aims to reach 100 MT/year by 2030, supported by brownfield and greenfield projects. Current mining operations have a robust runway of resources, ensuring stable production for the coming decade
Business Model and Operating Verticals
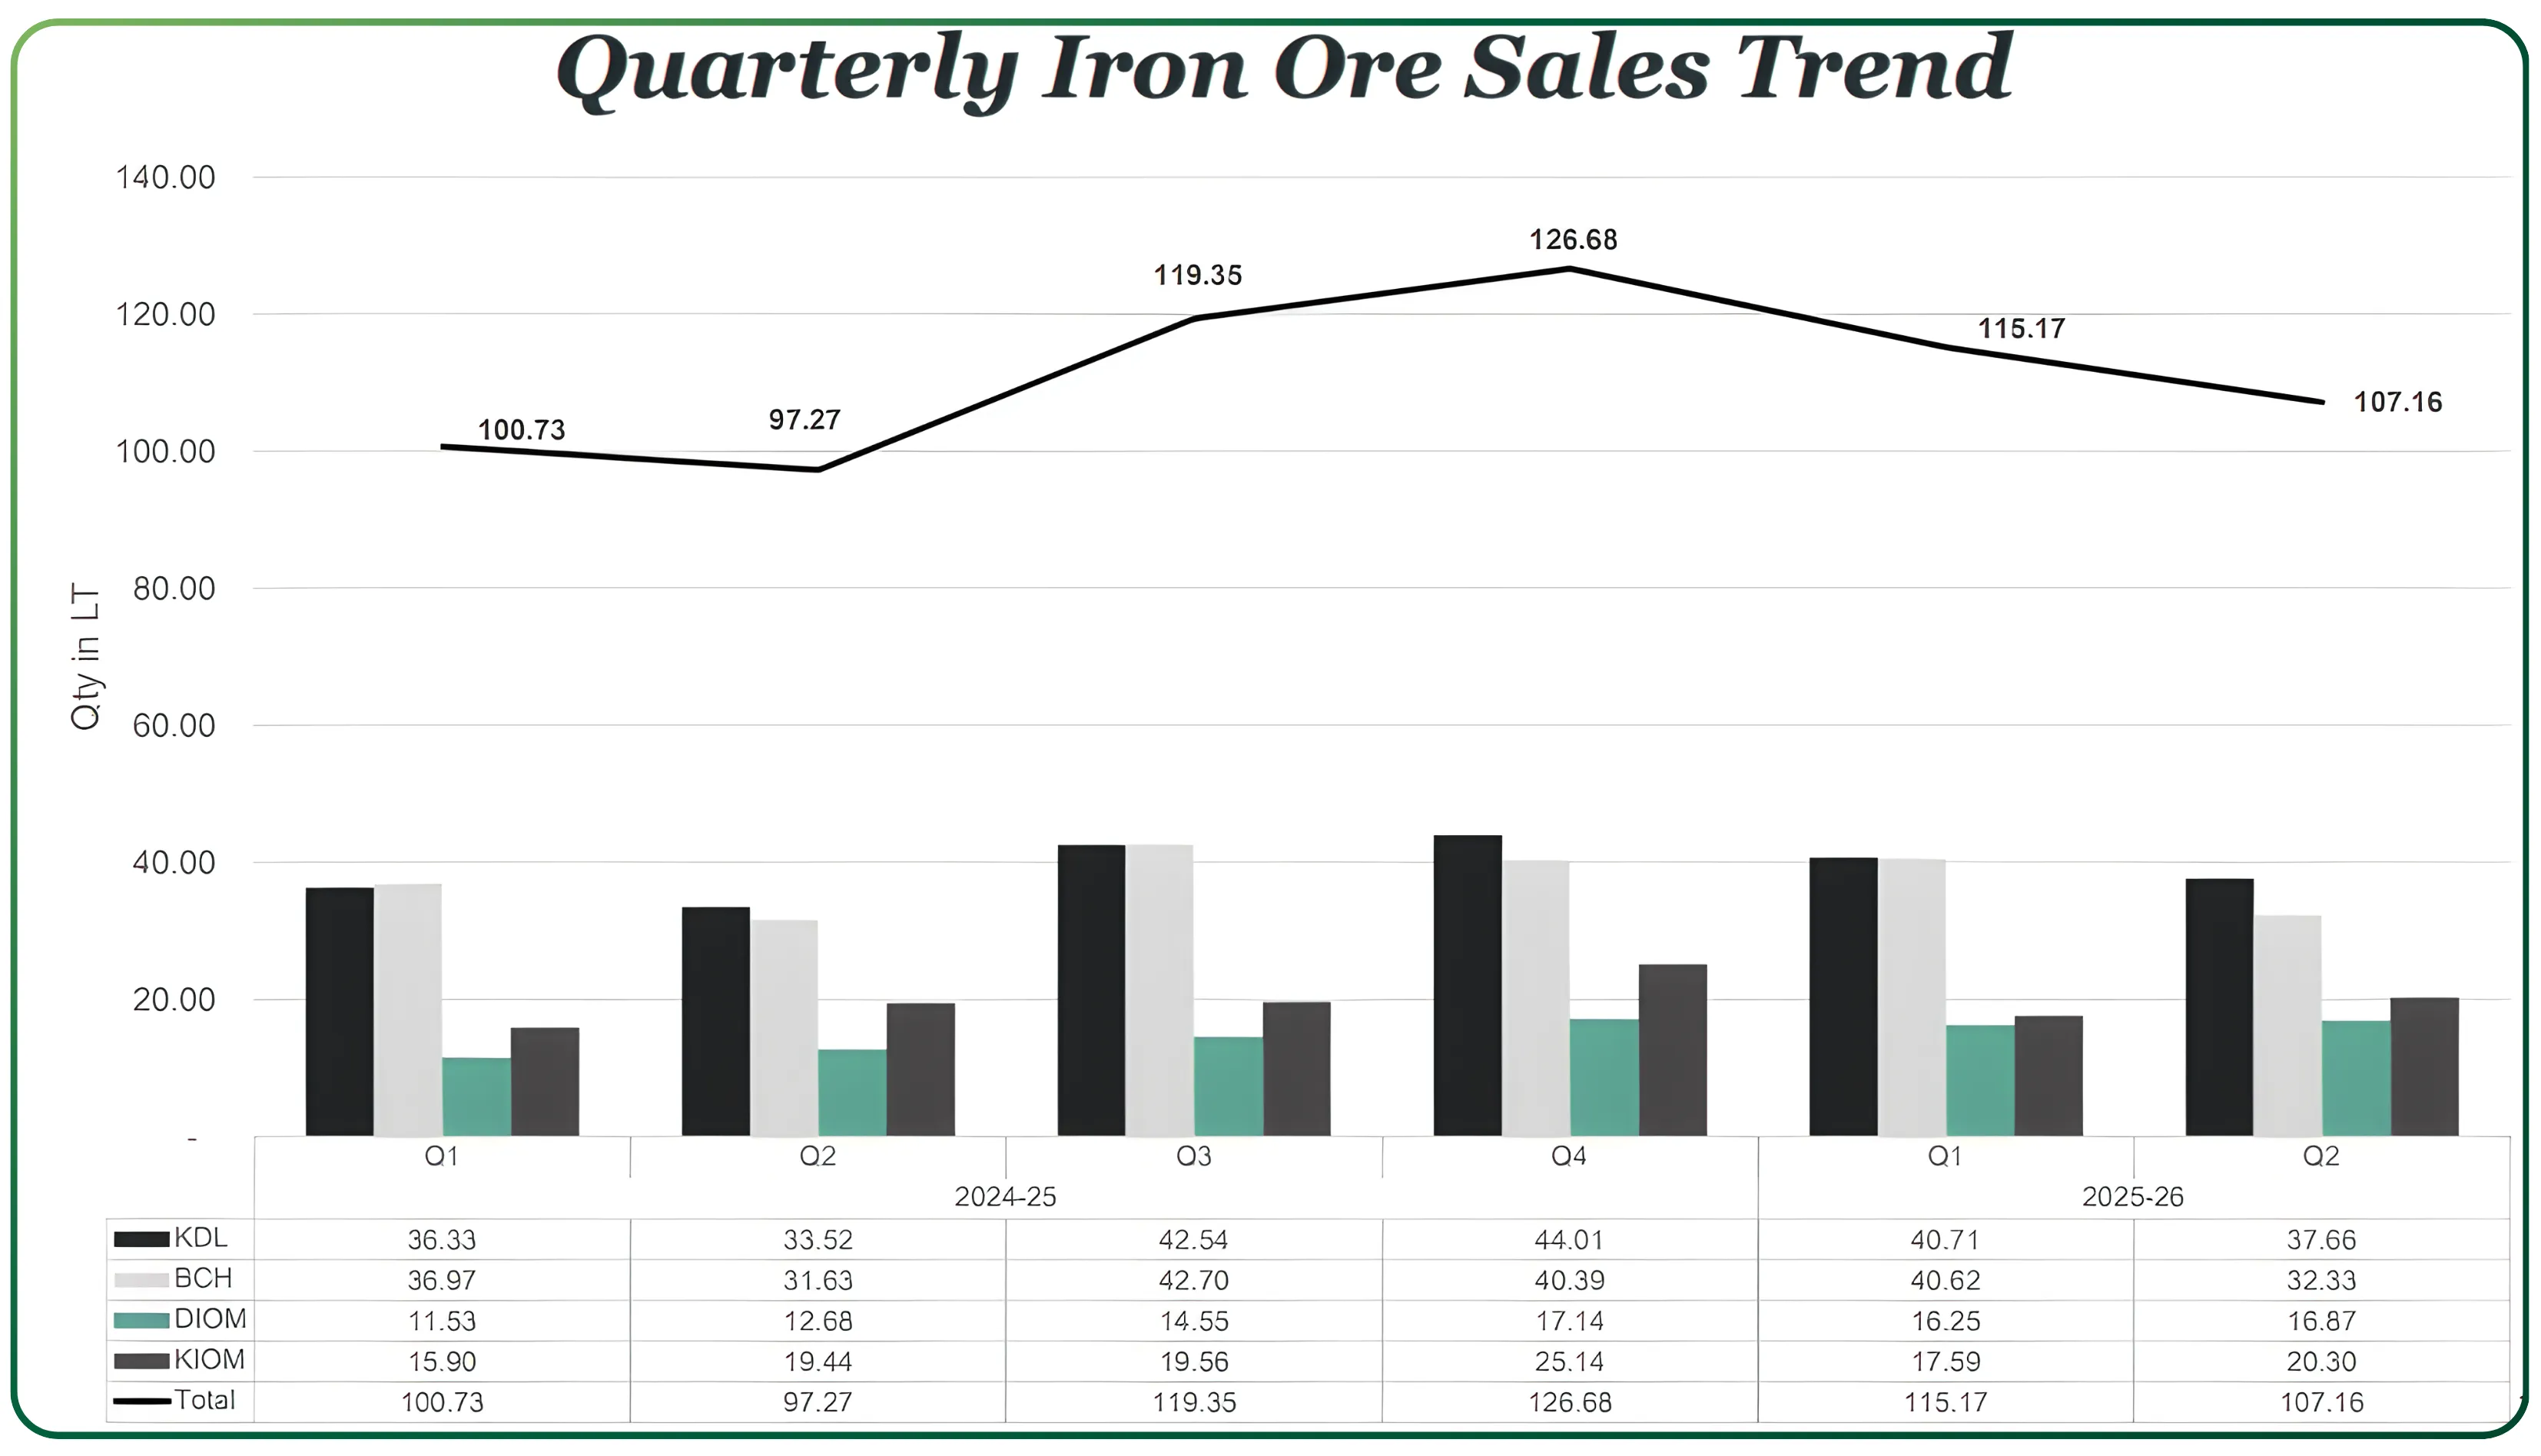
The company’s business is built almost entirely on iron ore mining and the sale of lumps and fines. Its major projects (Kirandul, Bacheli, Donimalai and Kumaraswamy) drive both production and profitability. Revenue is influenced by volumes, grade mix, and domestic iron ore prices, which in turn reflect demand conditions in steel.
Over the last few years NMDC has also added incremental value through pelletization, though the core profit engine remains its mining operations. Production and sales continue to trend upward, with FY26 H1 marking the company’s best-ever H1 performance in both metrics.
The company’s long reserve life capacity at Kirandul, Bacheli and Donimalai supports multi-decade visibility. This also anchors NMDC’s cost advantage mining profile, which continues to be a major differentiator against private miners
If you’re tracking India’s broader industrial landscape, you may also want to read our detailed report: India’s Maritime Economy — Complete Sector Analysis (Part 1/3). It gives a clear view of how ports, shipping, and coastal logistics are shaping long-term trade opportunities.
Revenue Mix
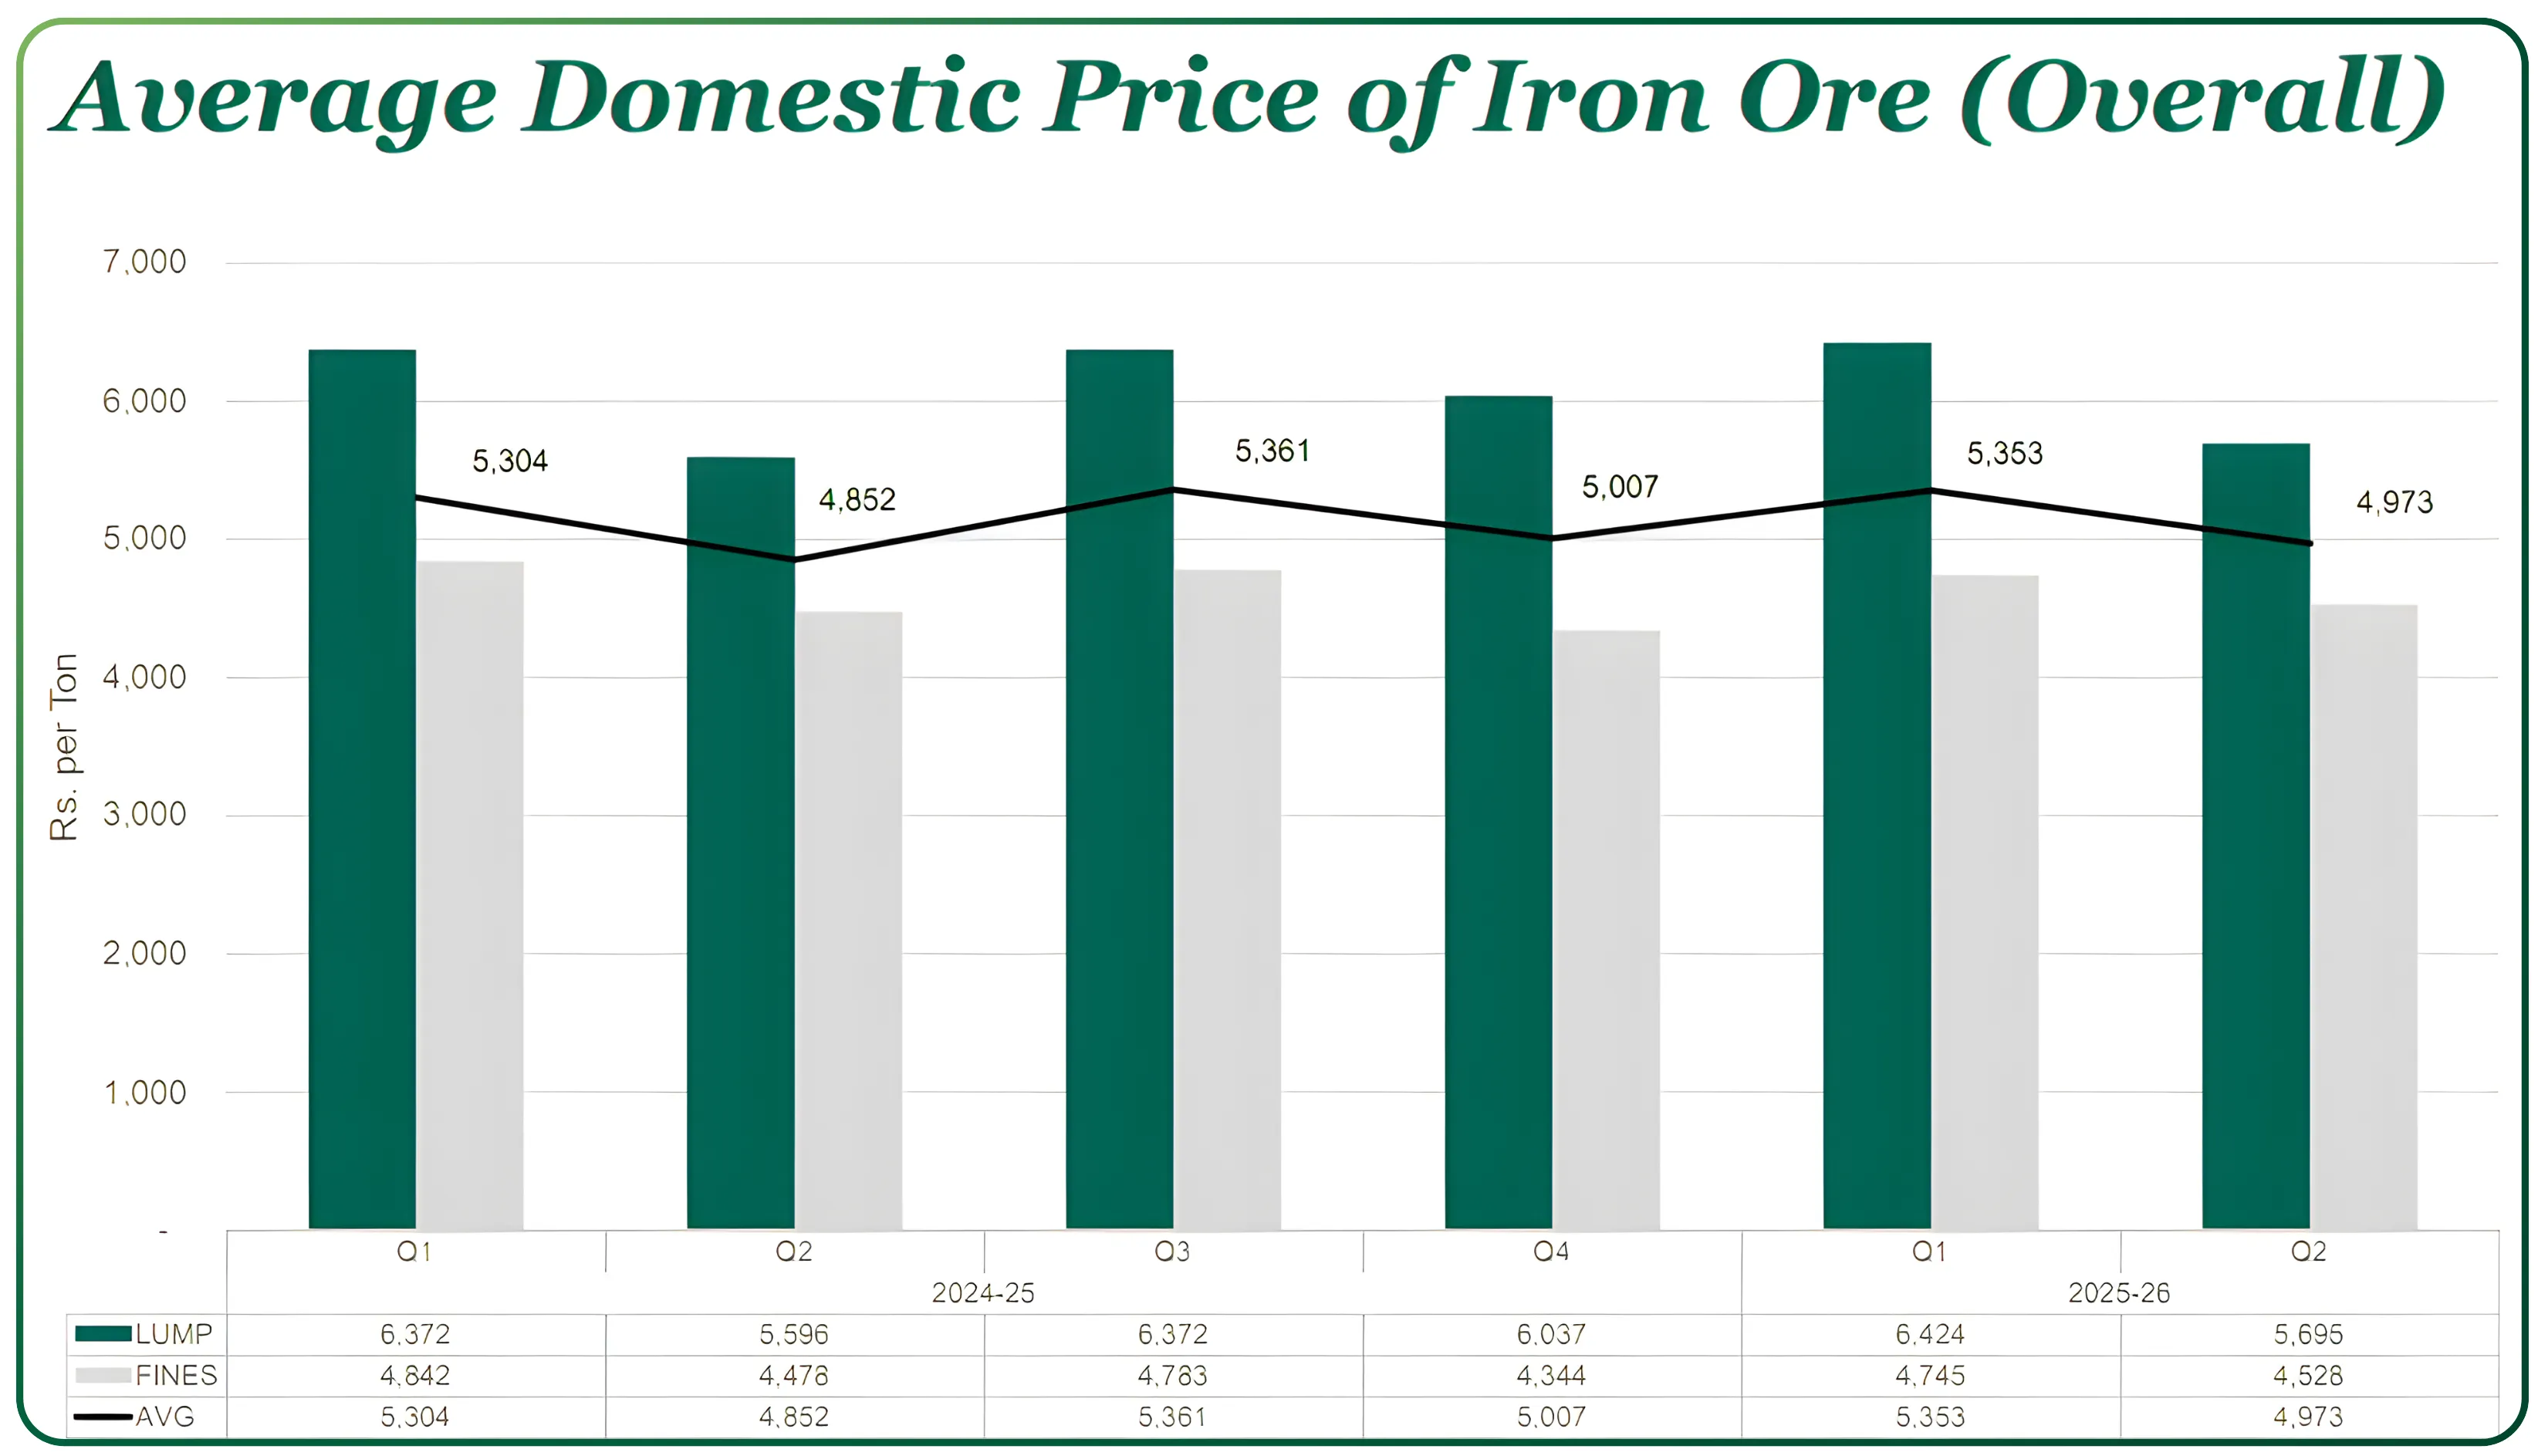
Iron ore contributes nearly the entire revenue base, with sales depending on dispatches of lumps and fines. Realisations move with market pricing—FY26 Q2 average realisation stood at ₹4,973 per tonne, marginally lower sequentially but higher year on year. The mix is skewed toward lumps in value terms and toward fines in volume terms.
Over the last few years NMDC has also added incremental value through pelletization, though the core profit engine remains its mining operations. Production and sales continue to trend upward, with FY26 H1 marking the company’s best-ever H1 performance in both metrics.
Over the last few years NMDC has also added incremental value through pelletization, though the core profit engine remains its mining operations. Production and sales continue to trend upward, with FY26 H1 marking the company’s best-ever H1 performance in both metrics.
Five-Year Financial Trend (₹ crore)
| Fiscal Year | Sales | Operating Profit | OPM % | Net Profit |
|---|---|---|---|---|
| FY21 | 15,370 | 8,790 | 57 | 6,277 |
| FY22 | 25,965 | 12,626 | 51 | 9,429 |
| FY23 | 17,667 | 6,054 | 57 | 5,601 |
| FY24 | 21,308 | 7,294 | 49 | 5,567 |
| FY25 | 23,906 | 8,150 | 34 | 6,520 |
| TTM | 26,689 | 8,895 | 33 | 7,022 |
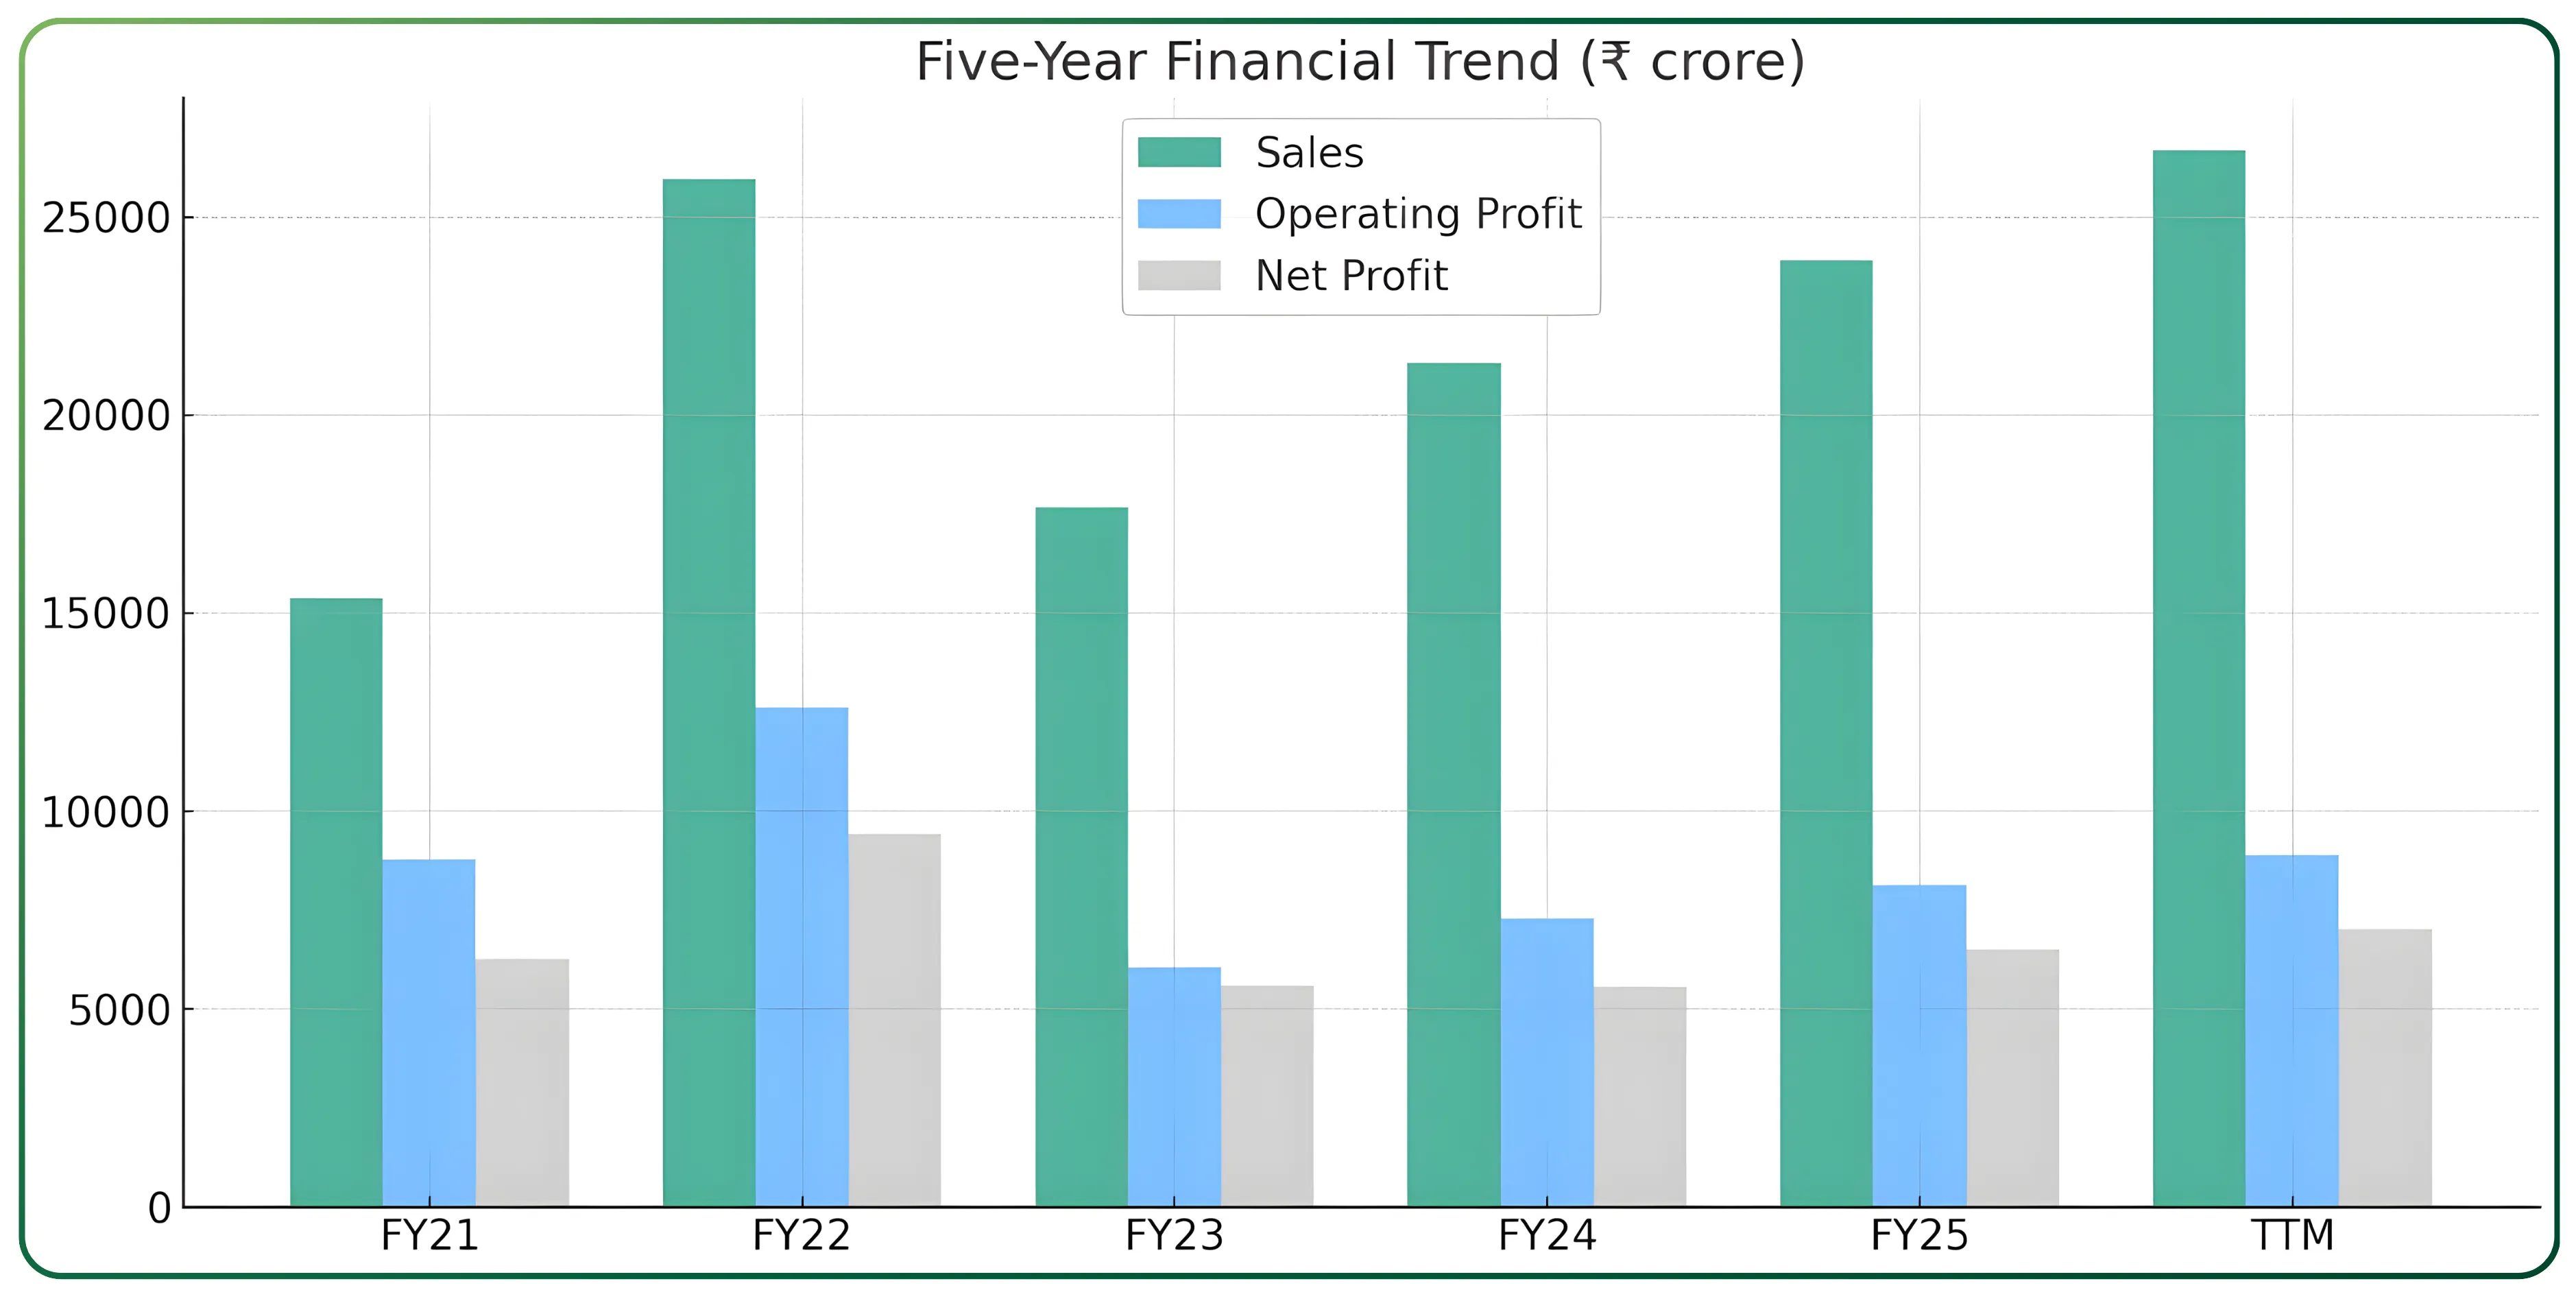
NMDC’s numbers tell a cyclical but structurally strong story. Revenue rose from ₹15,370 crore in FY21 to ₹26,689 crore on a TTM basis. The operating profit pattern mirrors commodity cycles: OPM expanded to 57% in FY21 and FY23, slipped to 34% in FY25, and currently stands close to 33% on a TTM basis. Despite these swings, profitability remains high because NMDC runs with a lean cost structure and benefits from economies of scale. Net profit moved from ₹6,277 crore in FY21 to ₹7,022 crore TTM, largely tracking the movement in realisations and levies. A closer look at NMDC financial performance FY25 FY26 shows rising volumes, stable realisations and a return to operating leverage as H1 FY26 delivered the best production in the company's history.
Balance Sheet and Cash Flow Snapshot
The balance sheet remains one of the cleanest in the metals and mining space. Debt-to-equity is 0.11, the company ends most years in a net-cash position, and liquidity is solid with a current ratio of 2.87. Working capital is structurally light because dispatch cycles are short and customers are typically large steel mills. Operating cash flows are healthy, although capex for mine expansion and value-added projects can vary year to year. High free cash generation supports strong dividends—reflected in a yield of 4.36%.
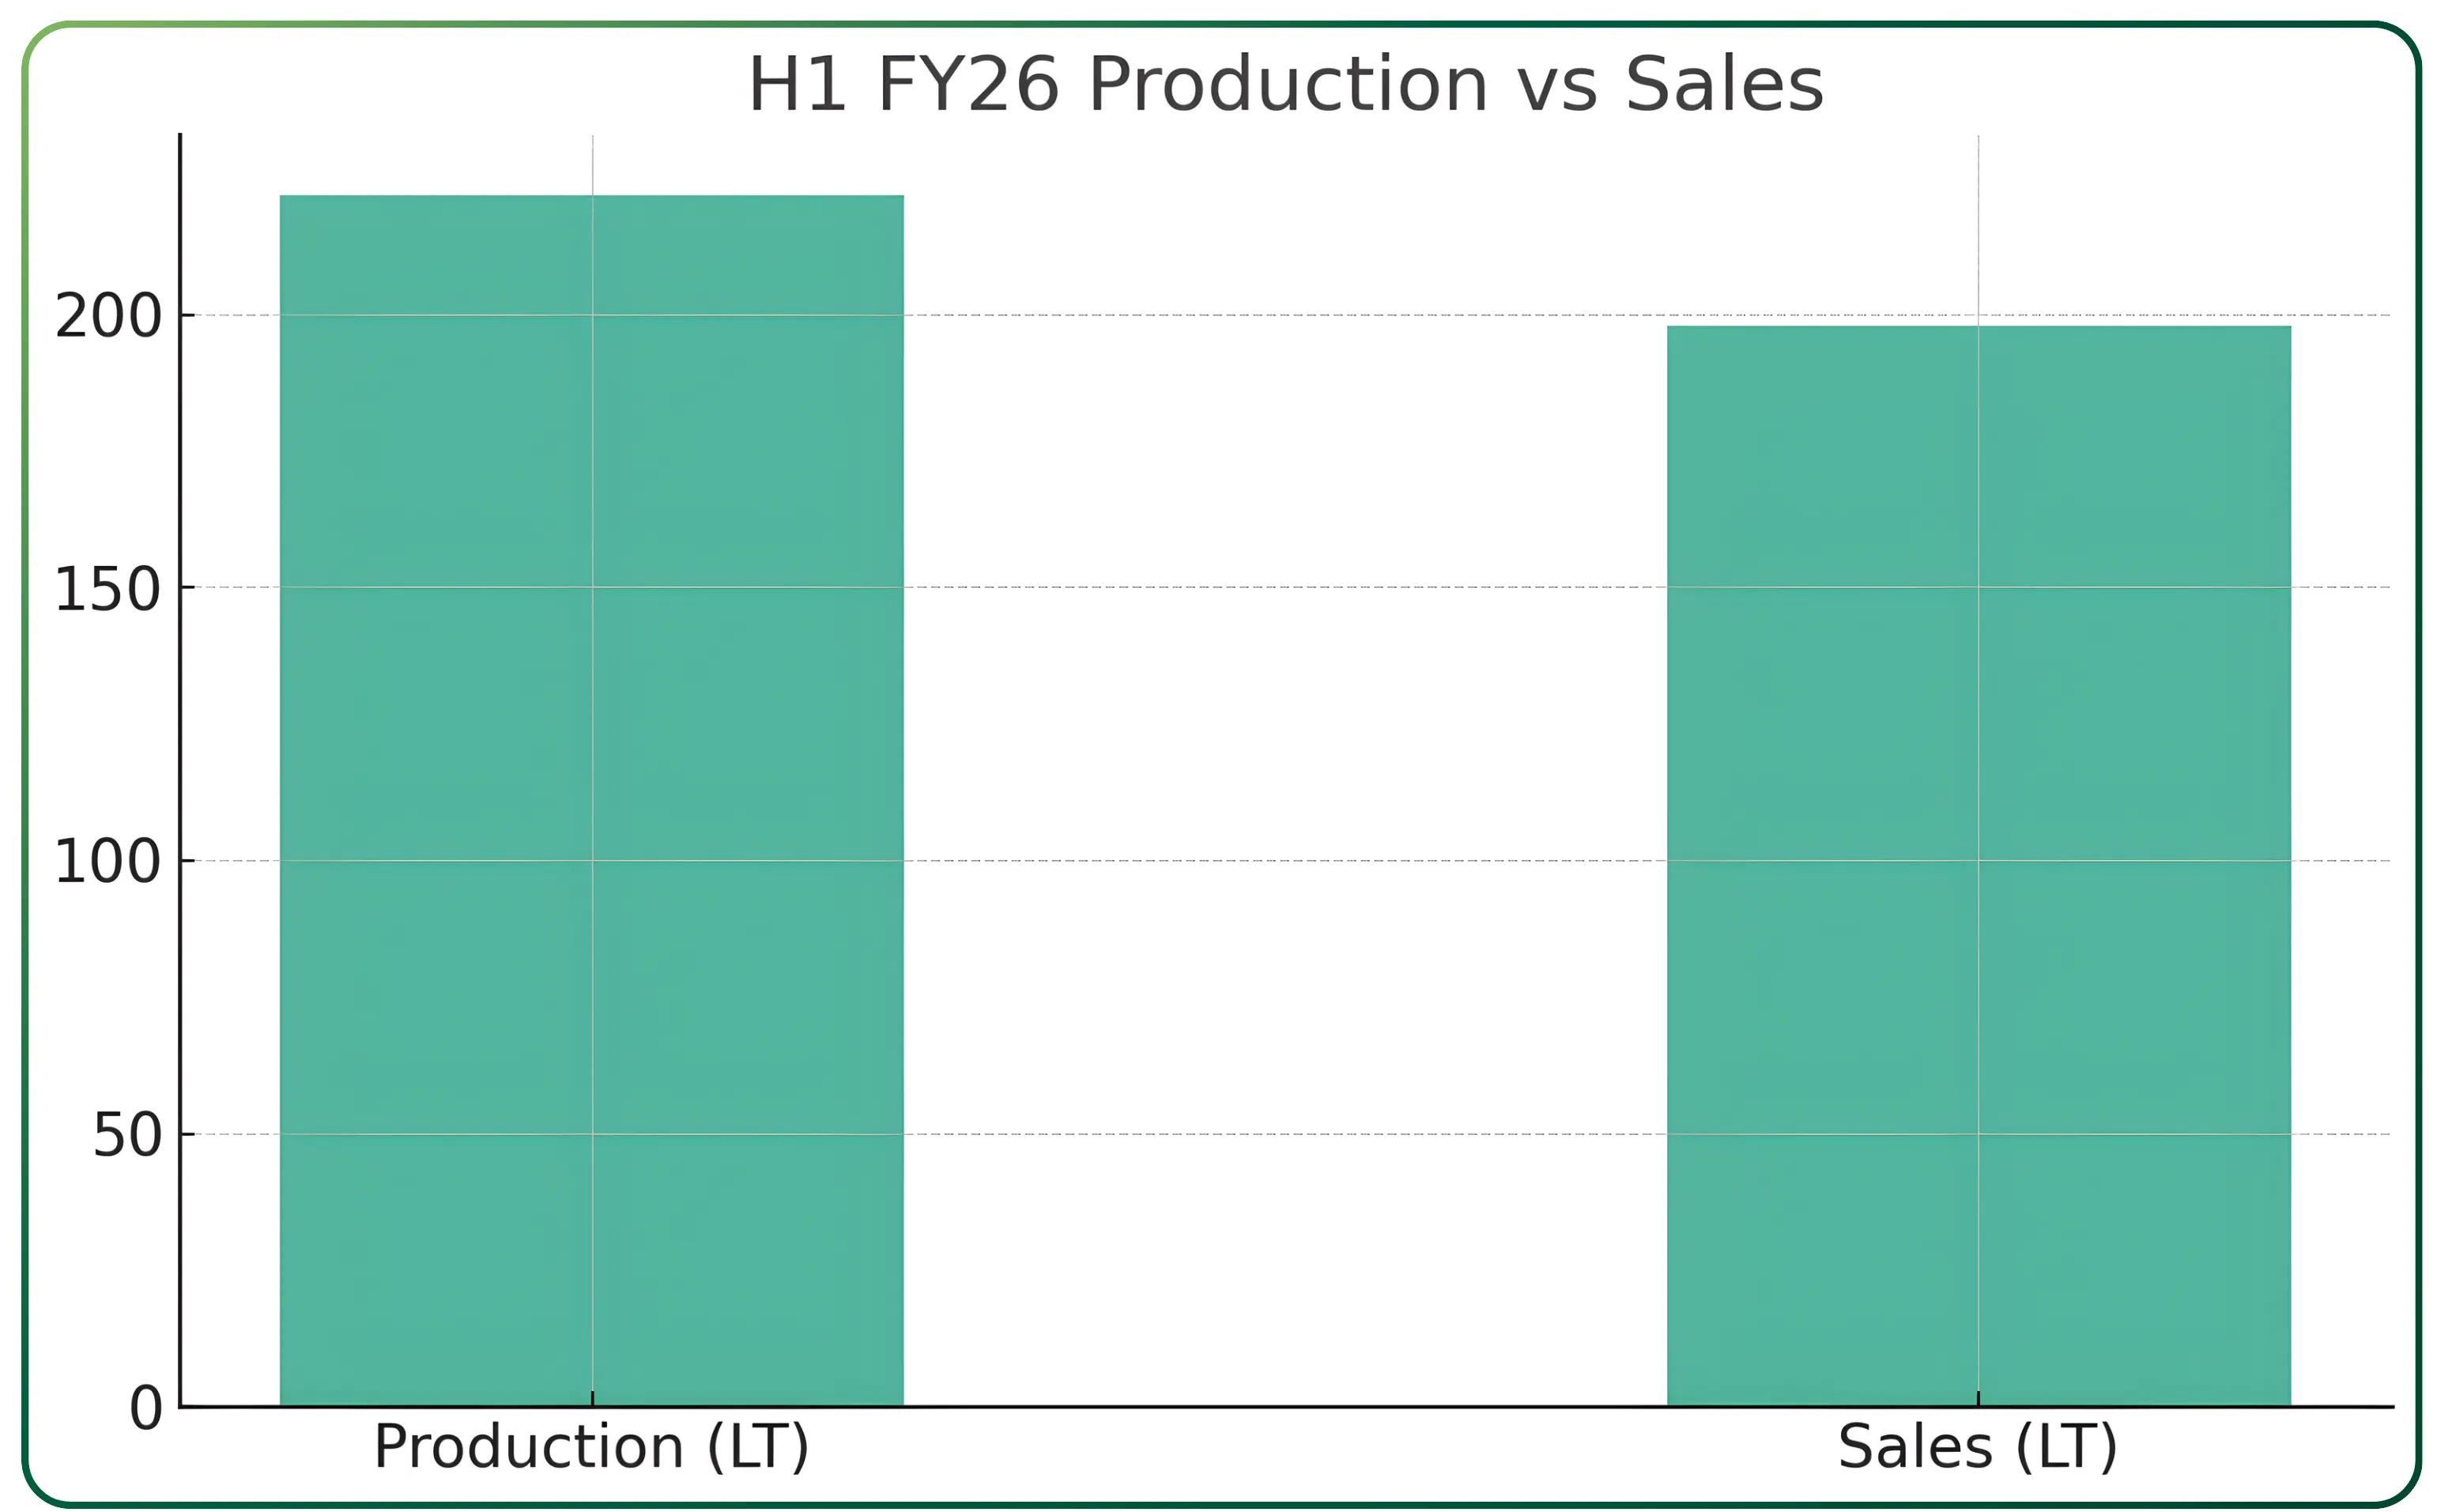
Operational Performance (H1 FY26)
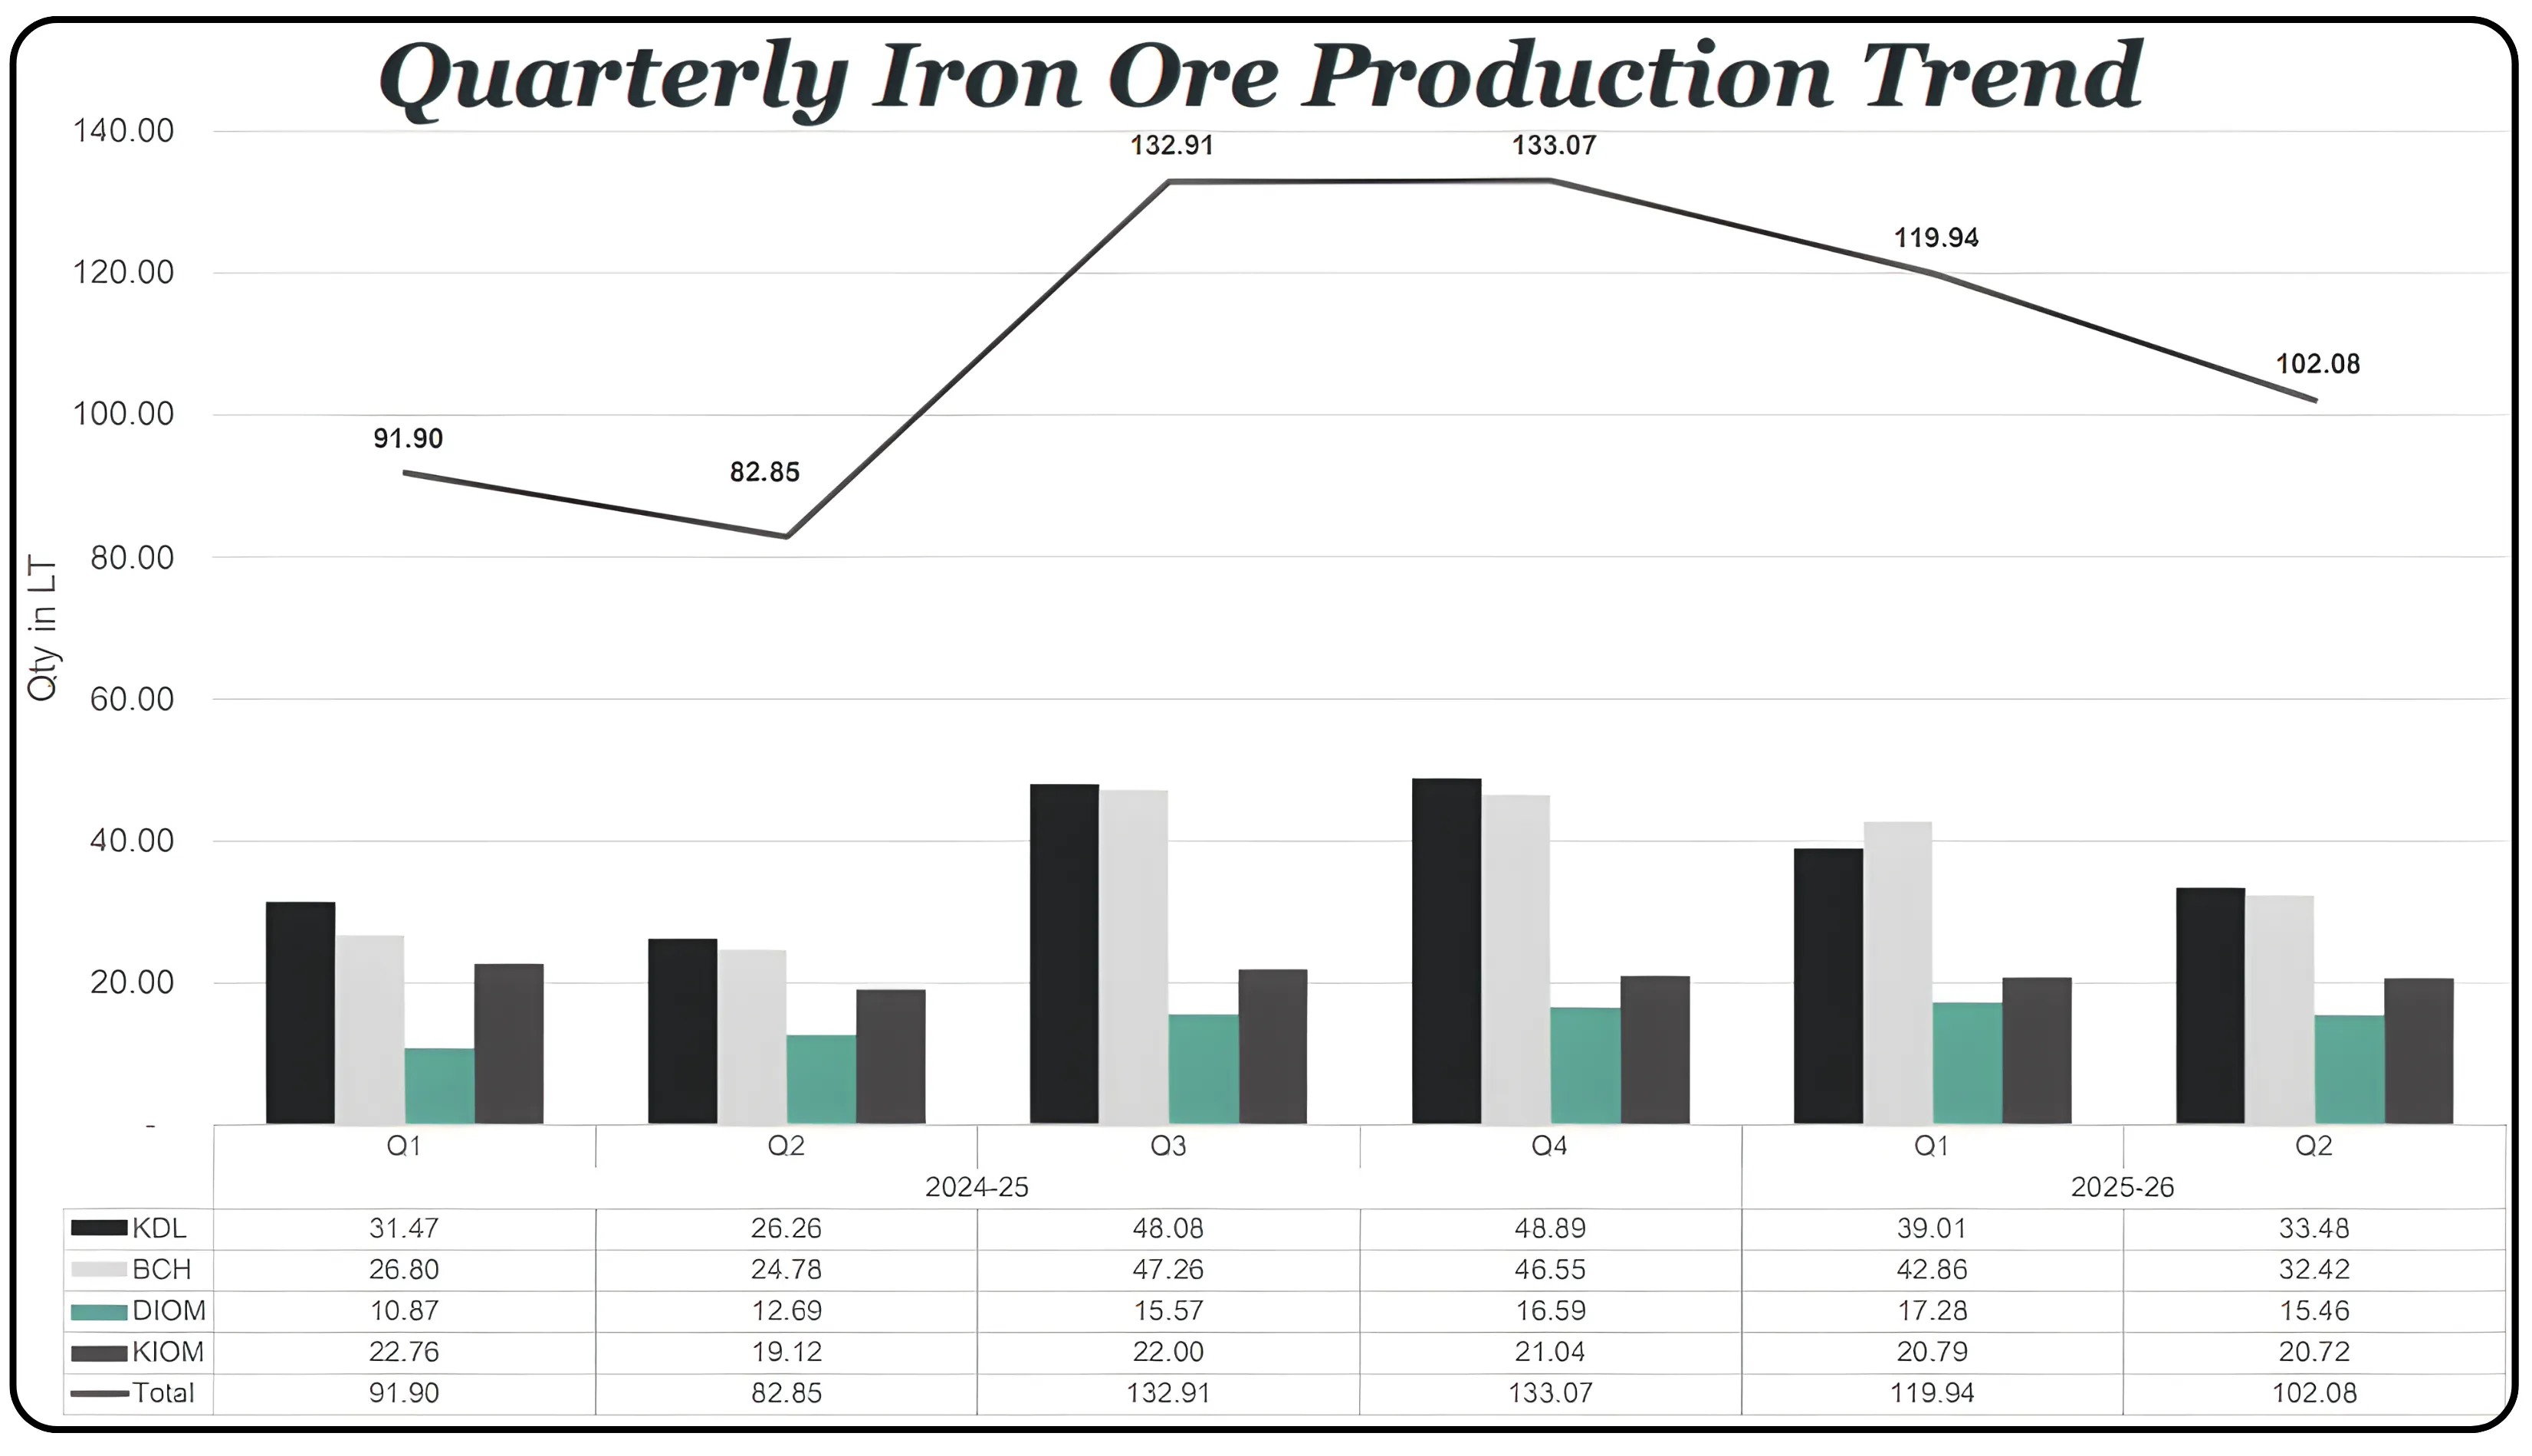
Volumes have picked up meaningfully. Production in H1 FY26 touched 222 LT, up 27% from the previous year. Sales grew 12% to 198 LT. Revenue from operations rose to ₹12,895 crore, also up 27%. EBITDA expanded 14% to ₹5,162 crore in the same period. PAT rose 13% to ₹3,663 crore. This push in volumes has come even as realisations remained steady and cost pressures moderated.
If you like exploring strong manufacturing stories, you might also want to read our analysis on Action Construction Equipment: Is Action Construction Equipment Rising to Become India’s Biggest Equipment Powerhouse? It’s a sharp look at how the company is scaling in a fast-growing capex cycle.
Valuation Perspective Based on Forward Earnings
At the current price of ₹75.7, NMDC trades at a trailing P/E of 9.47. To understand how the market is pricing the company beyond the ongoing cycle, it makes more sense to look ahead rather than back. With the first half of FY26 already reported, a true forward multiple should be anchored to FY27 earnings, where management’s volume guidance and operating stability will fully reflect in the numbers.
Using the reported EPS of 7.99 and TTM PAT of ₹7,022 crore, the implied share count comes to about 879 crore shares. Based on this, NMDC’s forward earnings potential under different operating outcomes is straightforward to map.
If PAT settles around ₹8,000 crore next year, which is a reasonable interpretation given the ramp-up in H1 FY26, the forward EPS lands near ₹9.10. At today’s price, that implies a forward P/E of about 8.3 times. Even under a conservative case with PAT of ₹7,500 crore, the stock trades at 8.9 times forward earnings. And if volumes and realisations hold slightly above trend, pushing PAT toward ₹8,500 crore, the valuation drops to 7.8 times.
What this really means is that the stock continues to be valued more like a cyclical PSU than a high-return, low-debt business. NMDC’s own long-term mid-cycle multiples and the broader industry P/E of 20 both sit well above these levels. The market is clearly embedding commodity volatility and regulatory risk, but on cash flows and return ratios, the stock still looks inexpensive on a forward basis.
NMDC Forward Valuation Table
| Scenario | Forward PAT (₹ cr) | Forward EPS (₹) | Implied Forward P/E at ₹75.7 |
|---|---|---|---|
| Conservative | 7,500 | 8.53 | 8.87 |
| Base Case | 8,000 | 9.10 | 8.31 |
| Optimistic | 8,500 | 9.67 | 7.83 |
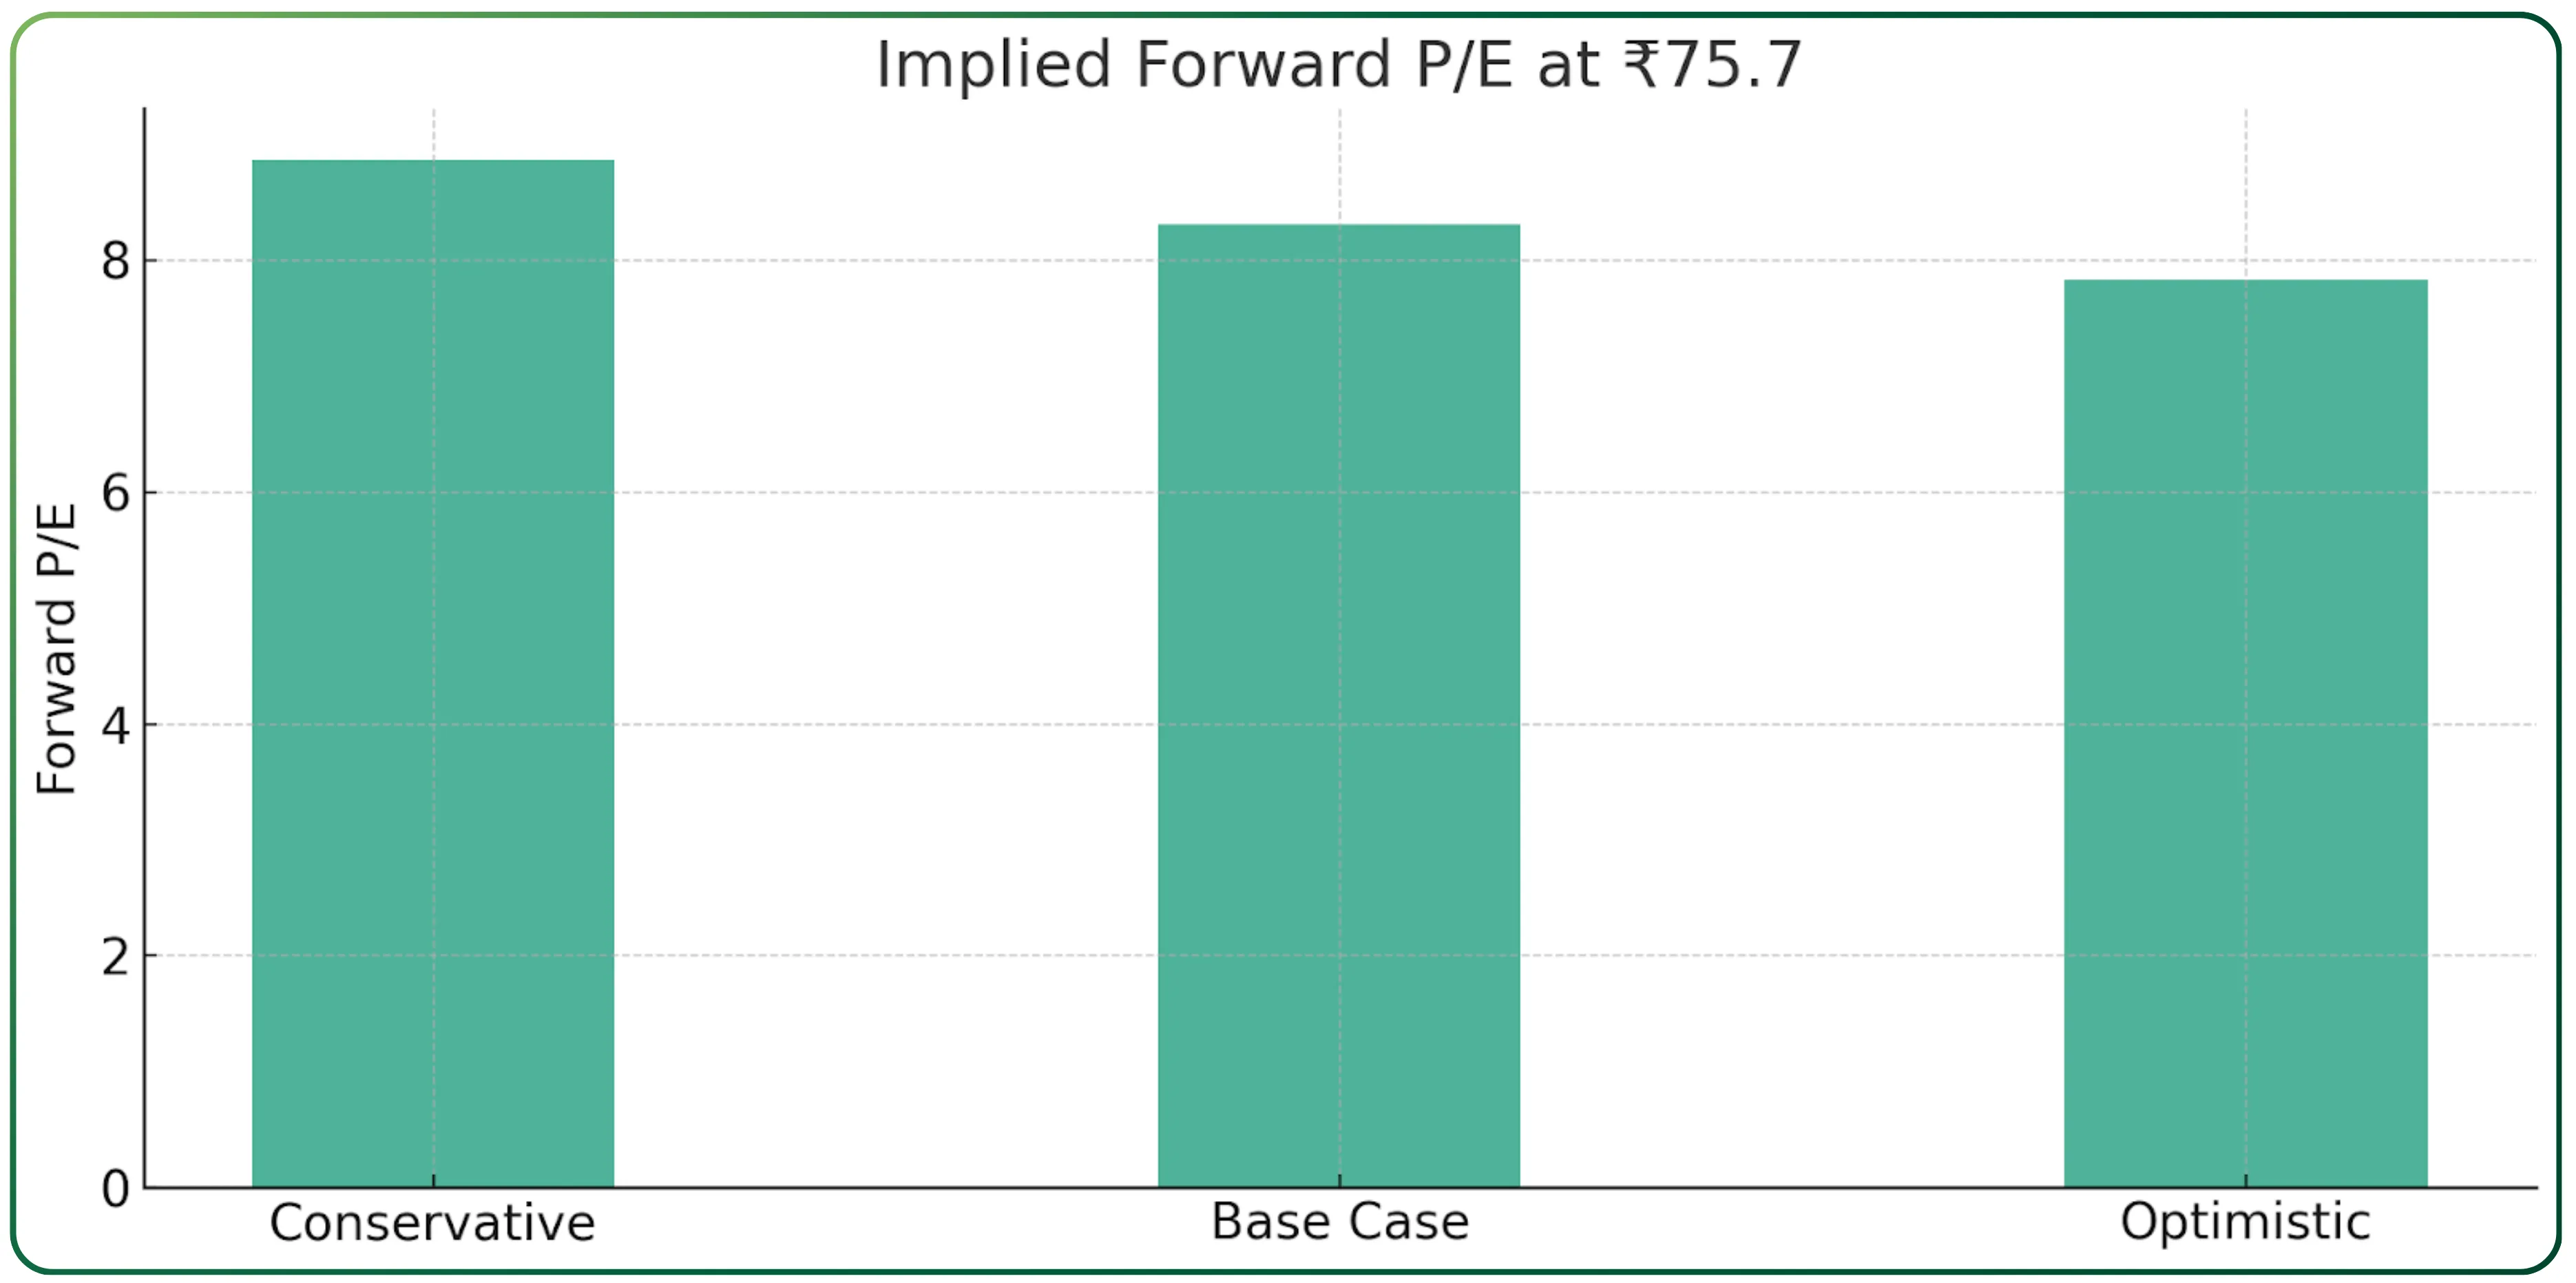
This sets up a valuation band of roughly 7.8 to 8.9 times FY27 earnings, keeping price constant. It frames NMDC as a business whose fundamentals are improving faster than the multiple the market is willing to assign.
NMDC EV/EBITDA Sensitivity (₹ crore)
This helps show how valuation shifts under different EBITDA outcomes. (Current EV/EBITDA: 5.71)
Assumptions: EV constant at current levels; EBITDA varies based on volume–price cycles.
| Scenario | EBITDA (₹ cr) | Implied EV/EBITDA |
|---|---|---|
| Bear Case | 7,500 | 6.8 |
| Base Case | 8,900 | 5.7 |
| Bull Case | 10,000 | 5.1 |
| High Upside Case | 11,000 | 4.6 |
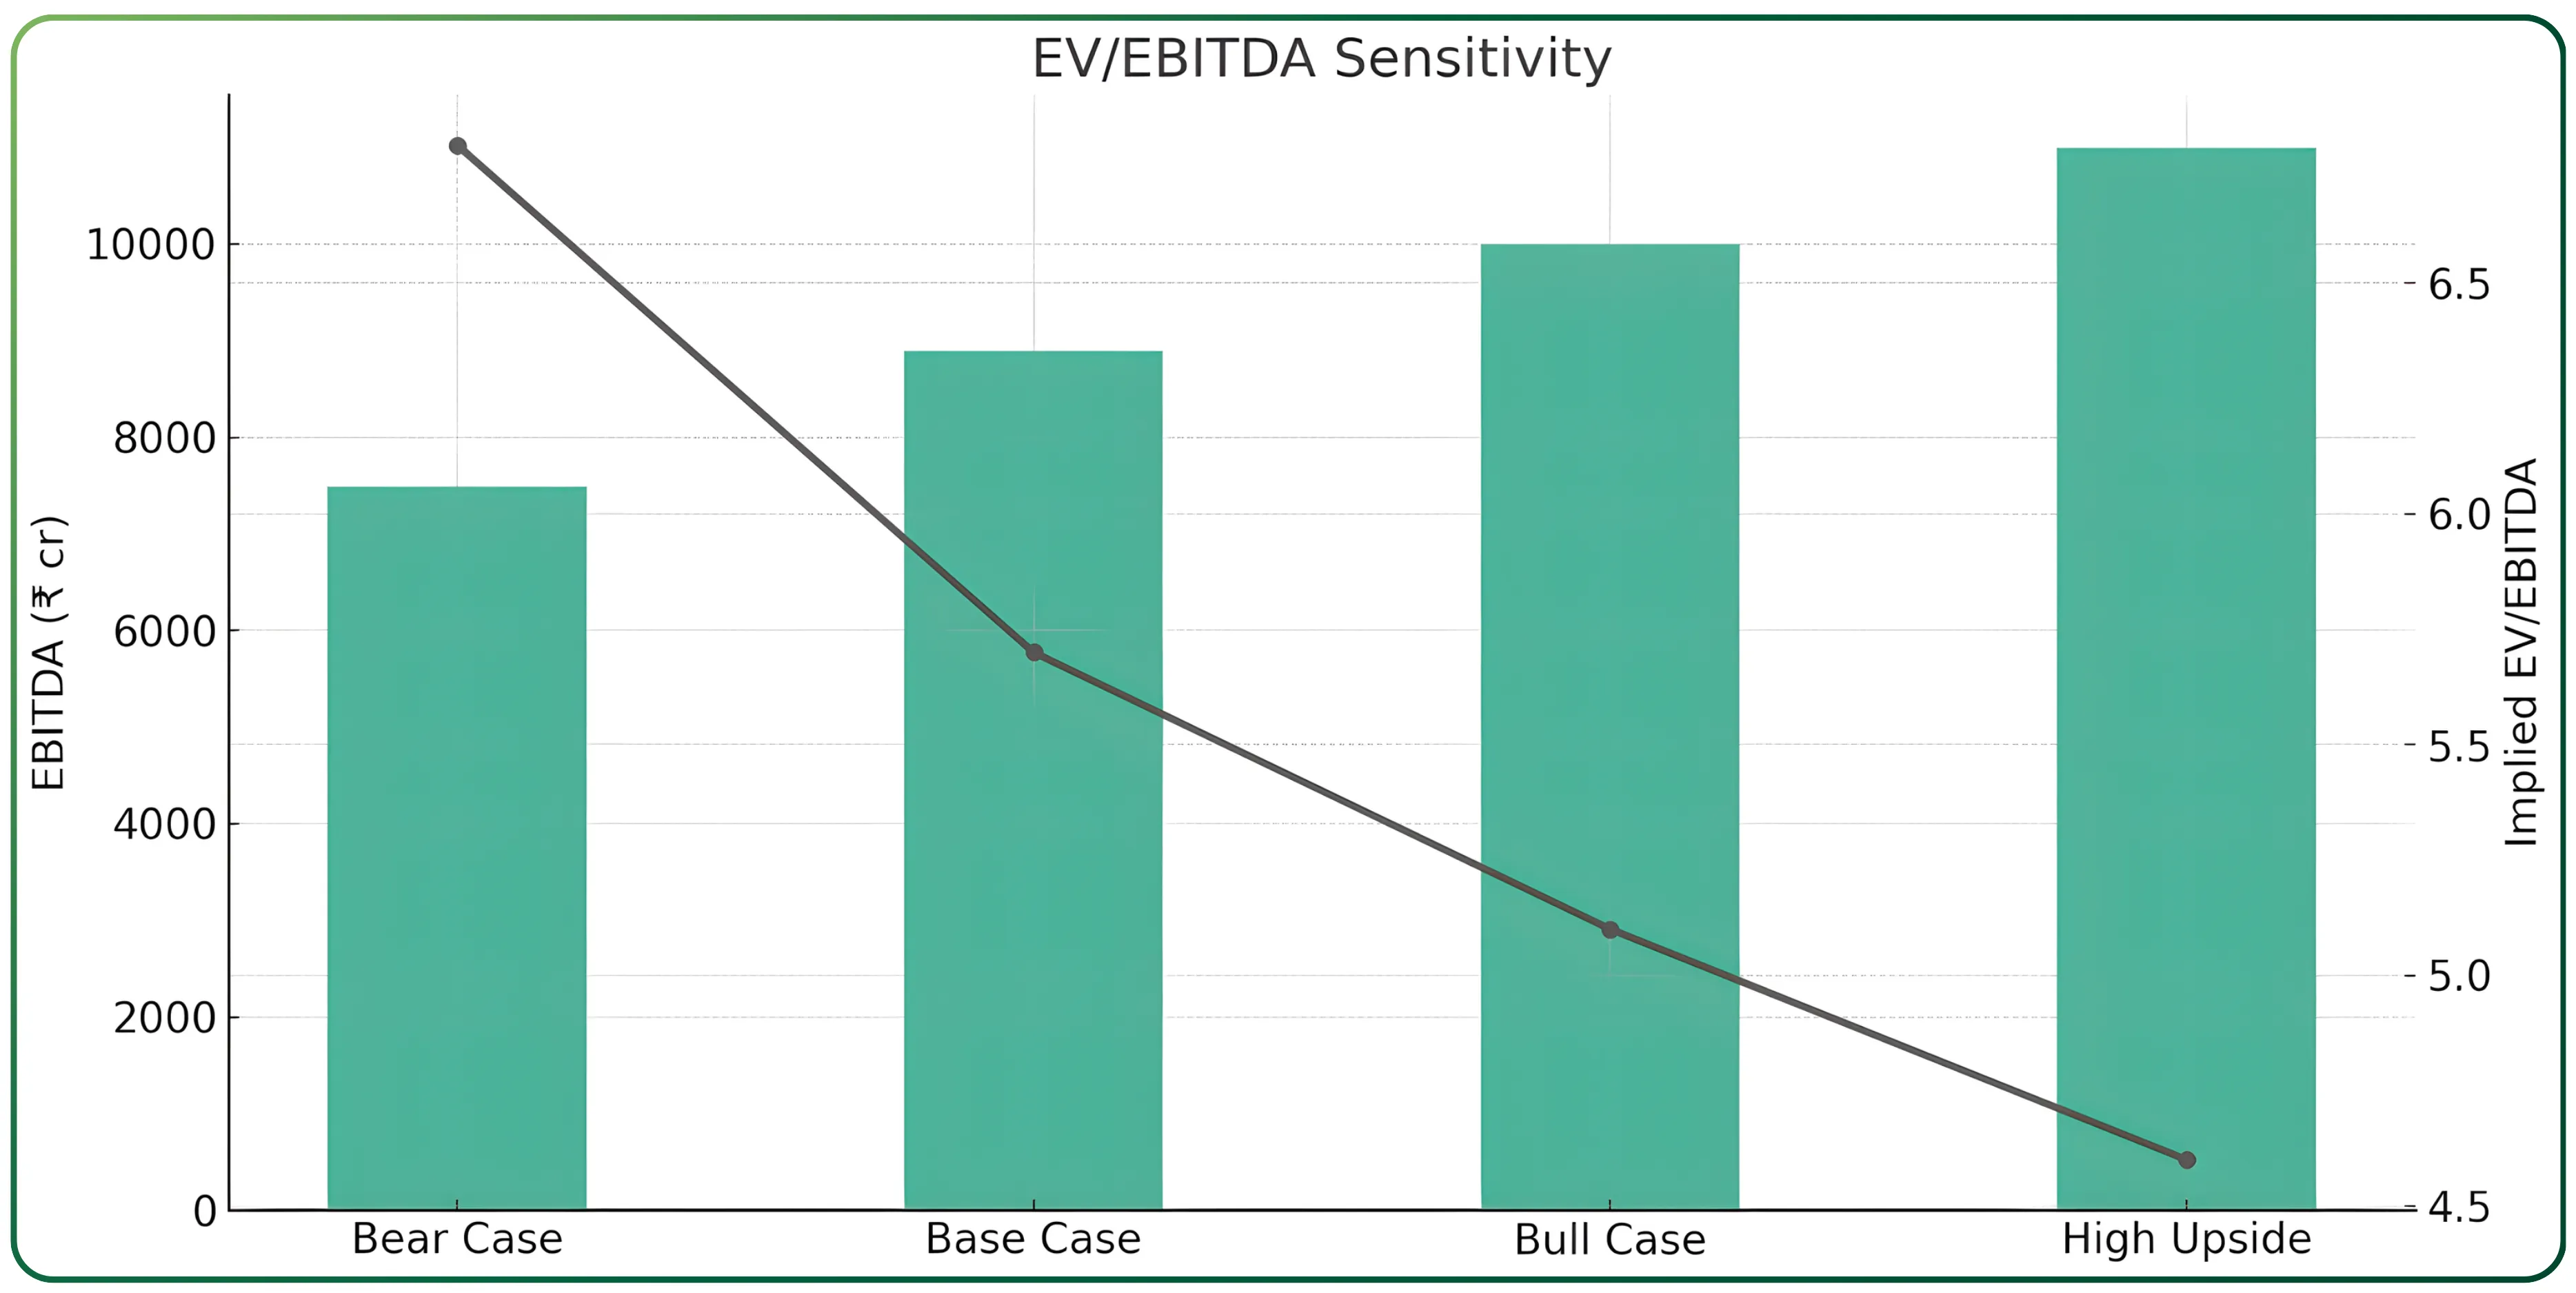
EV/EBITDA helps capture how the market is valuing NMDC’s core operating engine without distortion from dividends, cash reserves, or one-off items. With the current multiple near 5.7 times, the upside or downside largely depends on EBITDA movement, which in turn is driven by volumes, royalty intensity, and realisation trends. Even a moderate swing in EBITDA causes meaningful multiple compression because NMDC’s enterprise value is anchored by low debt and strong cash flows. The sensitivity table highlights this clearly: as EBITDA moves from ₹7,500 crore (bear case) to ₹11,000 crore (high upside), the valuation shifts from 6.8 to 4.6 times. For a mining business with long reserve life and stable cost structure, this shows how quickly the stock can look mispriced if operating leverage kicks in.
Volume–Margin Sensitivity Matrix
- NMDC’s earnings swing mainly with: Volume (LT)
- Realisation and operating margins
The matrix shows how PAT may move under different combinations.
Volume–Margin Matrix (PAT Sensitivity)
(PAT in ₹ crore; margins refer to OPM.)
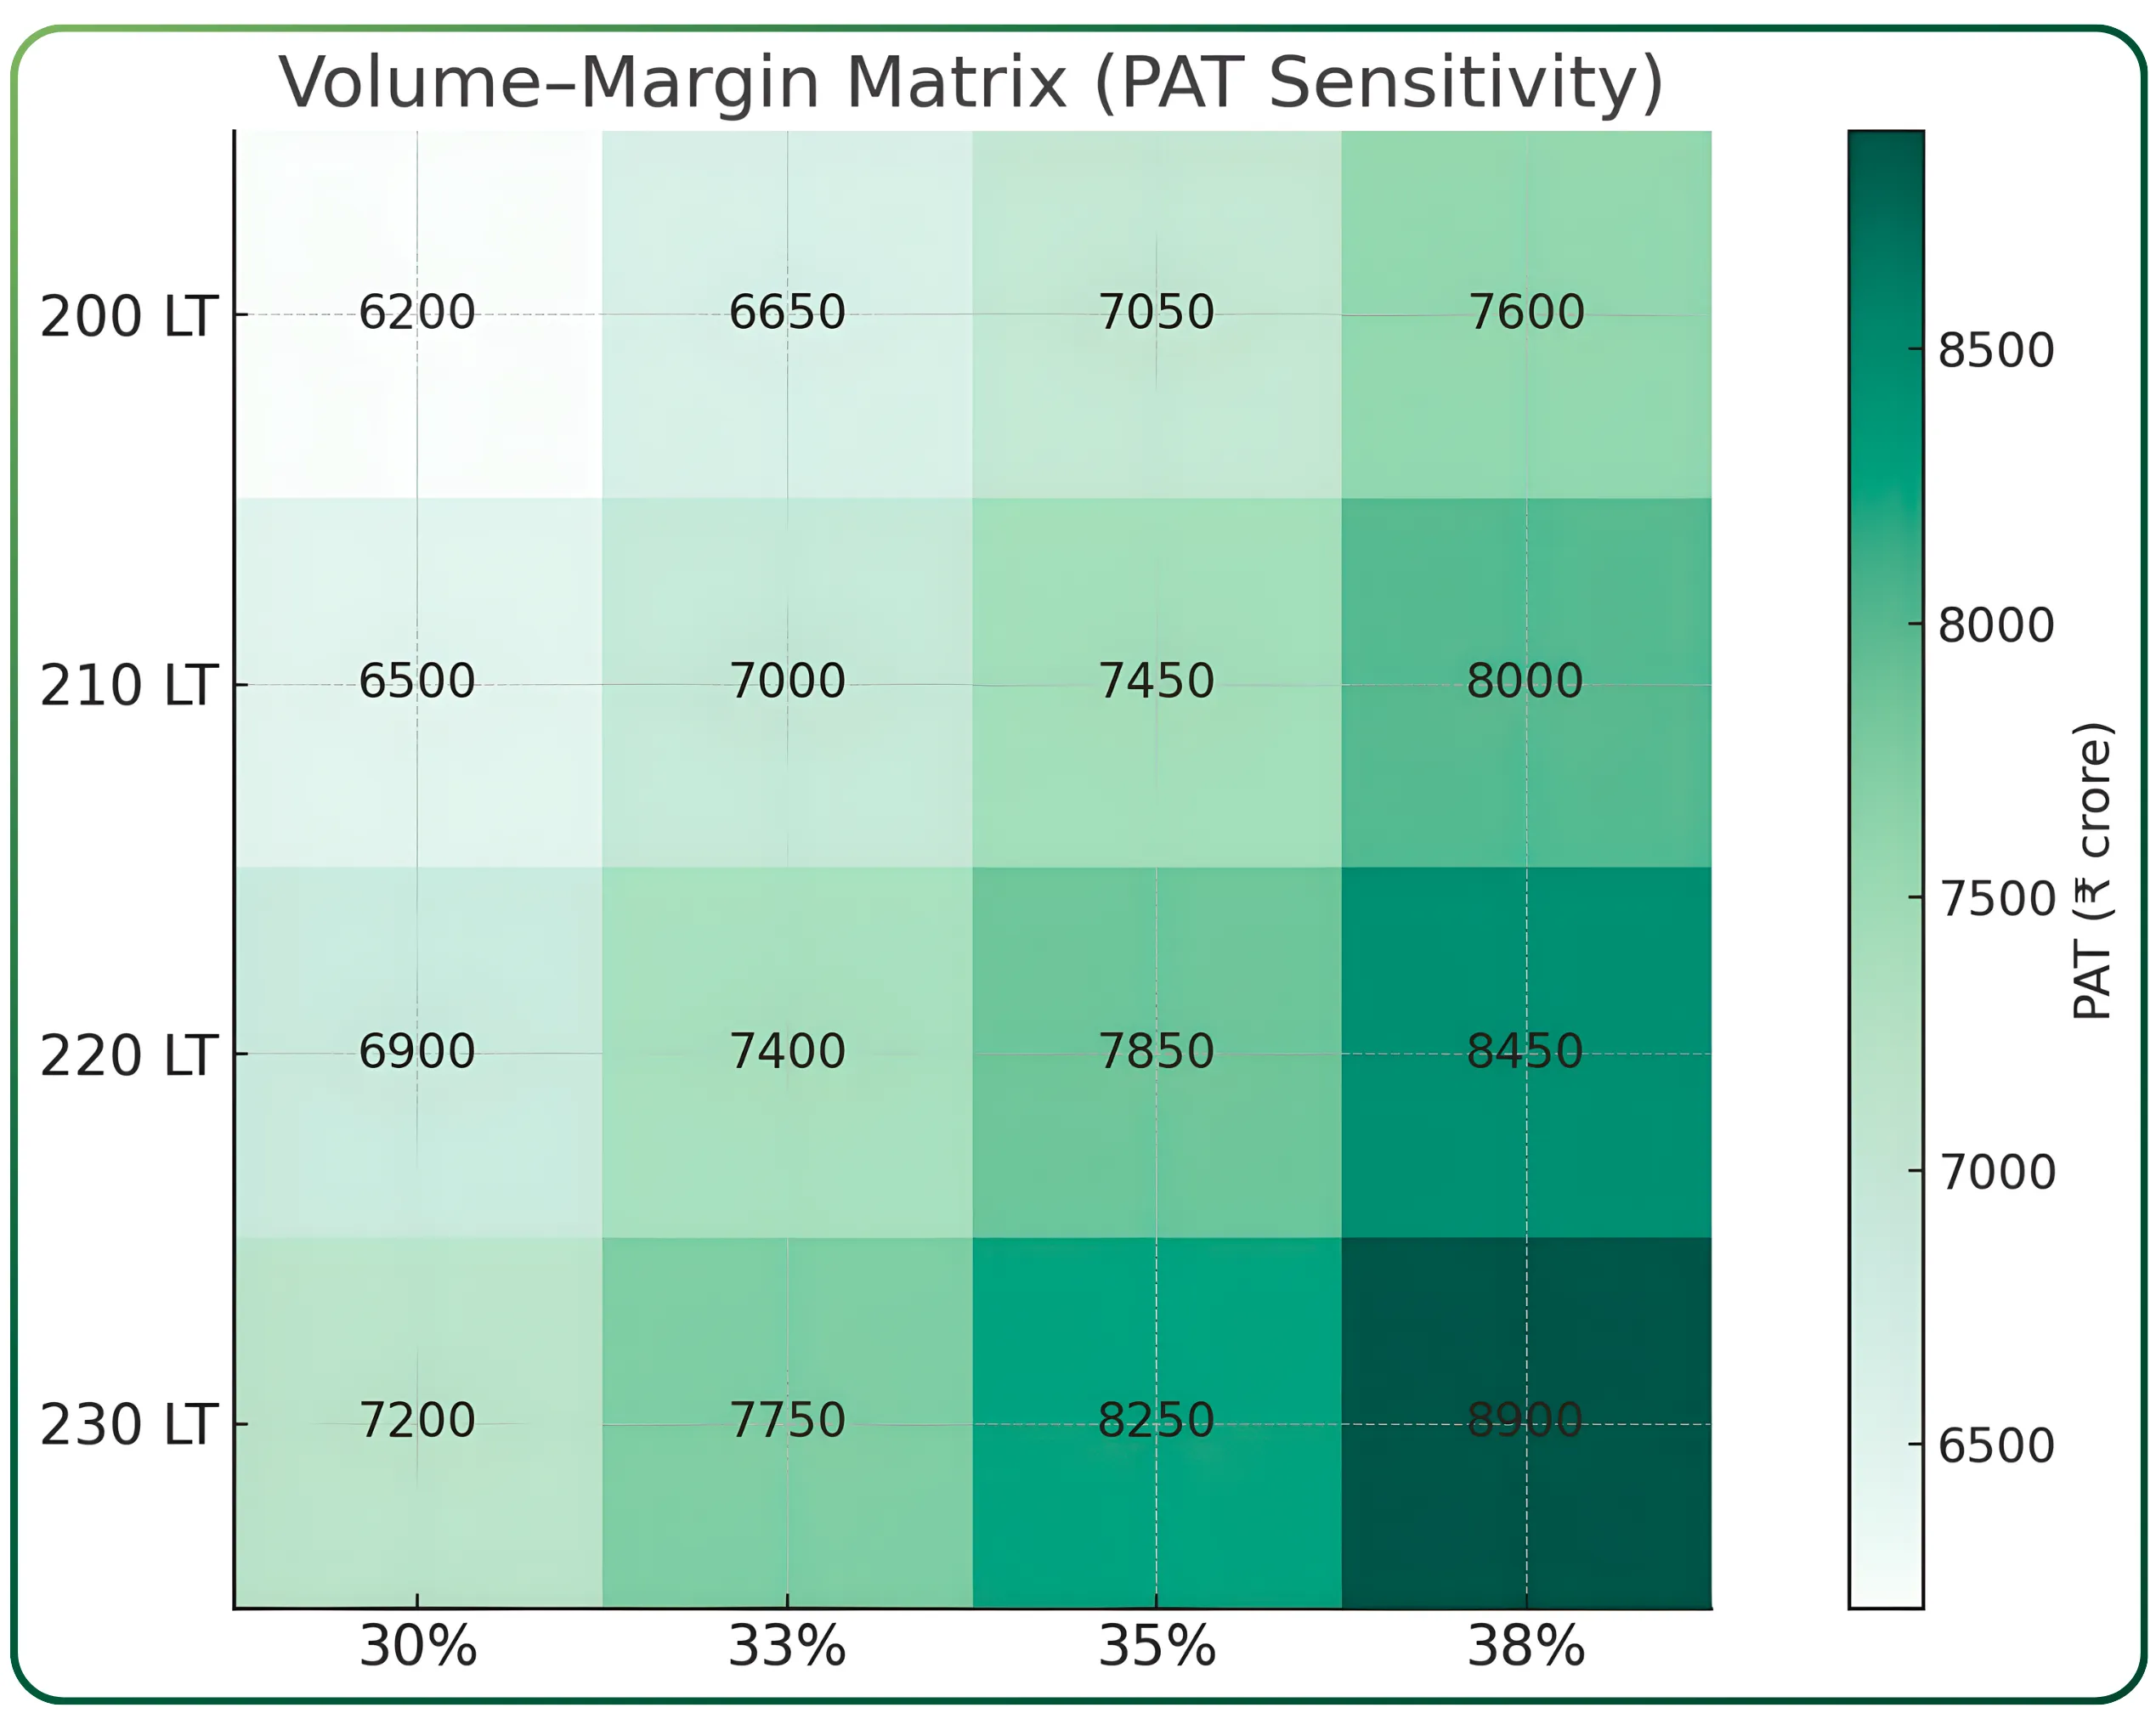
Iron ore mining is a simple business on the surface, but earnings can move sharply with changes in two variables: how much material is sold and the margin earned on every tonne. The volume–margin matrix shows how PAT reacts when these two levers move together. Higher dispatches add scale benefits, while margins largely follow realisations, costs, and levies. What the matrix reveals is that even small improvements in both can meaningfully expand PAT. At 220 LT and a 33% margin, NMDC can deliver around ₹7,400 crore in profit; the same volume at a 38% margin pushes profit toward ₹8,450 crore. This is why forward valuations for NMDC often appear conservative—small shifts in volumes or pricing translate into sizeable earnings upgrades.
Moats and Competitive Strengths
What keeps NMDC relevant is its structural cost advantage. The company operates some of India’s richest iron ore deposits, and decades of mechanised mining have reduced average costs to levels private miners struggle to match. Long mine lives, secure infrastructure, and strong relationships with domestic steelmakers reinforce this position. The company’s returns (ROCE of 29.6% and ROE of 23.6%) reflect this durable competitive advantage even after cycles.
Risks to the Thesis
Iron ore remains a global commodity, and prices can swing sharply on changes in Chinese demand or steel spreads. Any downturn directly affects profitability. Regulatory risk is another factor—royalty hikes, additional levies and policy changes have historically influenced earnings. Volume performance depends on timely clearances, especially for expansion projects. As with any PSU, divestment overhang and government decision cycles can affect the stock’s sentiment in the short term.
Final Take
NMDC sits at an interesting point in the cycle. Volumes are at record highs, margins remain healthy, and the balance sheet is pristine. The company continues to deliver strong operational performance without relying on price spikes. With the stock trading near 7–8 times forward earnings at today’s price, the valuation signals caution from the market rather than weakness in fundamentals. For investors tracking India’s materials and mining space, NMDC stands out as a stable, high-cash-flow business that remains deeply linked to the country's steel capacity expansion.
Turn research into action and explore smarter investing opportunities with CubePlus.
Disclaimer: The information provided in our blogs is for informational purposes only and should not be construed as financial, investment, or trading advice. Trading and investing in the securities market carries risk. Always conduct your own research and consult with a qualified financial advisor before making any investment decisions. Past performance is not indicative of future results. Copyrighted and original content for your trading and investing needs.
© 2025 — Tradejini. All Rights Reserved.