


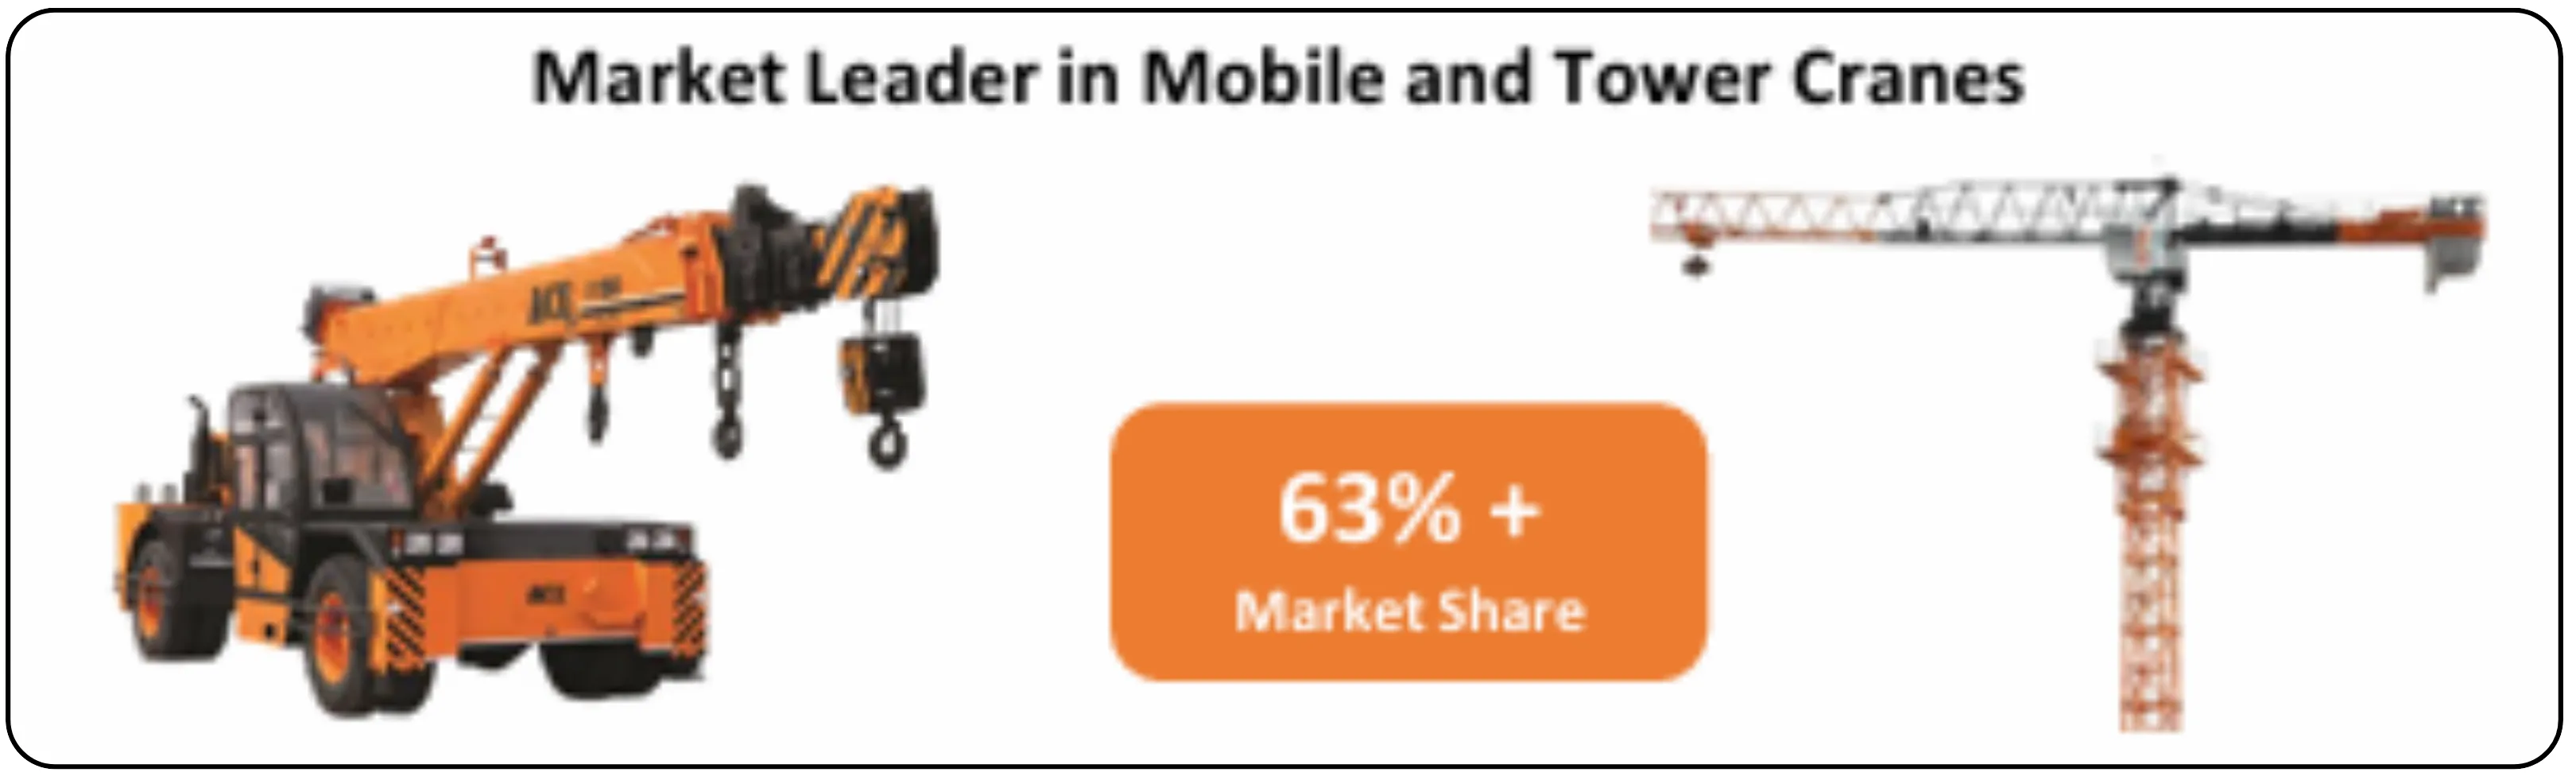
Action Construction Equipment (ACE) is India’s leading construction equipment manufacturer with nearly three decades of operations. Founded in 1995, and headquartered in Haryana the company has grown to become the world’s largest manufacturer of Pick & Carry cranes. In India, it holds around 63% market share in mobile cranes and 60% in tower cranes, making it a clear market leader. ACE is a direct beneficiary of India’s accelerating infrastructure growth and the broader upcycle in the construction equipment industry.
Business Model & Revenue Architecture
ACE operates on a fully integrated model that covers the manufacturing, marketing, and after-sales support of construction and material handling equipment. The company has a diversified product portfolio spanning more than 15 categories.
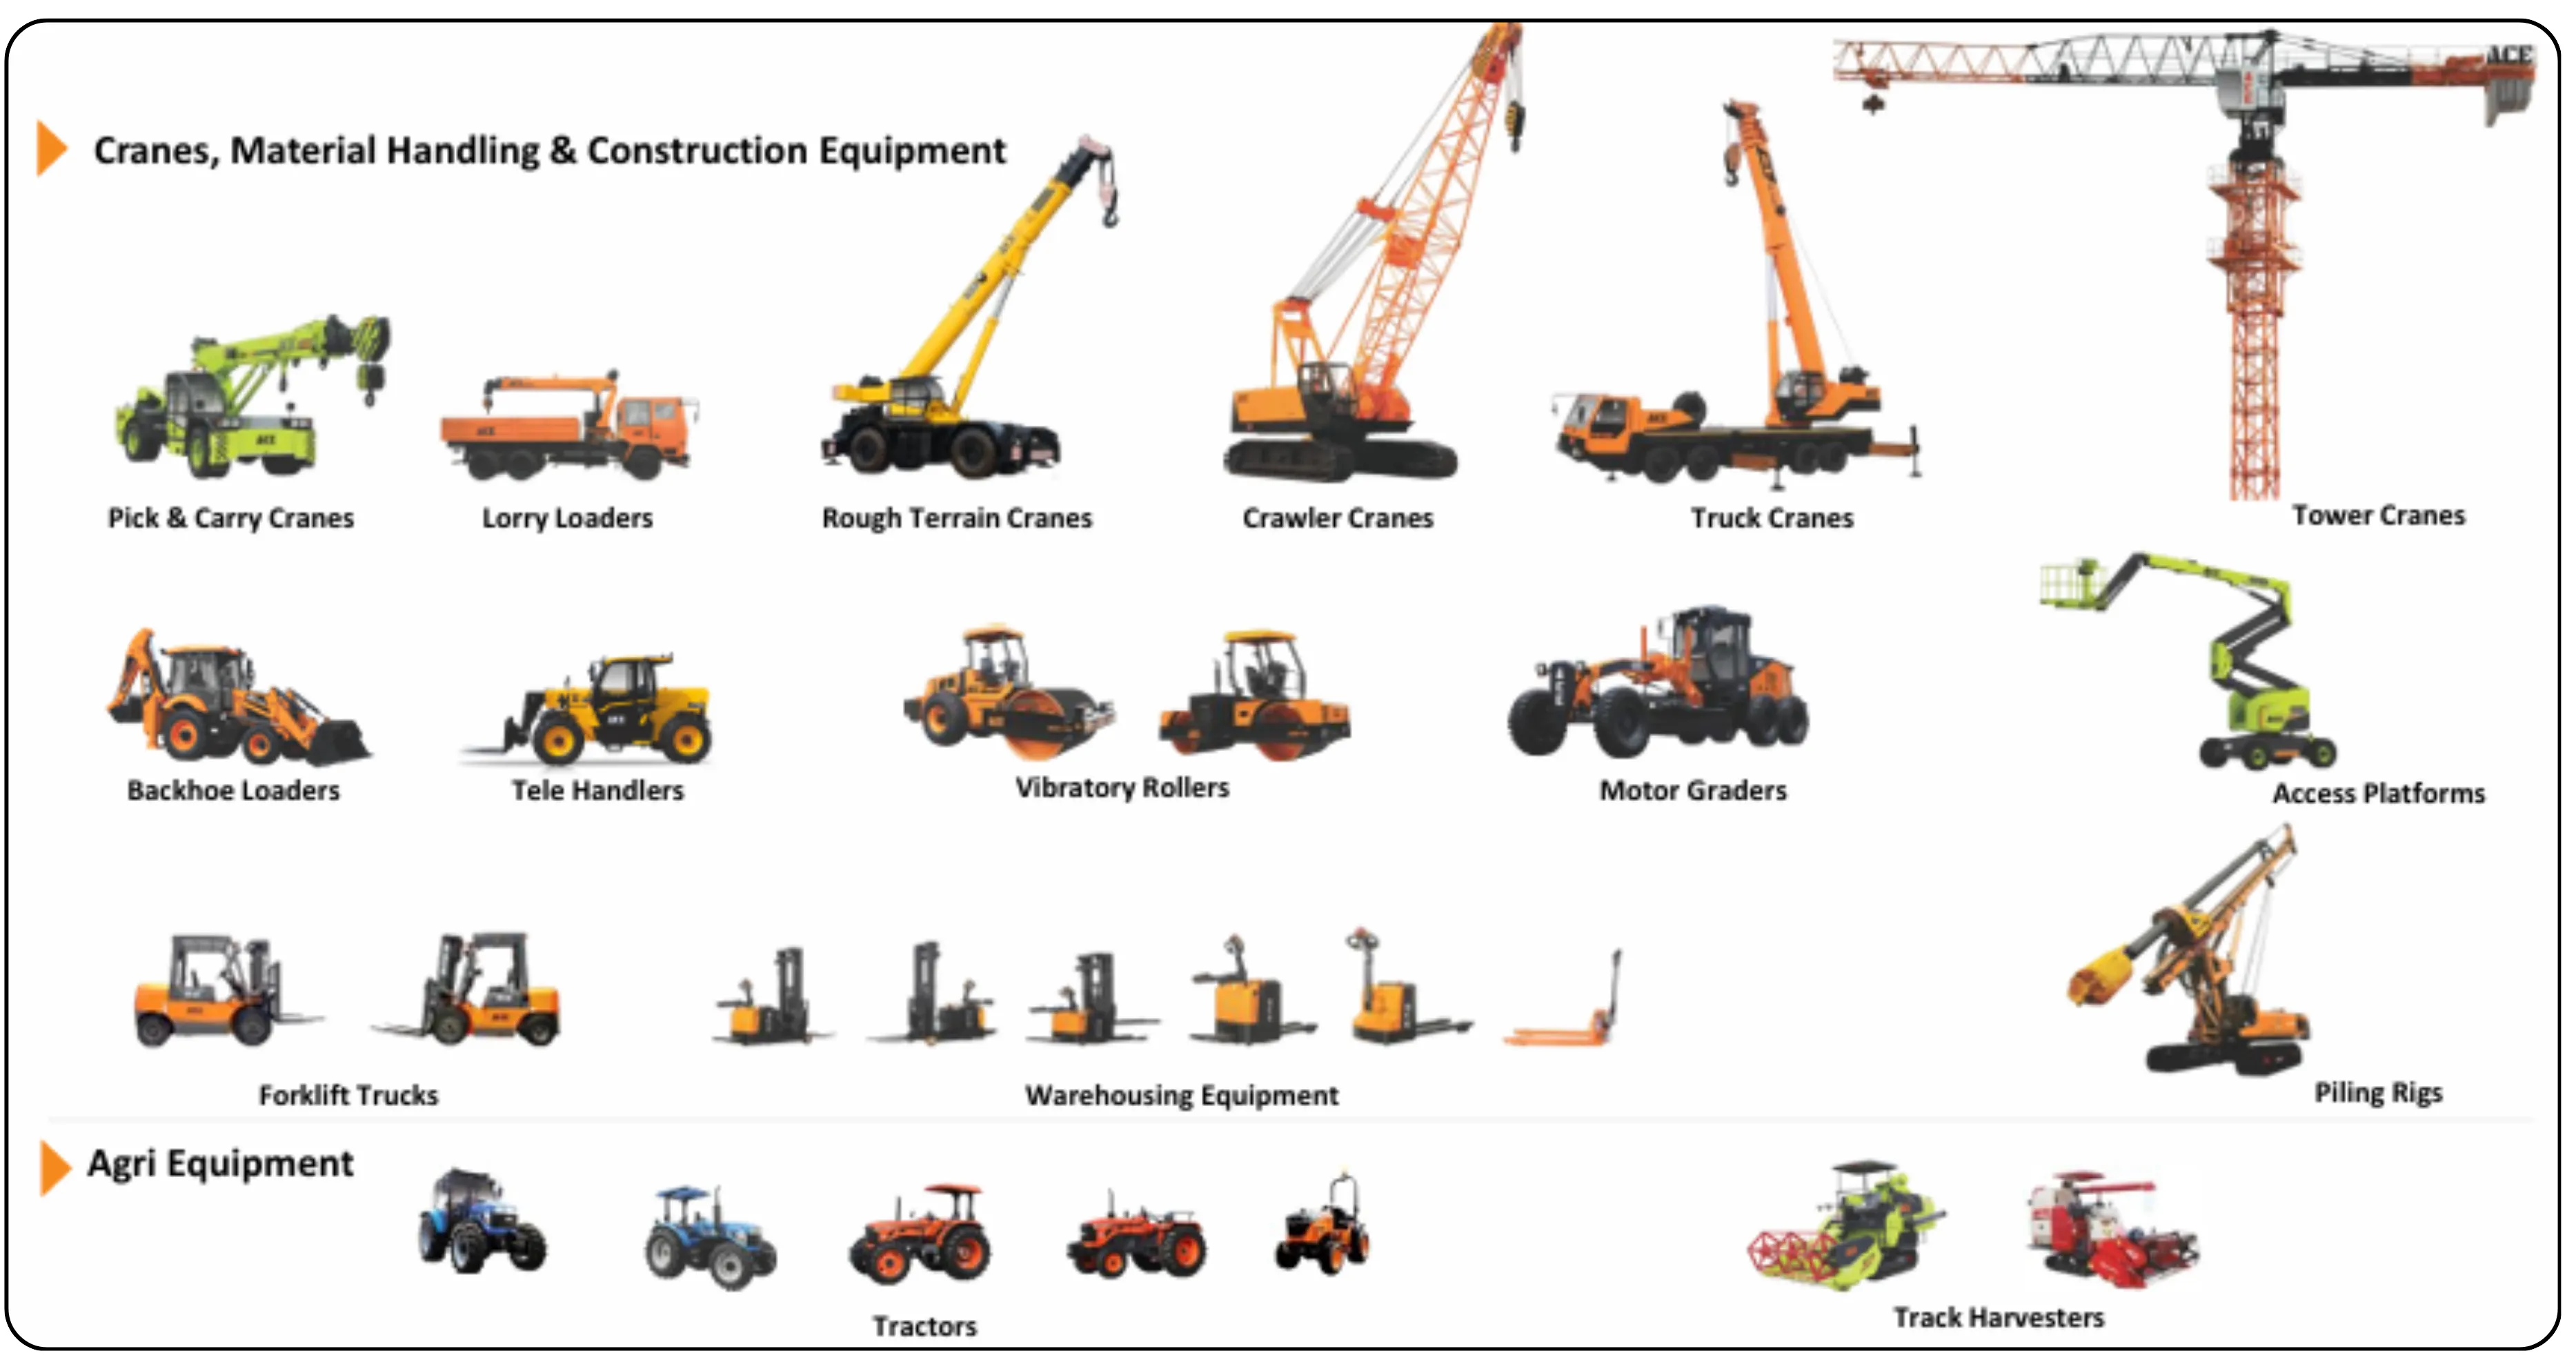
Its core revenue comes primarily from mobile cranes, especially Pick & Carry and Hydra-type cranes, which remain its flagship segment. Tower cranes — both mobile and fixed — form another major contributor, largely driven by demand from the real estate sector. ACE is also active in the material-handling space with products like forklifts, rough-terrain forklifts, and telehandlers. In the construction equipment category, the company manufactures crawler cranes, truck-mounted cranes, lorry loaders, backhoe loaders, vibratory rollers, and motor graders. Additionally, it has a presence in the agricultural equipment segment through products such as tractors, harvesters, and rotavators.
With expanding scale and improving product mix, ACE is increasingly being viewed as one of the best manufacturing stocks in the material handling and margin expansion category.
Geographic Presence
ACE has a strong domestic footprint with a pan-India network of more than 125 locations, supported by 13 regional offices. On the international front, the company exports to over 37 countries across the Middle East, Africa, Asia, and Latin America, with exports contributing around 3.5% to its FY25 revenue. Management has indicated its ambition to improve export contribution while driving ACE valuation rerating by FY27 through domestic leadership and global expansion.
Competitive Moat
ACE enjoys a strong competitive position built on multiple moats. It is the world’s largest manufacturer of pick-and-carry cranes and also one of India’s most diversified construction equipment companies. The company has a wide distribution network with over 125 touchpoints, enabling faster service and delivery across the country. Its manufacturing strength is substantial, with eight plants spread over more than 100 acres and a capacity to generate over ₹5,000 crore in revenue. ACE also has in-house R&D capabilities that allow it to design customized solutions for specific customer needs. Financially, the company maintains high discipline, operating with a debt-free balance sheet and negative net debt-to-equity. This strong positioning has directly translated into superior ACE financial performance over the past five years.
Five-Year Financial Performance
Revenue & Profitability Trend (FY21-FY25)
| Metric | FY21 | FY22 | FY23 | FY24 | FY25 |
|---|---|---|---|---|---|
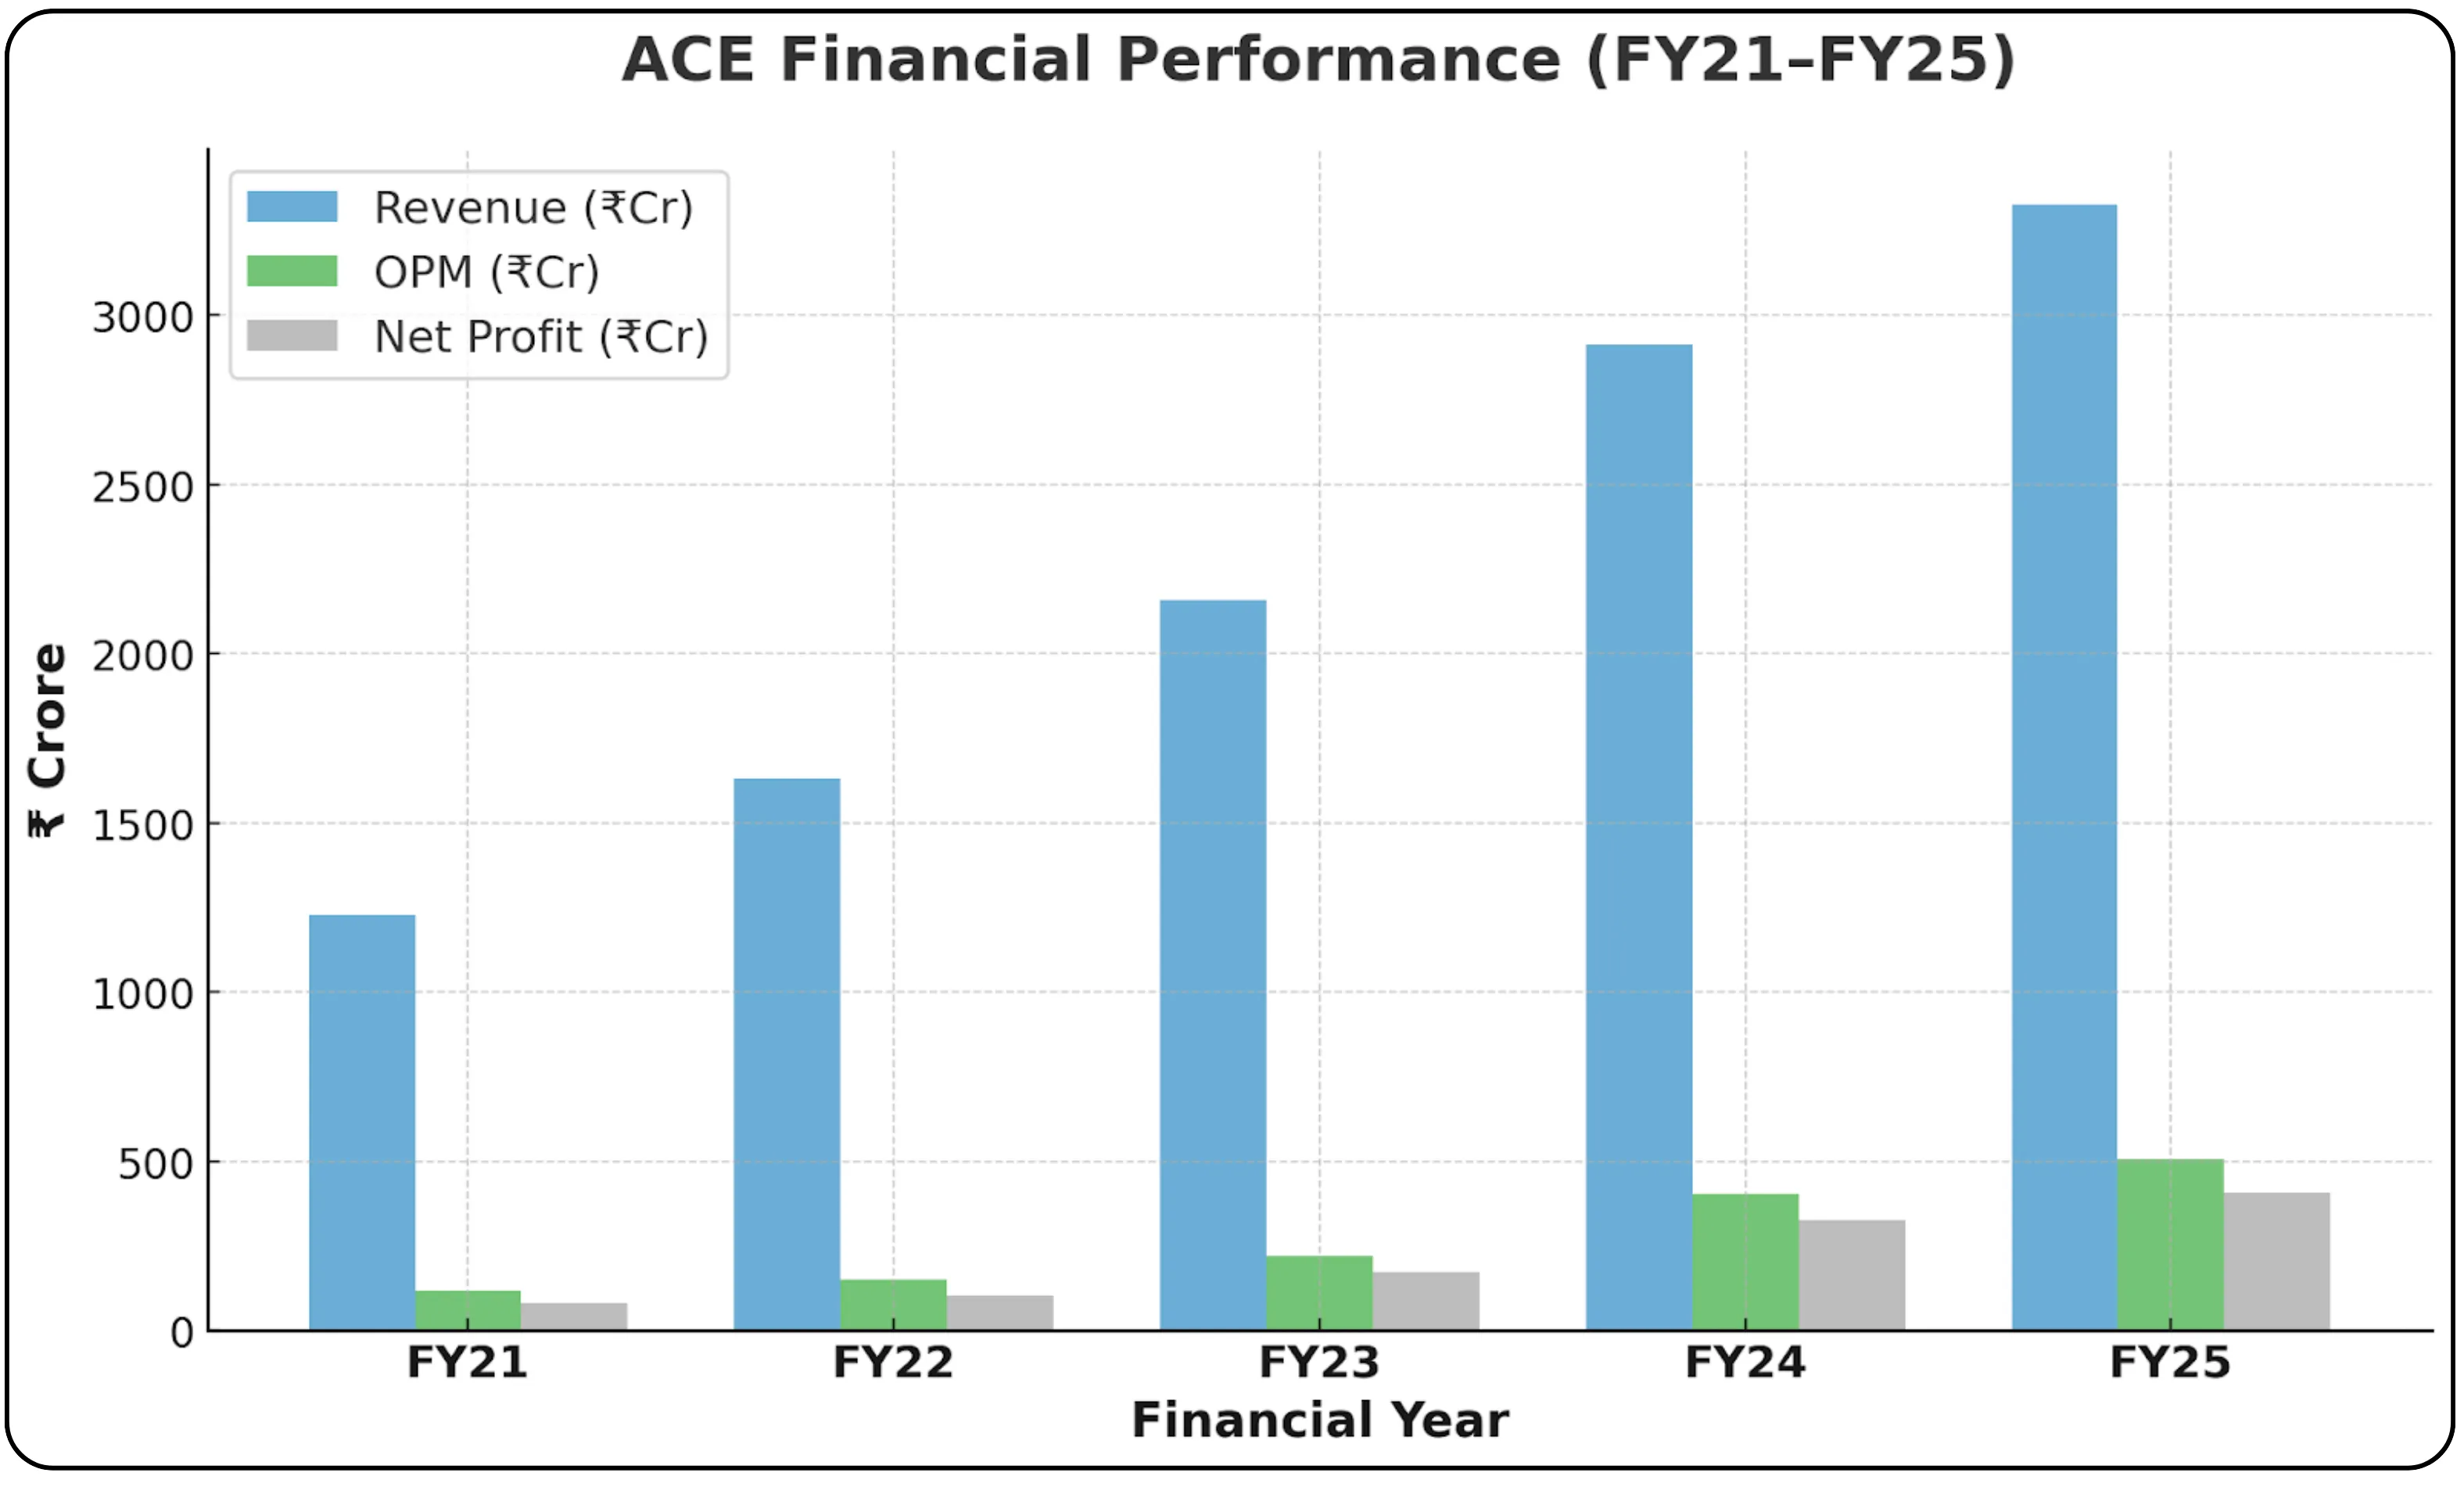
| Revenue (₹Cr) | 1,227 | 1,630 | 2,160 | 2,914 | 3,327 |
| OPM (₹Cr) | 119 | 151 | 221 | 404 | 506 |
| OPM (%) | 10% | 9% | 10% | 14% | 15% |
| Net Profit (₹Cr) | 80 | 105 | 173 | 328 | 409 |
| EPS (₹) | 7.03 | 8.82 | 14.41 | 27.56 | 34.36 |
Key Observations
Revenue Growth: ACE delivered a strong 28.3% revenue CAGR over FY21–25, supported by rising demand in the manufacturing and infrastructure sectors, capacity expansion, and continued market share gains.
Margin Expansion: Operating margins improved sharply from 10% in FY21 to 15% in FY25, an expansion of 500 bps. This was driven by economies of scale as volumes increased, a richer product mix with higher contribution from tower cranes and specialized equipment, operational efficiencies and better procurement, and price hikes taken to offset CEV Stage V emission norm-linked cost increases. This makes ACE one of the most compelling margin expansion stocks within the construction equipment industry in India.
Profit Acceleration: Net profit grew at an exceptional 50.4% CAGR, outpacing revenue due to strong operating leverage and a stable tax rate in the range of 25–26%.
Q1 FY26 Performance: Revenue declined 7.7% YoY to ₹703 crore, mainly due to pre-buying ahead of the emission norm transition and seasonal monsoon impact. However, EBITDA margins expanded to 20.5%, up 389 bps YoY, supported by price hikes and cost optimisation.
Balance Sheet Strength
ACE maintains a highly resilient balance sheet that supports both growth and downturn protection.
Key Financial Ratios (FY23-FY25)
| Metric | FY23 | FY24 | FY25 | Assessment |
|---|---|---|---|---|
| Total Equity (₹Cr) | 920 | 1,232 | 1,616 | Strong equity base |
| Net Debt/Equity (x) | -0.43 | -0.55 | -0.59 | Cash surplus |
| Debt/Equity | - | 0.01 | 0.01 | Virtually debt-free |
| Current Ratio | - | 0.88 | 0.88 | Adequate liquidity |
| ROE (%) | 23.4 | - | 28.6% | Excellent returns |
| ROCE (%) | 27.6 | 42.9 | 40.6% | Superior capital efficiency |
| Working Capital Days | 26 | 18 | - | Efficient working capital |
The company is net debt-free, indicating surplus cash and strong flexibility for acquisitions, capacity expansion, or counter-cyclical investments. Its return ratios are among the strongest in the Indian construction equipment space, with ROE at 28.6% and ROCE at 40.6% in FY25 — a clear sign of superior asset utilisation and pricing power. Leverage is negligible, with a debt-to-equity ratio of just 0.01, which keeps financial risk and interest costs extremely low. Working capital efficiency has improved steadily, with working capital days coming down from 26 in FY23 to 18 in FY24. ACE also generated healthy operating cash flows of ₹401.6 crore in FY25, fully funding over ₹100 crore of CAPEX through internal accruals without any equity dilution.
For a deeper understanding of how India’s gas infrastructure is evolving alongside this engineering upswing, you may also check out our fundamental analysis of Petronet LNG — one of the key beneficiaries of the country’s natural gas transition.
Industry Outlook & Growth Drivers
The outlook remains structurally favourable as India steps into a multi-year infrastructure growth cycle supported by government CAPEX and defence-led localization.
Sectoral Tailwinds
Manufacturing Sector: India is targeting a $1 trillion manufacturing economy by FY26. The government’s ₹1.97 lakh crore PLI scheme across 14 sectors is aimed at boosting domestic production. The global “China+1” supply chain shift is positioning India as a serious alternative manufacturing hub, with an estimated ₹3 lakh crore of additional production expected over the next five years.
Infrastructure Development: The government has allocated ₹11.2 trillion towards capital expenditure in FY26, a 10.1% YoY increase. The roads segment will receive ₹2.78 trillion, with a target to build 10,000 km of national highways in FY26. Indian Railways has been allocated ₹2.52 lakh crore to procure 17,500 general coaches, 200 Vande Bharat trains, and 100 Amrit Bharat trains. Urban infrastructure gets a ₹1 lakh crore allocation through the Urban Challenge Fund, while the Sagarmala Programme has ₹2 lakh crore worth of port projects lined up for FY26.
Housing & Real Estate: The government has earmarked ₹77,526 crore for PM Awas Yojana (₹19,794 crore for urban and ₹54,232 crore for rural housing). The ₹15,000 crore SWAMIH Fund 2.0 is focused on completing over 1 lakh stalled housing units. The Indian real estate sector is projected to grow to ₹5.8 trillion by 2047, accounting for 15.5% of GDP.
Defence Sector: The defence budget for FY26 stands at ₹6.81 lakh crore, up 4.65% YoY. Of this, ₹1.48 lakh crore is allocated to capital modernization, with 75% marked exclusively for domestic procurement. ACE already has strong validation in this space with a ₹420 crore defence order for 1,121 rough terrain forklifts.
Logistics & Warehousing: India’s logistics market is expected to grow from $228.4 billion in 2024 to $428.7 billion by 2033. The warehousing segment is projected to expand from $60.42 billion in 2024 to $163.98 billion by 2034 at a 10.5% CAGR. Additionally, 100 multimodal cargo terminals are being developed with a ₹6,000 crore investment by FY26.
Agriculture: The agriculture budget allocation stands at ₹1.37 lakh crore. The Indian tractor market, valued at $7.92 billion in 2025, is projected to reach $10.95 billion by 2030 at a CAGR of 6.7%. The agricultural machinery market is expected to reach ₹1.66 trillion by FY29, growing at 6.69% annually.
CE Industry Growth Outlook
The Indian construction equipment (CE) industry is expected to see steady mid-to-high single-digit growth in the coming years. This growth is being supported by the government’s continued infrastructure push across roads, railways, and urban development, a revival in private sector CAPEX in manufacturing, and an upturn in the real estate cycle. Replacement demand also contributes, as CE equipment typically has a lifespan of 7–10 years. Additionally, emission norm upgrades are driving premiumization across the segment.
In the near term, the industry may face headwinds from the CEV Stage V transition, monsoon seasonality, and geopolitical uncertainties. However, these challenges are expected to normalize from Q3 FY26 onwards.
If you’re interested in understanding the broader sustainability opportunity emerging in India, you may also explore my detailed industry breakdown on the country’s recycling and environmental services sector — The Business of Sustainability: Inside India’s Recycling Boom.
Competitive Landscape
Primary Competitors
| Company | Key Segments | Market Position |
|---|---|---|
| Ajax Engineering | Self-Loading Concrete Mixers (SLCMs), Batching Plants, Transit Mixers, Boom Pumps, Slip-Form Paver |
Market leader in SLCMs with approximately 77% market share in India |
| Escorts Kubota | Pick & Carry Cranes, Backhoe Loaders | ~50% share in new-generation pick & carry cranes |
| Tata Hitachi | Hydraulic Excavators | Leader in excavators |
| L&T Construction Equipment | Excavators, Mining Equipment | Strong in heavy equipment |
| Volvo CE, Caterpillar | Premium segment | Global majors |
| Chinese OEMs (XCMG, Sany, etc.) | Crawler Cranes, Truck Cranes, Tower Cranes | Aggressive pricing (30–40% lower) |
ACE’s Competitive Position
ACE holds a strong position relative to its peers. It is the market leader in mobile cranes with a 63% share and in tower cranes with a 60% share. The company also offers India’s most diversified construction equipment portfolio. Its fully indigenous manufacturing helps reduce reliance on imports, while an 8–9x CAPEX-to-revenue efficiency allows competitive pricing. A network of over 125 locations ensures quick and reliable after-sales support.
The company does face challenges. Low-cost imports from China in segments like crawler cranes, truck cranes, and tower cranes put pressure on pricing. In premium segments, global OEMs such as Volvo and Caterpillar maintain a technological edge. ACE’s scale is smaller than global giants, which limits its R&D budget.
To address these challenges, ACE has initiated anti-dumping proceedings through the DGTR for heavy cranes, with the final hearing complete and a decision expected by September 2025. The government is also considering tariff and non-tariff measures to protect the domestic CE industry from Chinese imports. In addition, ACE is finalizing a joint venture with Kato Works (Japan) to gain access to advanced premium crane technology, with work expected to start in Q3 FY26. On the export front, the company is aiming to increase revenue contribution to 6–7%, up from 4% in FY25, to reduce reliance on the domestic market.
Risk Factors
Cyclicality & Demand Volatility
Construction equipment demand is highly cyclical and closely linked to government CAPEX, private sector investment, and real estate activity. Economic slowdowns or delays in policy implementation can impact volumes. ACE mitigates this risk through diversified exposure across manufacturing, infrastructure, real estate, and agriculture. Additionally, its defense orders and growing exports provide more stable, non-cyclical revenue streams.
Raw Material & Commodity Price Risk
Steel, which accounts for roughly 40–45% of costs, along with hydraulic components, is subject to price volatility. Sharp increases in these inputs can compress margins if not passed on to customers. ACE manages this risk through long-term vendor contracts, backward integration for select components, and the ability to implement price hikes, as demonstrated in Q1 FY26 with 7–12% price increases linked to emission norms.
Chinese Import Competition
Chinese OEMs offer prices that are 30–40% lower due to subsidies and cheaper inputs, threatening market share in crawler cranes, truck cranes, and tower cranes. ACE is addressing this through an anti-dumping petition currently in progress, government indications of protectionist measures, and by leveraging its superior service network and localized manufacturing as differentiators.
Regulatory & Emission Norm Transitions
The implementation of CEV Stage V norms in April 2025 led to 12–13% price increases for engines transitioning from BS-III to BS-V, causing demand deferral in Q1 FY26. This phase of pre-buying is now over, the market has largely accepted the new pricing, and Q1 margin expansion of 389 bps indicates ACE’s pricing power remains intact.
Working Capital & Credit Risk
Extended payment cycles in infrastructure projects and dealer financing can strain working capital, while customer defaults pose receivables risk. ACE has improved working capital efficiency, with days declining from 26 in FY23 to 18 in FY24. A negative net debt position provides additional financial cushion, and robust credit underwriting mitigates risks associated with dealer or customer financing.
Geopolitical & Trade Risks
Export markets are exposed to geopolitical tensions and tariff changes, such as those seen during the Trump administration, which impacted a white-labeling deal. Currently, exports contribute a modest 3.5% of revenue. While ACE aims to increase this to 6–7% by FY26, the domestic Indian market remains its primary focus.
Technology Disruption
Emerging electric and autonomous equipment poses a potential long-term threat. ACE is addressing this by investing in R&D for electric variants and through its joint venture with Kato Works, which will provide access to advanced technologies.
Growth Catalysts
Defence Order Pipeline
ACE’s positioning as one of the few credible defence equipment manufacturers in India further enhances earnings visibility beyond cyclical infra demand.ACE has secured a ₹420 crore order for 1,121 rough terrain forklifts from the Ministry of Defence, with ₹50–70 crore expected to be executed in FY26, around ₹200 crore in FY27, and the remaining balance in FY28. Additional orders include ₹45–50 crore for 54 HRV machines in collaboration with Ashok Leyland Defence and ₹70–80 crore for 90 machines currently on the anvil. BRO orders for backhoe loaders and motor graders are also in the pipeline. The company targets a sustained 3–4% annual revenue contribution from defence contracts.
Export Market Expansion
Participation at Bauma Munich 2025 has generated a strong dealership pipeline across Europe, the Middle East, and Africa. ACE aims to increase export revenue to 6–7% in FY26, up from 4% in FY25. Participation at Agritechnica Europe is planned for Q3 FY26 to promote orchard tractors. In combination, defence and exports are expected to contribute around 10% of revenue in the medium term.
Product Launches & Technology Upgradation
The company has launched upgraded crawler cranes and equal-wheel backhoe loaders (4x4x4). Commercialization of electric cranes is pending approvals from ARAI and Exide batteries. Additionally, access platforms and telehandlers are gaining traction, particularly in the logistics and warehousing sectors.
Capacity & Land Bank for Future Growth
ACE’s current manufacturing capacity exceeds ₹5,000 crore in revenue, compared with ₹3,327 crore achieved in FY25, leaving 30–40% headroom for growth. The company operates on 100 acres of land and has acquired an additional 138 acres for future expansion. CAPEX efficiency remains high, with every ₹100 crore investment generating ₹800–900 crore in revenue capacity. FY26 CAPEX is planned at ₹100 crore for automation and robotics, along with ₹130 crore for land payments, while major expansion is deferred to FY27–28.
Kato Works JV (Japan)
The partnership with premium crane OEM Kato Works is in its final stages, with operations expected to commence in Q3 FY26. This JV will provide ACE access to advanced technology for large crawler and truck cranes. If anti-dumping duties on Chinese imports materialize, the collaboration could generate an additional ₹500–1,000 crore in revenue over the next 3–5 years.
Infrastructure & Manufacturing Boom
Government CAPEX of ₹11.2 trillion in FY26, up 10% YoY, and PLI-driven manufacturing investments are expected to drive strong demand for material handling and construction equipment. The construction equipment segment, particularly road machinery, is projected to grow 30–40% in FY26.
Market Share Gains
ACE continues to dominate older-generation hydra-type cranes with a 70–75% market share and holds around 50% share in new-generation cranes. Tower crane volumes grew 16% YoY in Q1 FY26, increasing from 144 to 167 units despite an overall volume decline. Forklift volumes also rose 10% YoY in Q1 FY26.
Valuation Analysis
Investors are keenly tracking ACE valuation for FY27 as earnings visibility improves across defence, exports, and premium equipment.
Current Market Metrics (October 2025)
- Market Cap: ₹13,079 Crores
- Current Price: ₹1,098
- Stock P/E (FY25): 31.0x
- Industry P/E: 33.0x
- Book Value: ₹136
- Price-to-Book: 8.1x
Forward Earnings Scenarios
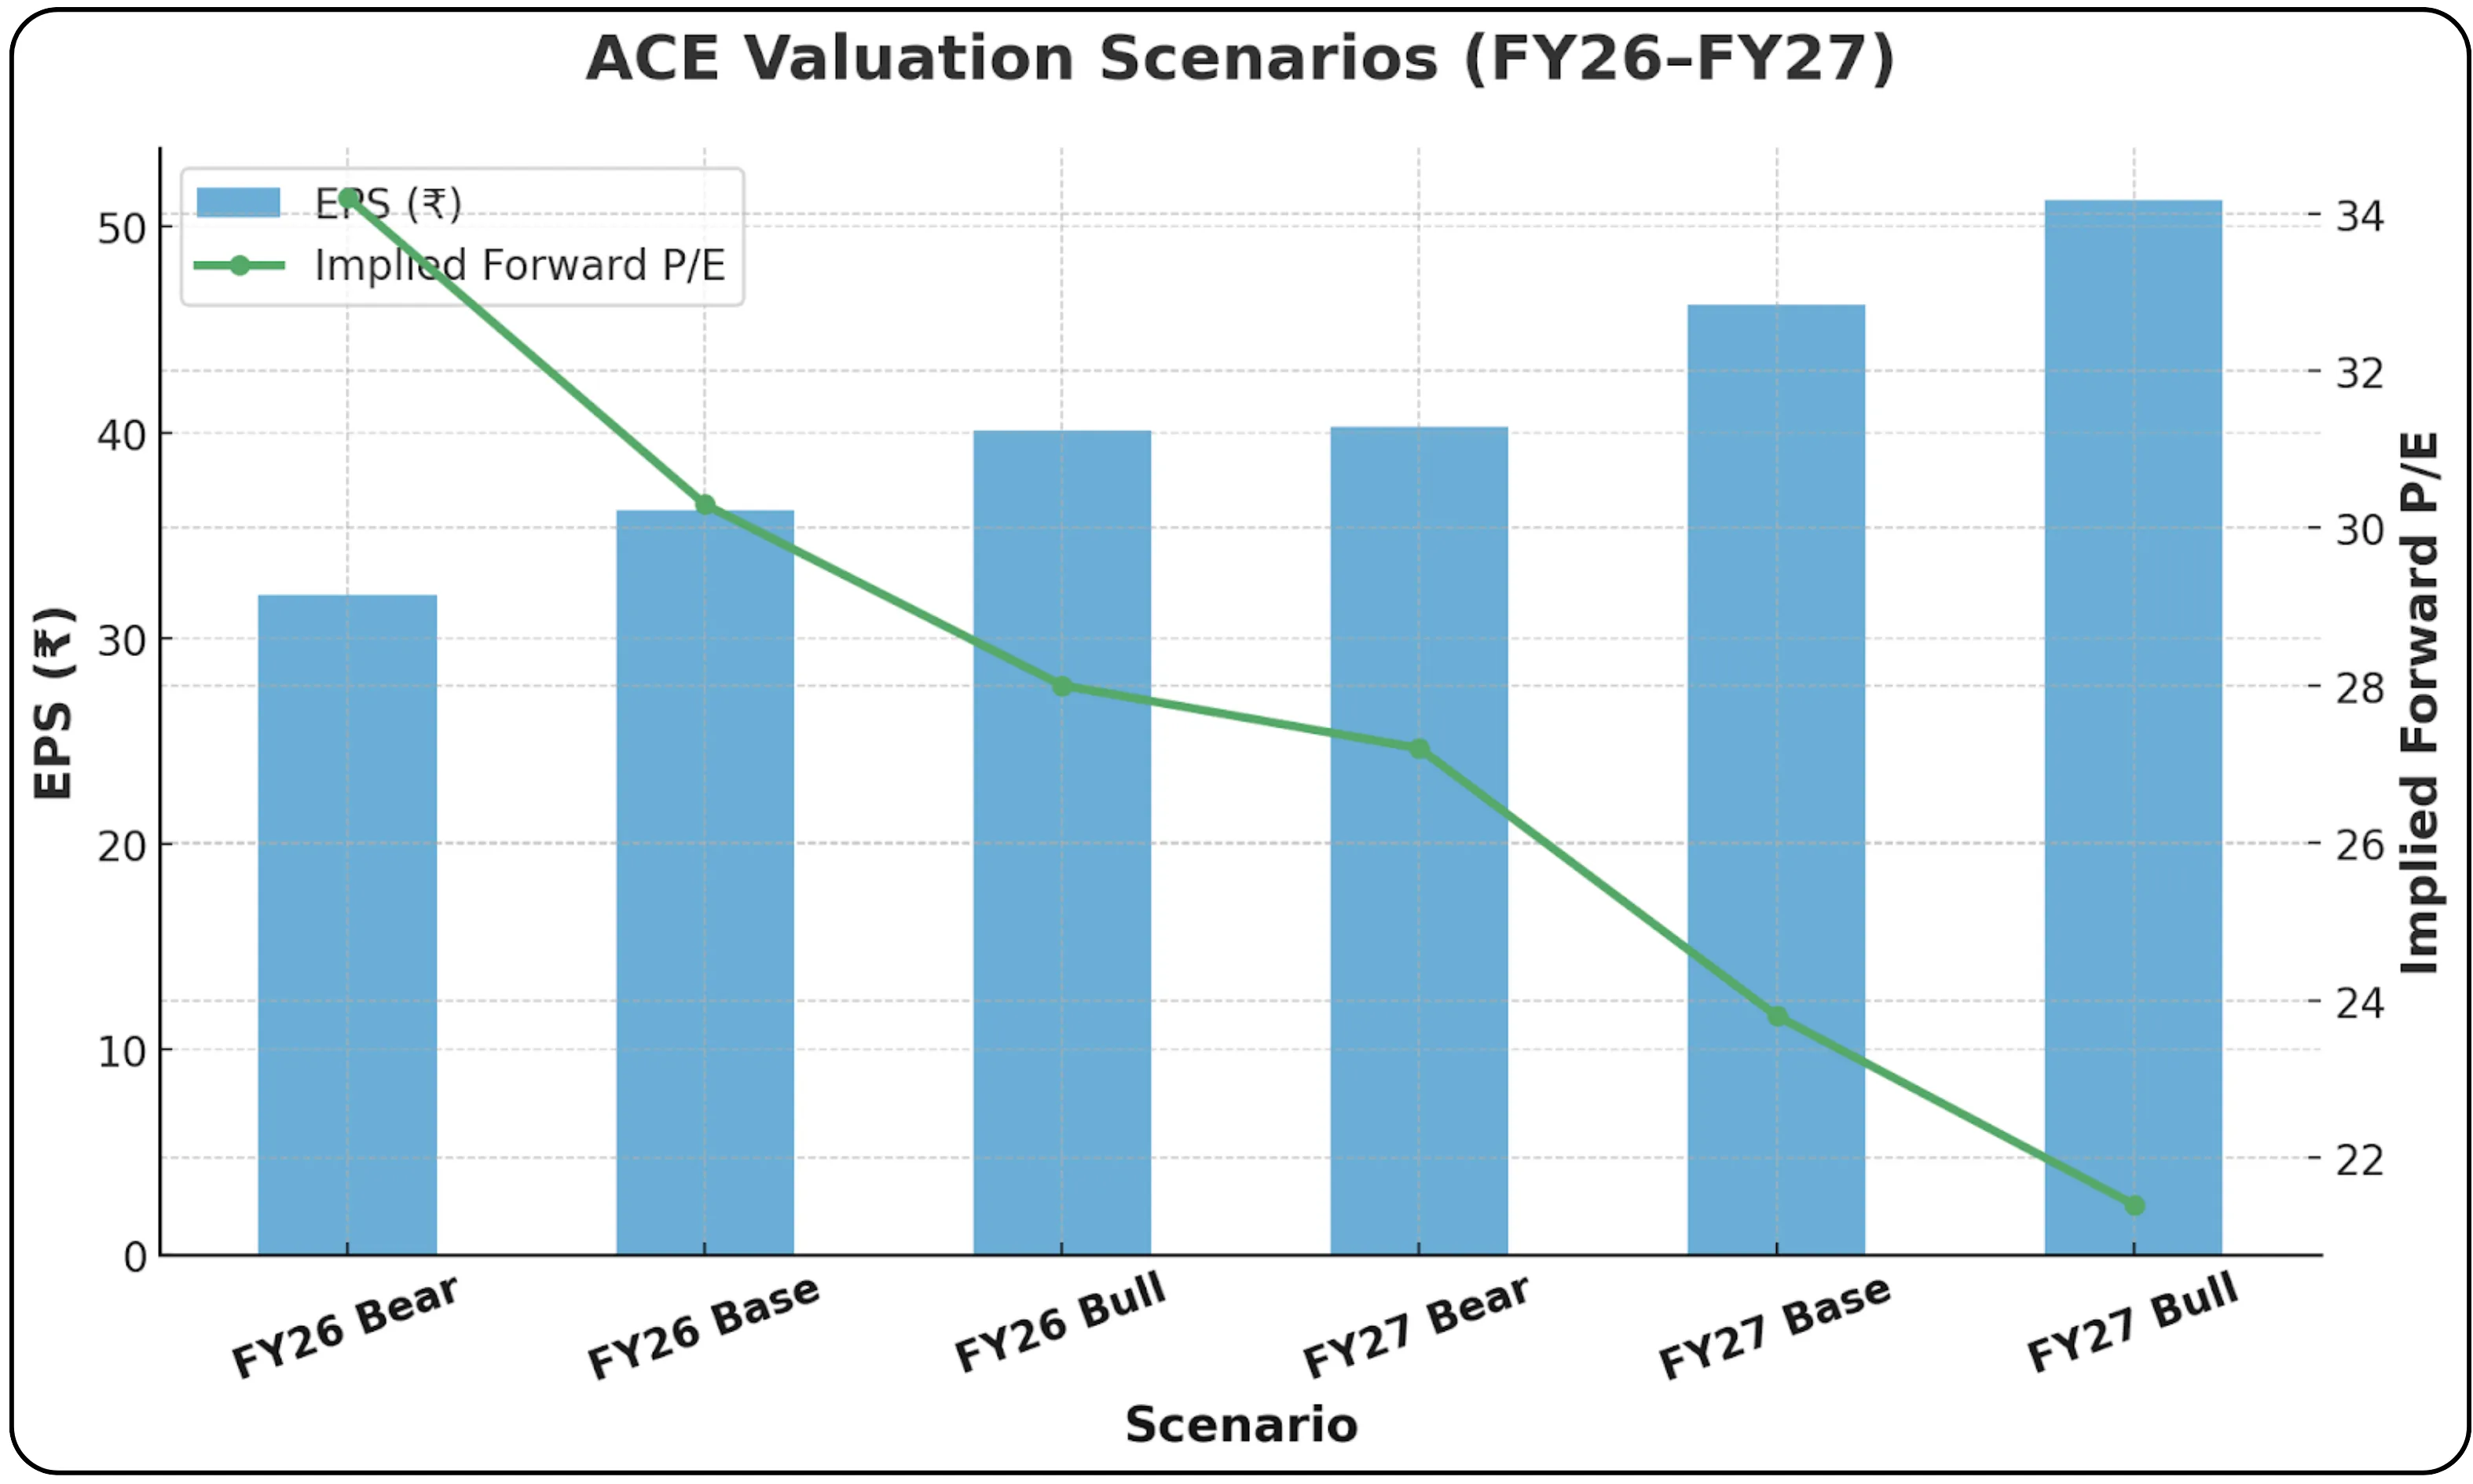
The table below presents forward earnings scenarios for ACE under bear, base, and bull cases for FY26 and FY27. It captures potential revenue, margins, PAT, and EPS, along with the implied forward P/E and a brief assessment of valuation under each scenario. These projections highlight the risk-reward spectrum based on growth outcomes and margin performance.
| Scenario | Revenue (₹ Cr) | PAT Margin (%) | PAT (₹ Cr) | EPS (₹) | Implied Forward P/E | Assessment |
|---|---|---|---|---|---|---|
| FY26 Bear | 3,327 (0% growth) | 11.5 | 383 | 32.1 | 34.2x | Expensive if growth stalls |
| FY26 Base | 3,593 (8% growth) | 12.0 | 431 | 36.2 | 30.3x | In line with current P/E (31x) |
| FY26 Bull | 3,826 (15% growth) | 12.5 | 478 | 40.1 | 28.0x | Attractive if growth accelerates |
| FY27 Bear | 4,000 (13% CAGR from FY25) | 12.0 | 480 | 40.3 | 27.2x | Moderately attractive |
| FY27 Base | 4,400 (15% CAGR from FY25) | 12.5 | 550 | 46.2 | 23.8x | Attractive if target achieved |
| FY27 Bull | 4,700 (19% CAGR from FY25) | 13.0 | 611 | 51.3 | 21.4x | Compelling value |
Financial Scenario Outlook
ACE’s projected performance over FY26–27 reflects multiple growth trajectories. In a conservative FY26 Bear scenario, revenue is expected to remain flat at ₹3,327 crore, generating a PAT of ₹383 crore and EPS of 32.1, implying a forward P/E of 34.2x, which would be expensive if growth stalls. Under the FY26 Base case, revenue rises 8% to ₹3,593 crore, with PAT of ₹431 crore and EPS of 36.2, aligning with the current P/E of 31x. In the FY26 Bull scenario, aggressive growth of 15% pushes revenue to ₹3,826 crore, PAT to ₹478 crore, and EPS to 40.1, reducing the forward P/E to 28.0x, reflecting an attractive valuation if momentum accelerates.
For FY27, even the Bear scenario anticipates revenue of ₹4,000 crore (13% CAGR from FY25), PAT of ₹480 crore, and EPS of 40.3 (P/E 27.2x). The Base case projects ₹4,400 crore in revenue, PAT of ₹550 crore, and EPS of 46.2 (P/E 23.8x), while the Bull case assumes ₹4,700 crore in revenue, PAT of ₹611 crore, and EPS of 51.3, offering a compelling P/E of 21.4x. Overall, ACE’s growth trajectory and margin expansion indicate that even moderate growth scenarios maintain attractive valuations, while accelerated growth could make the stock particularly compelling.
Final Thoughts
From an ACE share price target perspective, the stock presents a favourable risk-reward setup for investors willing to ride the domestic manufacturing and infra capex cycle. Action Construction Equipment (ACE) is a high-quality compounding story, underpinned by market leadership in mobile and tower cranes, diversified revenue streams, and a fortress-like, debt-free balance sheet. The company has delivered strong execution, achieving a 28.3% revenue CAGR and 50.4% PAT CAGR over FY21–25.
ACE offers strong medium-term growth visibility, targeting ₹4,400–4,700 crore in revenue by FY27, supported by structural tailwinds from infrastructure, manufacturing, defense, and logistics sectors. Key catalysts include a ₹420 crore+ defense order pipeline, expansion of exports to 6–7% of revenue, 30–40% unutilized capacity enabling growth without major CAPEX, and access to premium technology through the Kato JV.
Near-term headwinds include the CEV Stage V emission norm transition, monsoon seasonality, and competition from Chinese imports.
Valuation appears reasonable, with the stock trading at 23.8x FY27E P/E (base case), below the industry average of 33x. While fairly valued at 31x FY25 P/E near-term, ACE offers 18–45% upside over 12–24 months if management achieves FY27 revenue and margin guidance, making it an attractive risk-reward opportunity for patient investors.
Turn research into action and explore smarter investing opportunities with CubePlus.
Disclaimer: The information provided in our blogs is for informational purposes only and should not be construed as financial, investment, or trading advice. Trading and investing in the securities market carries risk. Always conduct your own research and consult with a qualified financial advisor before making any investment decisions. Past performance is not indicative of future results. Copyrighted and original content for your trading and investing needs.
© 2025 — Tradejini. All Rights Reserved.