


Tradejini's CubePlus platform offers a comprehensive suite of features for in-depth equity analysis, catering to both traders and investors. This guide will explore every tool available on CubePlus for Equity analysis, designed to empower users with the insights needed for informed decision-making.
Overview Tab
The "Overview" tab in CubePlus provides an immediate, comprehensive snapshot of a stock's current market status. It's designed to give you a quick yet insightful understanding without having to navigate through multiple screens.
Market Depth
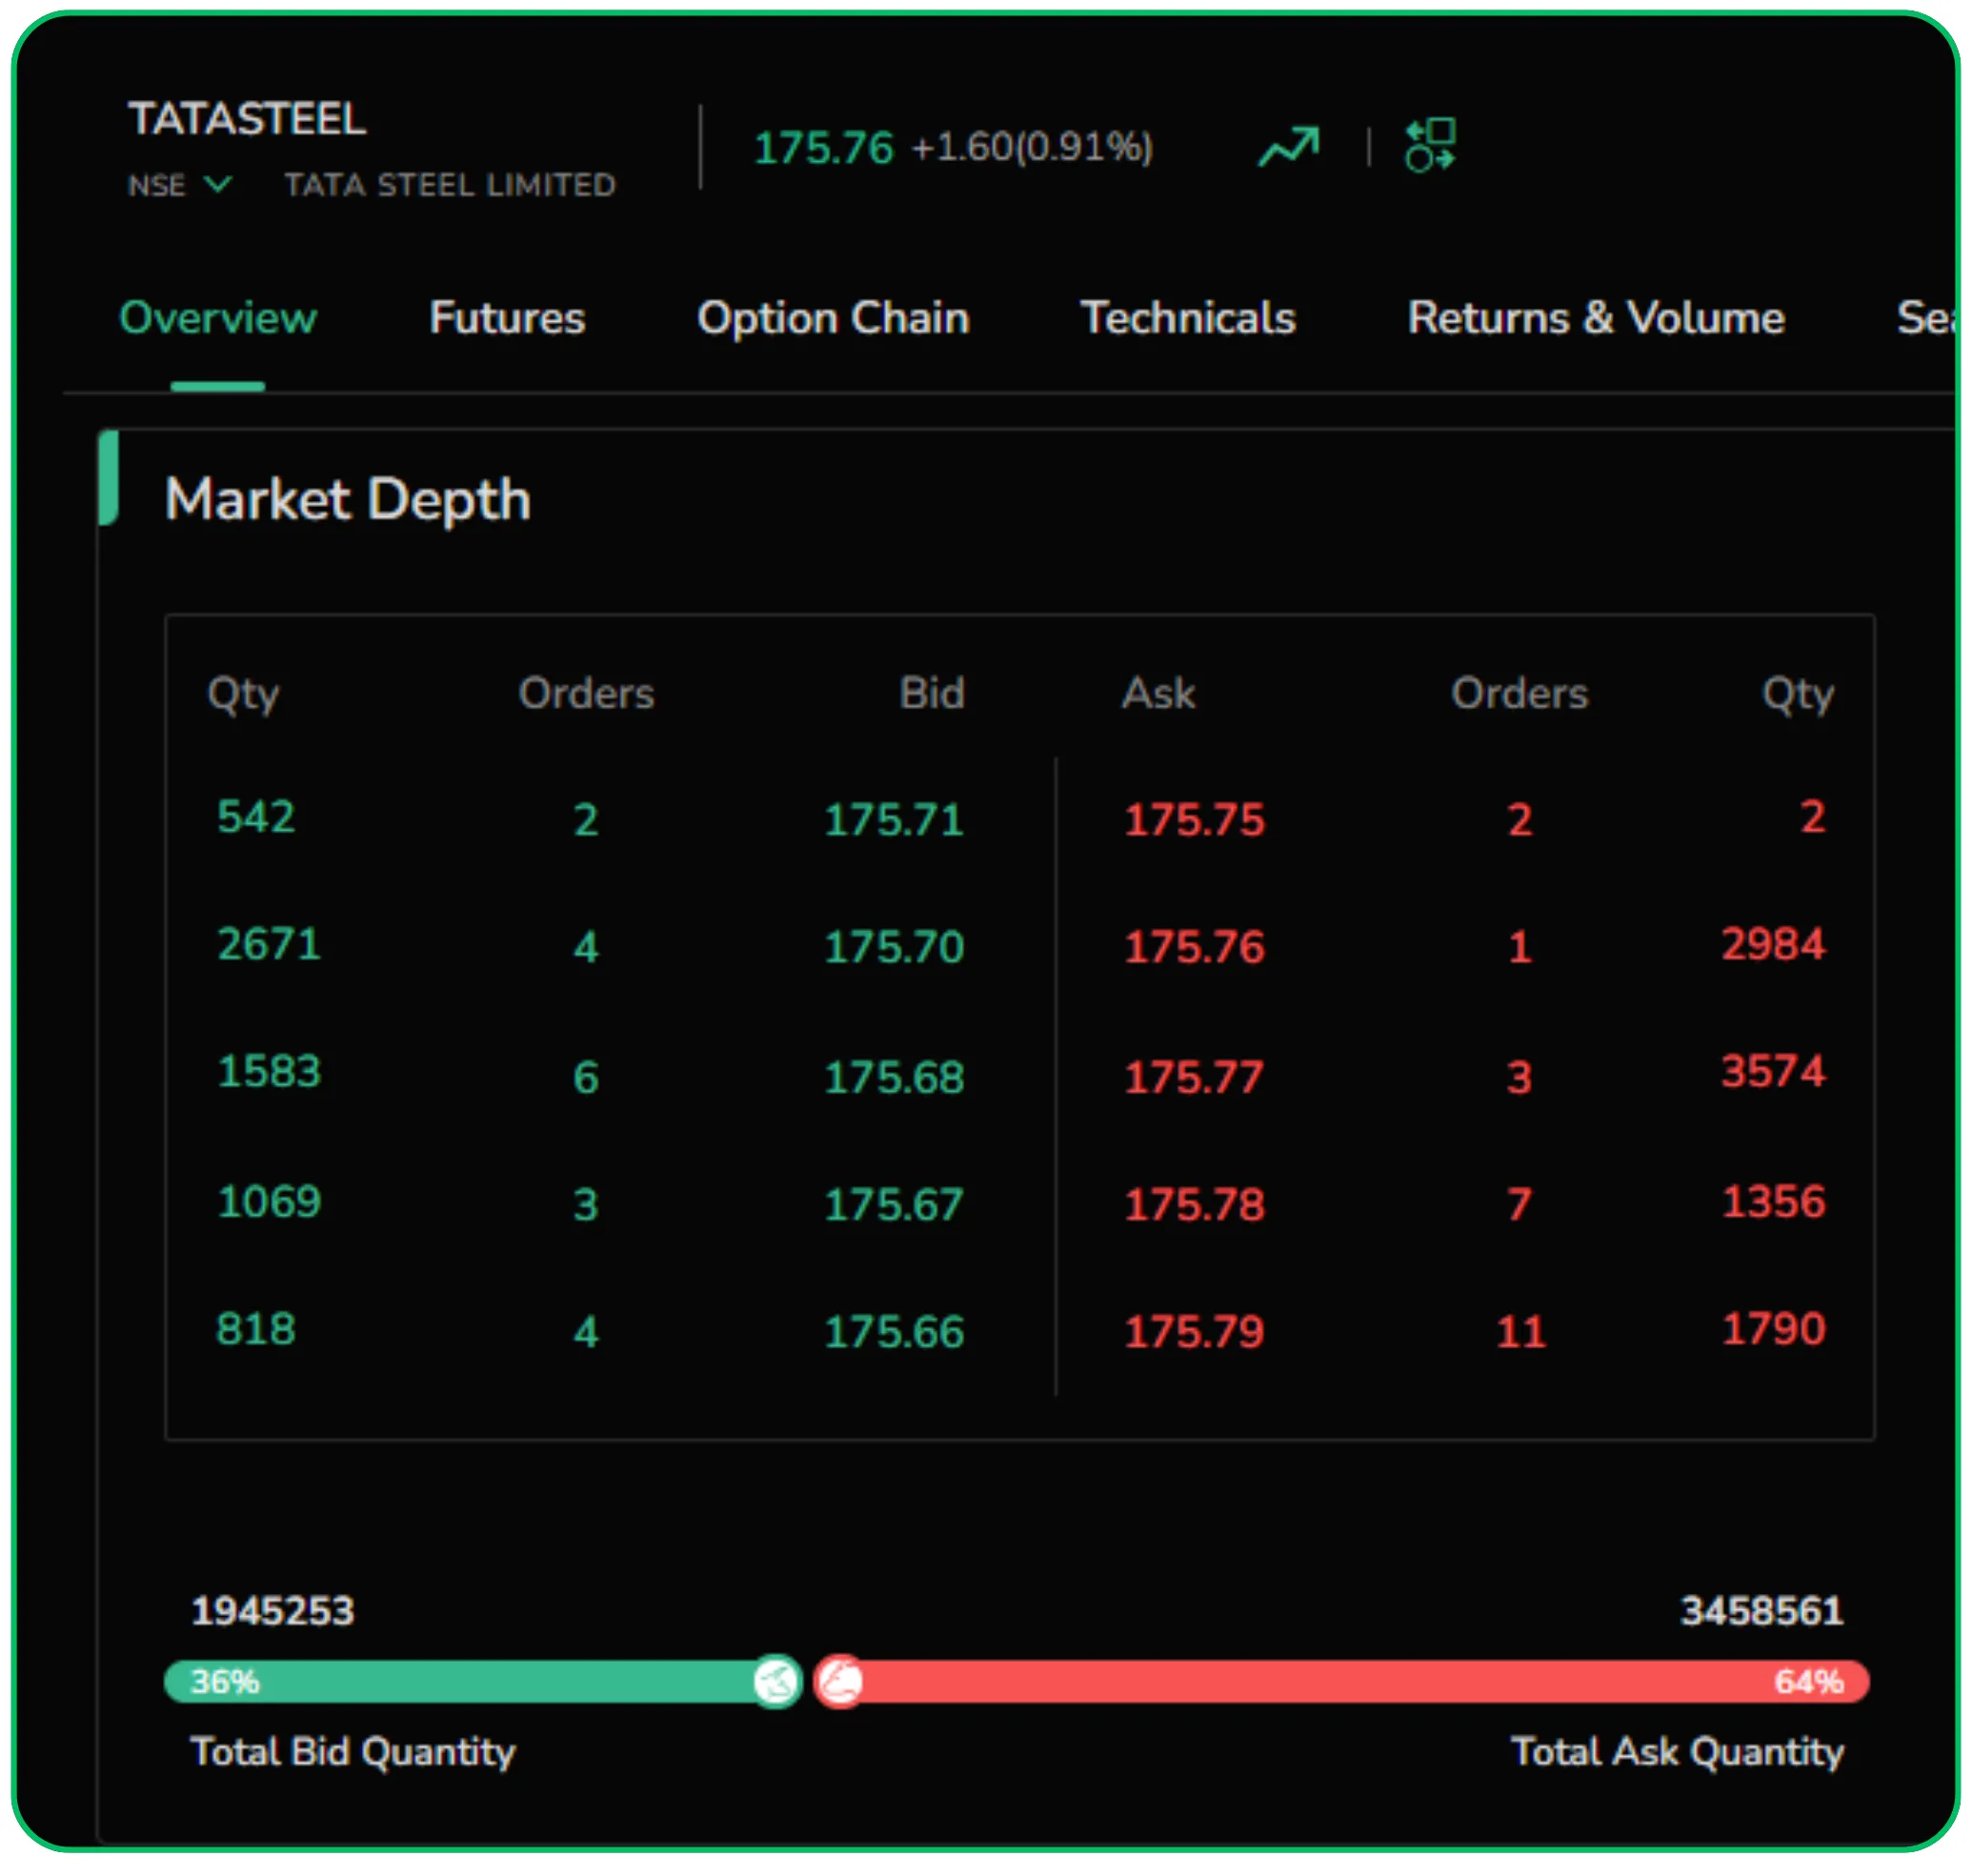
This crucial feature displays the demand and supply for a stock in real-time.
- Bid (Buy) Orders: Shows the quantity of shares investors are willing to buy at various prices (the "bid" price)
- Ask (Sell) Orders: Shows the quantity of shares investors are willing to sell at various prices (the "ask" price)
- Total Bid/Ask Quantity (with Percentage Bar): This visual bar at the bottom aggregates the total buy and sell orders. A higher percentage of total bid quantity suggests stronger buying interest, while a higher ask quantity points to more selling pressure. It helps gauge overall market sentiment for the stock
Also Read: Identifying Market Momentum with “High Breakers” and “Low Breakers”
Performance Metrics
This section provides vital statistics on the stock's trading activity and price movement.
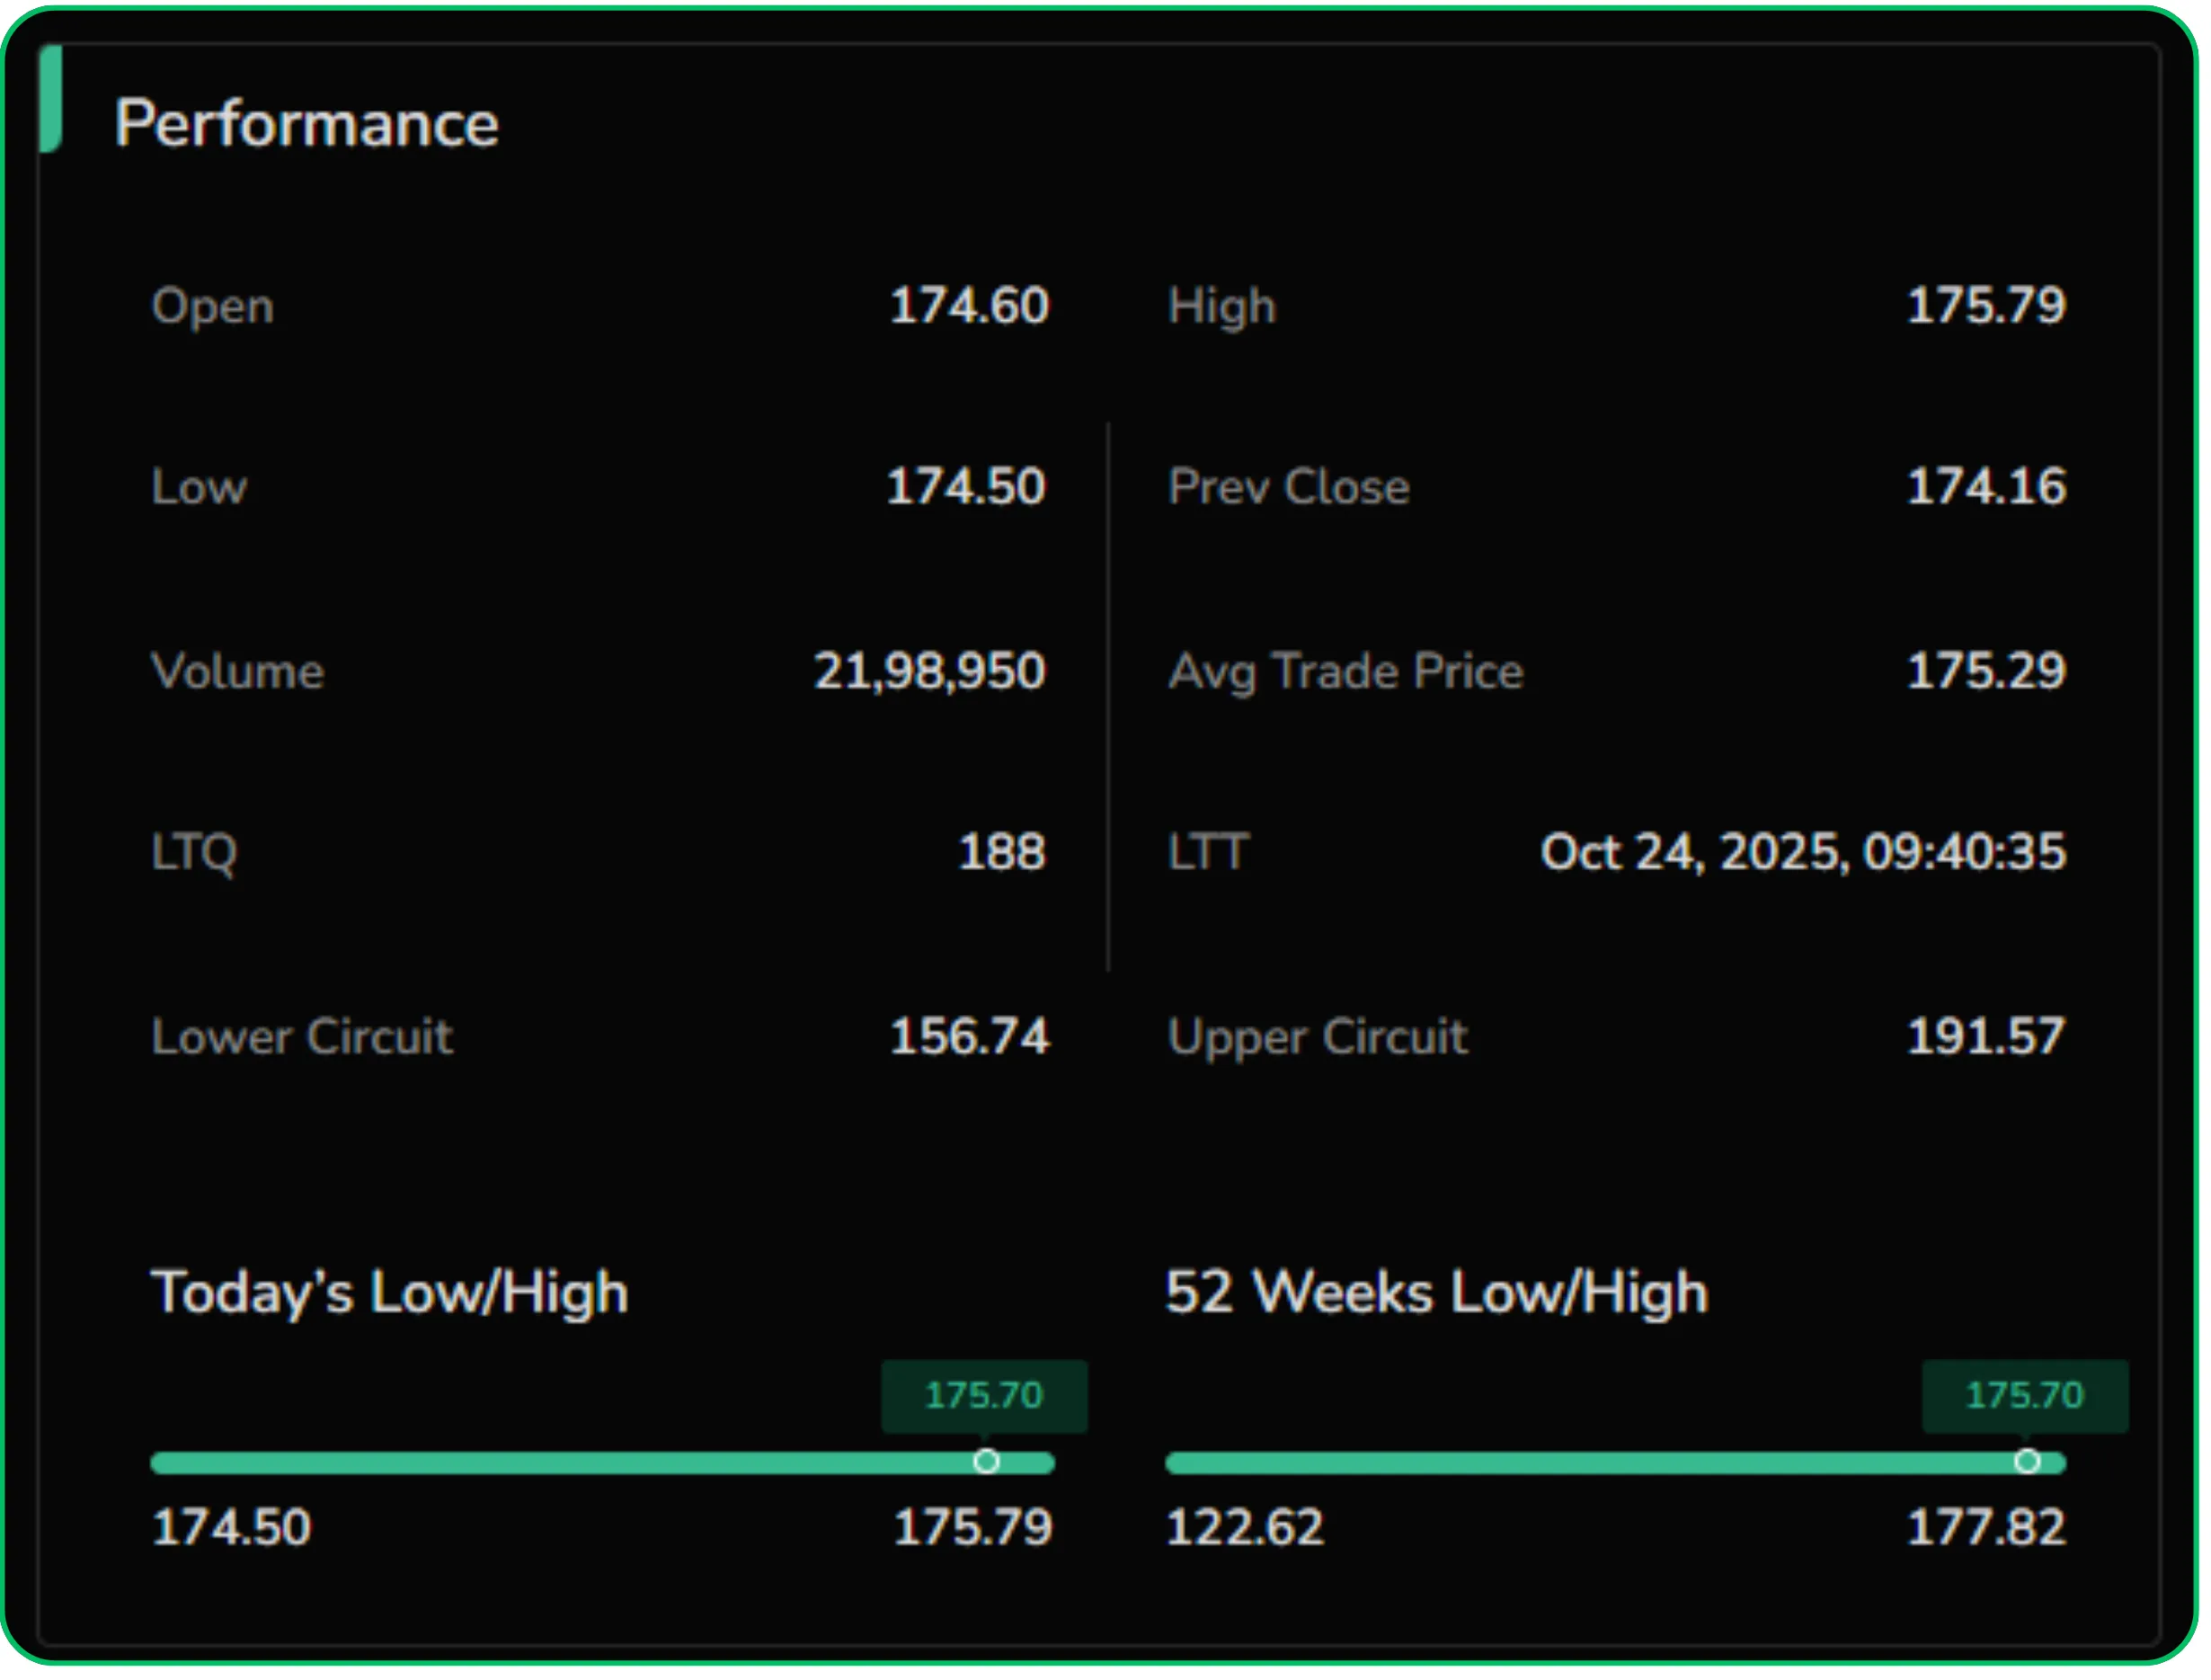
- Open, High, Low, Prev Close: Essential daily price points showing the stock's trading range and its closing price from the previous session
- Volume: The total number of shares traded for the day, indicating liquidity and investor interest
- Avg Trade Price: The average price at which shares have been traded during the day
- LTQ (Last Traded Quantity) & LTT (Last Traded Time): Shows the quantity and exact time of the most recent trade, useful for tracking immediate price action
- Lower Circuit / Upper Circuit: These are price limits set by exchanges to prevent excessive volatility. Trading beyond these points is temporarily halted
- Today's Low/High & 52 Weeks Low/High (with Price Bar): A visual representation of the current day's trading range relative to the stock's highest and lowest points over the past 52 weeks. This helps contextualize the current price performance
Support and Resistance Levels
This feature helps identify potential price barriers where a stock's trend might pause or reverse. CubePlus offers different methodologies for calculating these levels:
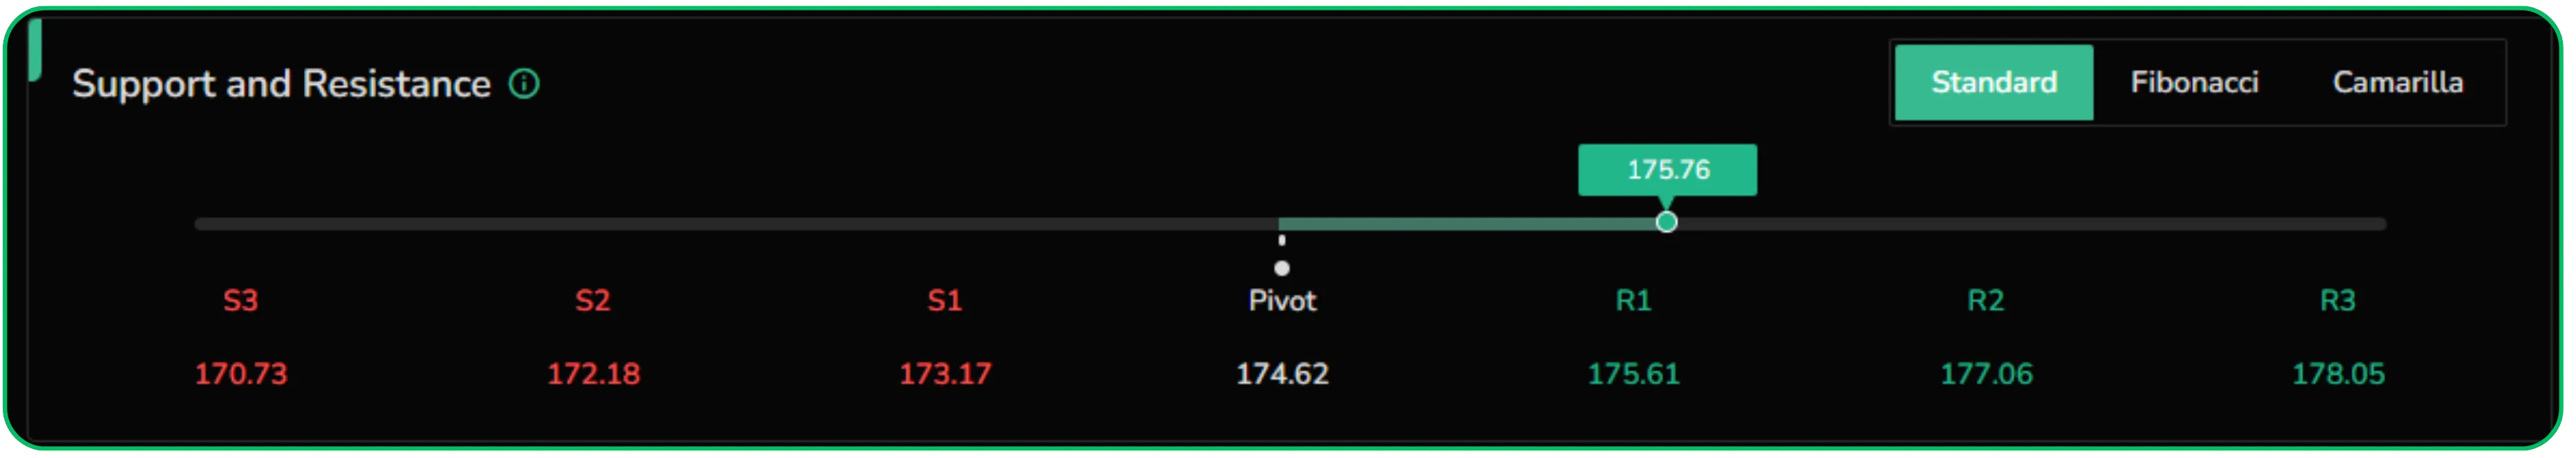
- Standard: Uses common calculations (often based on pivot points) to derive S1, S2, S3 (Support levels) and R1, R2, R3 (Resistance levels). Support levels are prices where buying interest is expected to be strong enough to prevent the price from falling further, while resistance levels are where selling interest is expected to be strong enough to prevent the price from rising further
- Fibonacci: Applies Fibonacci ratios to a stock's price range to identify potential support and resistance levels
- Camarilla: A more advanced pivot point method that generates tighter, more precise intraday support and resistance levels, often favored by active traders
- Pivot: The central pivot point, which is often considered the most important as it acts as a baseline for other support and resistance calculations. Prices above the pivot suggest bullish sentiment, while prices below suggest bearish sentiment
Key Statistics
This section provides fundamental data points crucial for evaluating a company's financial health and valuation. You can switch between Consolidated (group-level financial data) and Standalone (individual company financial data).
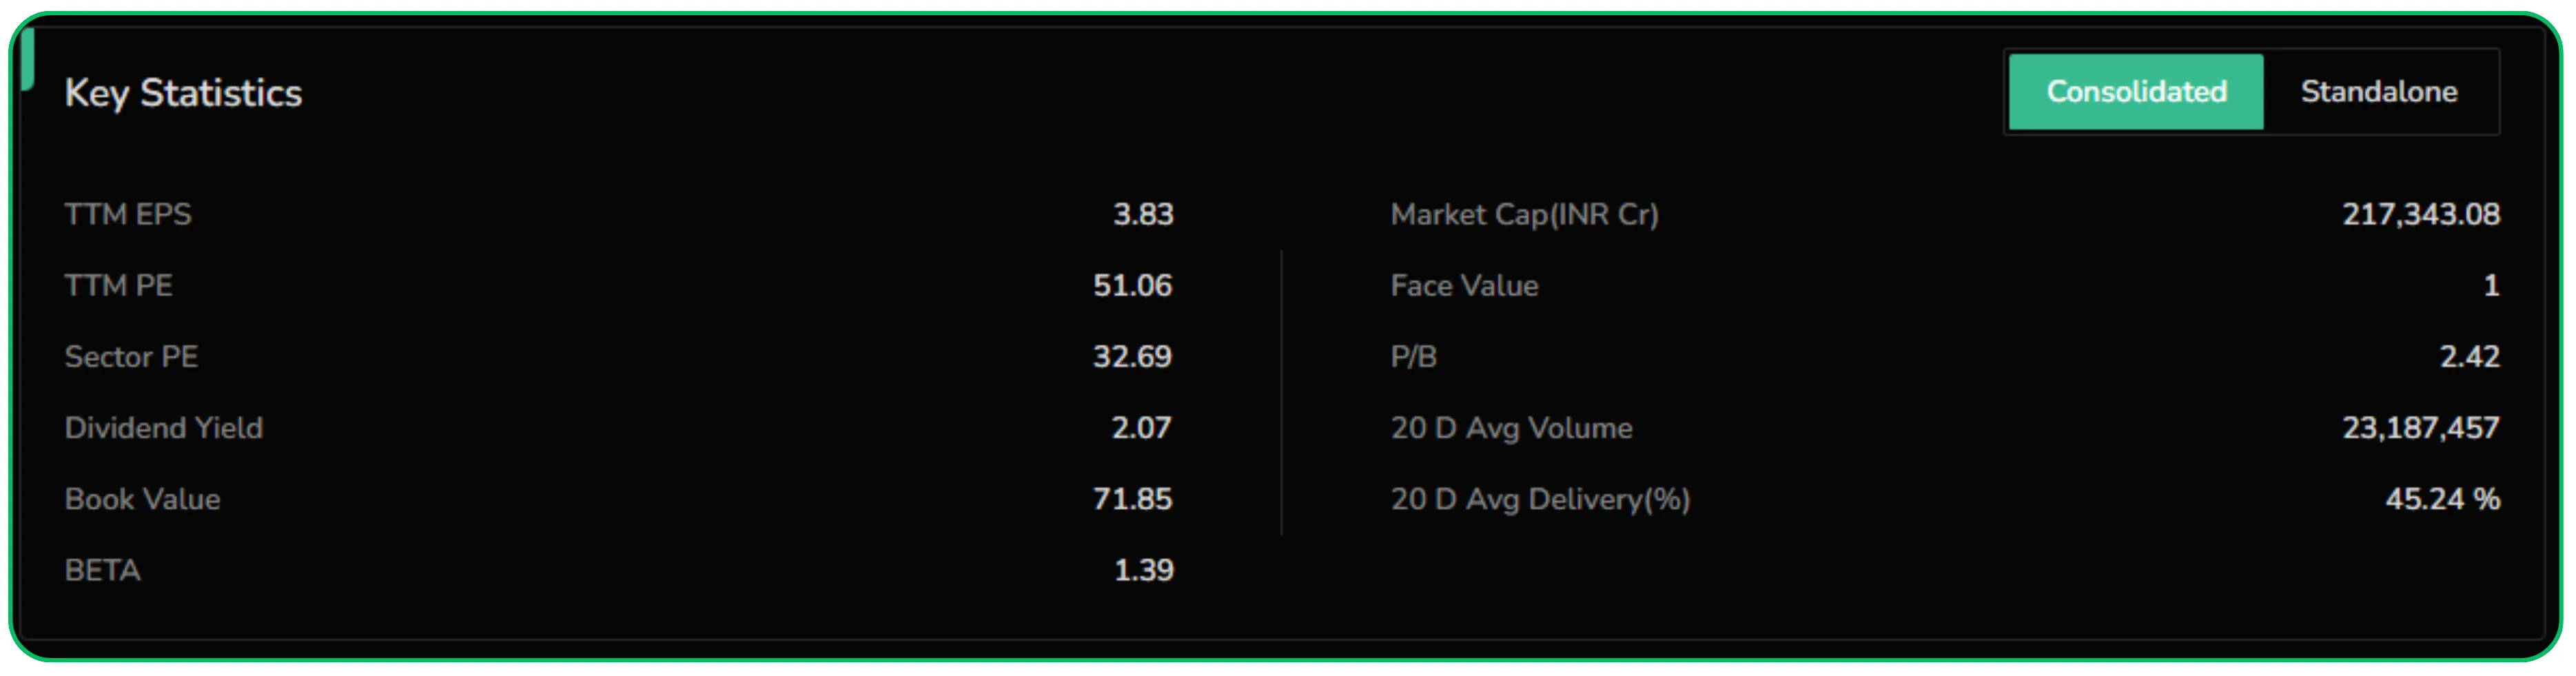
- TTM EPS (Trailing Twelve Months Earnings Per Share): The company's earnings per share over the past 12 months
- TTM PE (Trailing Twelve Months Price-to-Earnings Ratio): The stock's current price divided by its TTM EPS, a key valuation metric
- Sector PE: The average PE ratio of companies within the same sector, useful for comparing a stock's valuation against its peers
- Dividend Yield: The annual dividend payout per share as a percentage of the current share price, indicating the return an investor gets from dividends
- Book Value: The total assets minus intangible assets and liabilities, representing the theoretical value of a company's equity if it were to be liquidated
- BETA: A measure of a stock's volatility in relation to the overall market. A beta of 1.39 (as shown) means the stock is historically 39% more volatile than the market
- Market Cap (INR Cr): The total market value of a company's outstanding shares (share price × total shares), indicating its size
- Face Value: The nominal value of a share, often used for calculating dividends or corporate actions
- P/B (Price-to-Book Ratio): The stock's current price divided by its book value per share, another valuation metric
- 20 D Avg Volume: The average daily trading volume over the last 20 days, indicating average liquidity
- 20 D Avg Delivery (%): The average percentage of shares traded that resulted in actual delivery (held overnight) rather than intraday squaring off, often seen as an indicator of long-term investor interest
These features on the "Overview" tab collectively provide a powerful starting point for any equity analysis on CubePlus.
Also Read: Delivery Volume in the Cash Market: A Key Indicator for Investors
The Complete Financial Analysis Suite
CubePlus offers a centralized dashboard that provides instant access to an extensive ten-year financial history. Navigating to the "Financials" tab immediately presents you with a detailed view of a company's past performance.
Income Statement: The Income Statement (also known as the Profit & Loss Statement) reveals a company's revenues, expenses, and profit over a period. CubePlus allows you to view this data from FY2015 to FY2024, with the flexibility to toggle between quarterly, half-yearly, and annual views. The "Trends" column on the right provides immediate visual cues, highlighting the growth or decline of each metric over the selected period, with growth percentages often calculated automatically for quick analysis. This comprehensive historical perspective is crucial for understanding a company's operational efficiency and profitability trends
Balance Sheet: The Balance Sheet provides a snapshot of a company’s financial position at a specific point in time. Accessing this through CubePlus reveals the company's assets, liabilities, and equity over the same ten-year historical period. This allows you to track changes in a company's financial structure, liquidity (ability to meet short-term obligations), and solvency (ability to meet long-term obligations) over an extended timeframe, offering vital insights into its long-term stability
Cashflow Statement: The Cashflow Statement tracks the movement of cash and cash equivalents. CubePlus provides a detailed breakdown of Cash Flow from Operating Activities (CFO), Investing Activities (CFI), and Financing Activities (CFF) for the last ten years. Analyzing these figures historically helps investors understand a company's ability to generate cash from its core operations, how it's investing for future growth, and its approach to managing debt and equity, providing a clearer picture of its true financial health beyond just profits
Key Ratios & Metrics: Deeper Insights
Beyond raw financial statements, CubePlus intelligently processes this data into a comprehensive set of financial ratios, accessible under the "Ratios" sub-tab. These ratios standardize financial data, making it easier to compare a company's performance over time, against its competitors, or industry benchmarks.
Valuation Ratios: Get instant access to critical metrics like P/E (Price-to-Earnings), P/B (Price-to-Book), and EV/EBITDA (Enterprise Value to Earnings Before Interest, Taxes, Depreciation, and Amortization). These ratios help you determine if a stock is overvalued, undervalued, or fairly priced relative to its earnings, assets, or operational cash flow, aiding in crucial investment decisions
Profitability Ratios: CubePlus provides key indicators such as ROE (Return on Equity), ROCE (Return on Capital Employed), and Net Profit Margin. These ratios measure how effectively a company is generating profits from shareholders' investments, capital employed, and sales, respectively. Analyzing their historical trends helps assess management efficiency and profitability consistency
Leverage Ratios: Understand a company's debt management with ratios like Debt-to-Equity. This metric reveals the proportion of equity and debt used to finance a company's assets, indicating its financial risk and solvency
Shareholdings: Understanding Ownership Dynamics
Finally, the "Shareholdings" sub-tab within Financials provides a detailed breakdown of who owns the company's stock over time.
Promoter Holding, FII (Foreign Institutional Investor) Holding, DII (Domestic Institutional Investor) Holding, and Public Holding: These figures, presented historically, allow you to track changes in institutional and retail ownership. Significant shifts can signal growing confidence or concern among various investor groups
Key Ratios & Metrics: The platform provides critical Valuation Ratios (P/E, P/B, EV/EBITDA), Profitability Ratios (ROE, ROCE, Net Profit Margin), and Leverage Ratios (Debt-to-Equity), giving you a multi-faceted view of a company's performance and value.
Disclaimer: The information provided in our blogs is for informational purposes only and should not be construed as financial, investment, or trading advice. Trading and investing in the securities market carries risk. Always conduct your own research and consult with a qualified financial advisor before making any investment decisions. Past performance is not indicative of future results. Copyrighted and original content for your trading and investing needs.
© 2025 — Tradejini. All Rights Reserved.