


Momentum is the pulse of the market , knowing where it’s picking up or losing steam can change how you trade. That’s exactly what the High Breakers and Low Breakers modules are built for. They track stocks making new highs or lows across different timeframes and indices, so you can spot emerging trends, reversals, or potential breakouts as they happen. It’s a clean, data-backed way to stay aligned with market momentum.
High Breakers – Tracking Emerging Strength
The High Breakers screen spots stocks breaking past their previous highs within a chosen timeframe. These moves often hint at fresh buying momentum, a continuation of an uptrend, or the quiet entry of institutional money.
You can switch between multiple timeframes based on your trading style:
- Day: Captures intraday breakouts for short-term opportunities
- Week: Flags sustained strength across sessions, ideal for swing traders
- 52 Week: Highlights long-term outperformers hitting new yearly highs
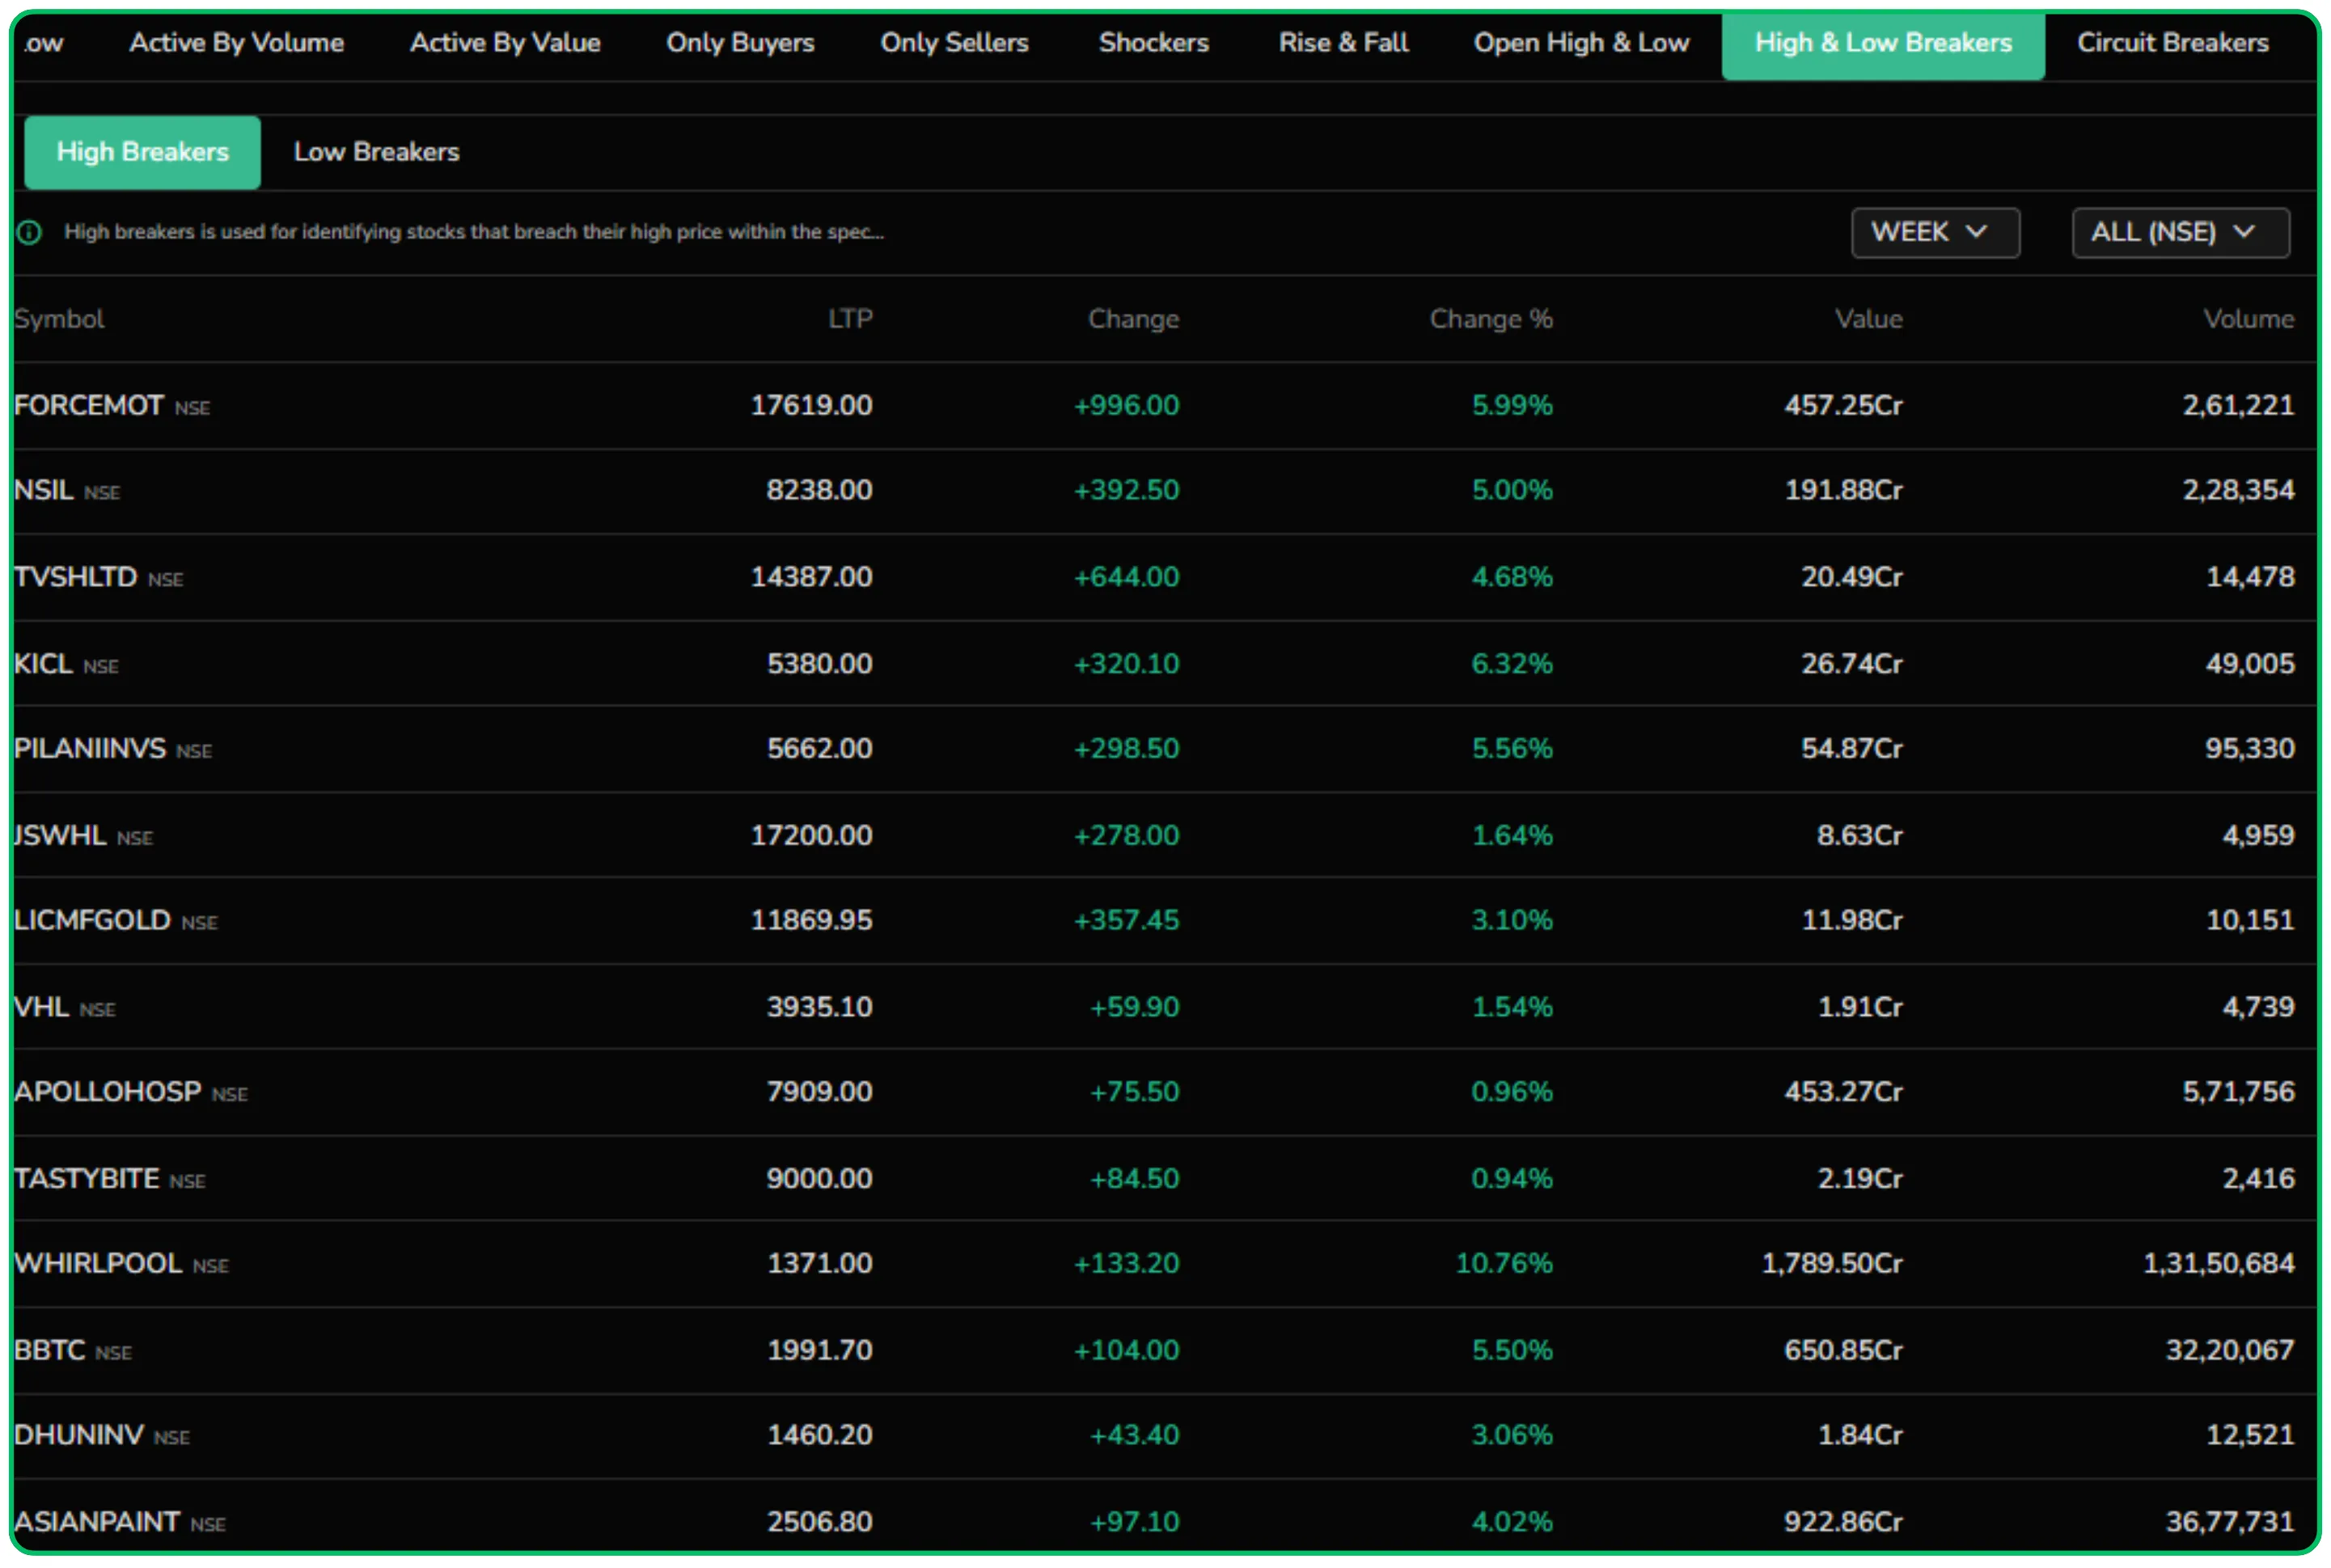
Take this example: during a weekly scan, stocks like FORCEMOT, NSIL, and TVSHLTD showed strong price expansion backed by healthy volume and turnover , a classic sign of broad participation. When a stock repeatedly appears across multiple timeframes, it strengthens conviction in its momentum.
You can also filter the High Breakers list by index , whether it’s NIFTY 50, NIFTY Midcap 100, or All NSE, to focus on specific segments and compare how leaders in the benchmark stack up against the broader market.
Also Read: Placing Orders with the CubePlus API Using Python
Low Breakers – Spotting Weakness and Distribution
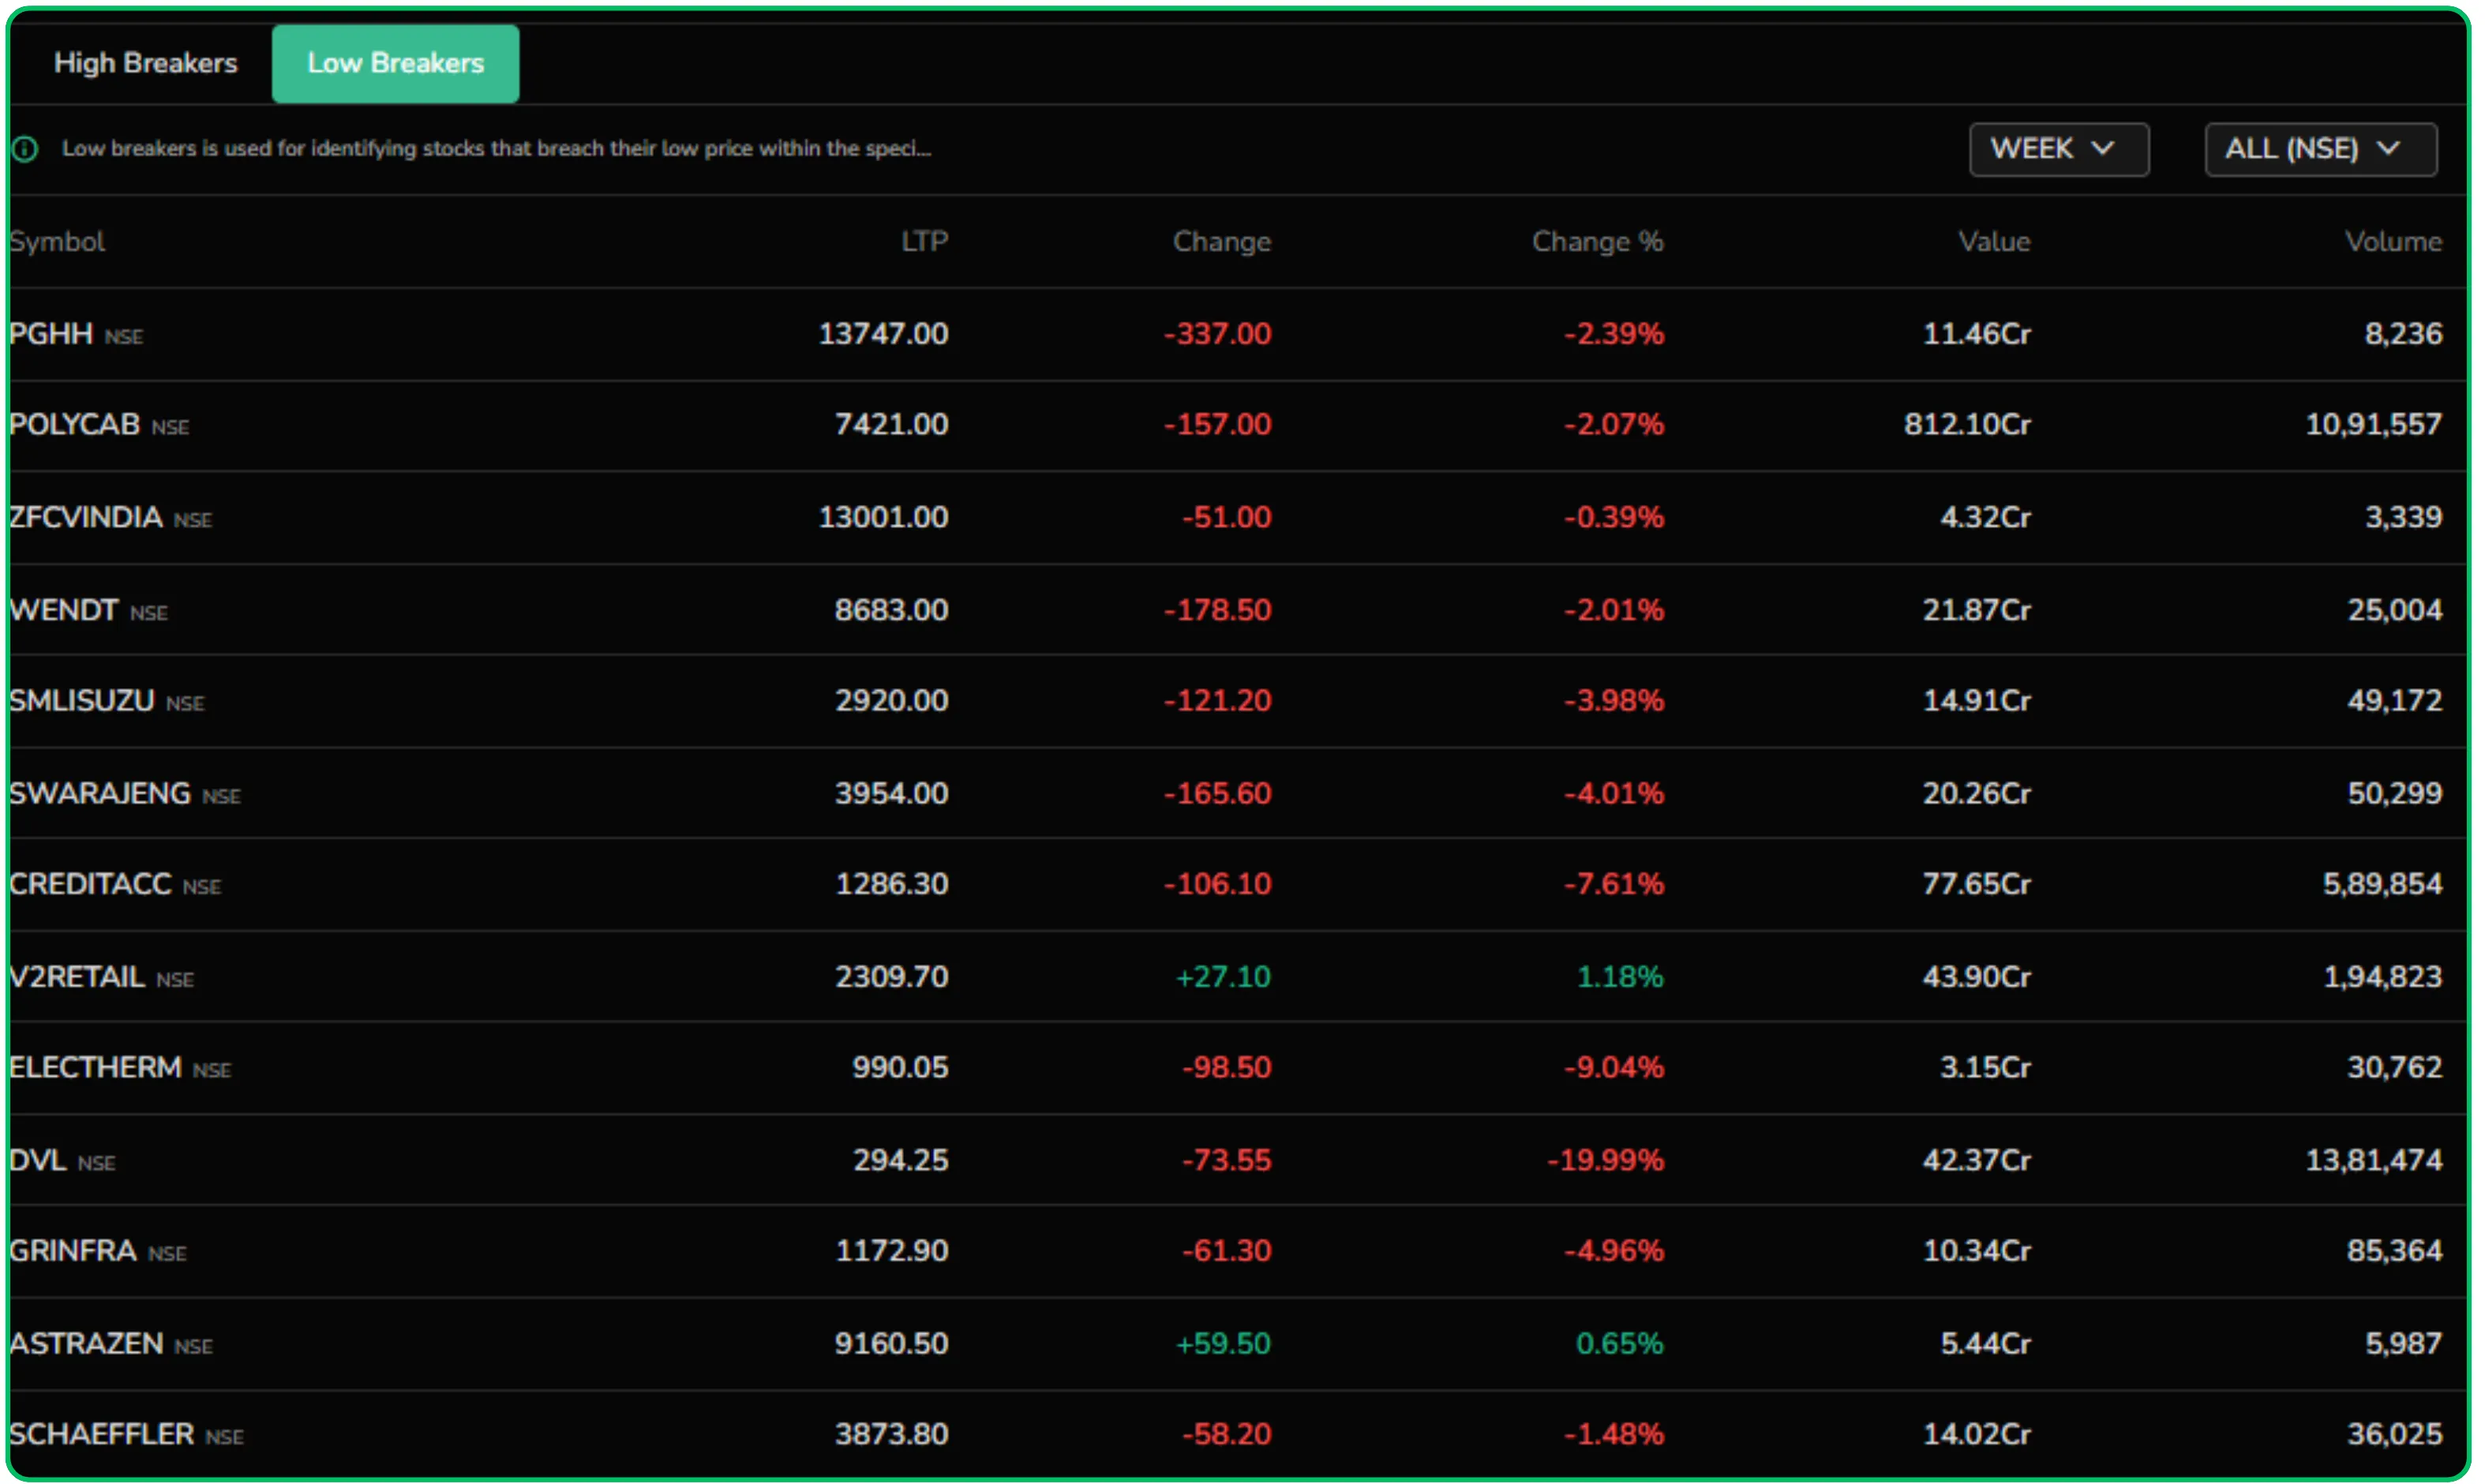
If High Breakers signal strength, the Low Breakers screen does the opposite , it highlights stocks slipping below their recent lows within a chosen period. These breakdowns often hint at profit-booking, emerging weakness, or a possible trend reversal.
In the daily Low Breakers list, stocks like INFY, HCLTECH, and WIPRO surfaced after sharp declines, showing clear price erosion along with heavy traded value , a typical sign of selling pressure or early-stage corrections.
Switch to the weekly view, and only a few names such as ETERNAL, INFY, and WIPRO continue to appear. That persistence suggests short-term dips are evolving into more sustained downtrends. For positional traders, these weekly breakdowns can help spot emerging short opportunities or plan re-entries after a corrective phase.
Customization and Sorting Tools
One of the biggest strengths of the High and Low Breakers module is how customizable it is. You can narrow your focus to specific indices , like NIFTY 50, NIFTY Next 50, or any sectoral index , to study momentum within chosen market segments.
It also lets you sort stocks by key parameters such as Change (%), Volume, or Value, helping you quickly zero in on what matters most:
- High-Volume Breakouts: Suggest strong participation
- Large Percentage Movers: Fit momentum-driven strategies
- High-Value Trades: May hint at institutional activity
These sorting and filtering tools make it easier to separate meaningful moves from ordinary market noise, ensuring your focus stays on statistically significant trends.
Integrating High and Low Breakers into Your Trading Process
Experienced traders often view the High and Low Breakers together to get a complete picture of market momentum.
- High Breakers: Show where buying interest and fresh capital are flowing in
- Low Breakers: Reveal where sentiment is weakening or funds are exiting
Tracking both screens side by side helps identify sector rotation, market sentiment shifts, and risk dispersion. For example, if several technology stocks show up in the Low Breakers list while financial names dominate the High Breakers list, it could signal institutional money rotating out of IT and into banking.
Using the weekly timeframe adds another layer of clarity , it smooths out intraday noise and highlights whether these momentum shifts are likely to sustain.
Also read: CubePlus Option Terminal: The Complete Guide to Advanced Options Trading
How Traders Use High Breakers in Practice
Spotting Momentum Entries
Traders watch for stocks hitting new highs on rising volumes , a classic sign of a breakout with sustained interest. For instance, BHARTIARTL, up 2.27% with a turnover of ₹1,277 crore, could indicate strong momentum suitable for short-term trades.
Confirming Trend Continuation
When a stock shows up across multiple timeframes, say in both weekly and 52-week lists, it reinforces a consistent uptrend. This is particularly valuable for swing traders or investors looking to build positions in fundamentally strong companies.
Avoiding False Breakouts
Not every high is meaningful. Traders check if the stock closes above the breakout level with healthy volume. A marginal slip, like BAJAJ-AUTO retreating slightly after touching a high, may signal exhaustion rather than genuine strength.
Tracking Sectoral Momentum
When multiple names from the same sector , such as HDFCBANK, BHARTIARTL, and ICICIBANK , appear together, it often points to a sector-wide momentum shift. Recognizing these clusters helps traders align with sector rotation trends and allocate capital more efficiently.
Intraday Breakout Trading
For active intraday traders, the Day view is particularly useful. When combined with technical indicators like volume breakouts, relative strength, and moving average confirmations, it provides actionable entry points within the trading session.
Risk Considerations
High Breakers provide a clear view of market strength, but caution is key. Breakouts without meaningful volume or those occurring in an overextended market can reverse quickly. To manage risk effectively:
- Check volume and price action to ensure the move is supported.
- Confirm trend structure on broader timeframes to avoid chasing short-lived spikes.
- Use strict stop-loss levels to protect capital in case the breakout fails.
Strategic Application
Timeframes in the High Breakers module serve different trading purposes:
- Daily Breakers: Suited for intraday or short-term trades
- Weekly Breakers: Help identify swing trading opportunities
- 52-Week Breakers: Highlight long-term trend leaders, often preferred by institutional and positional traders
Disciplined traders combine these signals with broader market indicators, like the NIFTY trend, volatility index, and sector rotation data , to make informed decisions.
Conclusion
The High Breakers screen is more than just a watchlist , it’s a momentum discovery tool. By analyzing price action, volume, and trend behavior, traders can spot early signs of strength, confirm ongoing trends, and manage entries with greater precision.
When used with proper validation and risk management, this feature helps traders align with the market’s strongest currents instead of reacting after the move has already played out.
Disclaimer: The information provided in our blogs is for informational purposes only and should not be construed as financial, investment, or trading advice. Trading and investing in the securities market carries risk. Always conduct your own research and consult with a qualified financial advisor before making any investment decisions. Past performance is not indicative of future results. Copyrighted and original content for your trading and investing needs.
© 2025 — Tradejini. All Rights Reserved.