CubePlus Web now has a new dashboard experience. Earlier, the dashboard was a single page without widgets. Now, you can use customizable widgets and arrange or move them around based on your preferences. The dashboard is built around two dedicated tabs: Stocks and Derivatives.
The Stocks tab is your home for equity investing. It brings together portfolio tracking, stock analytics, market movers, ETFs, results, and other tools that help you research and monitor the cash market in one place. The Derivatives tab is built specifically for futures and options traders. It gives you quick access to option chains, top-traded contracts, F&O analytics, market scans, and other derivatives-focused insights without the clutter of equity screens.
In the walkthrough ahead, we'll go through each screen in both tabs and see how these tools fit into real trading and investing workflows.
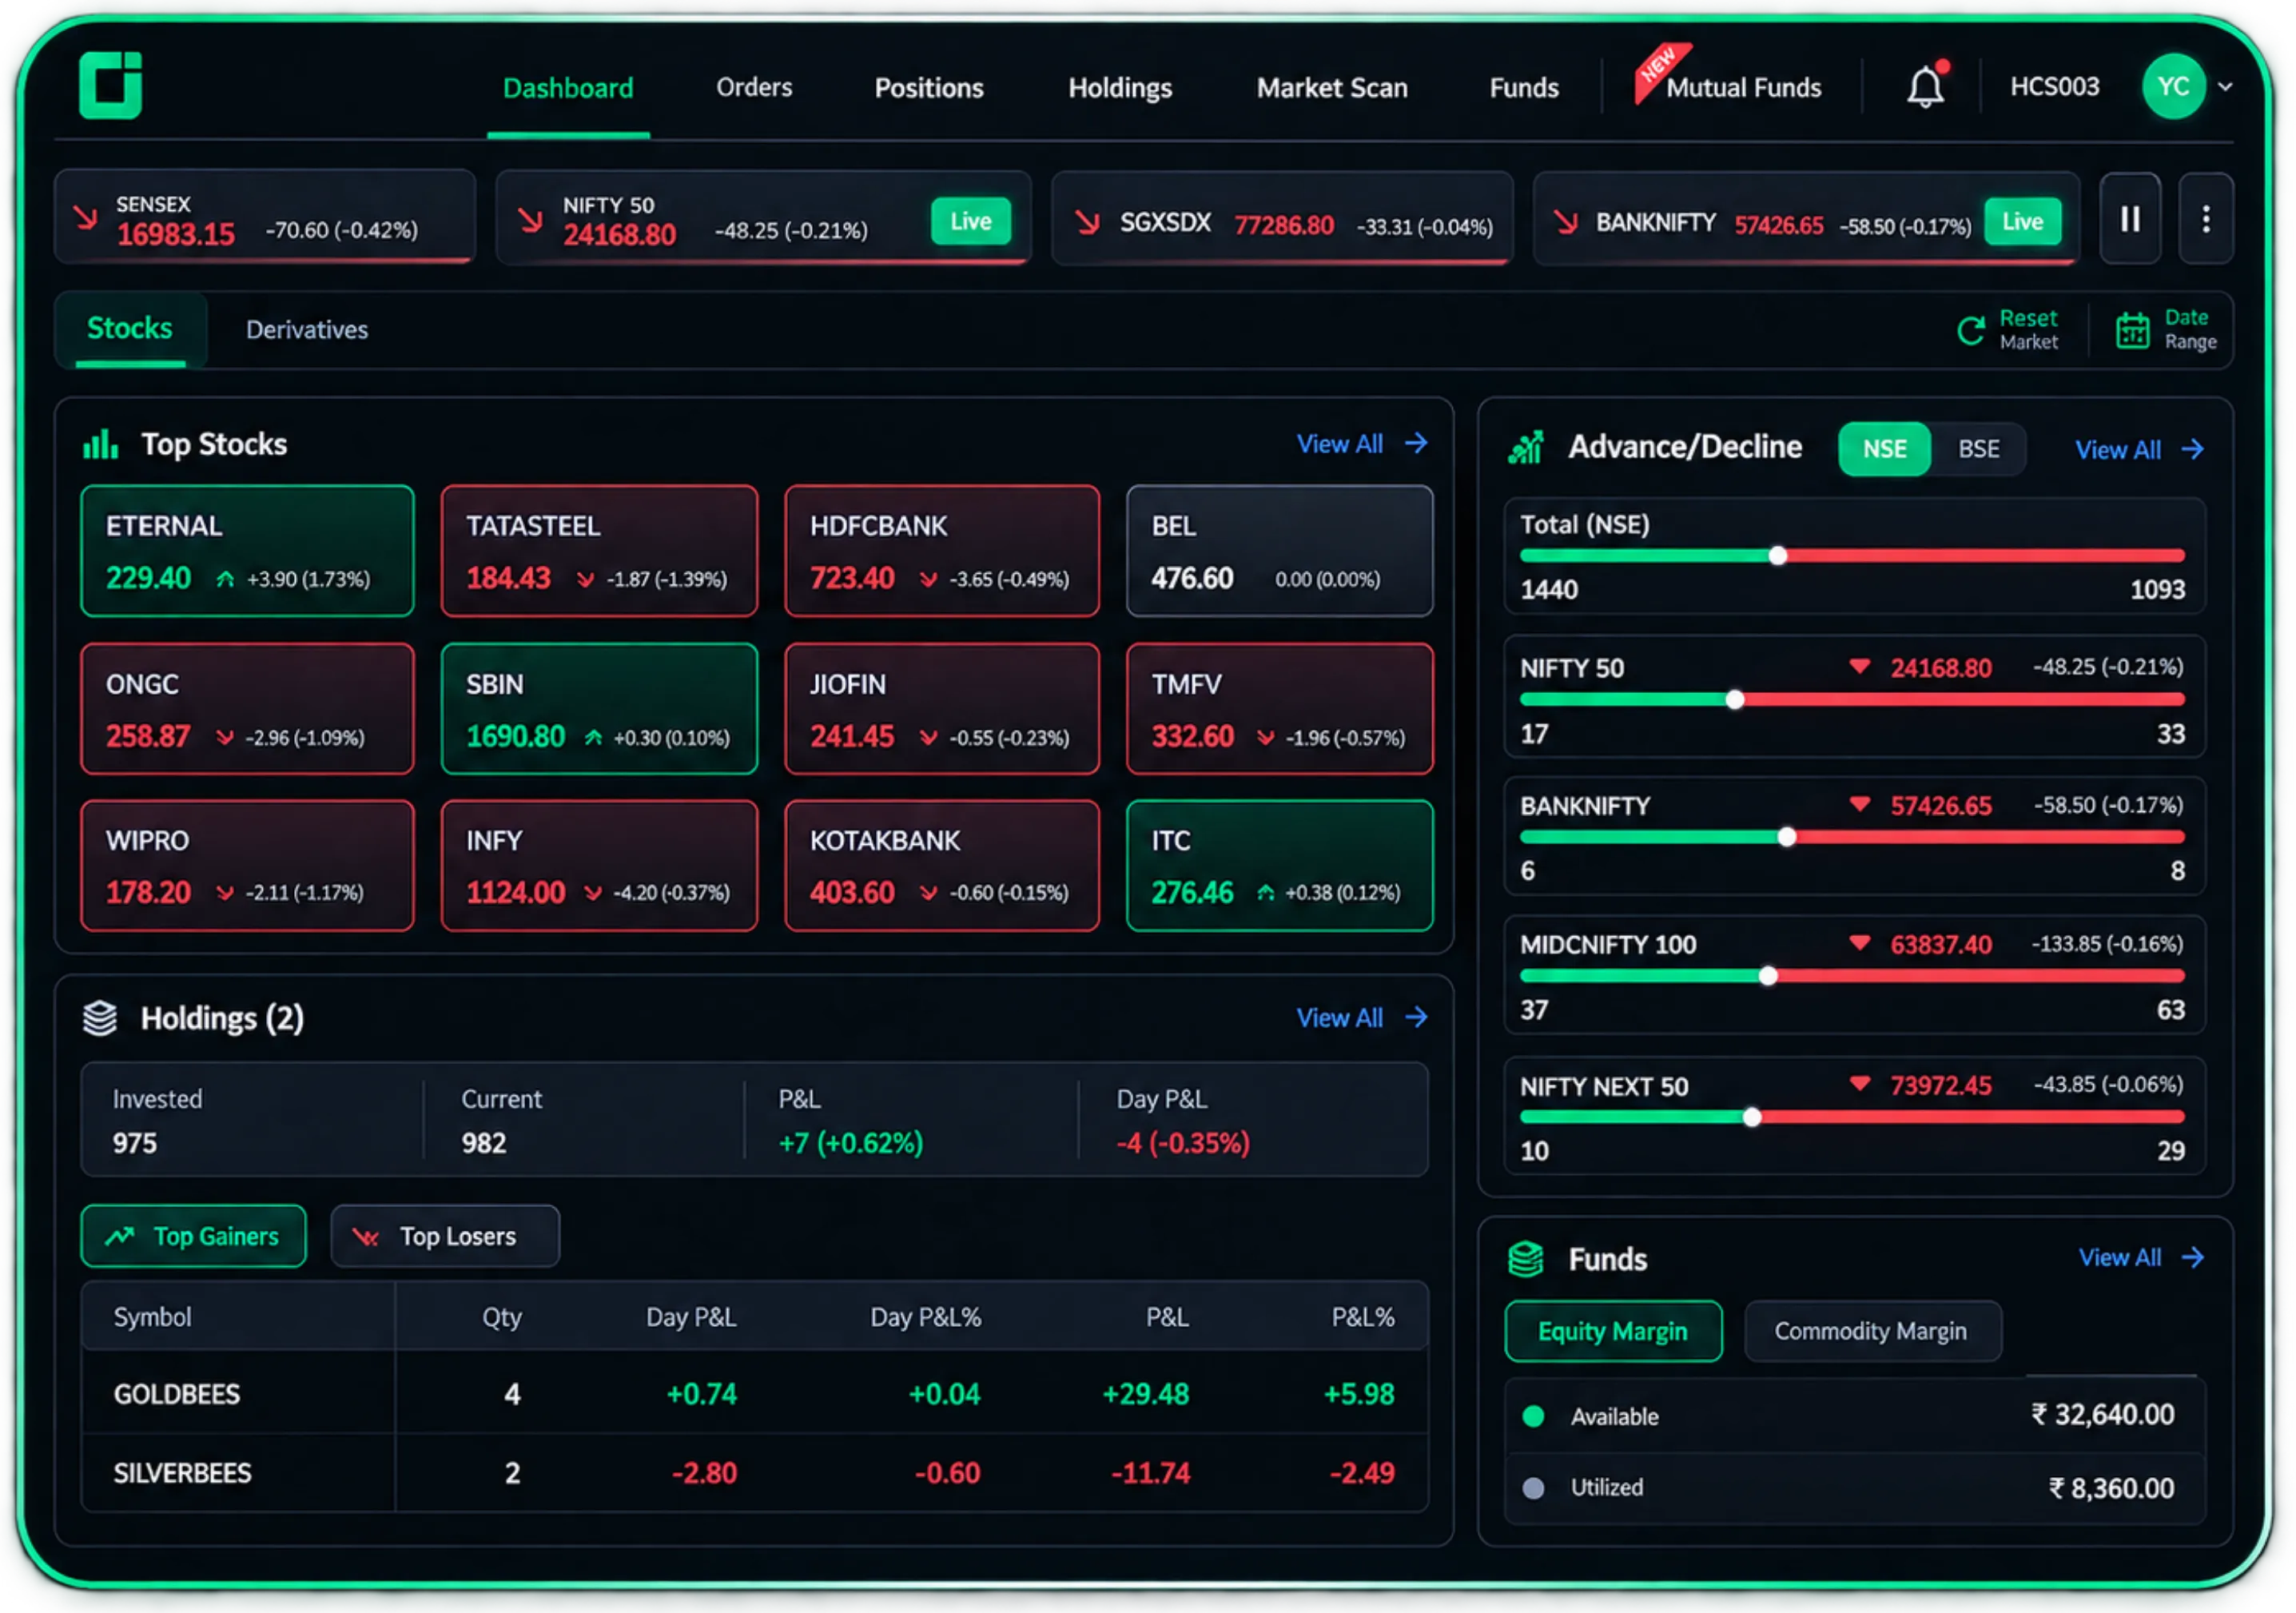
The Stocks tab: Top Stocks, Holdings, and Advance/Decline breadth on one screen
A Ticker You Can Shape
The index ticker scrolling across the top is now configurable. Open Manage Indices from the settings icon and pick exactly which indices you want to track, from Nifty 50 and Sensex to sector gauges like Nifty Auto, Nifty Pharma, or Nifty Oil & Gas. You can also pause the ticker entirely if it's distracting you mid-analysis.

When you hover over a ticker in the running index bar, a small row of quick-action icons pops up right below it: chart, option chain, strategy builder, alerts, and pin. In this shot, the cursor is resting on the option chain icon for FINNIFTY, and a tooltip labeled "Option Chain" confirms it. Clicking it takes you straight to the FINNIFTY option chain, without leaving the dashboard or searching for it separately.

"Manage Indices" panel, opened from the settings icon next to the ticker. It lists every index available for the ticker bar, like Nifty 50, Sensex, Bank Nifty, Fin Nifty, India VIX, etc . Each has a checkbox and a drag handle (the three lines on the left) next to it; check or uncheck to add or remove an index from the ticker, and drag using the handle to reorder how they appear. A minimum of eight columns must stay selected, and a Reset link at the top restores the default set.
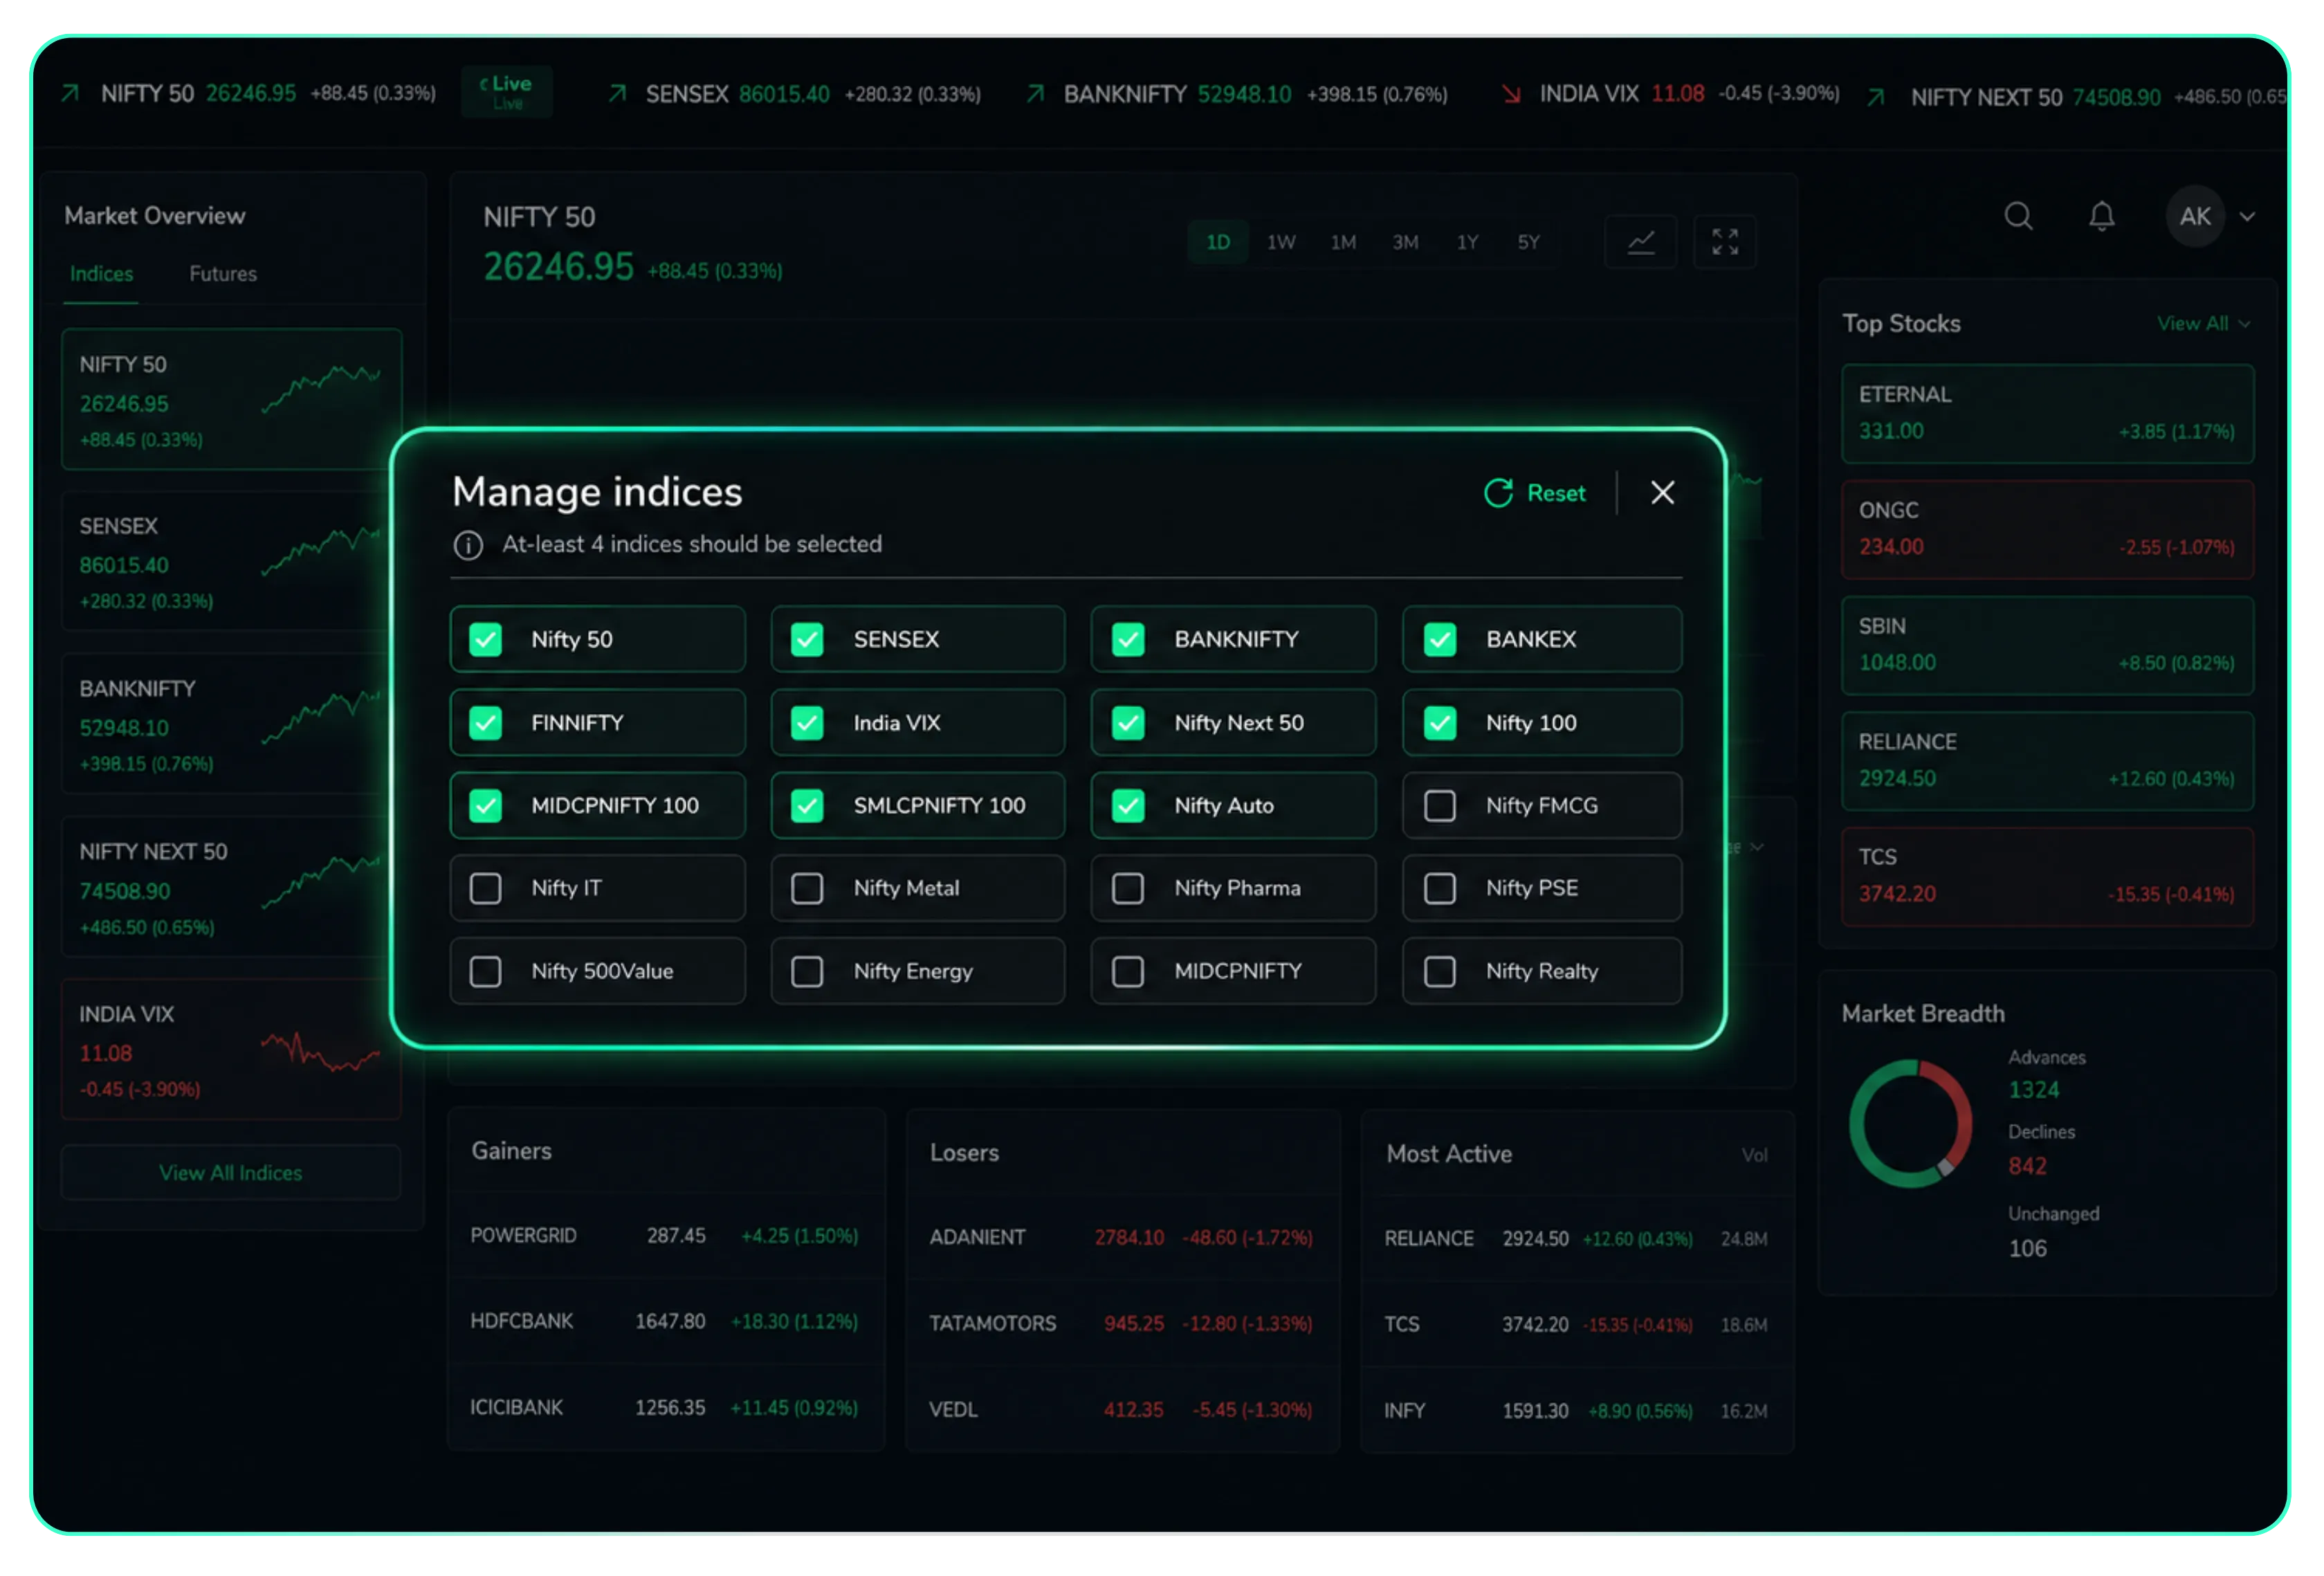
Manage Indices: choose which indices appear in the scrolling ticker.
Use case: if you only trade Bank Nifty options, drop Nifty IT and Nifty Metal from the ticker and keep Bank Nifty, India VIX, and Nifty 50 in view. Hover over any ticker symbol, and a small menu pops up for its chart, option chain, or strategy builder, or to pin it, all without leaving the dashboard.
Advance/Decline
Advance/decline breadth shows how many stocks in an index are rising versus falling at any given moment. It helps you see whether an index move is broad-based or being driven by just a few heavyweight stocks. For example, if Nifty 50 is up but only 20 stocks are advancing while 30 are declining, the rally may be relying heavily on a handful of large-cap stocks. Strong breadth moving in the same direction as the index suggests wider participation and adds confidence to the move.
Breadth can also act as an early warning signal. If the index continues to rise but fewer stocks participate, it can indicate that the rally is losing momentum. It is best used as a filter rather than a standalone signal, helping traders judge how healthy or fragile a rally or selloff really is.
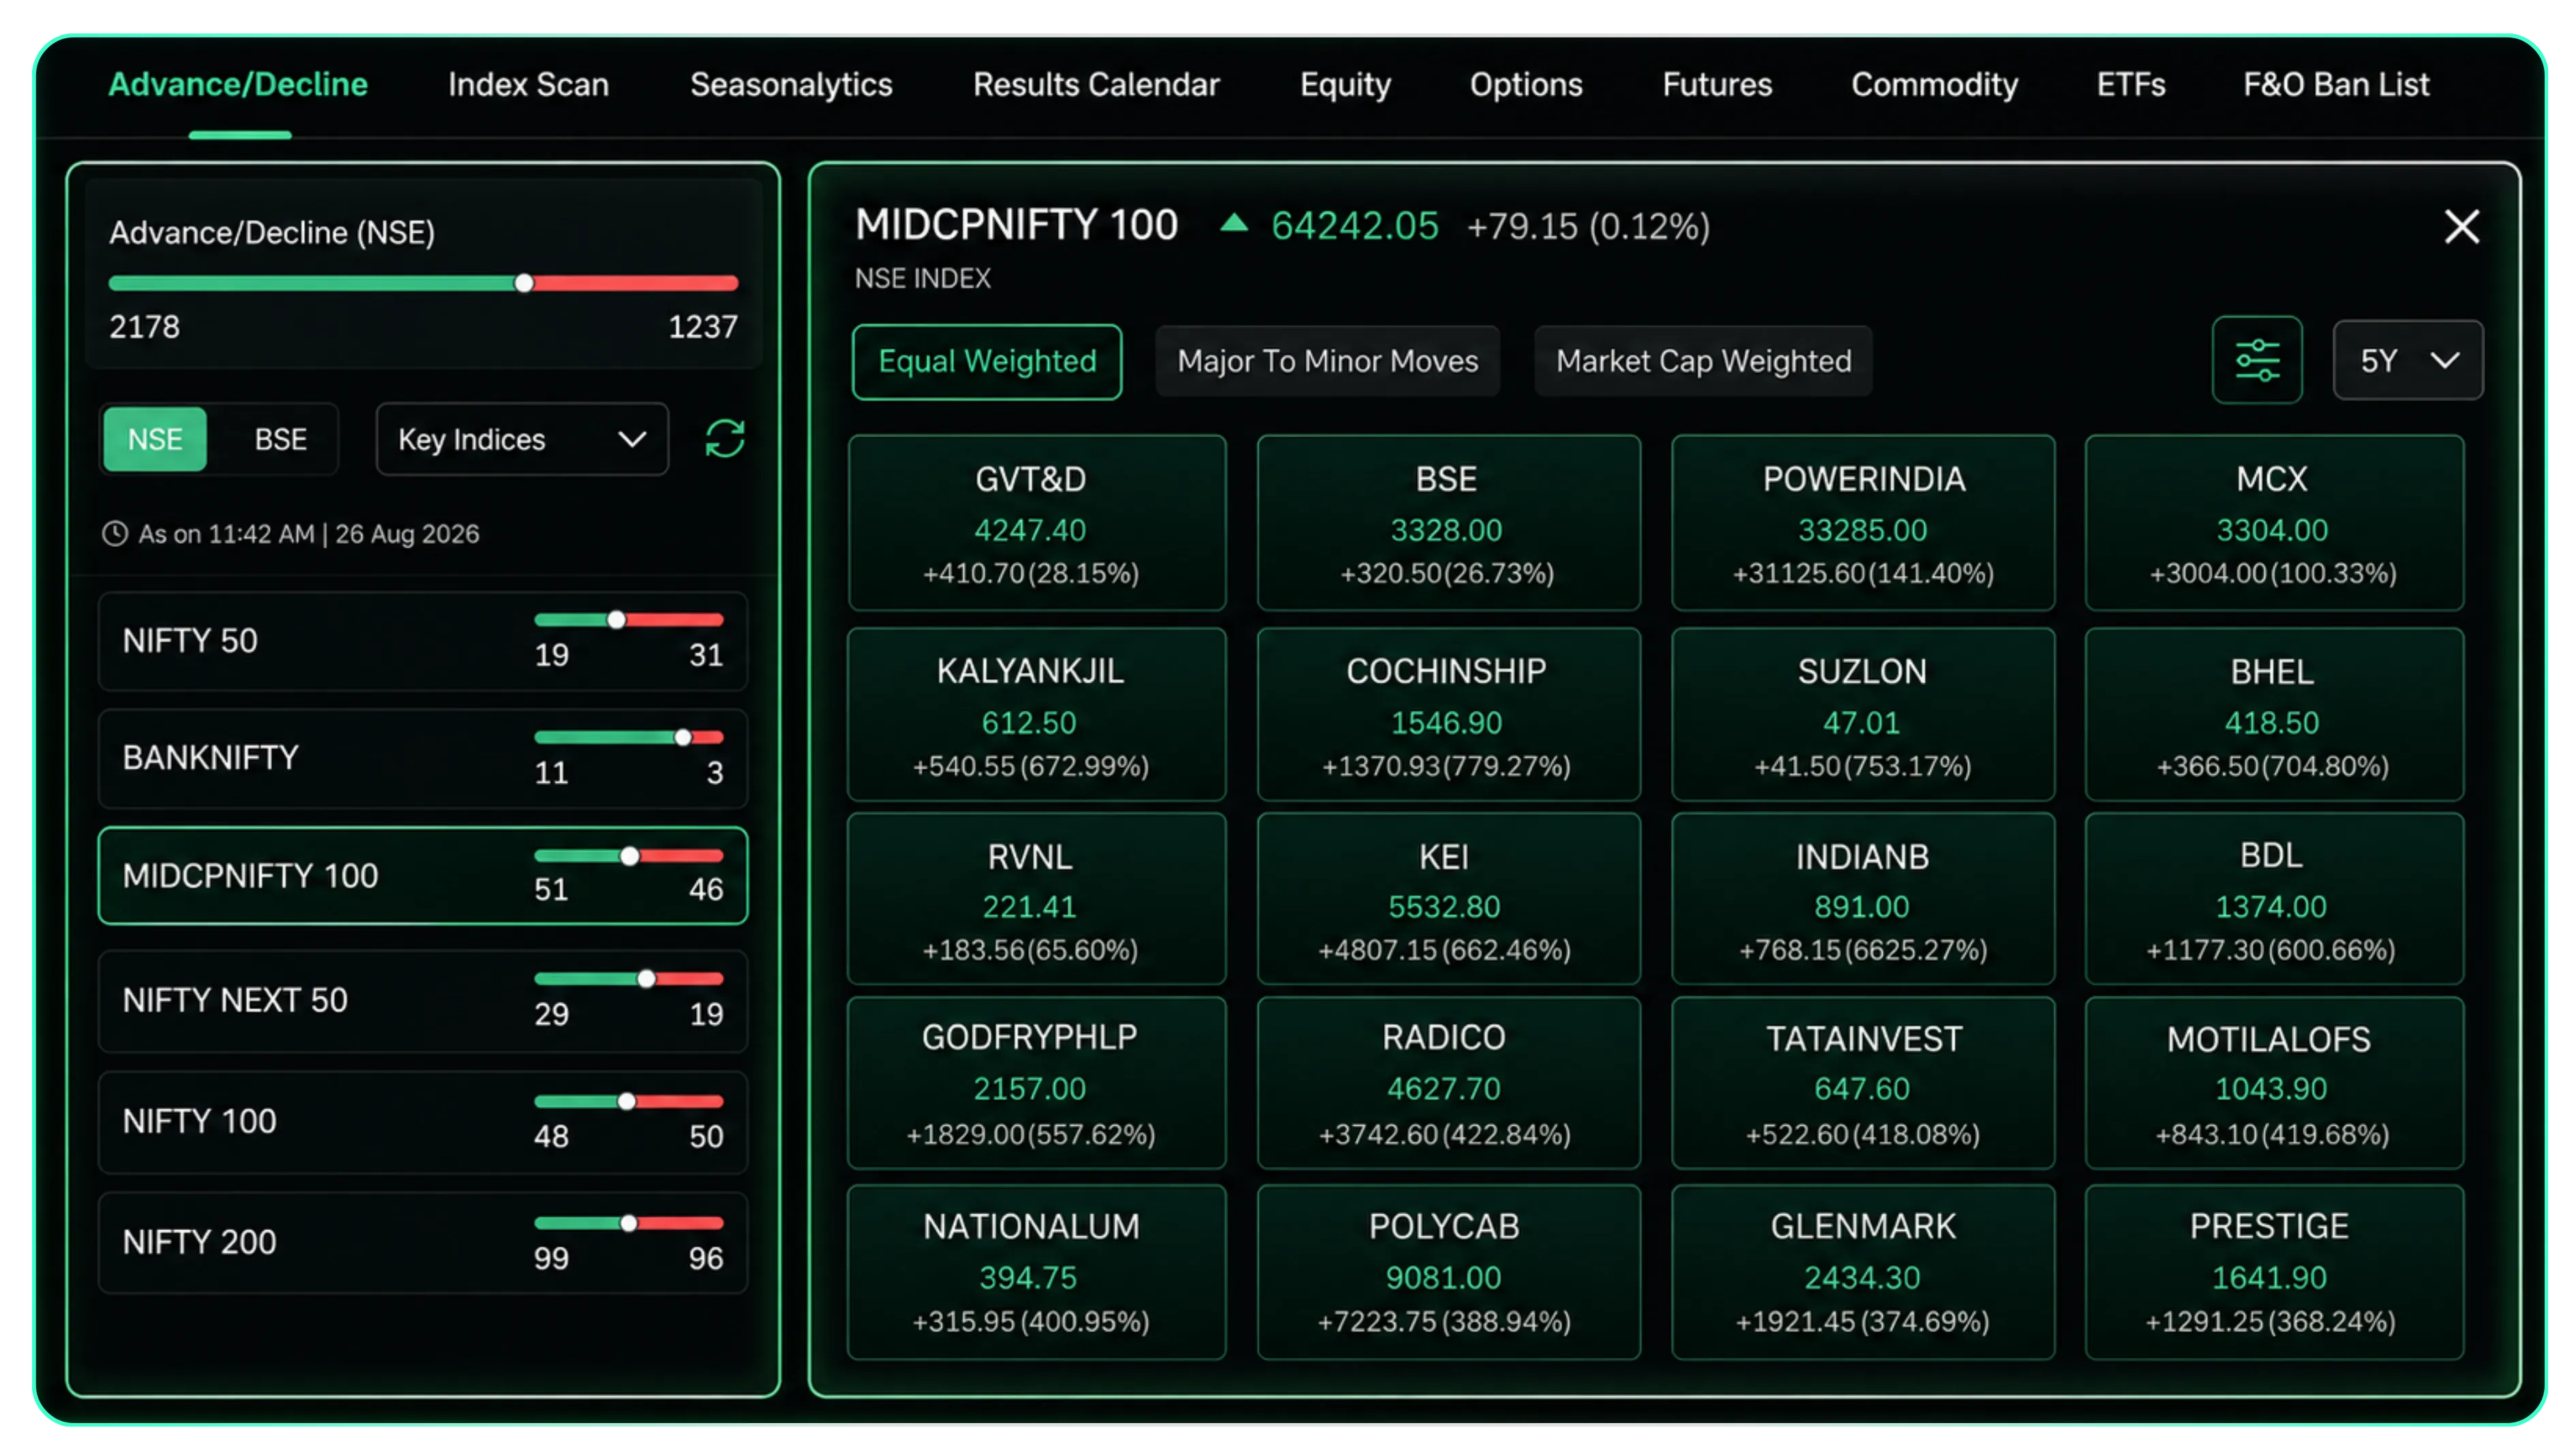
Clicking View All on the Advance/Decline widget takes you to the full breadth view. The left panel covers the major indices, including Nifty 50, Bank Nifty, Midcap Nifty 100, Nifty Next 50, and Nifty 100. Each index has a green-to-red bar showing the number of advancing and declining stocks. Select any index, and the right panel displays its complete list of constituents. The stocks are colour-coded based on their movement, with gainers shown in green and losers in red. Each tile also shows the stock's LTP and percentage change, so you can quickly see where participation is coming from and which stocks are weighing on the index.
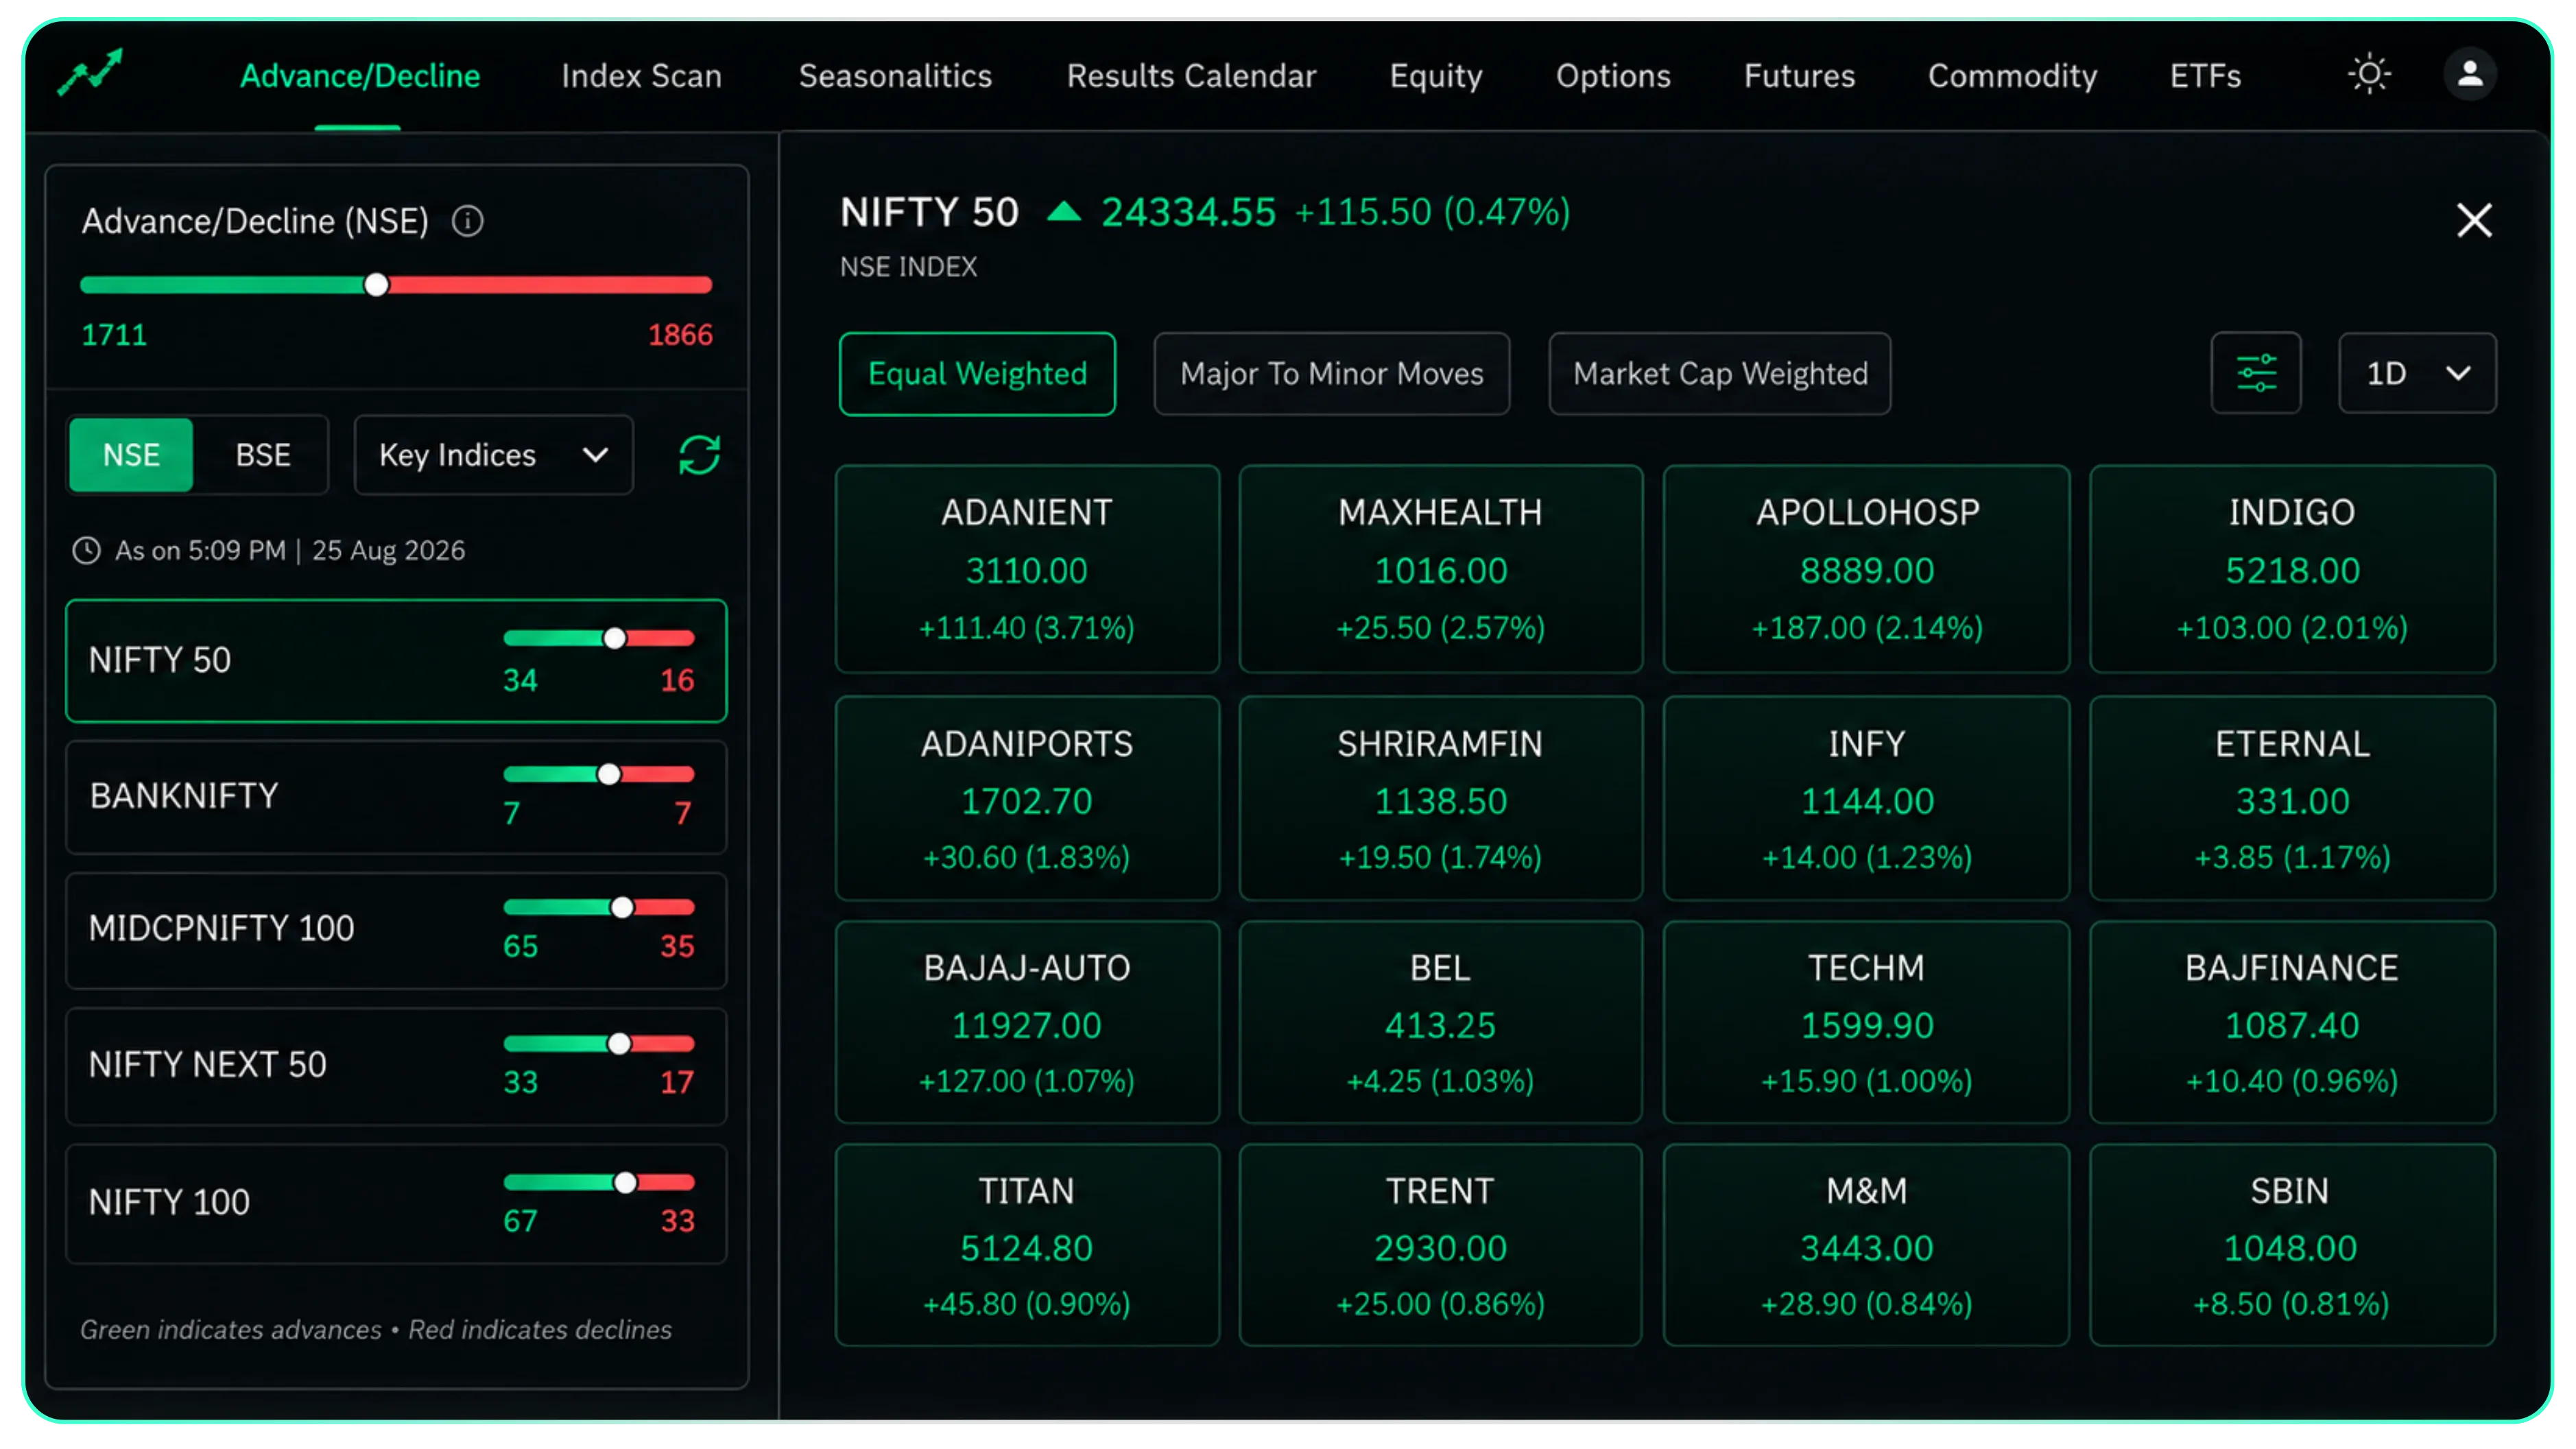
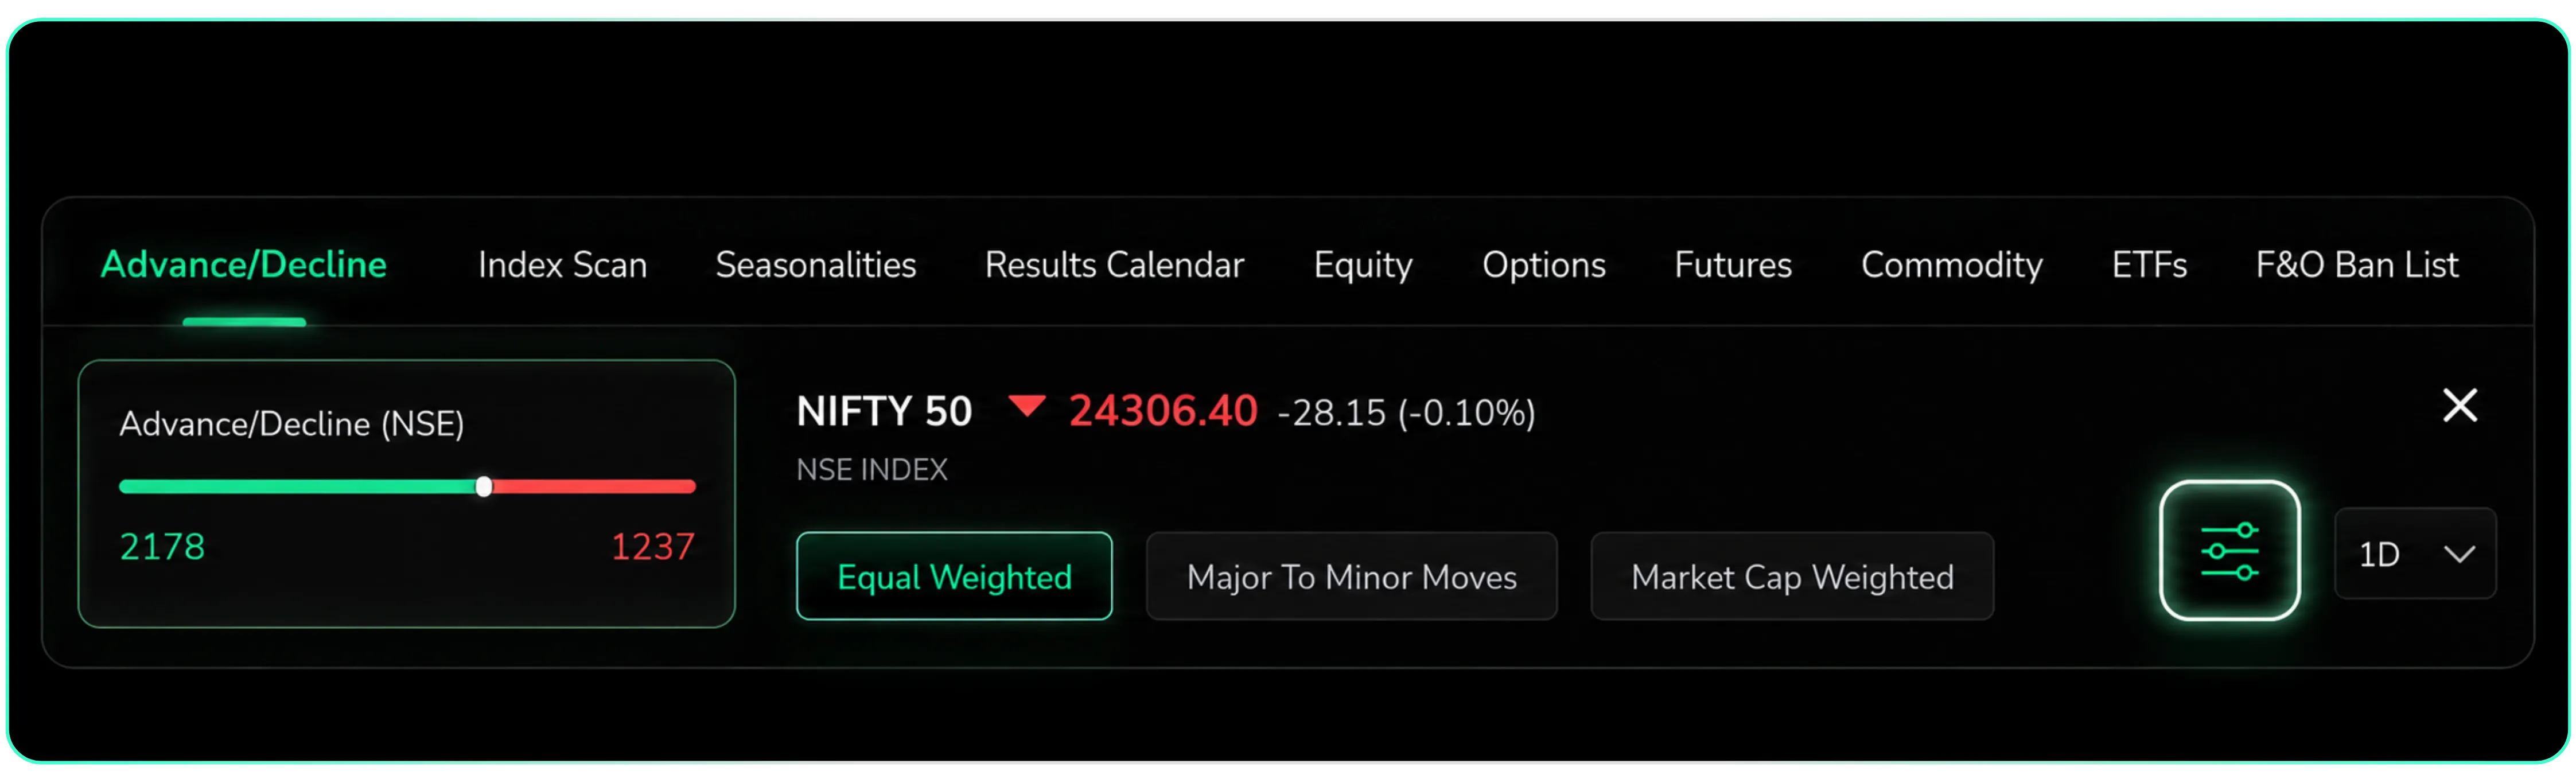
What makes this screen useful is the three sorting modes above the grid: Equal Weighted, Major to Minor Moves, and Market Cap Weighted.
Equal Weighted treats every stock the same regardless of size.
Major to Minor Moves sorts the list by how much each stock has actually moved, so the biggest gainers or losers are shown first instead of being buried alphabetically.
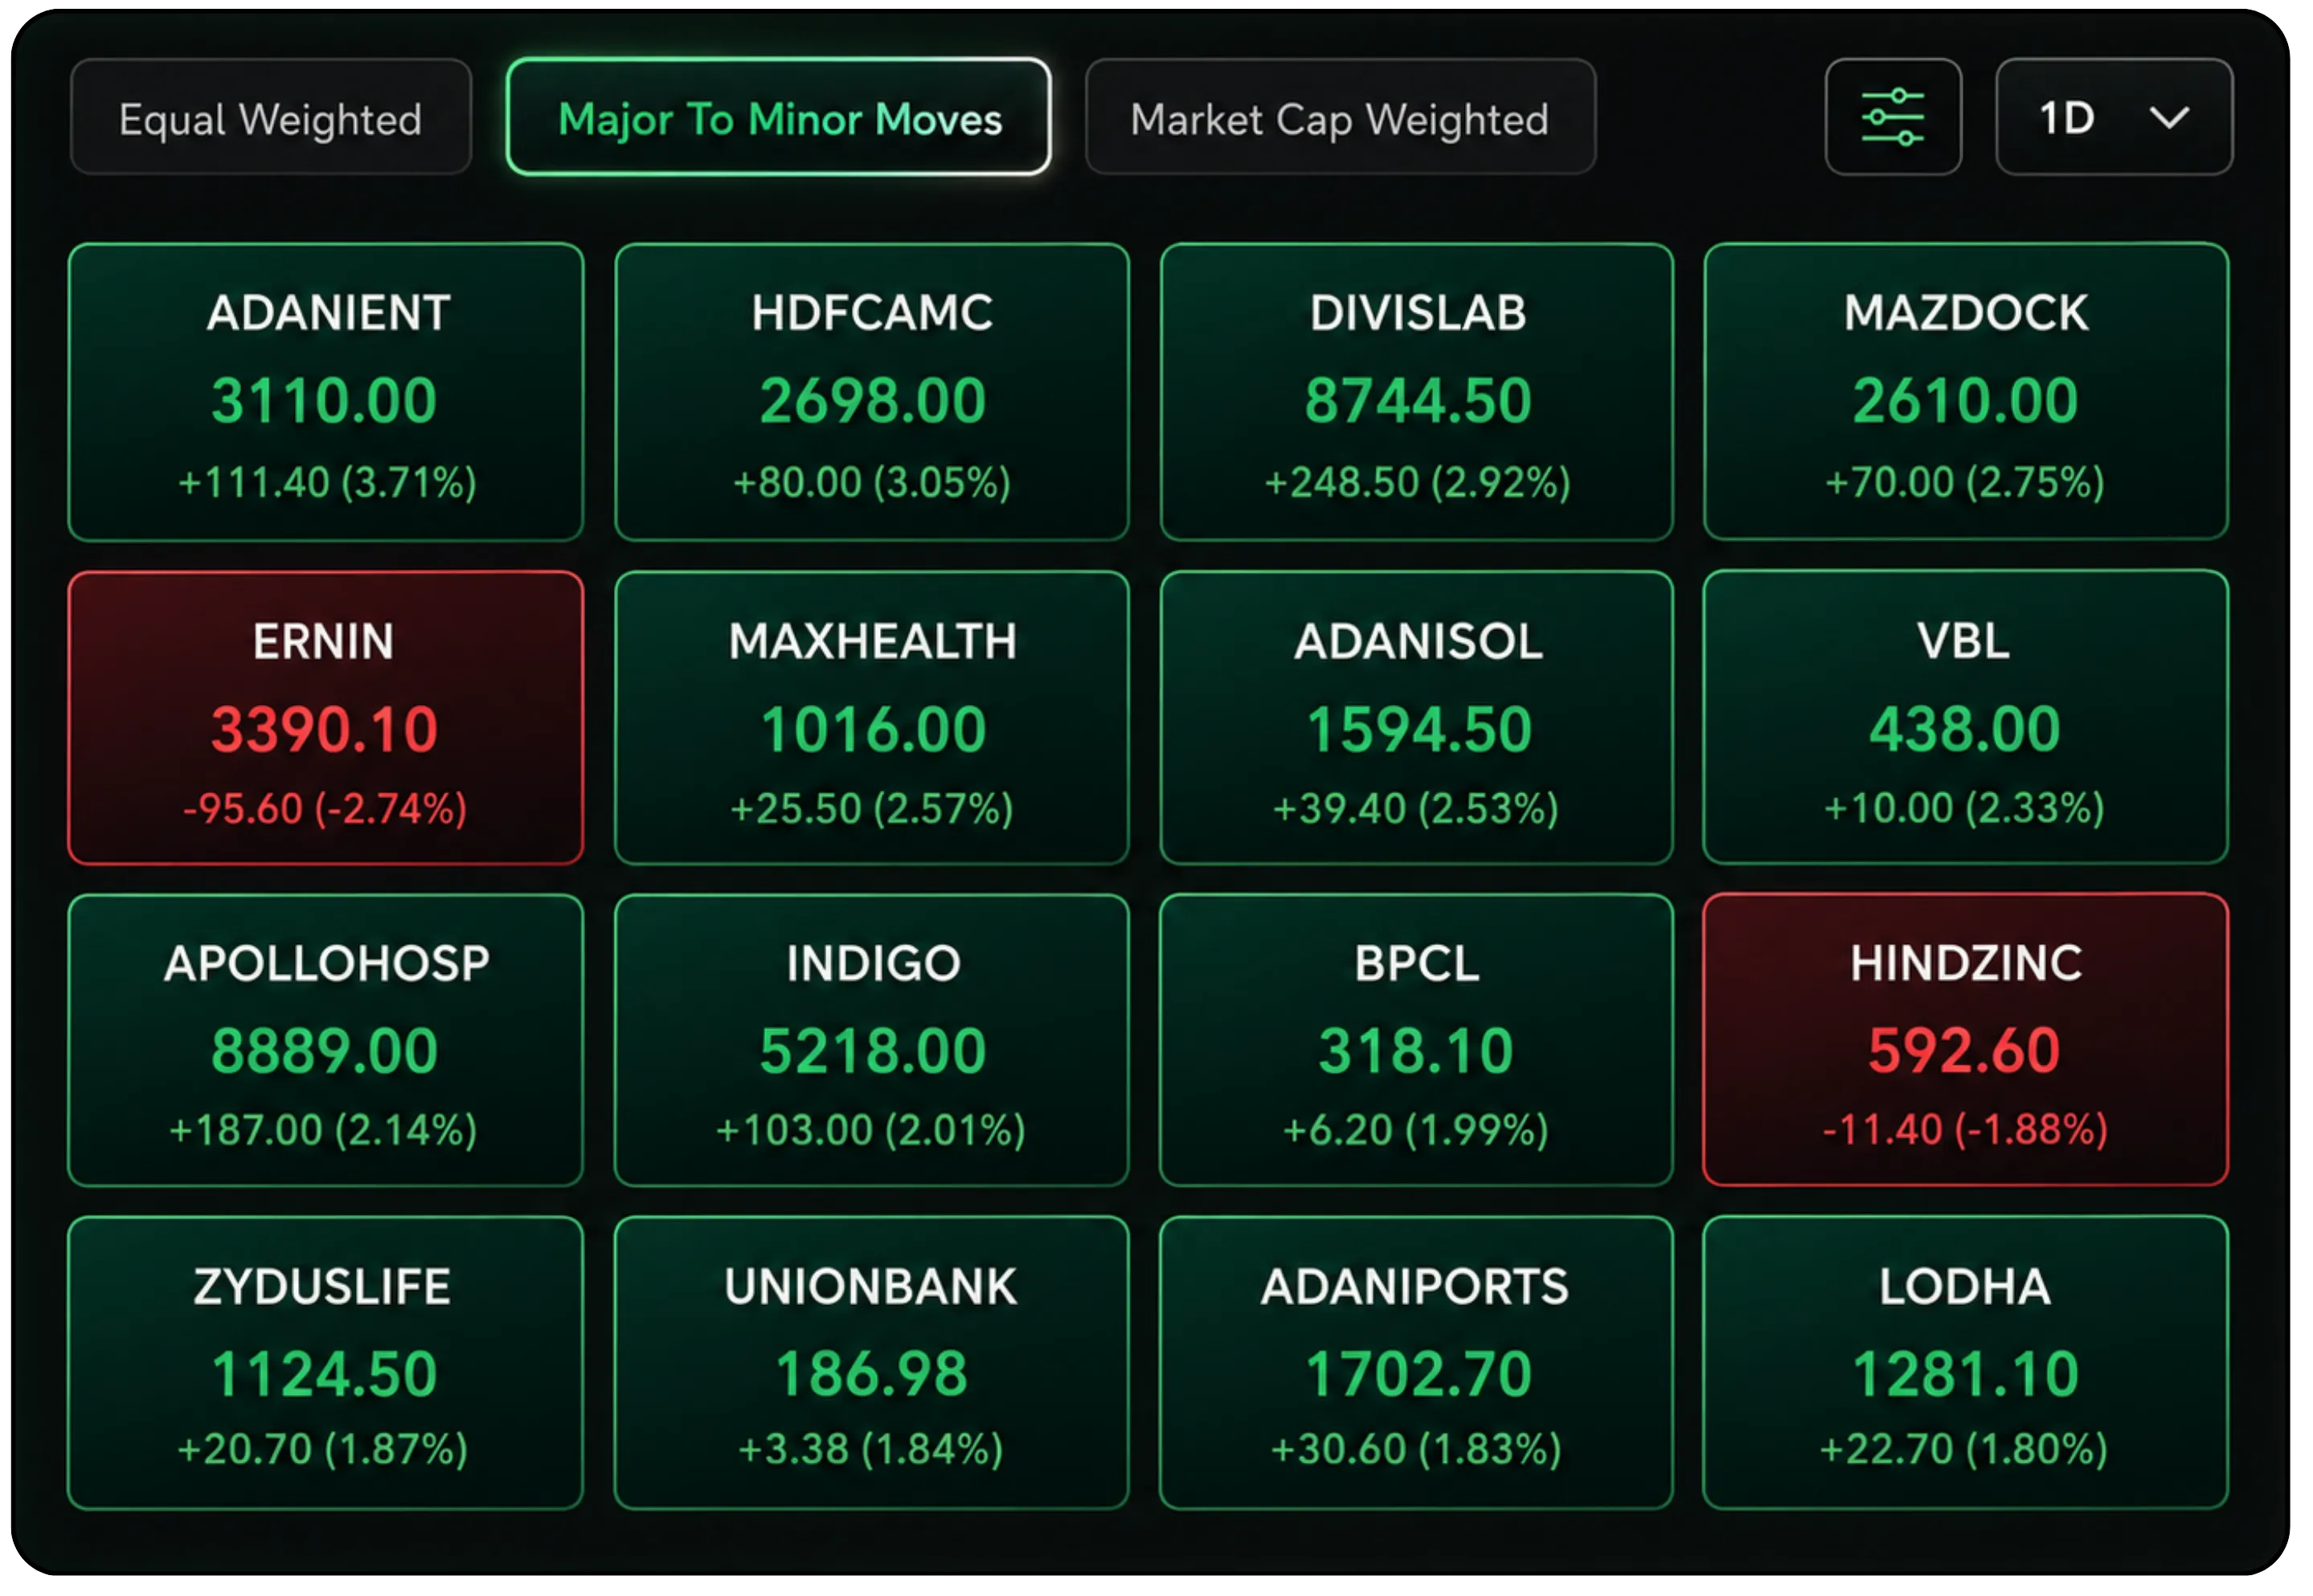
- Market Cap Weighted leans the view toward what's actually driving the index, since a 2% move in a heavyweight matters more than a 4% move in a small constituent.
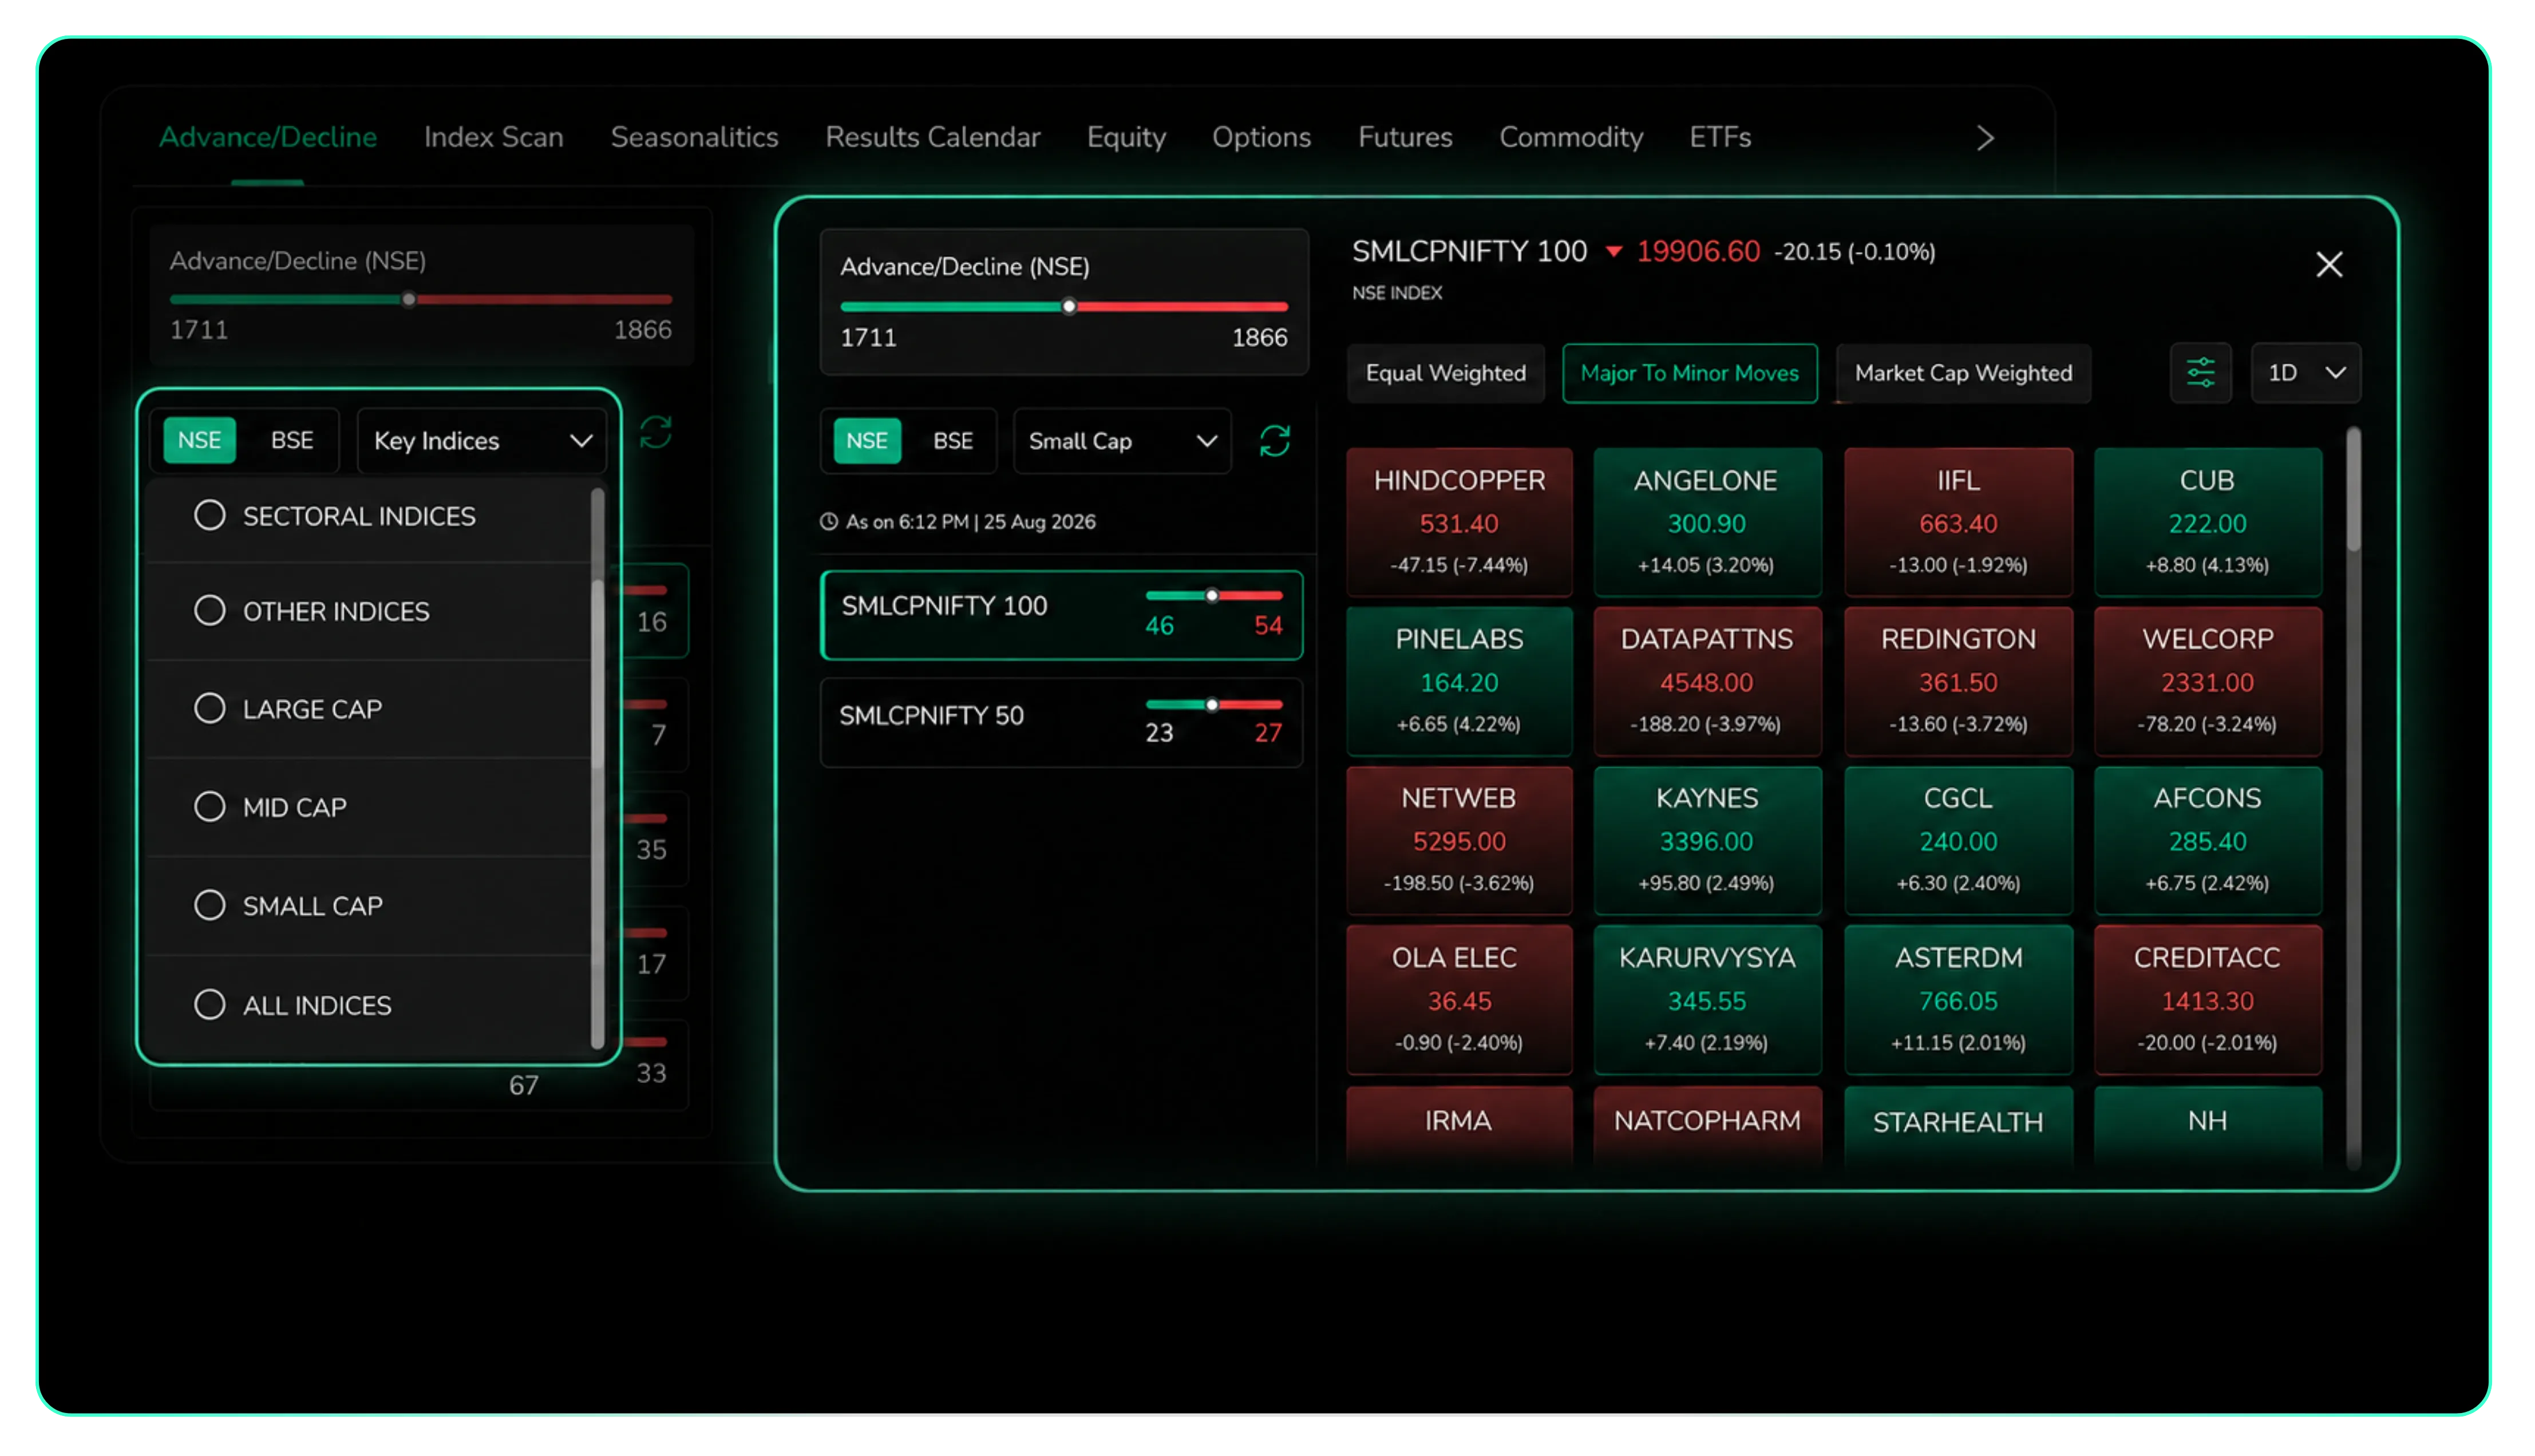
Use case: Want to know if today's decline is broad-based or concentrated in small caps?
Switch Advance/Decline to Small Cap and compare the ratio against Large Cap. A weak small-cap breadth alongside stable large caps often points to risk-off rotation rather than a market-wide selloff.
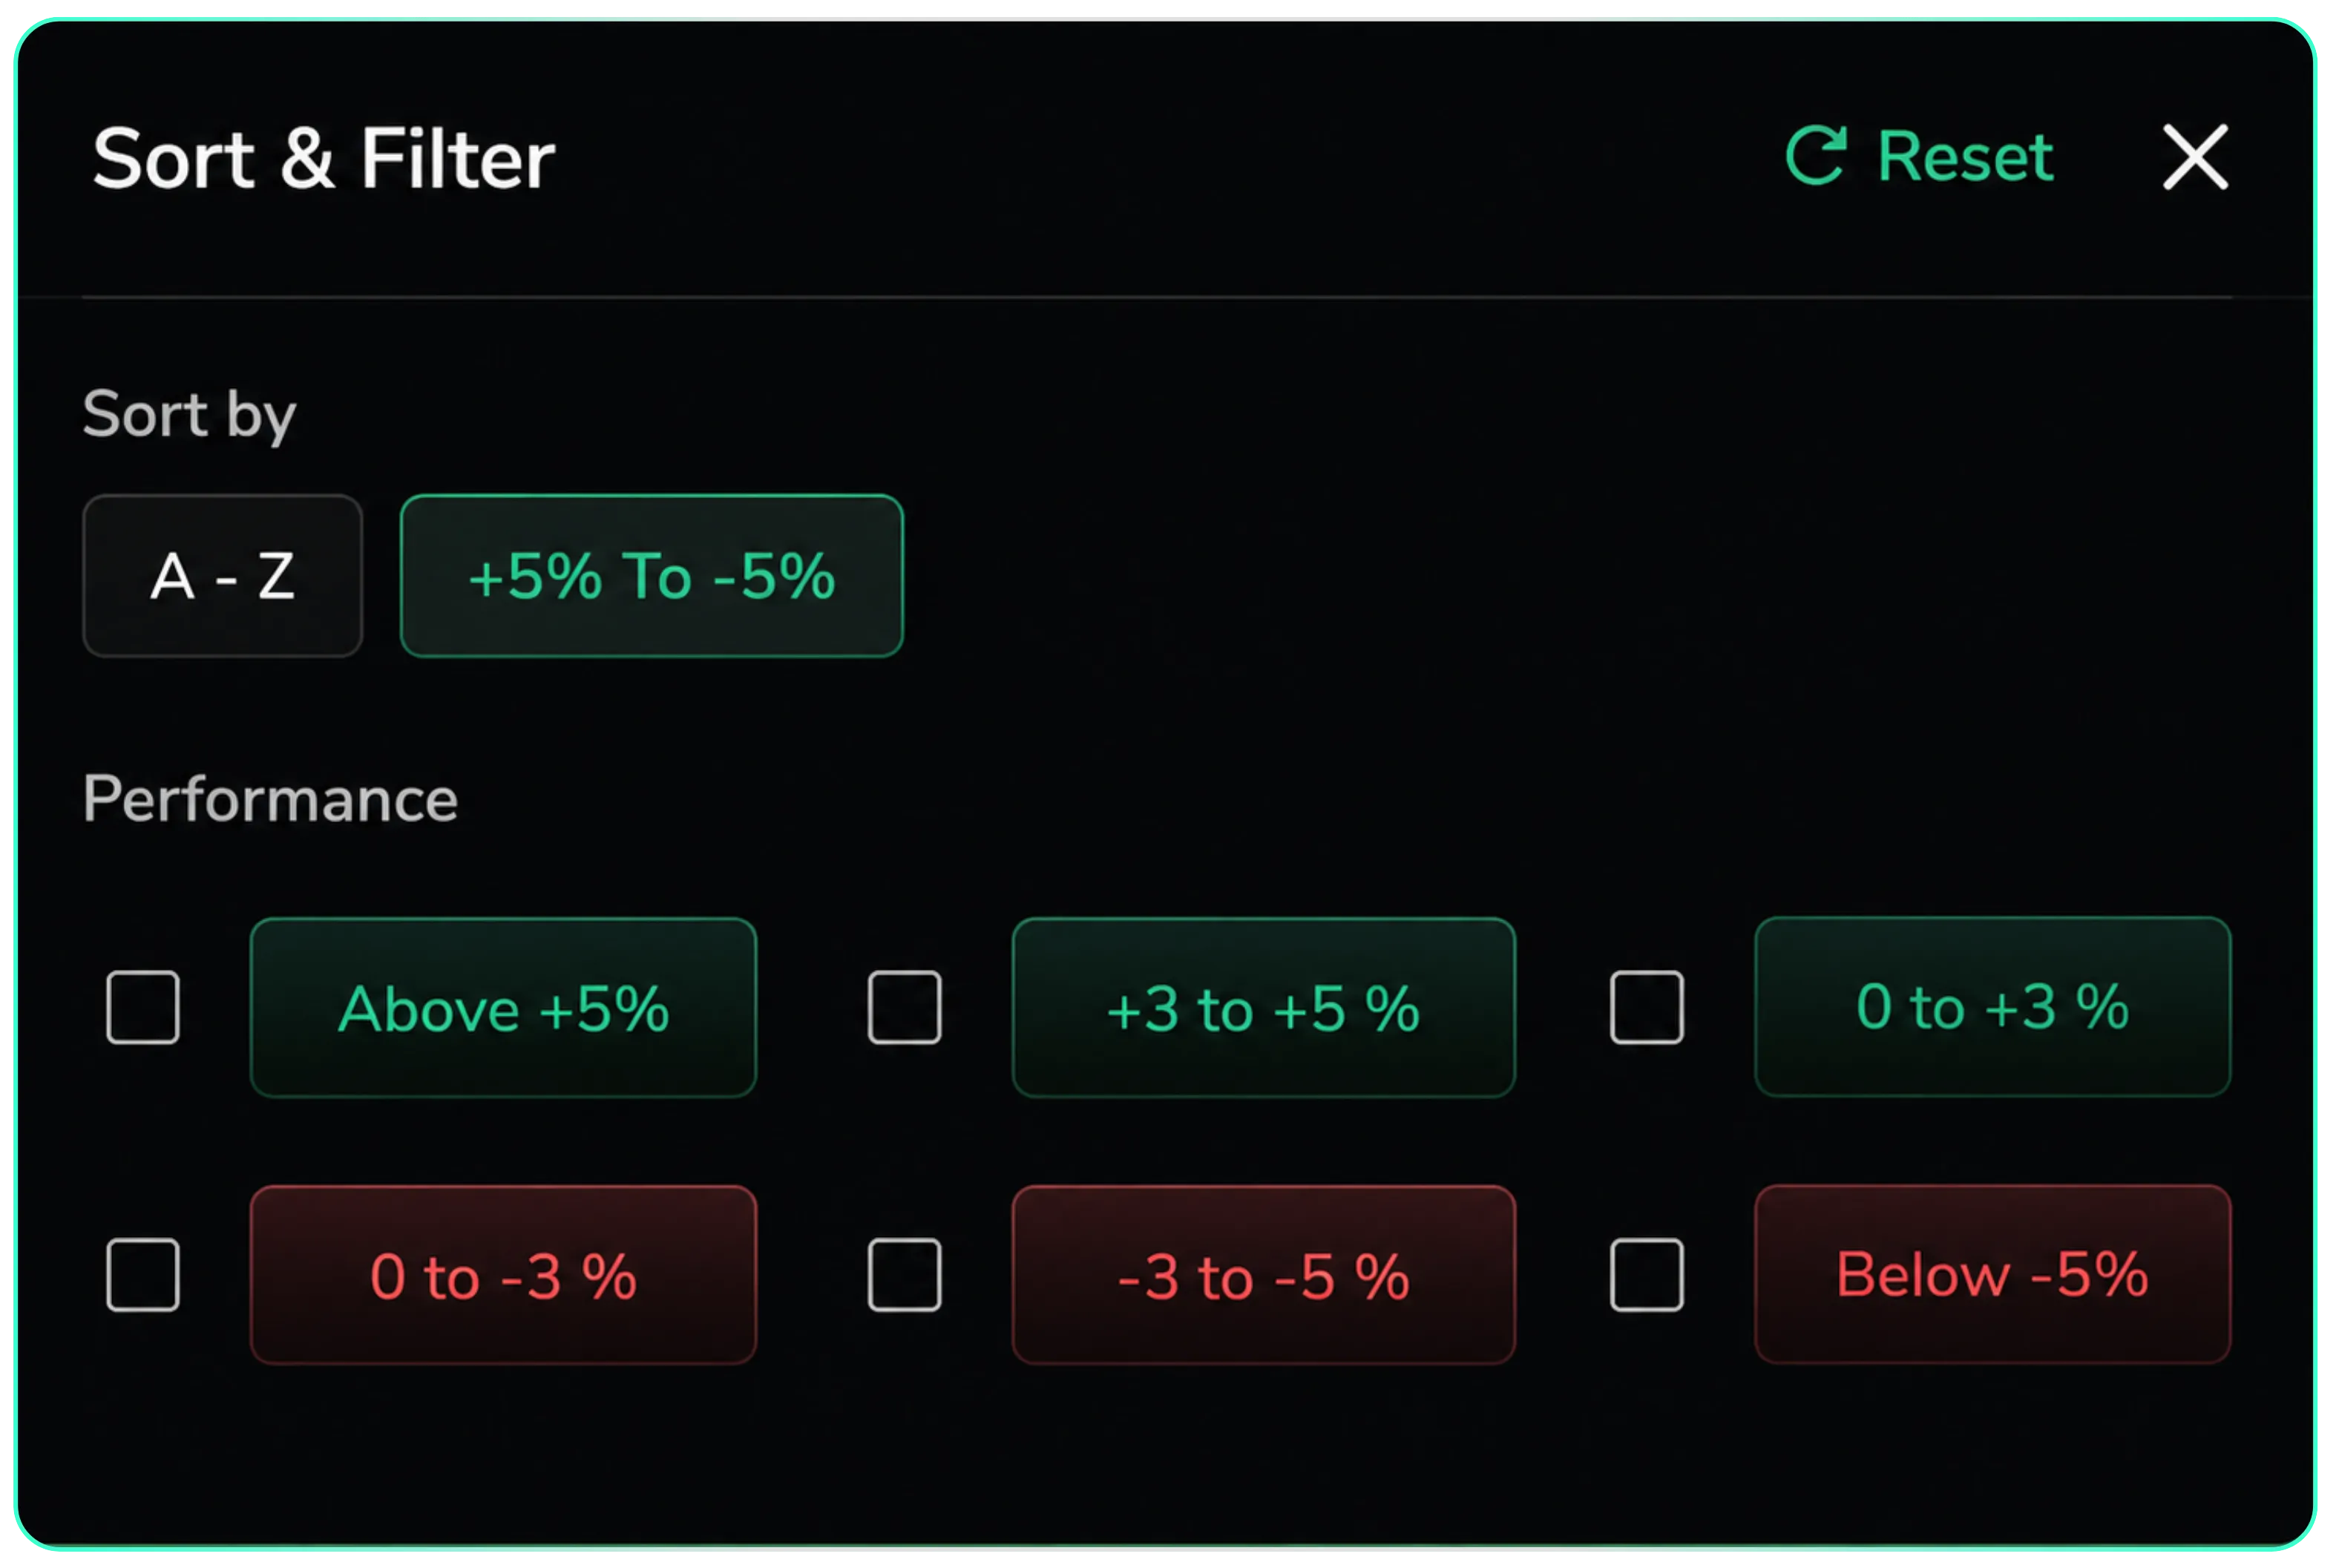
Sort & Filter panel
Advance /Decline Tab has a Sort & Filter panel. You can sort A-Z or by percentage move and filter by performance bands: above 5%, 3 to 5%, 0 to 3%, and the same on the downside. Advance/Decline breadth can be switched between NSE and BSE and narrowed by key indices, sectoral indices, large cap, mid cap, or small cap.
Different Time Horizons
Advance/Decline isn't limited to today. Switch the timeframe to a week, a month, 6 months, 1 year, or even 5 years, and the same breadth logic applies over that longer window instead of just the current session.
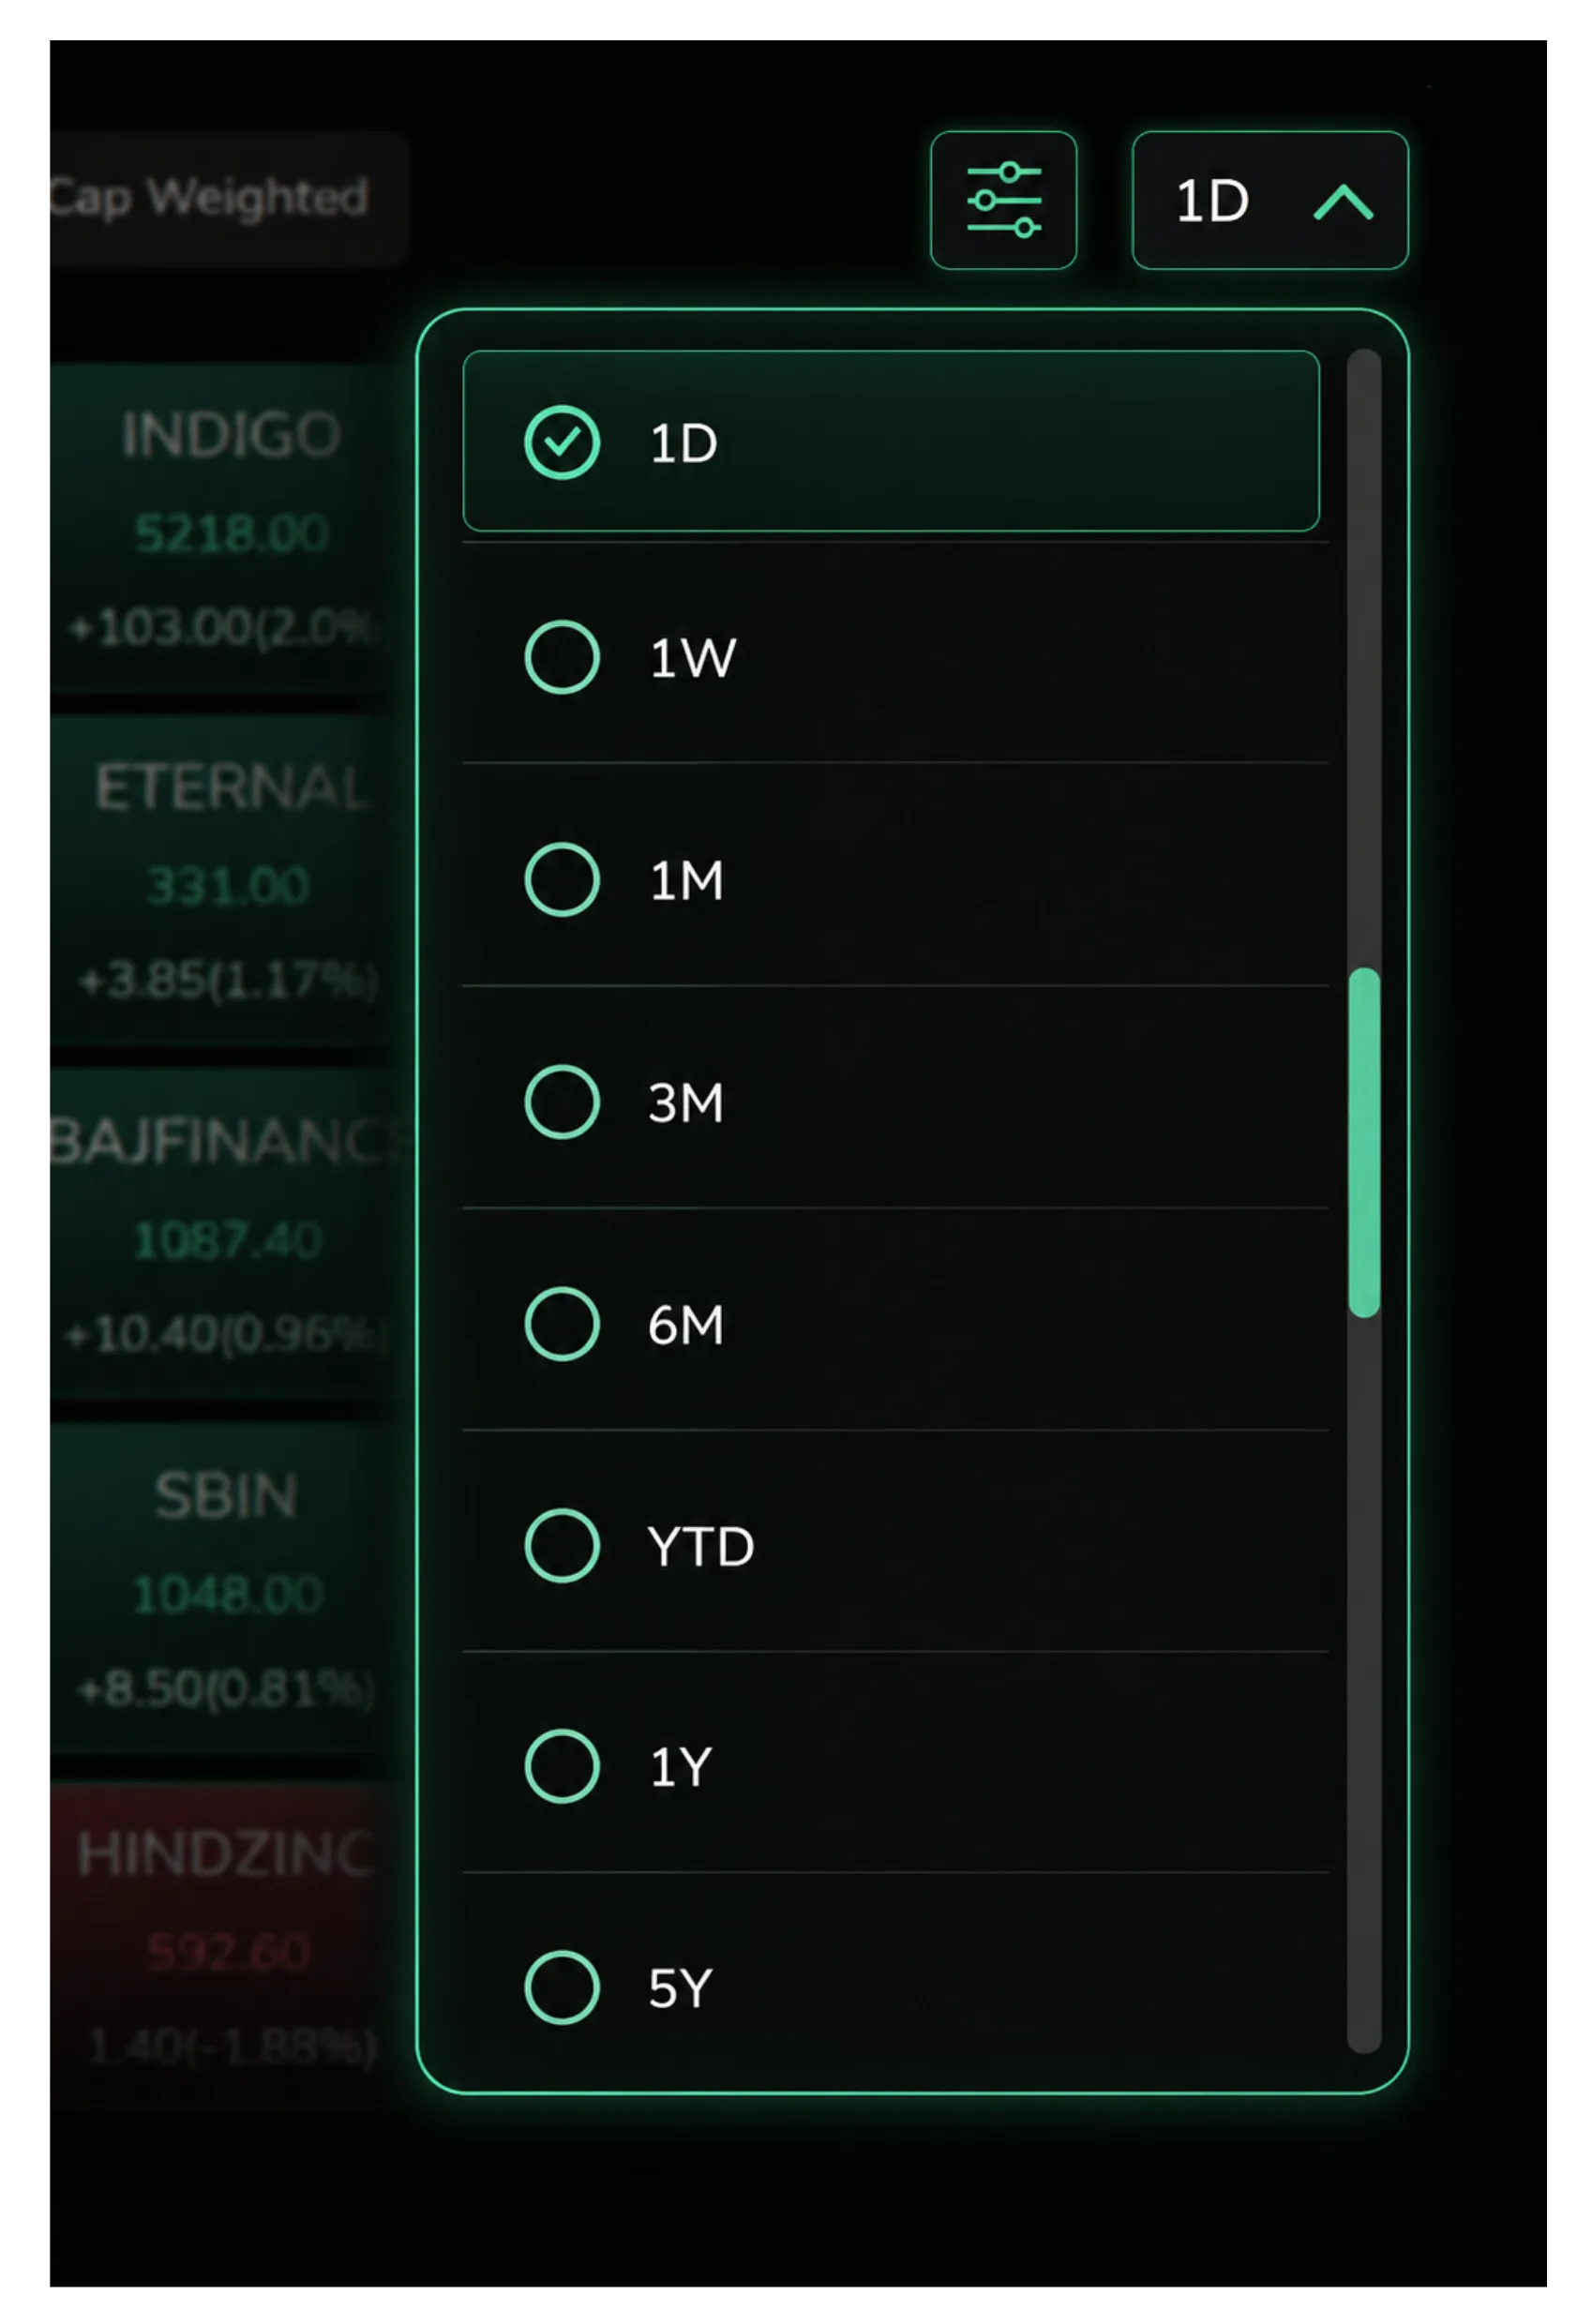
Use case: here the timeframe is set to 5Y and MIDCPNIFTY 100 is selected, the tiles now show 5-year returns instead of today's move, with names like GVT&D, BSE, and Power India up over 1,000% to nearly 2,800% over that stretch. This is useful for spotting long-term multibaggers within an index rather than today's noise and for checking whether a stock's recent strength is part of a genuine multi-year trend or just a short-term spike.
Market Movers
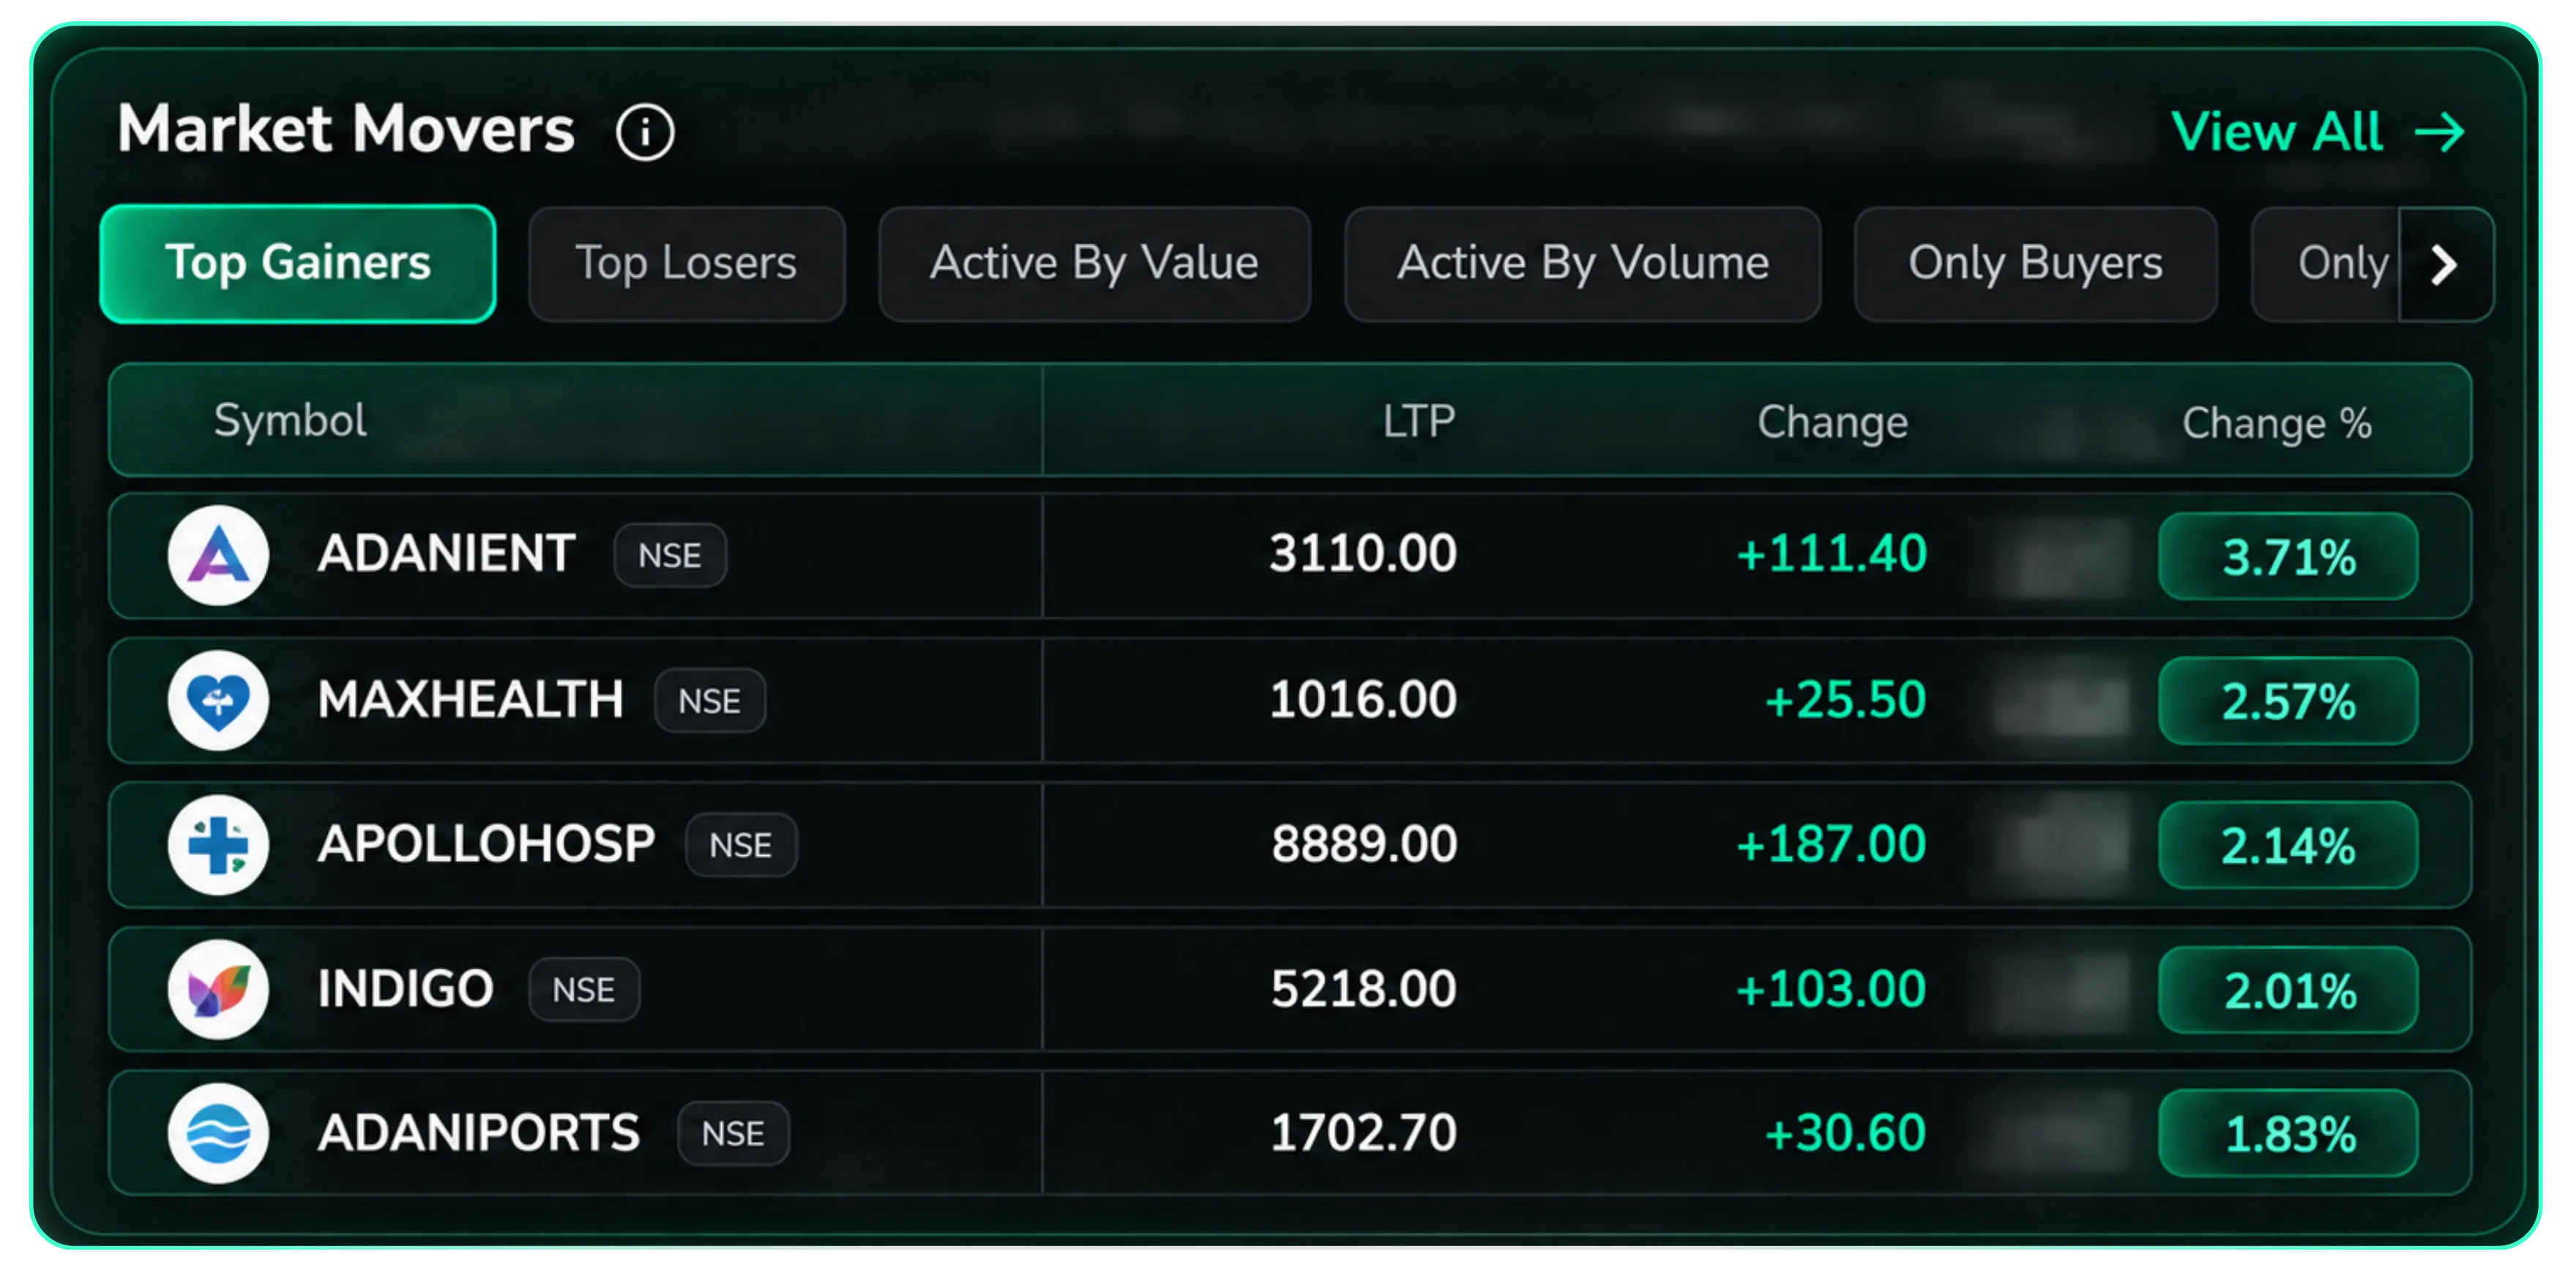
Scroll down the Stocks tab, and you'll find Market Movers, which displays Top Gainers, Top Losers, Active by Volume, Active by Value, and Only Buyers or Only Sellers.
How to use these Tabs
Top Gainers/Top Losers: the fastest way to see which stocks are leading or lagging the index today, useful for spotting momentum names worth a closer look or positions worth trimming.
52 Week High / 52 Week Low: flags stocks trading at their best or worst levels in a year. A stock making a fresh 52-week high on strong volume often signals a breakout; one hitting a 52-week low can flag either a value opportunity or a stock to avoid, depending on why it's falling.
Active By Volume: shows where the trading activity actually is today, regardless of price move. Useful for catching stocks that are suddenly in focus, even before the price has moved much.
Active By Value: similar to volume, but weighted by rupee turnover (volumes x traded Price). So it shows stocks where real money is changing hands, not just a high share count on a low-priced stock.
Only Buyers / Only Sellers: highlights stocks with one-sided order flow, all buyers with no sellers or vice versa. This often shows up in circuit-bound stocks or names reacting to sudden news, and it's a heads-up that liquidity may be thin if you're trying to enter or exit.
Shockers: flags stocks with an unusual price or volume spike relative to their normal pattern, good for catching something moving out of the ordinary before it's widely noticed.
Rise & Fall: filters by Volume Up Price Up or Volume Up Price Down, helping separate a genuine trend building on conviction from a move that's just noise.
Open High & Low: shows stocks that opened at their high or low for the day, a pattern some traders use to gauge opening momentum or possible gap-fade setups.
High & Low Breakers: tracks stocks breaking through a recent high or low intraday, useful for momentum or breakout-style trading.
Circuit Breakers: lists stocks that have hit their upper or lower circuit limit, a fast way to catch extreme moves, especially in small and mid-cap names before the news around them spreads.
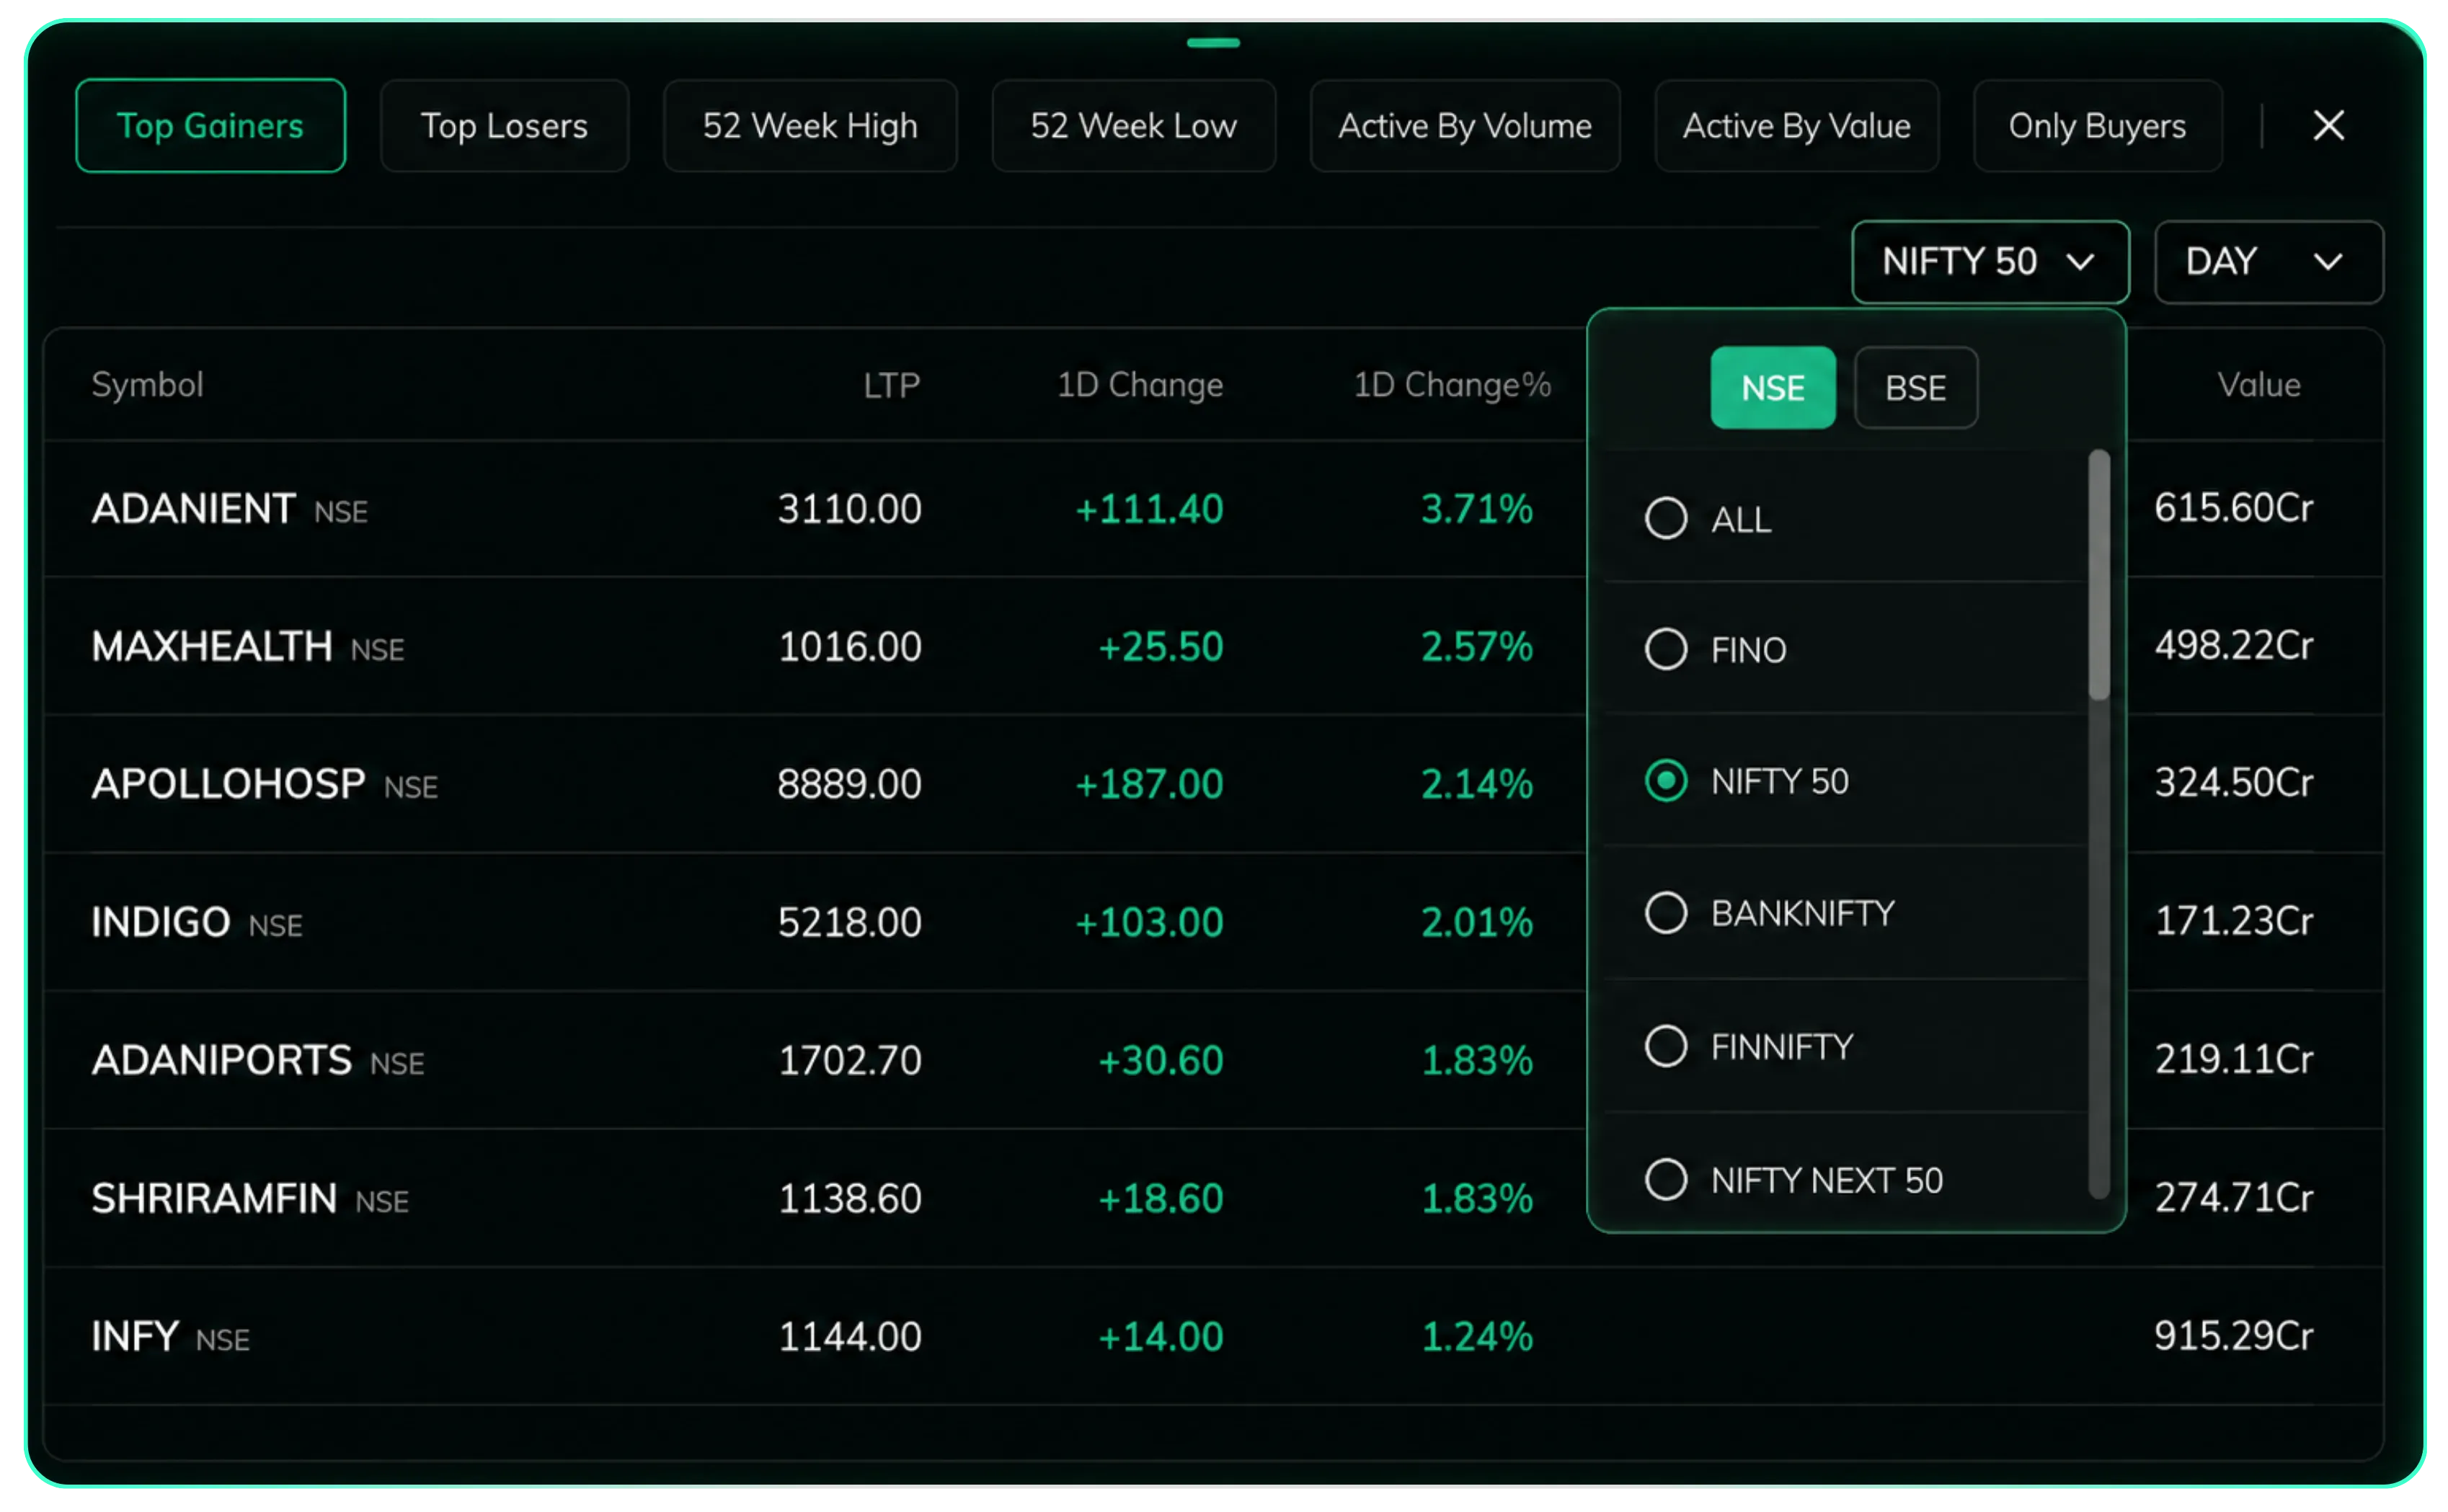
On clicking View All, the user gets the option to select the respective index and filter by Top Gainers, Top Losers, Volume, and more.
Market Movers, Trading Tools, IPO Calendar, and Quick Navigation
Positions and Funds
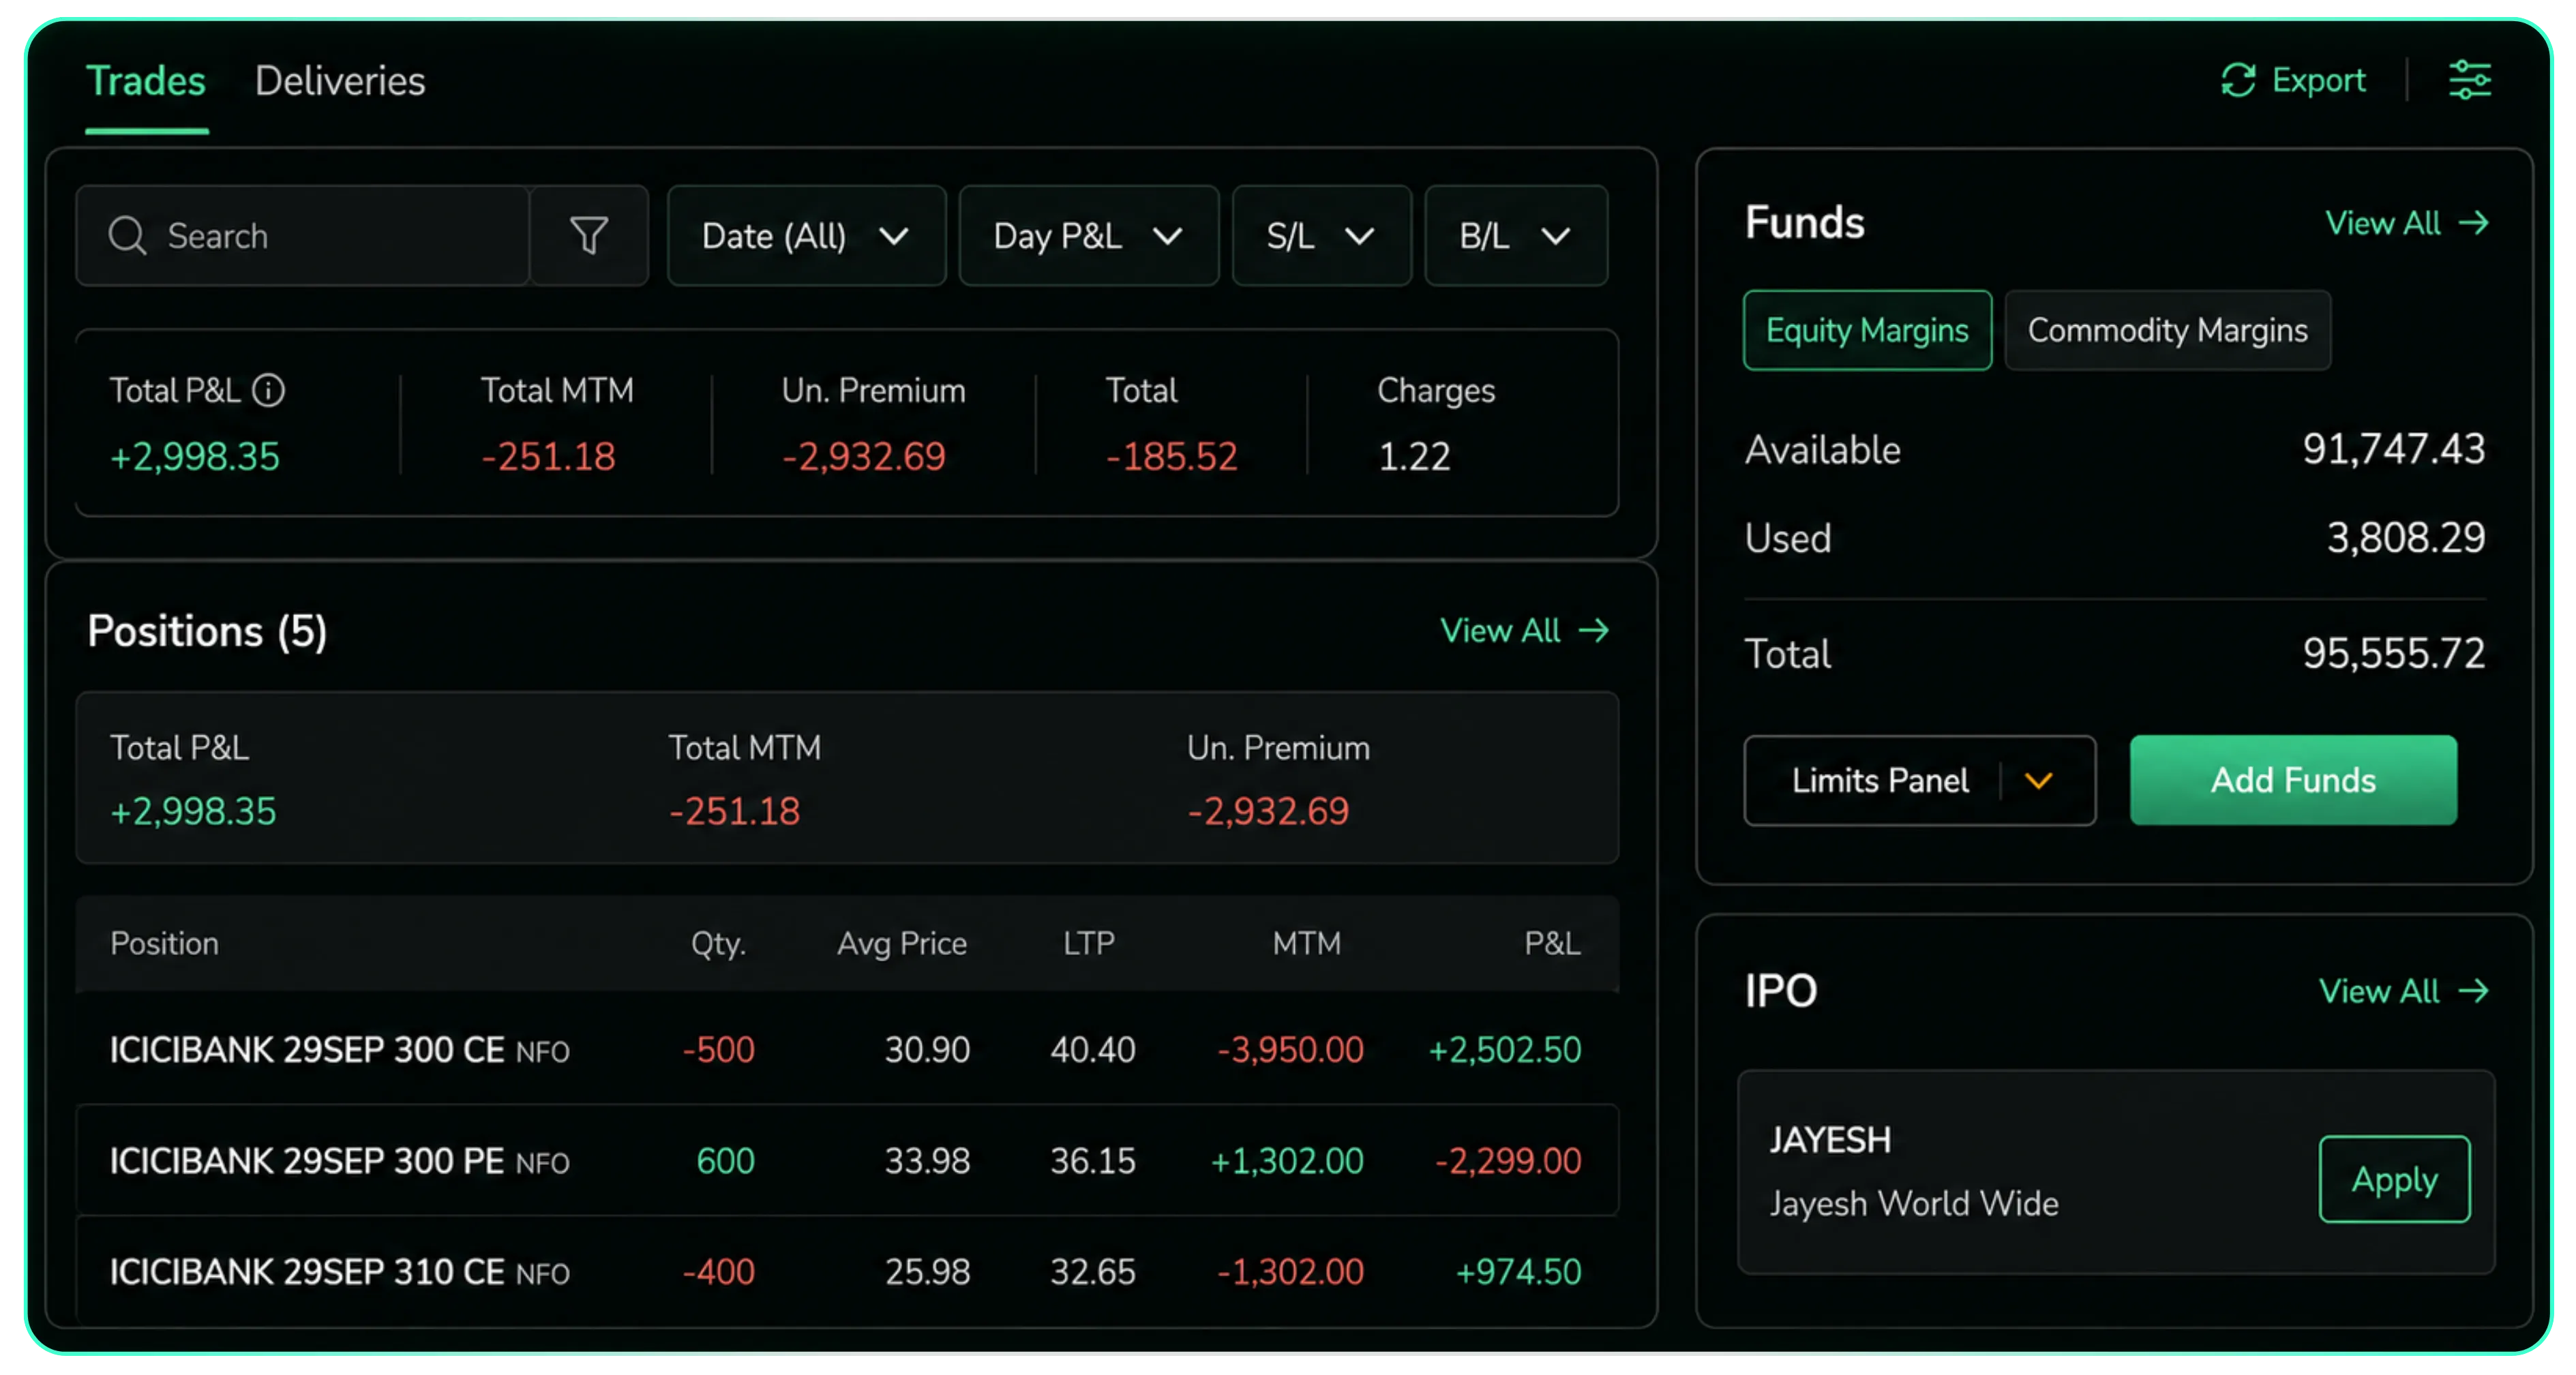
Scroll down the Stocks tab, and you'll find Positions. You can now expand the Positions screen to view all the positions, save your preferred layout, and sort positions based on MTM and P&L, making it easier to track and manage your trades. The Funds page displays both equity and commodity funds, showing the available and utilized funds in one place.
Market Movers, Trading Tools, IPO Calendar, and Quick Navigation
Index Scan: Technical, Performance, Pivot Level
Index Scan displays four tabs, Overview, Technicals, Performance, and Pivot, for every major index. The main idea here is that the user can view major support and resistance levels, understand how close the price is to these levels, and then view the chart. This helps build muscle memory for key levels among traders.
The overview shows LTP, change, day range, and 52-week range.
Technical shows SMA, EMA, CCI, ROC(20), and Hull moving average; the user can customise based on the requirement
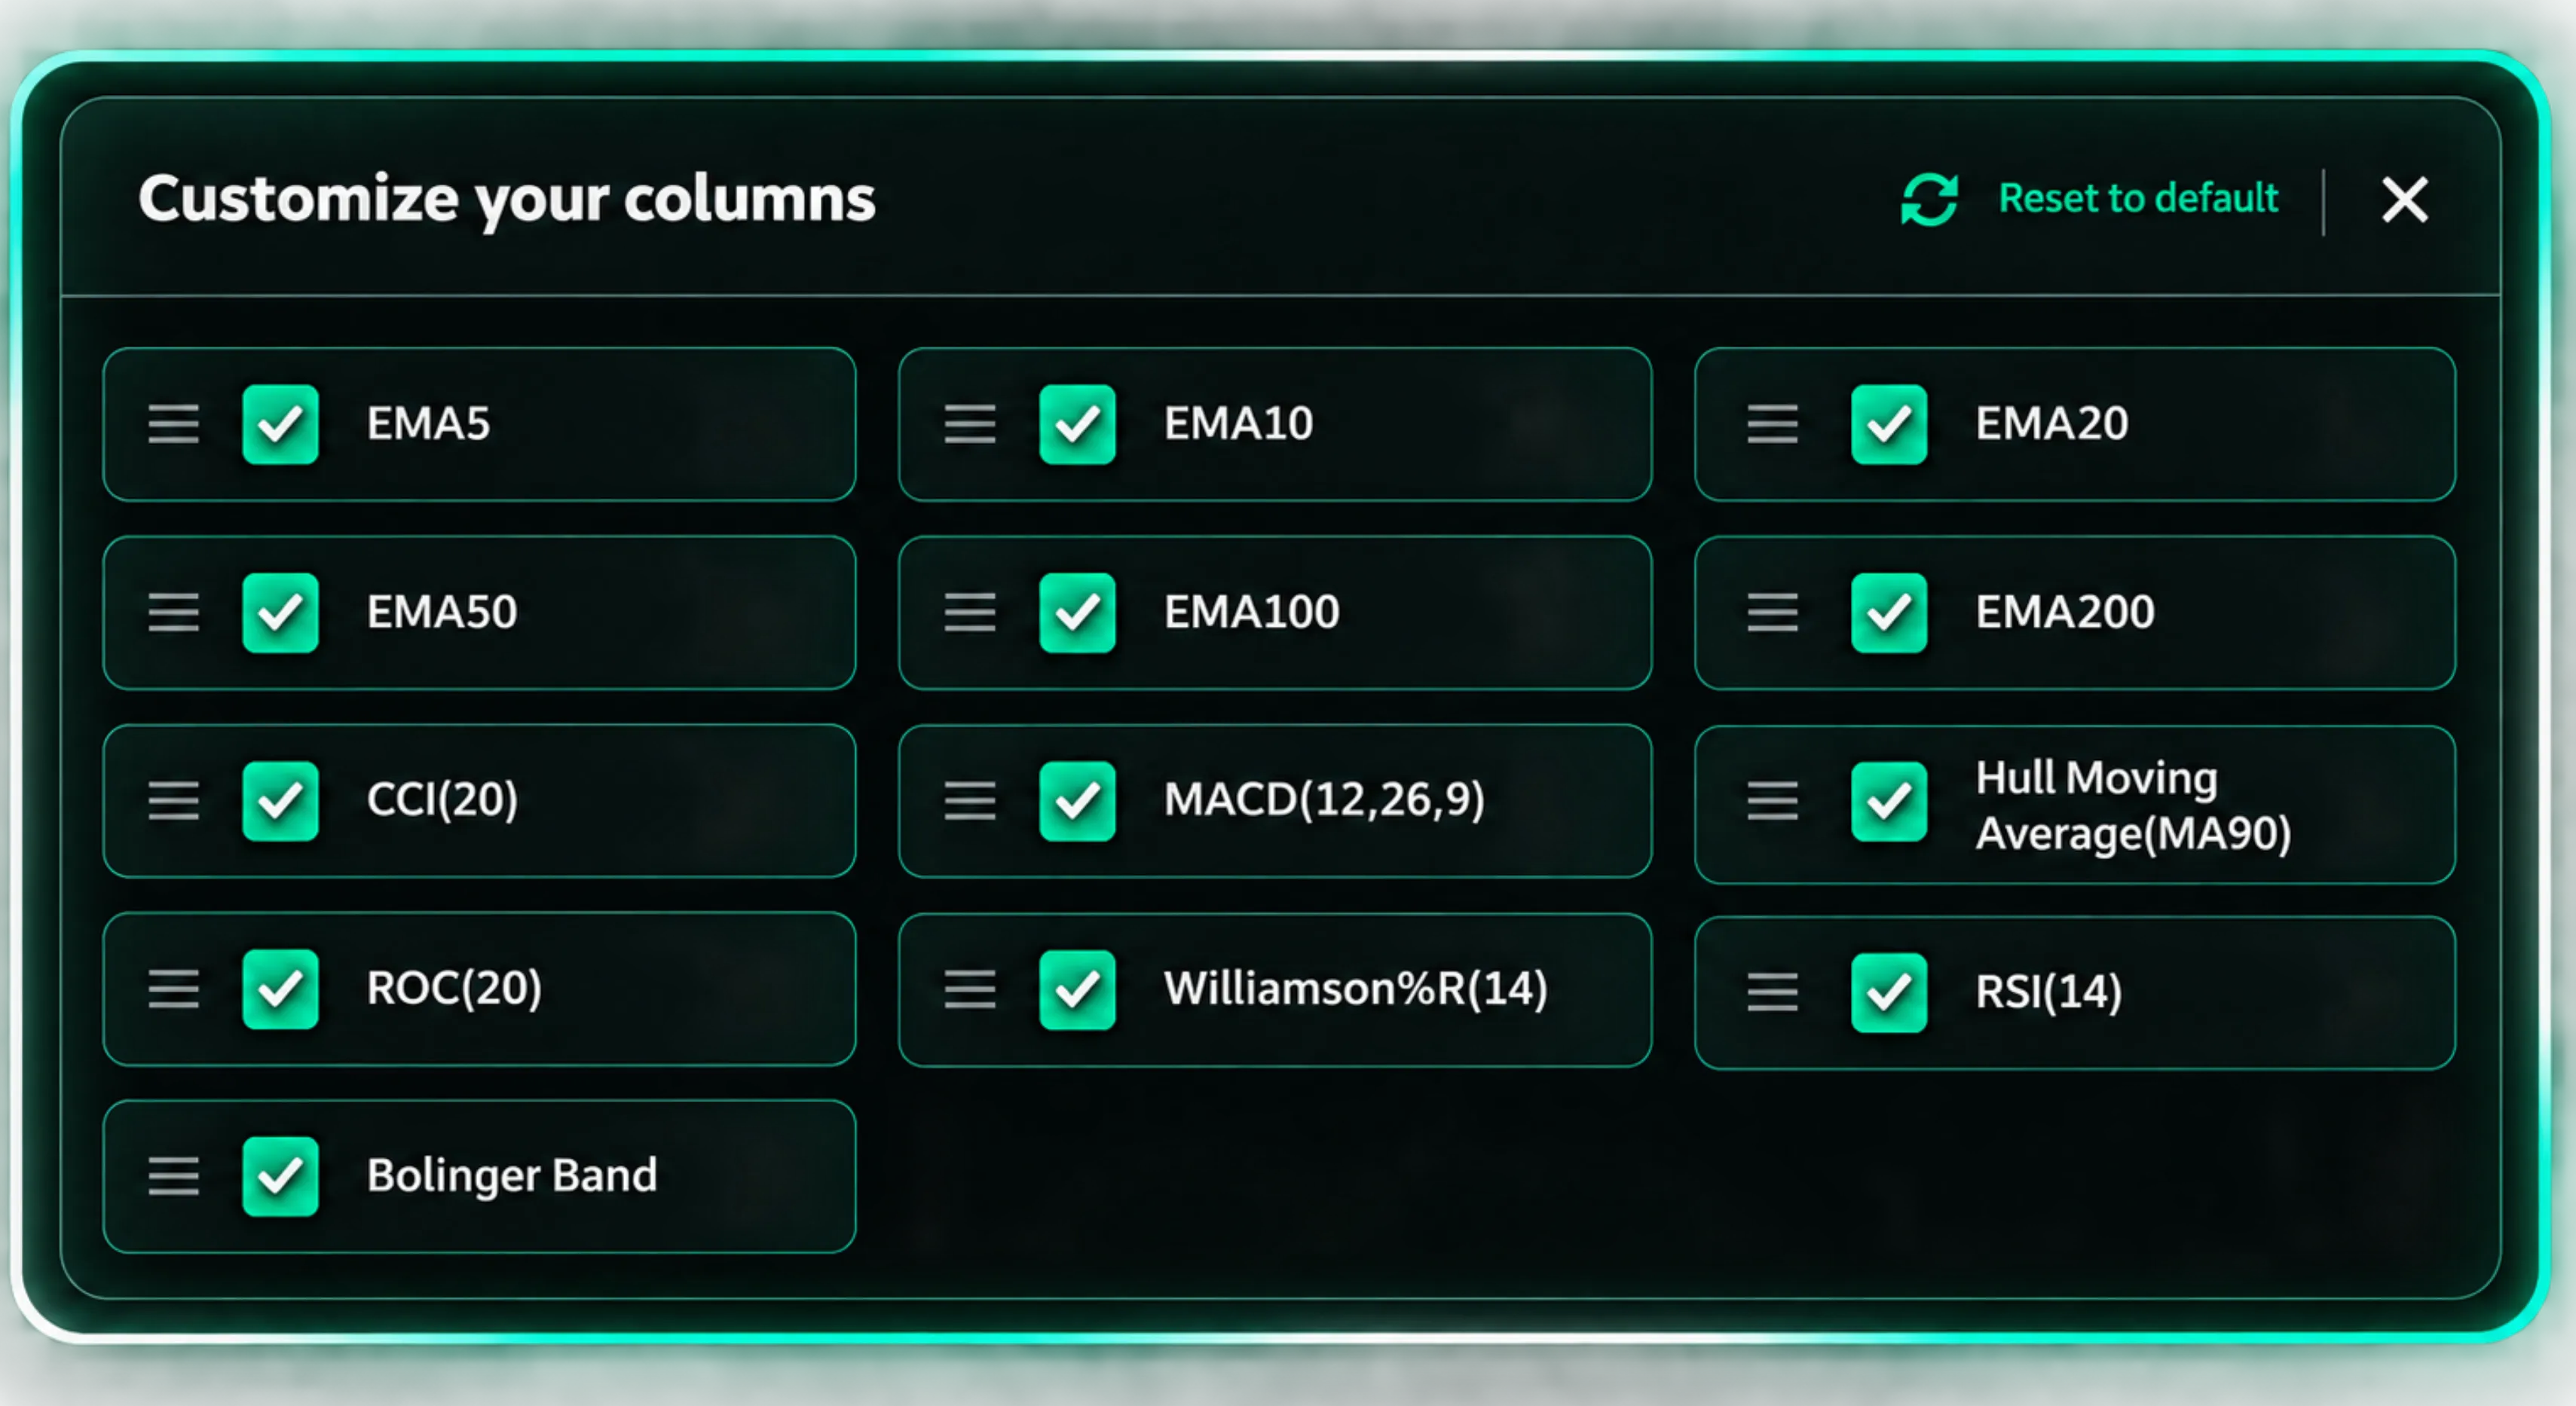
Performance shows returns across 1 week to 5 years in one row.
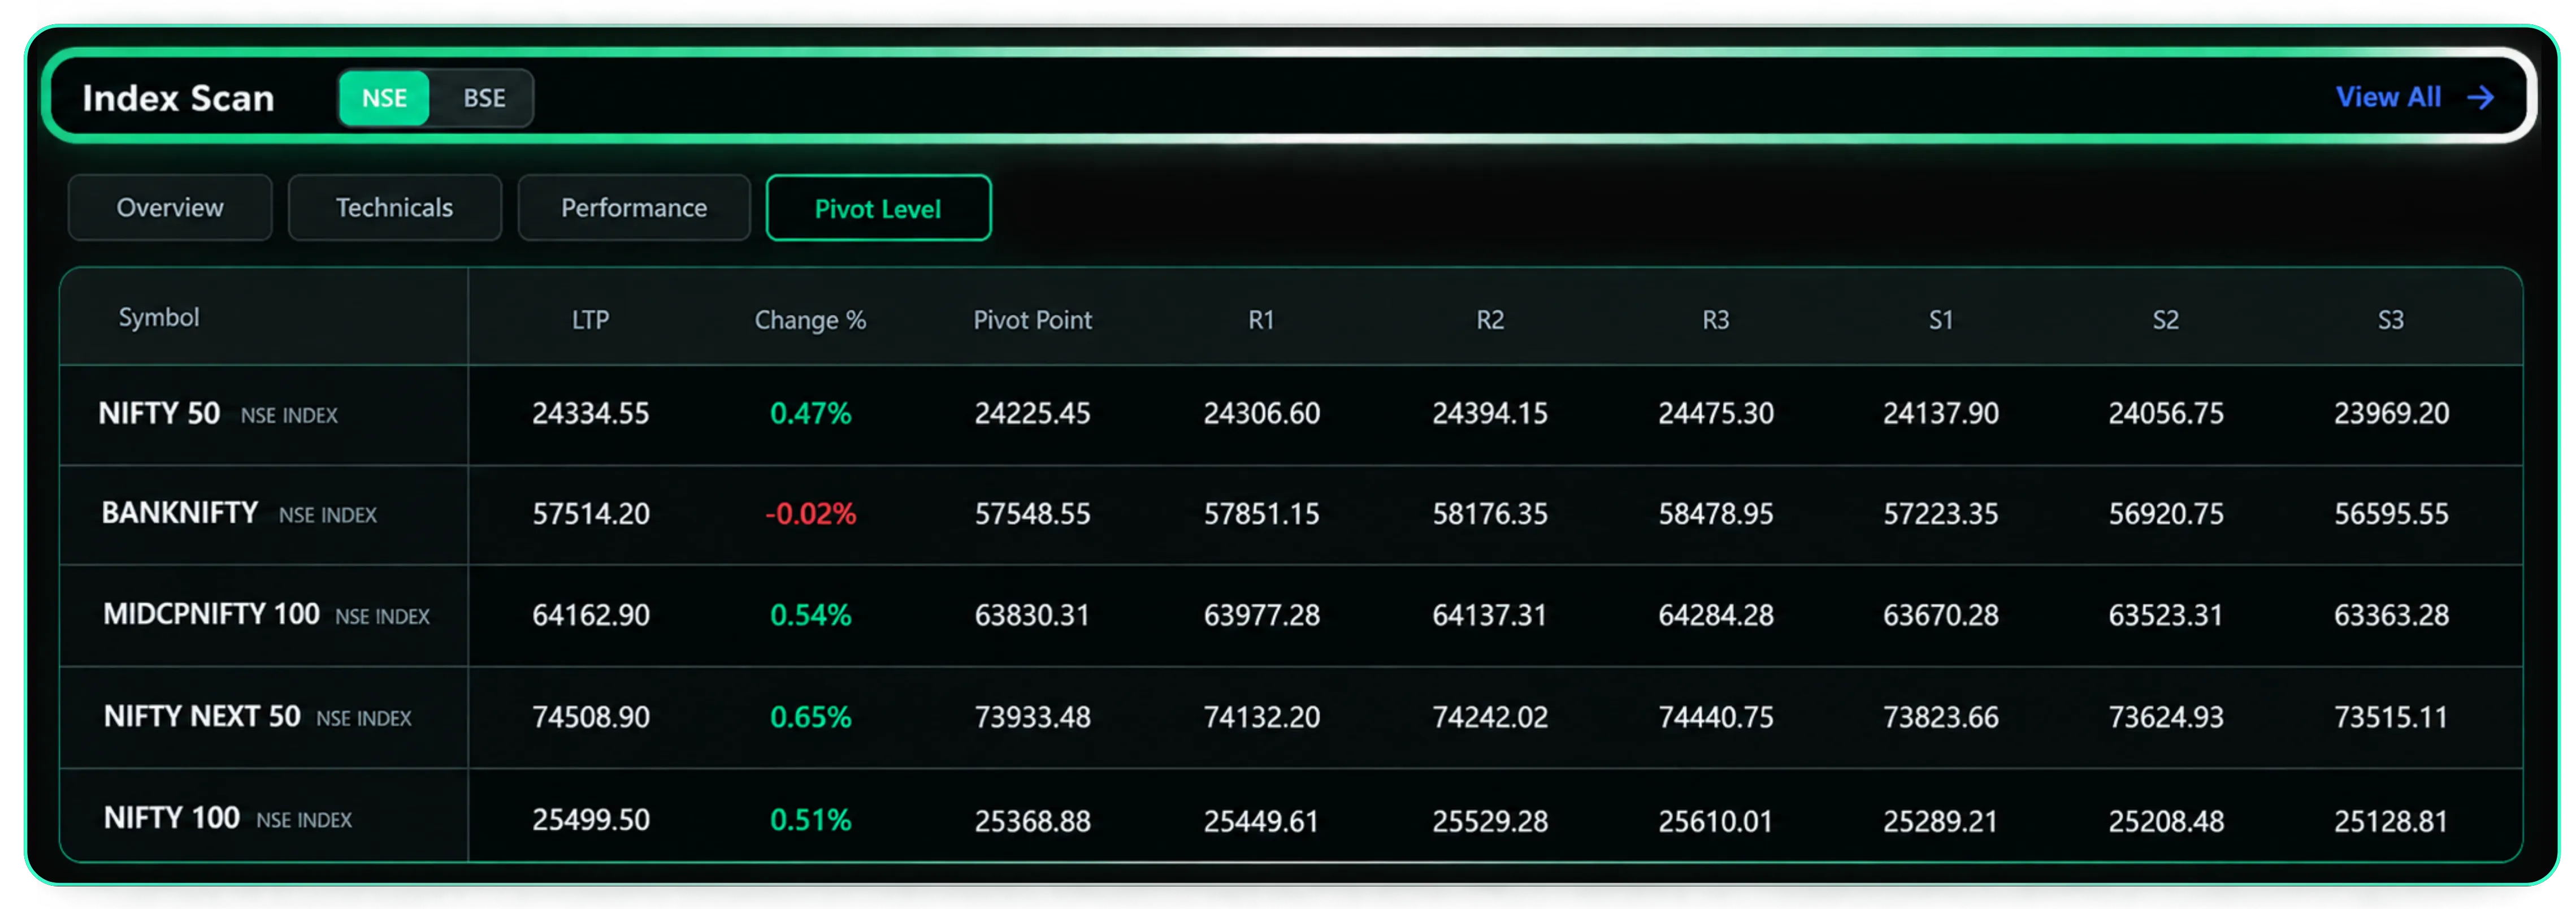
Pivot Level covers Standard, Fibonacci, and Camarilla pivots with support and resistance levels
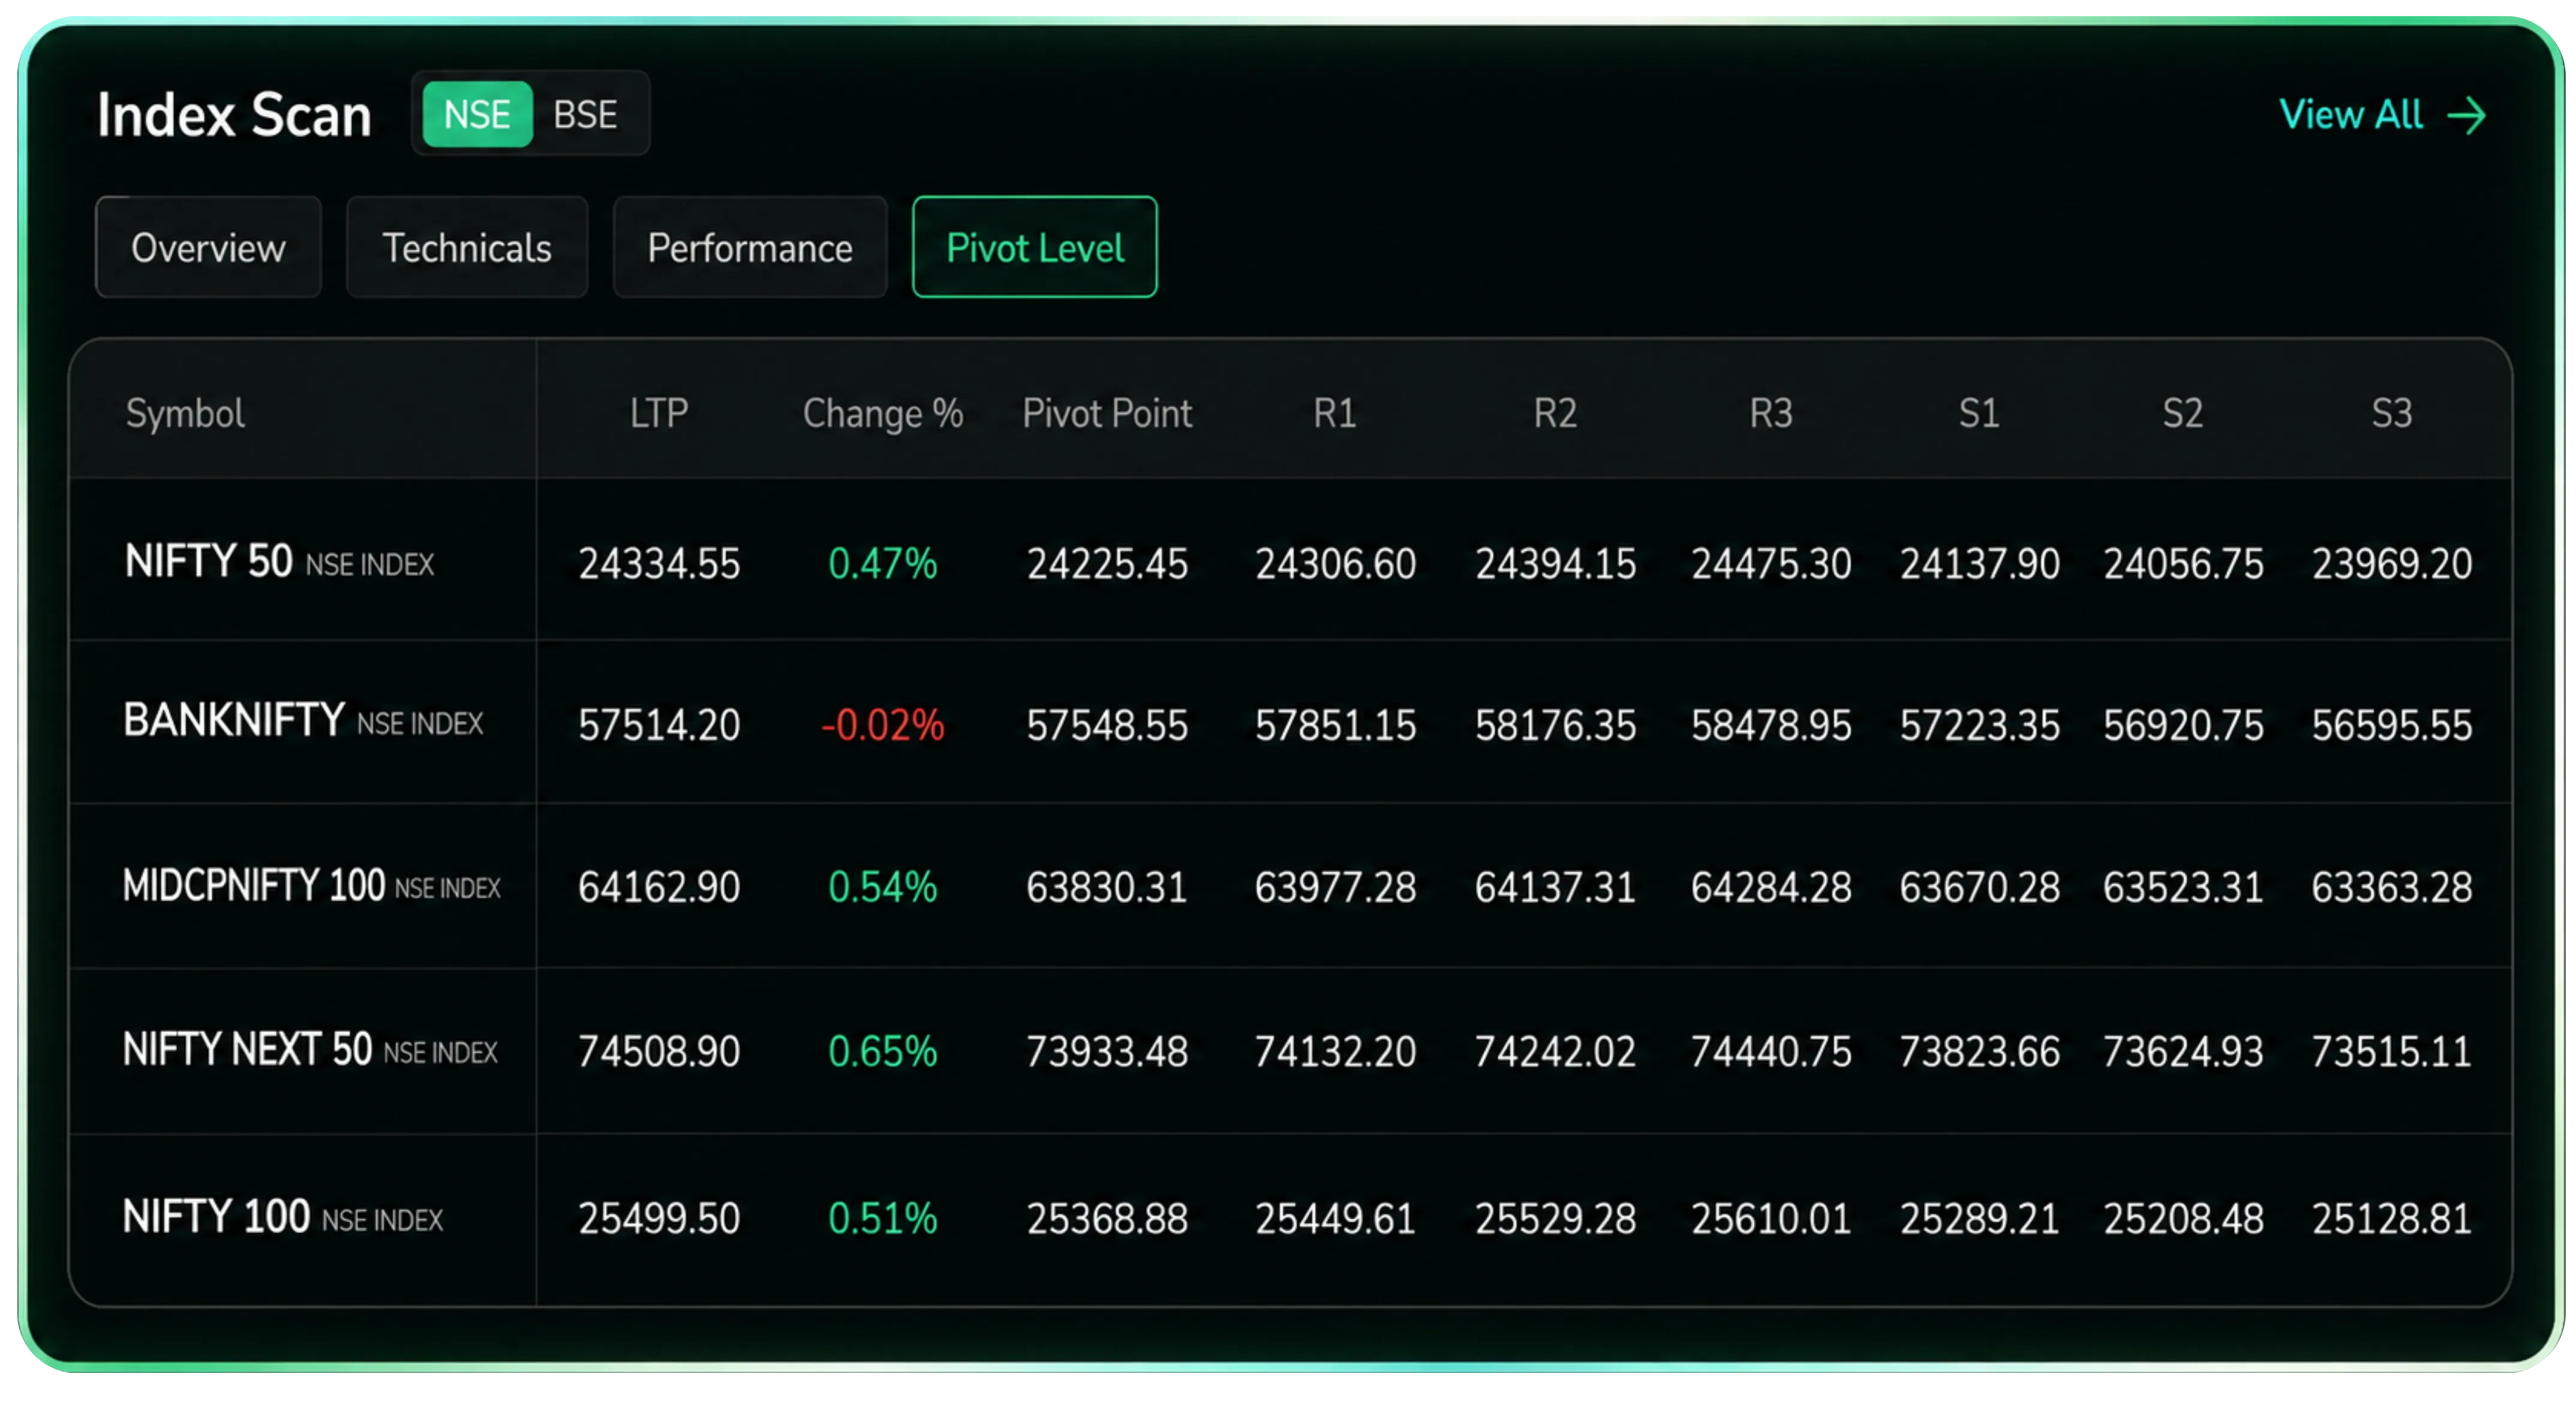
Fibonacci pivot levels and seasonalities historical view for Nifty 50 constituents
Use case: before placing an intraday trade on Nifty, switch the pivot level to Fibonacci and check where the R1 and S1 levels sit relative to the current price. If the price is hugging S1, that's a level worth watching for a bounce or a breakdown.
Seasonalitics
Seasonalitics shows a stock or index's average performance for a chosen month, going back to 2014. Filter by Historical to see the year-by-year numbers, by Current to see today's price alongside the seasonal average, or by Heatmap to get a colour-coded grid of an entire index's constituents for that month.
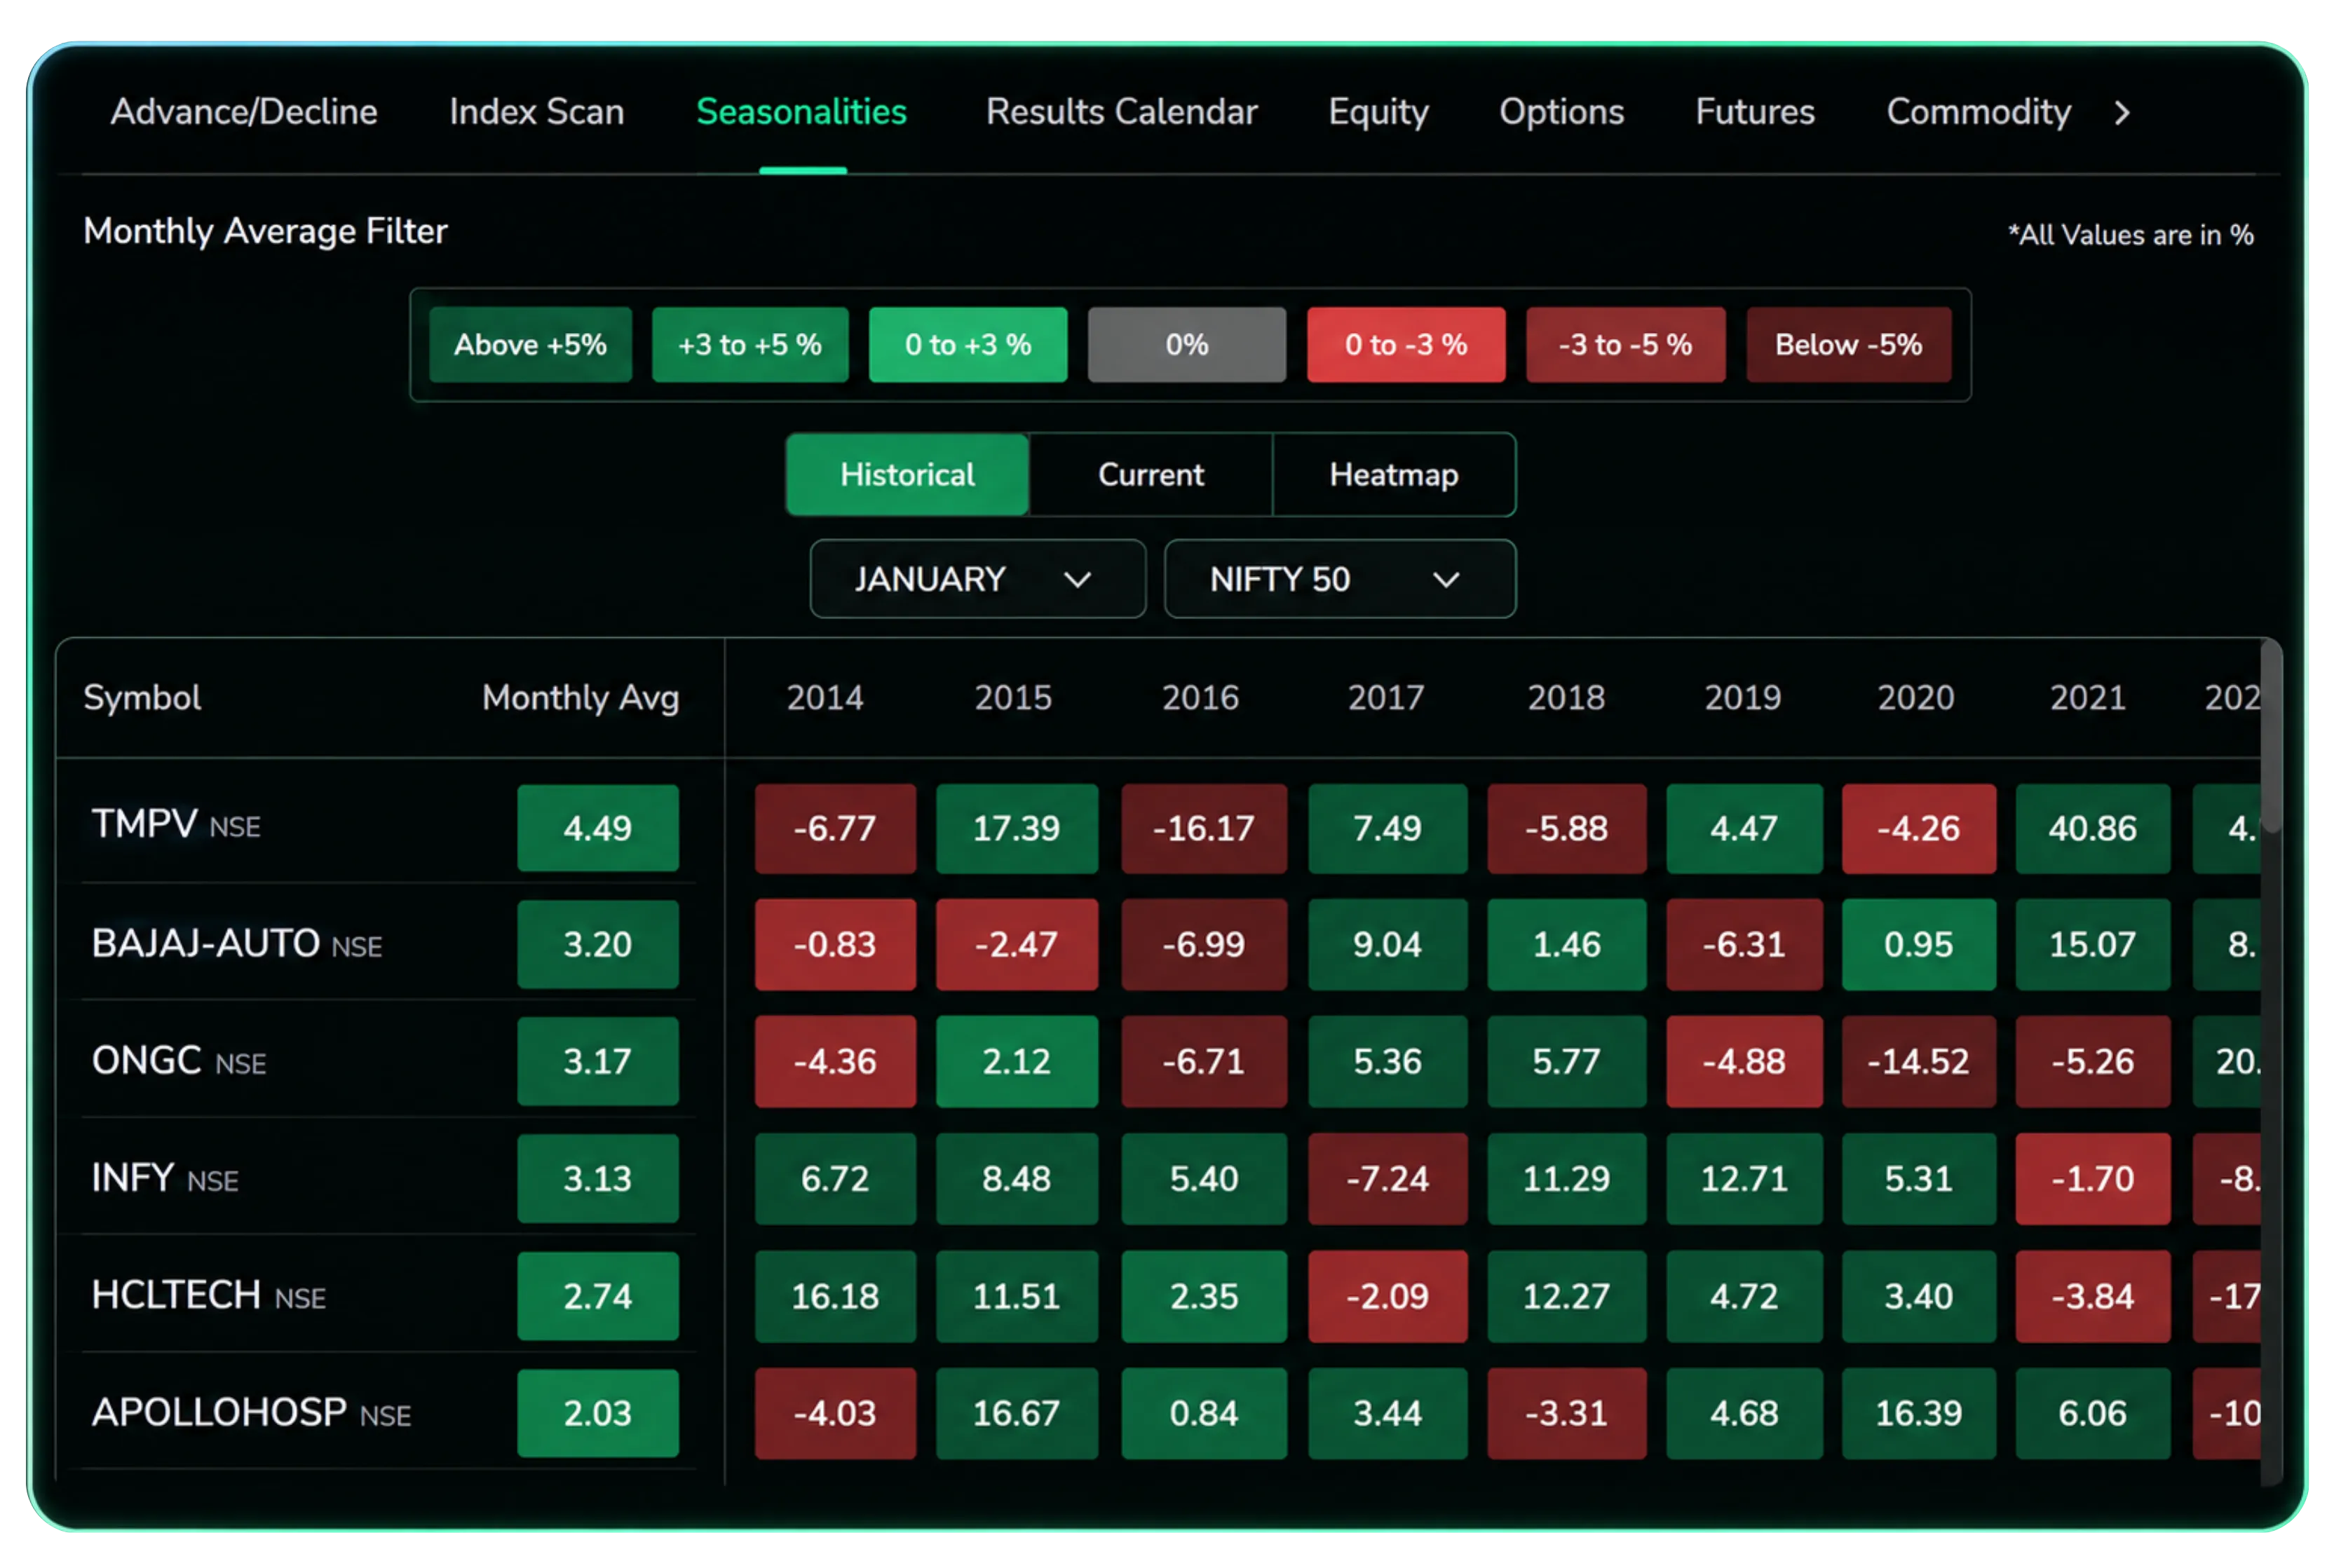
Heatmap view: monthly seasonal tendency across Nifty 50 stocks, colour-coded
Use case: if you trade around quarterly earnings, check how a stock has historically behaved in the month it usually reports. Infosys showing a positive average in January, for instance, is a data point worth weighing alongside the actual result, not a substitute for it.
Results
Filter earnings by Yesterday, Today, Tomorrow, This Week or Next Week, and narrow the list to F&O stocks only if that's your universe. A date picker lets you jump to any specific day.
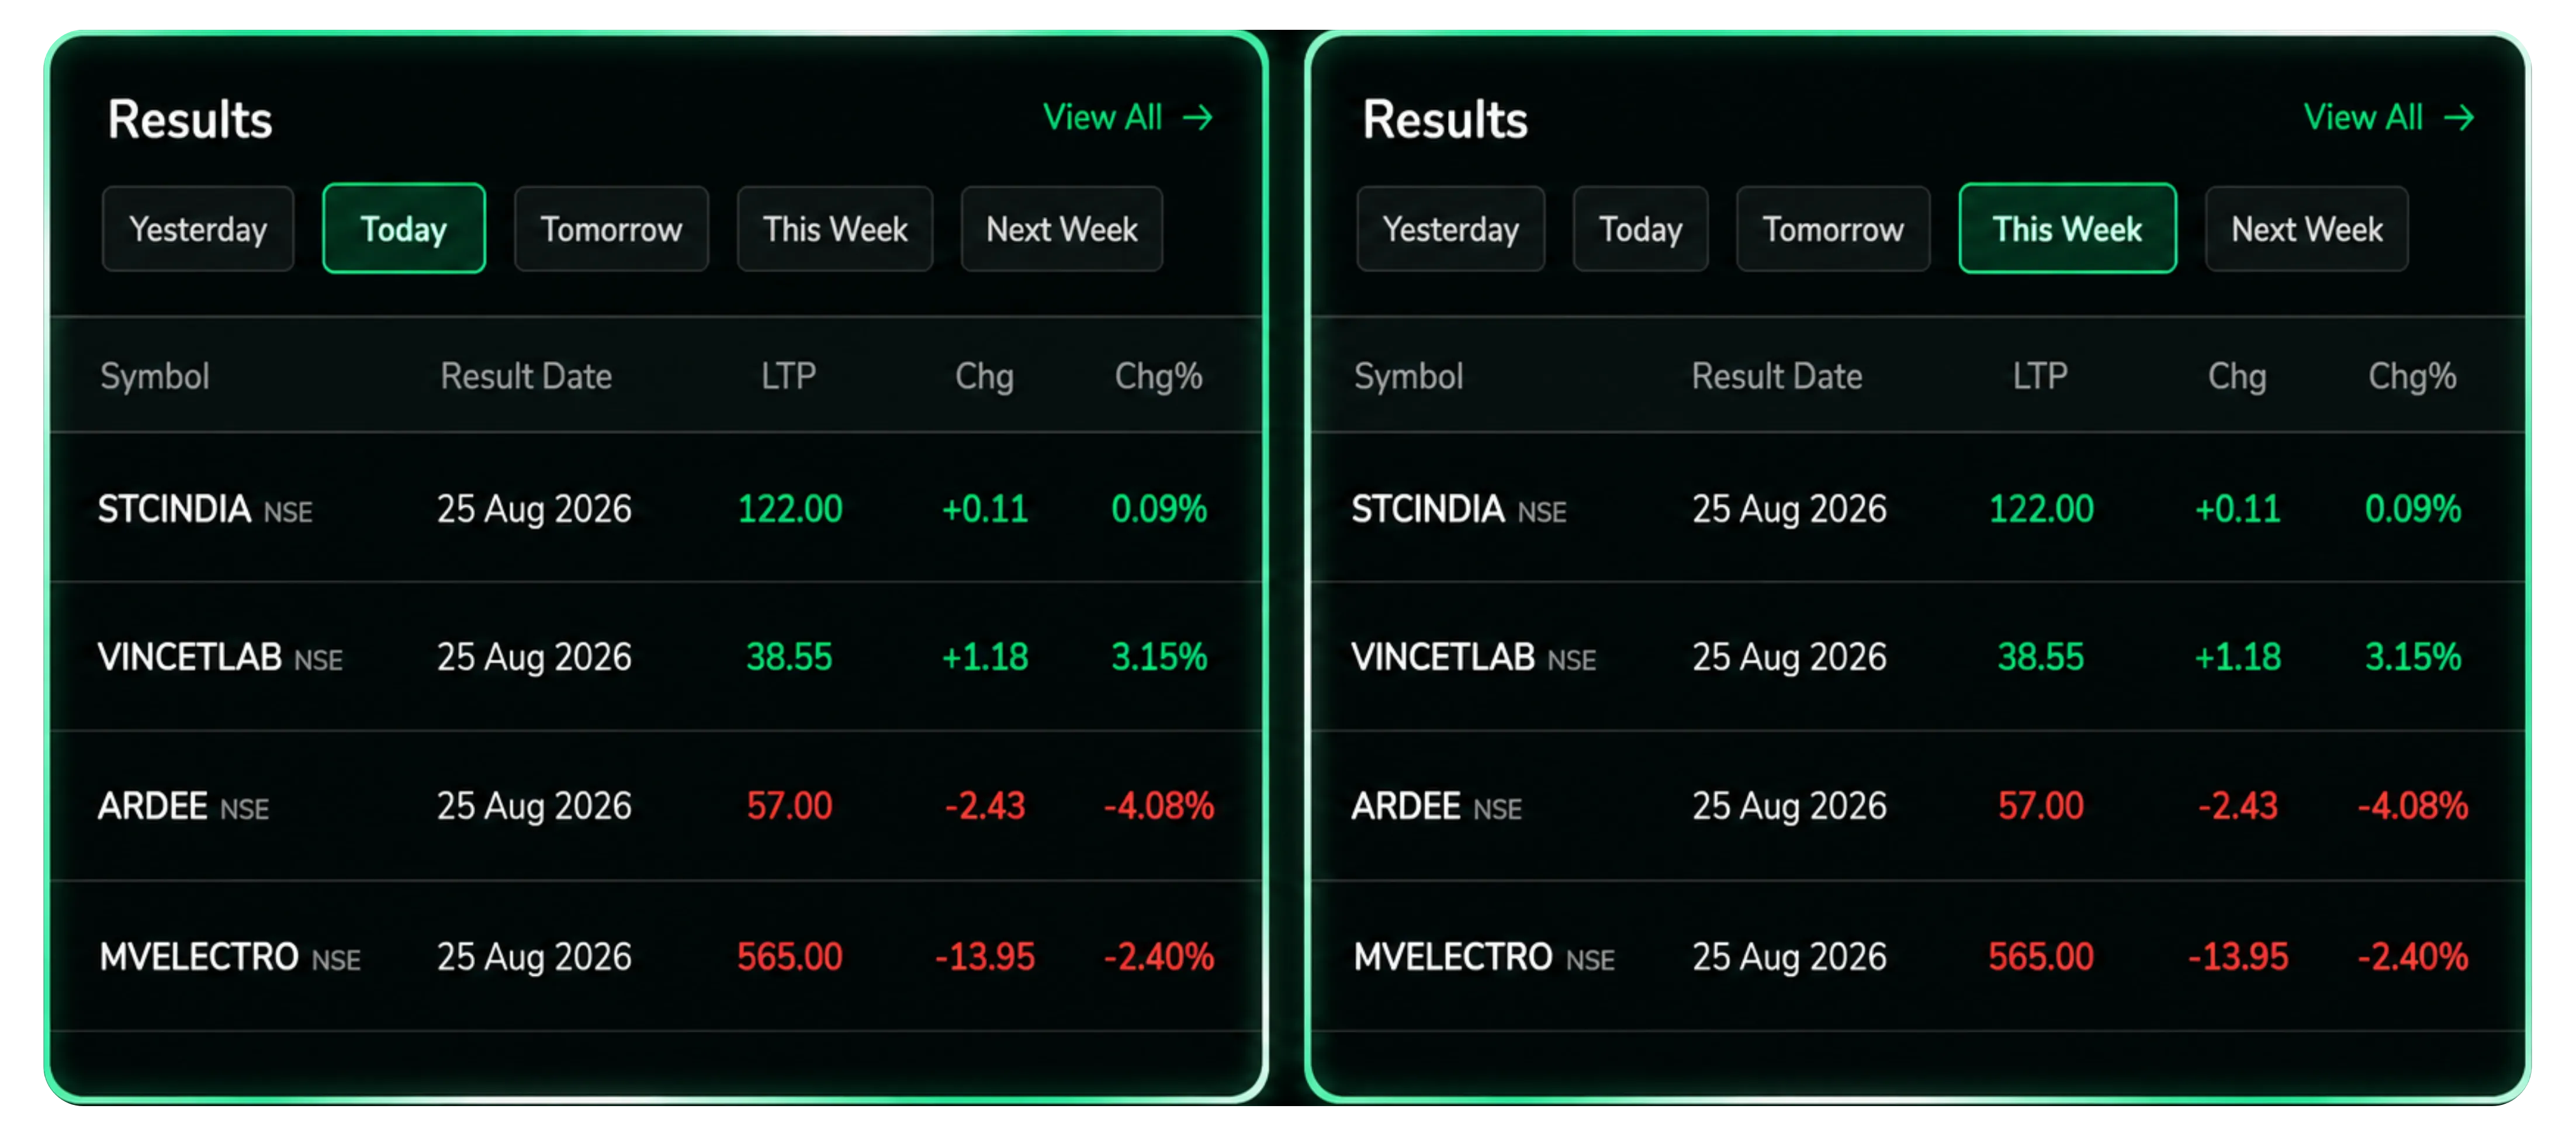
Results Calendar filtered to F&O names, with index and date selectors
Use case: if you're holding options in a stock reporting results this week, checking Results Calendar under This Week and F&O tells you exactly which day to watch for elevated volatility and to manage the position before the event, not after.
IPO
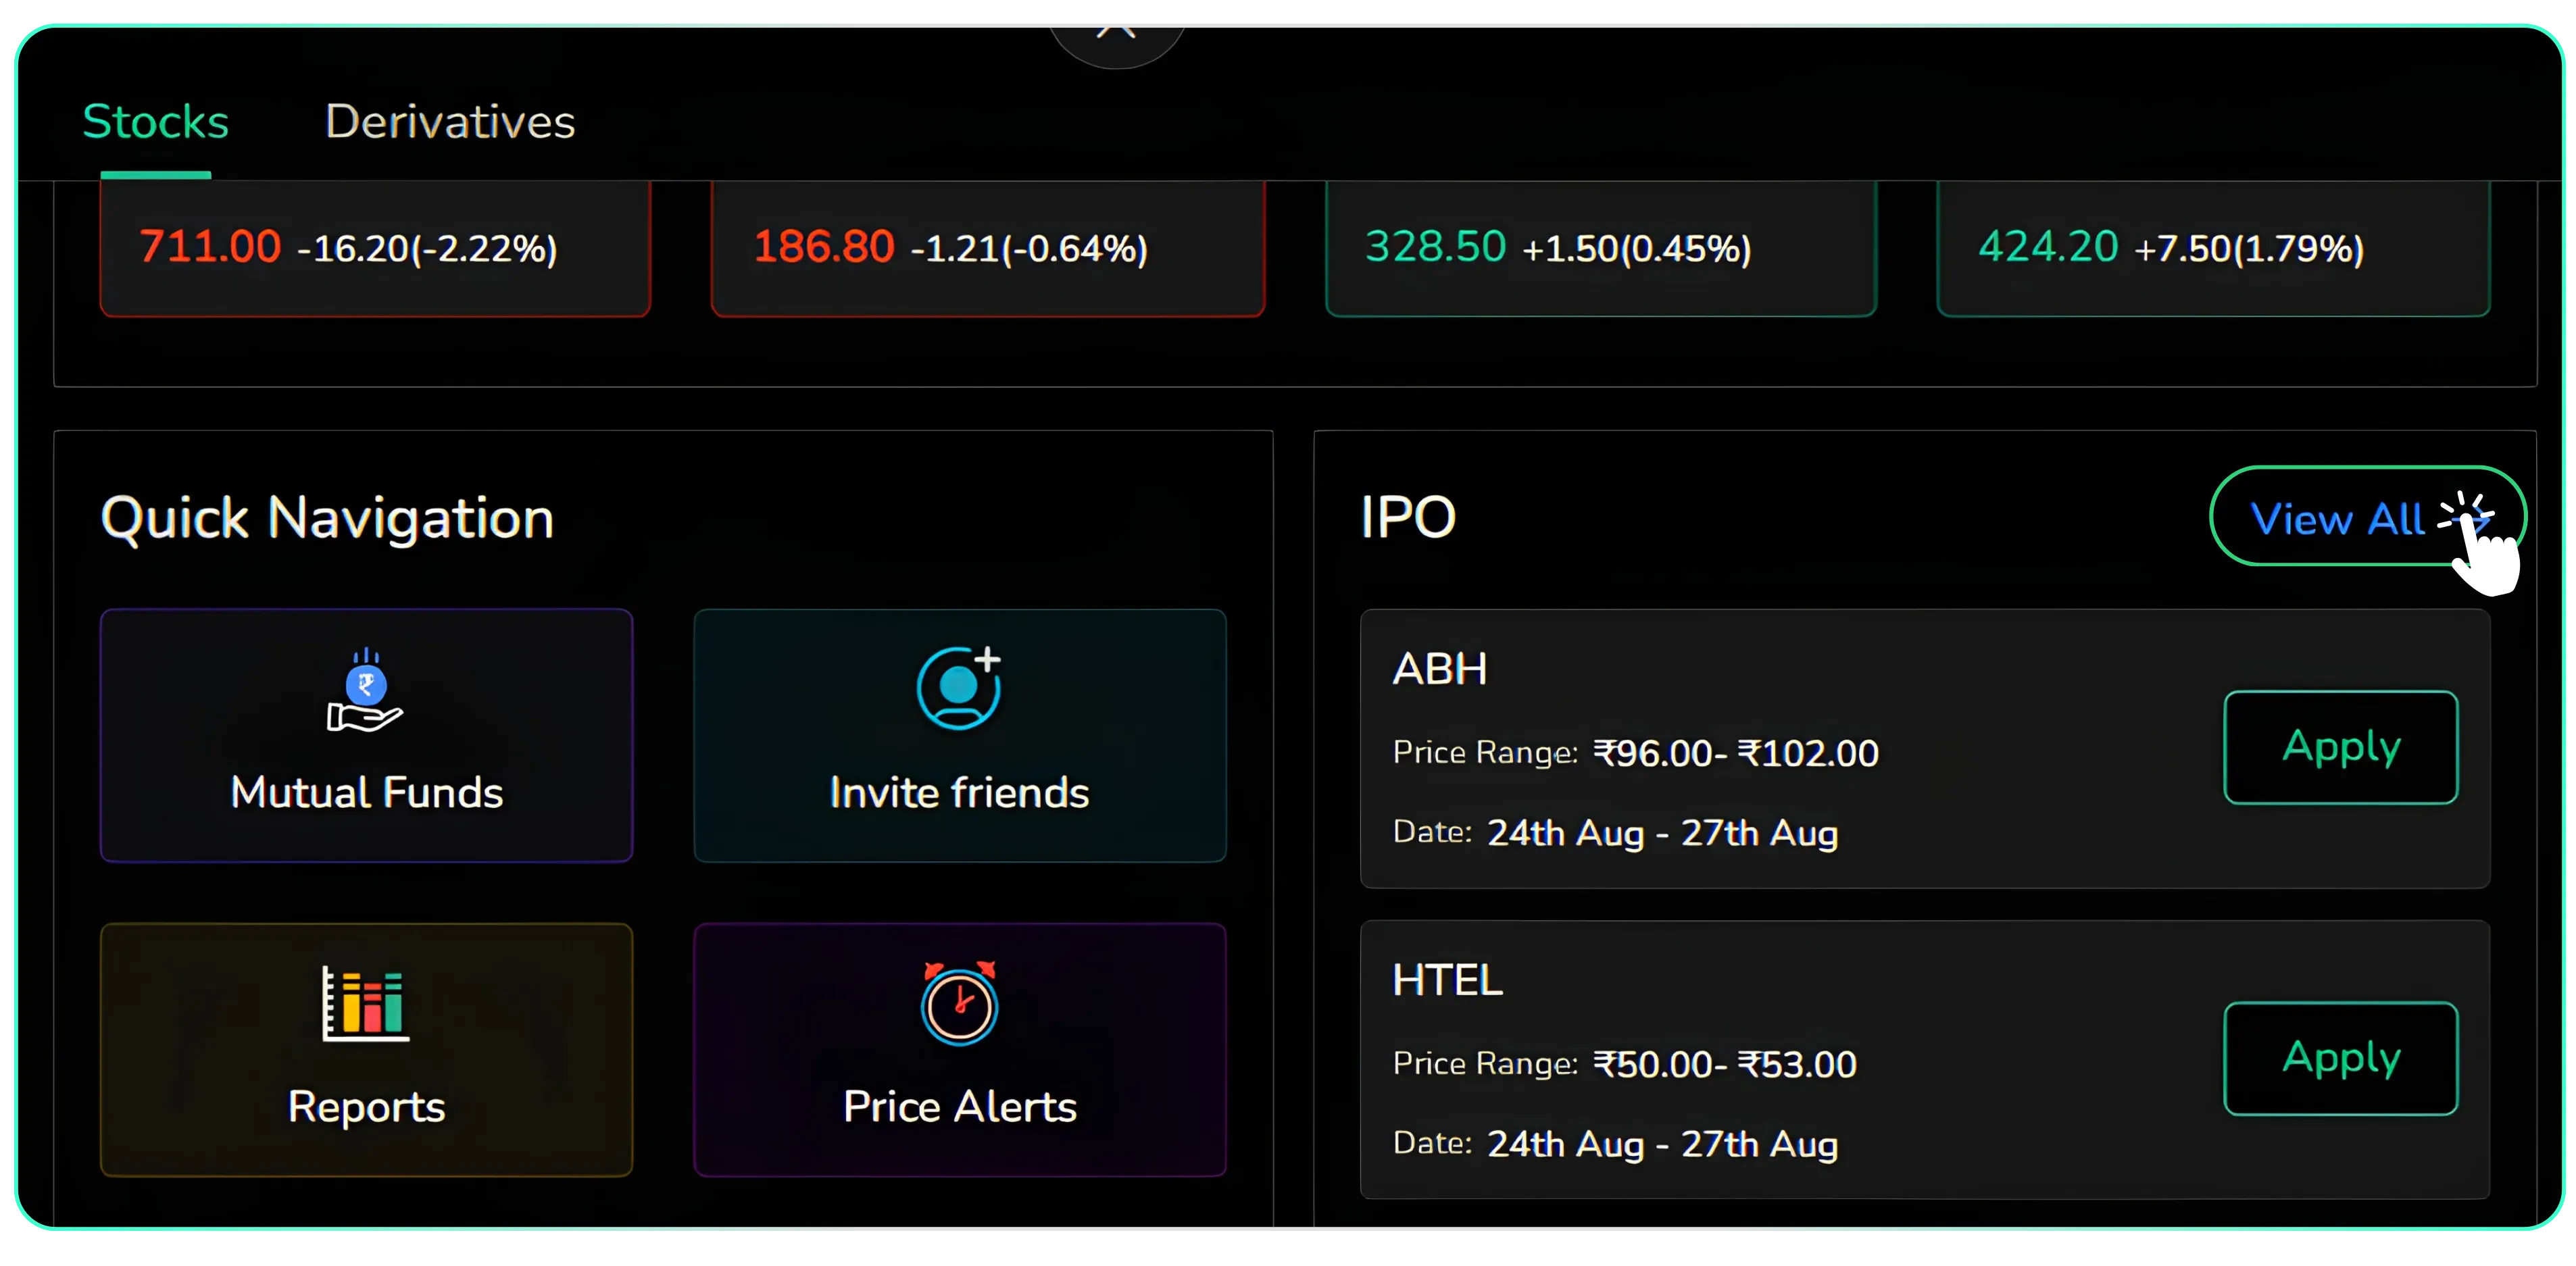
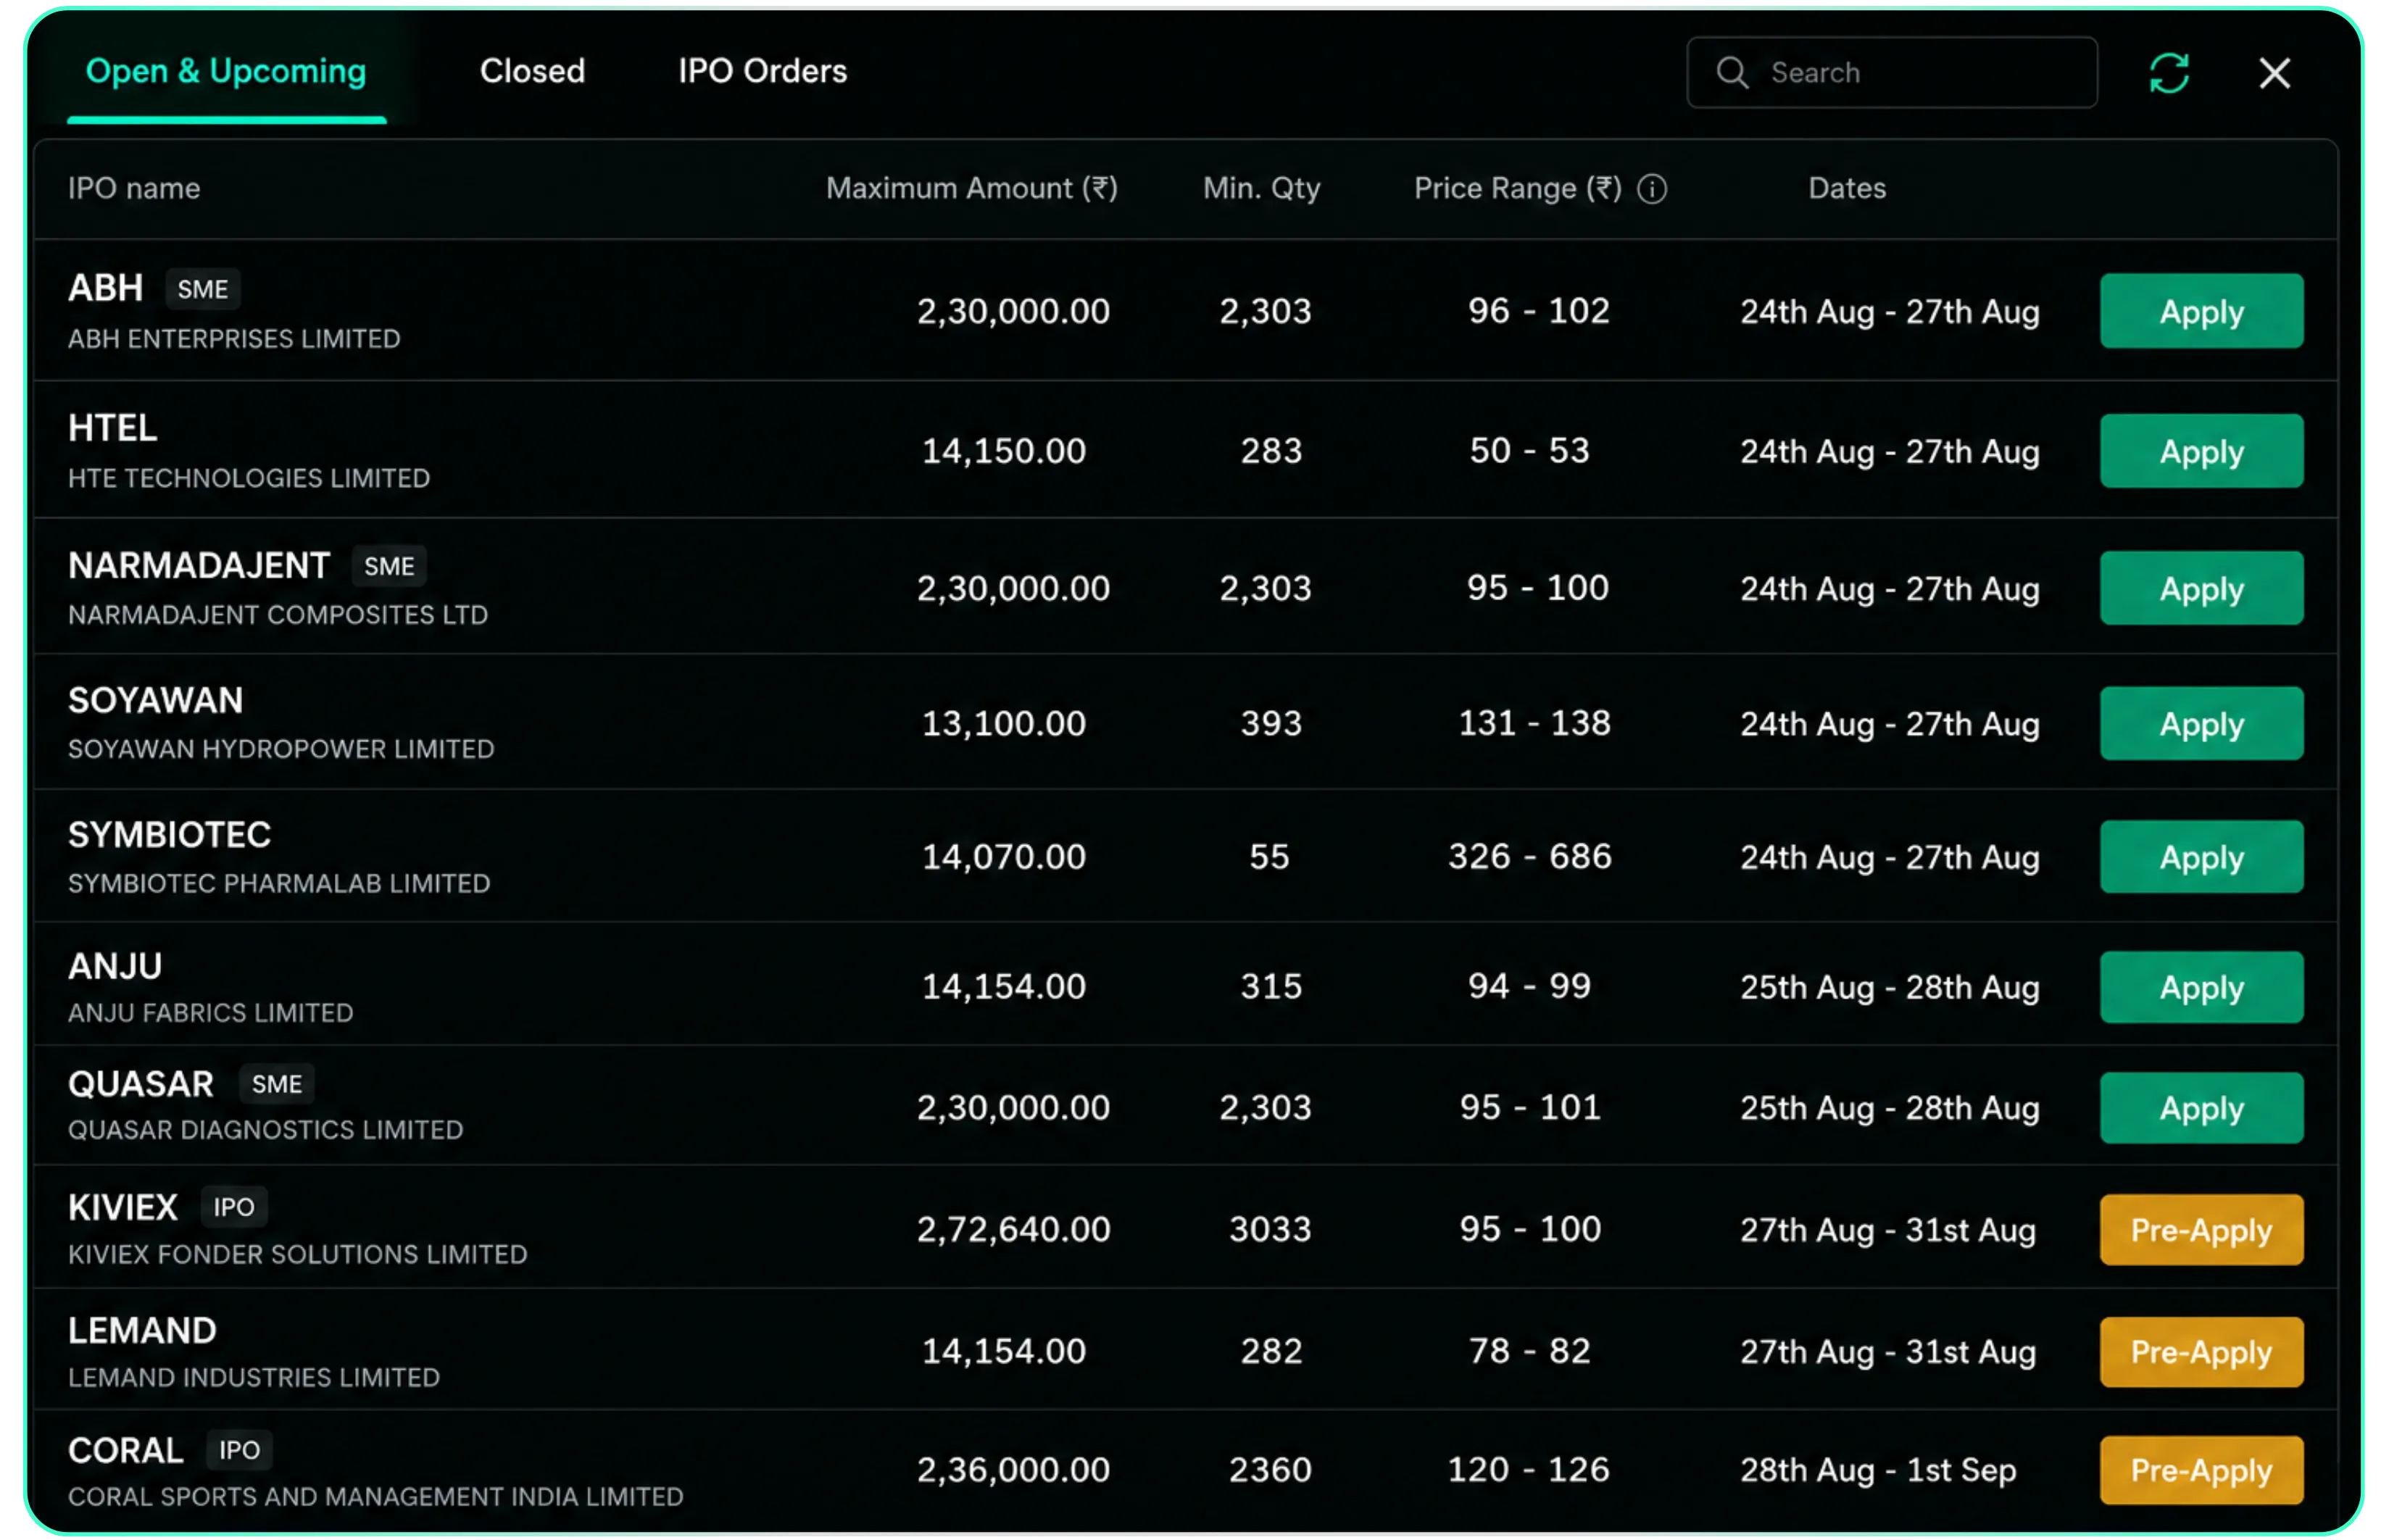
The IPO widget provides quick access to ongoing IPOs, displaying key details such as the price range and application dates, with a one-click option to apply. Users can also select “View All” to explore the complete list of available IPOs. CubePlus allows users to pre-apply for IPO
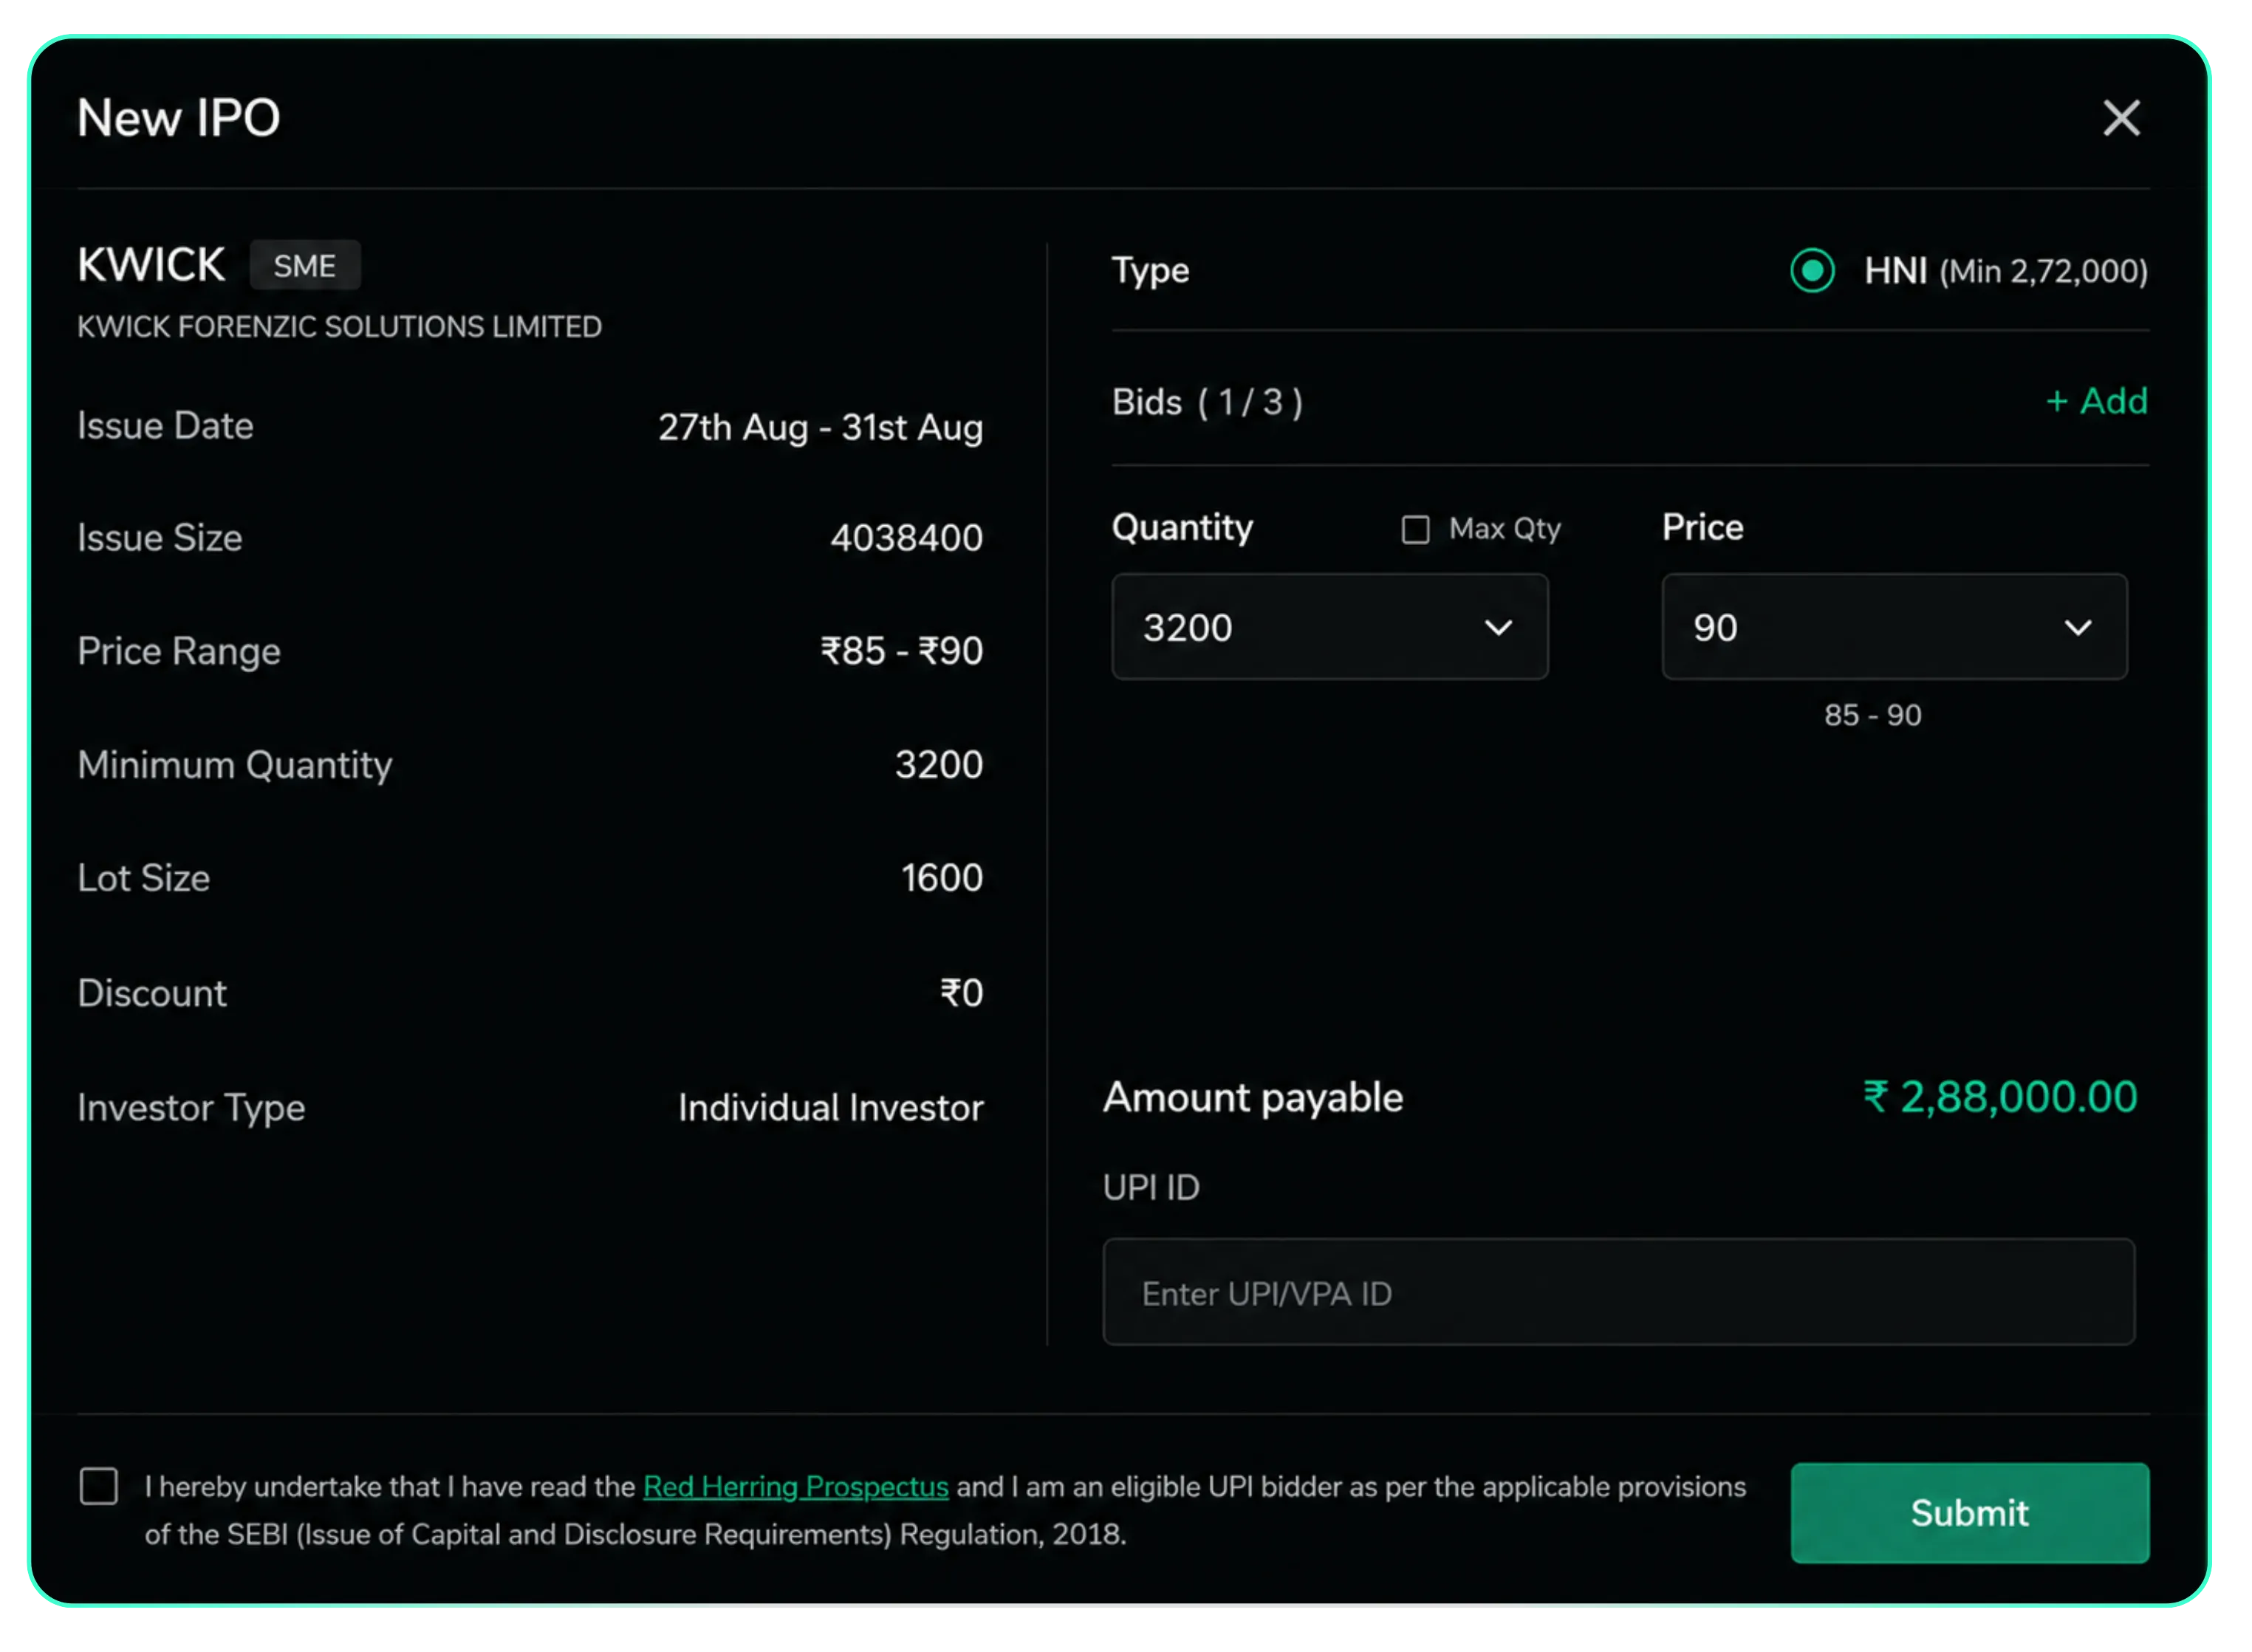
Clicking Apply on any IPO opens this order form directly on CubePlus; no separate app needed. It shows the full issue details, issue date, issue size, price band, minimum quantity, lot size, etc. Enter your UPI ID, accept the declaration, and submit.
Use case: CubePlus also allows users to pre-apply for IPOs before the issue opens. Clicking IPO Orders shows all applications in one place, completed, cancelled, and pending. So tracking the status of every bid doesn't mean hunting through separate confirmation emails or the exchange portal.
ETF
ETFs at a Glance
A quick ETF is split into two panels: Most Traded and Top Performing.
Most Traded vs. Top-Performing
Most traded rank ETFs are based on how much they are being bought and sold on the NSE today, not on how much their price has moved. For example, ETFs like TATAGOLD, METALIETF, and TATSILV appear here because they are actively changing hands.
Why does this matter? Higher trading volume usually means better liquidity and a smaller gap between the buy and sell price. This can help your order get filled closer to the price you see, reducing unexpected slippage. Checking the most traded before placing an order can help you avoid ETFs with low liquidity, especially when placing larger orders.
Top Performing, on the other hand, ranks ETFs purely by today's price gain. So names like NPBET and PVTBANKADD can show up even if they aren't usually among the most actively traded ETFs. A strong gain can be a sign that a particular sector or theme is starting to gain momentum. Scanning Top Performing gives you a quick way to spot ETFs that are moving strongly and may be worth a closer look to understand what's driving the move.
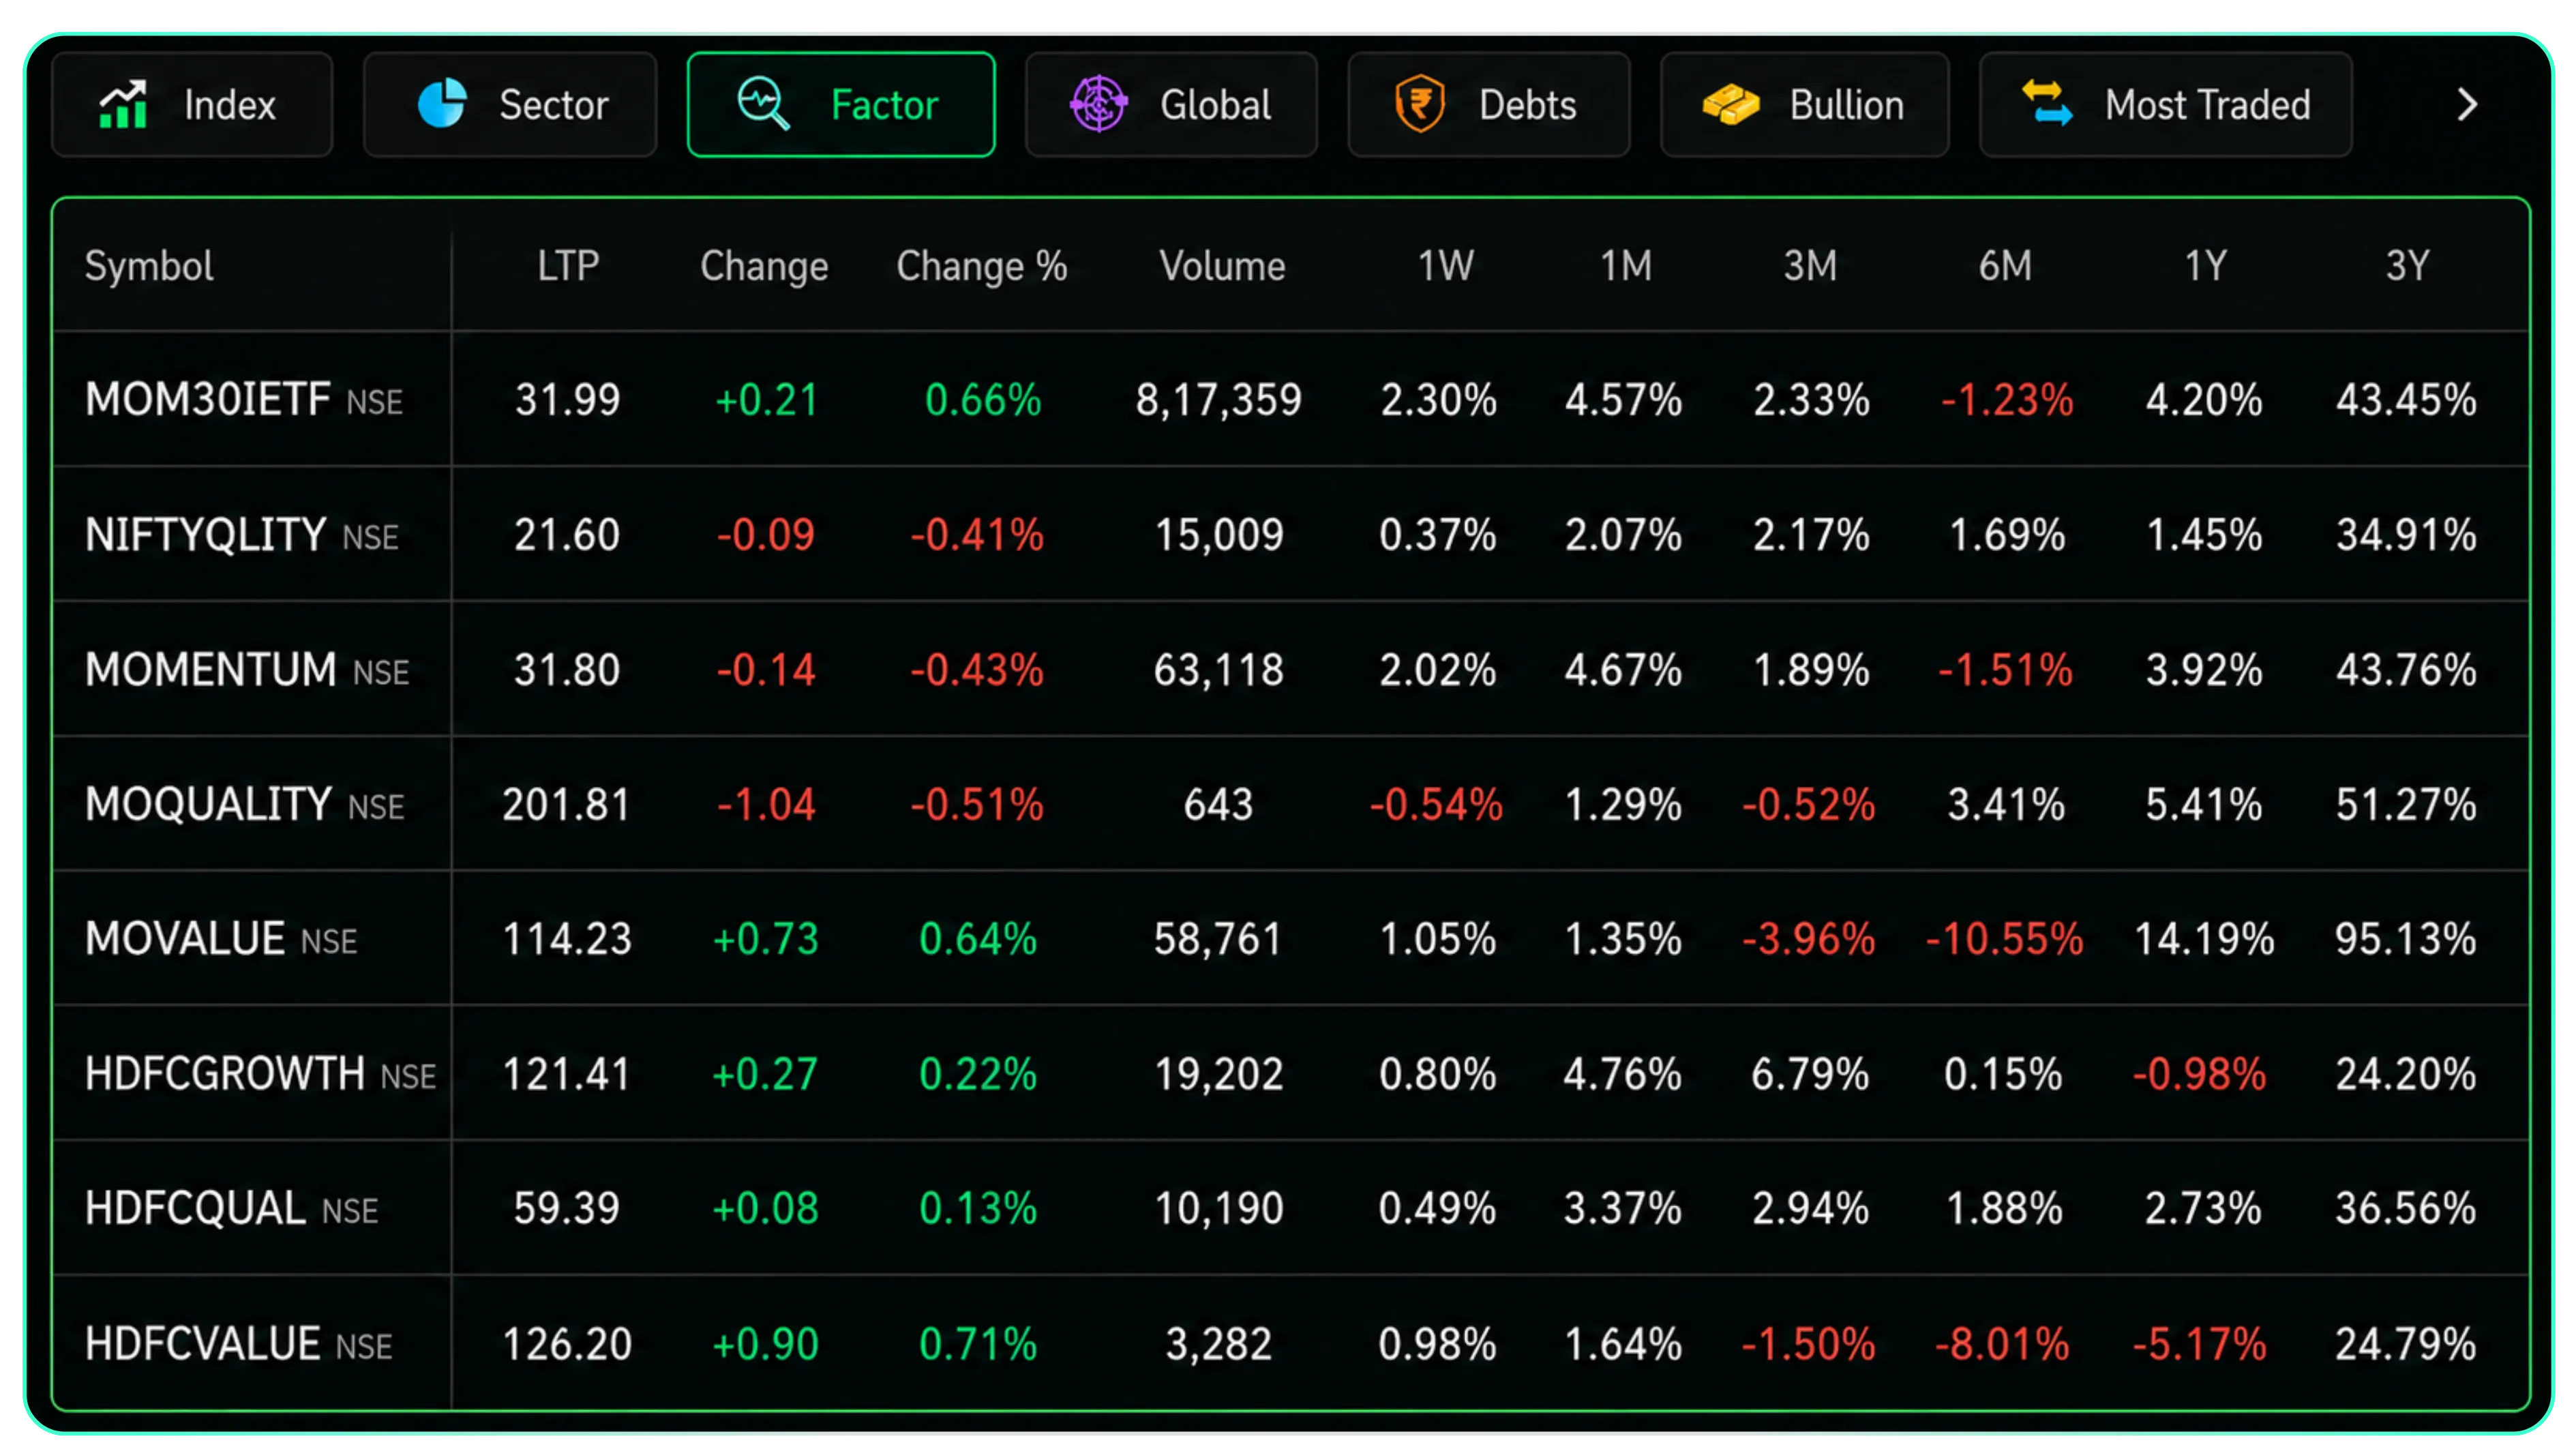
The ETF section is organized by category: Index, Sector, Factor, Global, Debts, Bullion, Most Traded, and Top Performing. Every ETF row shows returns across 1 week to 5 years.
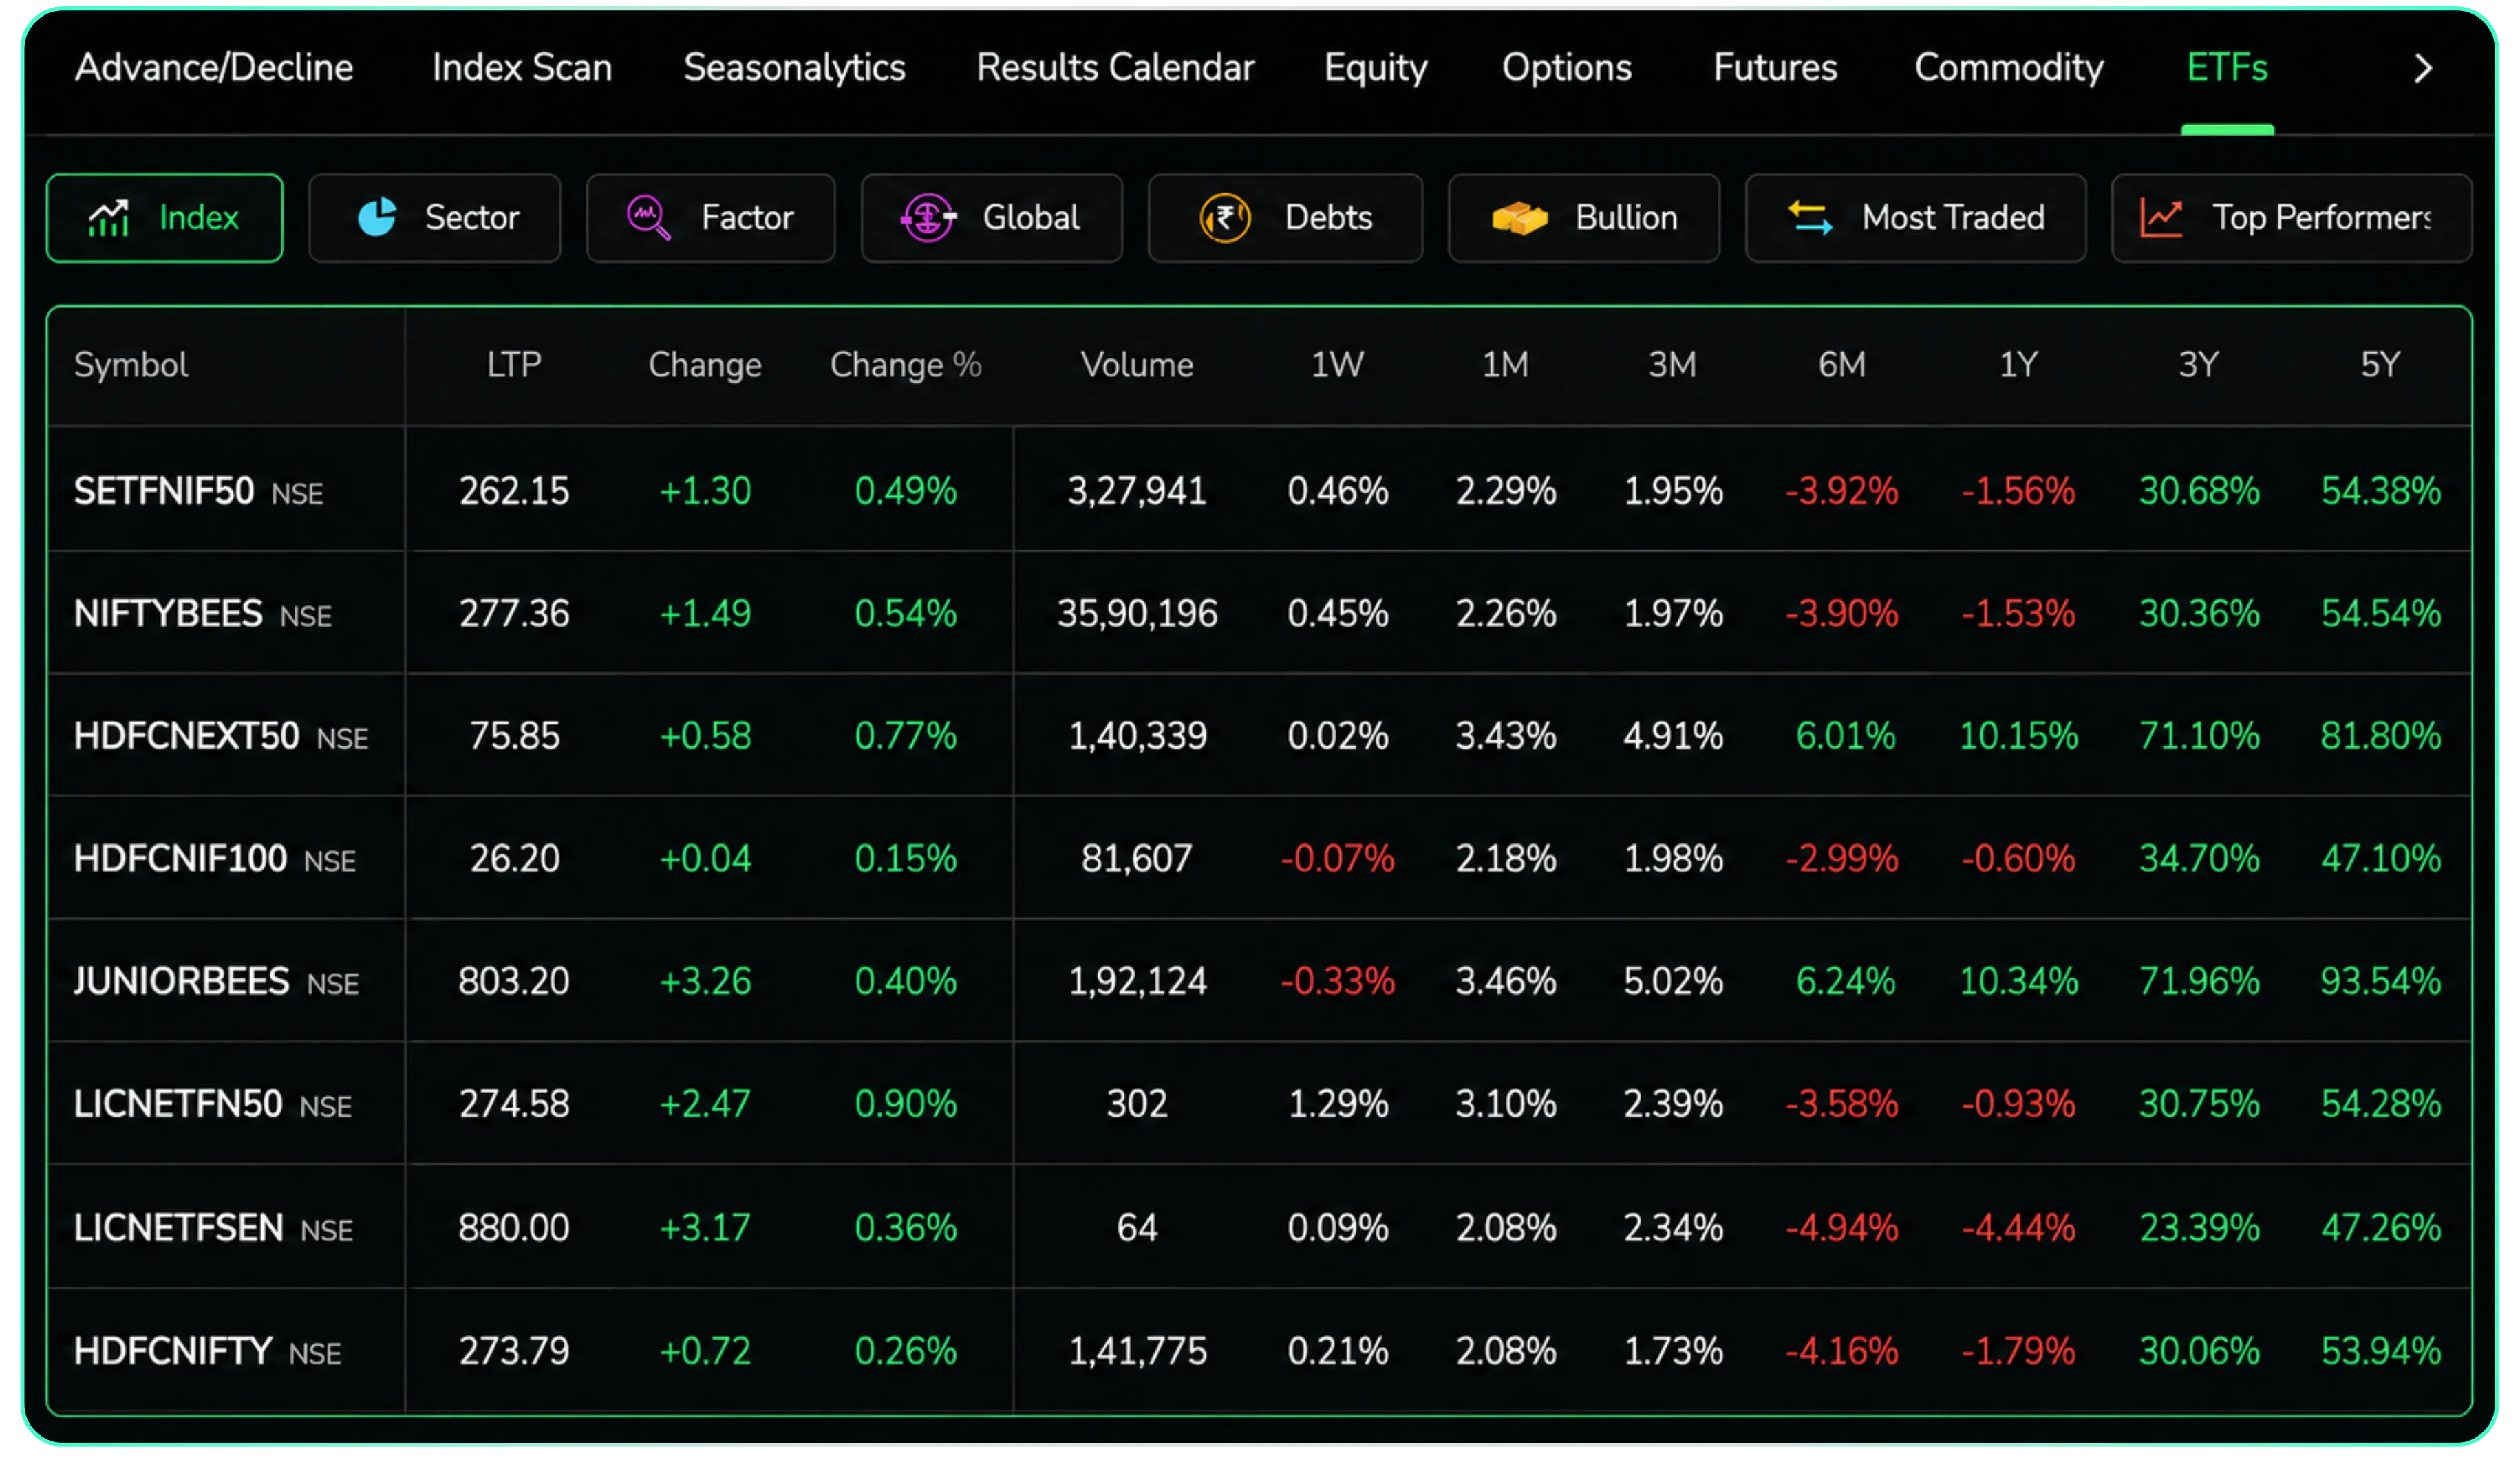
ETFs grouped by Bullion and Most Traded, with multi-year returns

Index: ETFs tracking broad market indices like Nifty 50 or Sensex. Useful when you want plain market exposure without picking individual stocks or want to compare how closely different index ETFs track their benchmark.
Sector: ETFs focused on a single sector banking, IT, pharma, and so on. Handy when you have a view on a specific sector doing well, say auto, ahead of a festive season, without the added risk of betting on one stock within it.
Factor: ETFs built around a specific investing style, like momentum, value, or quality, rather than a sector or index. Useful if you want to tilt your portfolio toward stocks with a particular characteristic, say low-volatility names, without hand-picking them yourself.
Global: ETFs giving exposure to international markets or global themes, like US tech or global metals. Useful for diversifying beyond Indian markets without opening a separate overseas trading account.
Debts: ETFs investing in bonds and fixed-income instruments, like gilt or liquid ETFs. Useful for parking money with lower risk than equity, or for building a debt allocation alongside your stock portfolio.
Bullion: ETFs tracking gold or silver prices. Useful as a hedge during market uncertainty or for holding gold digitally without worrying about storage or making charges on physical gold.
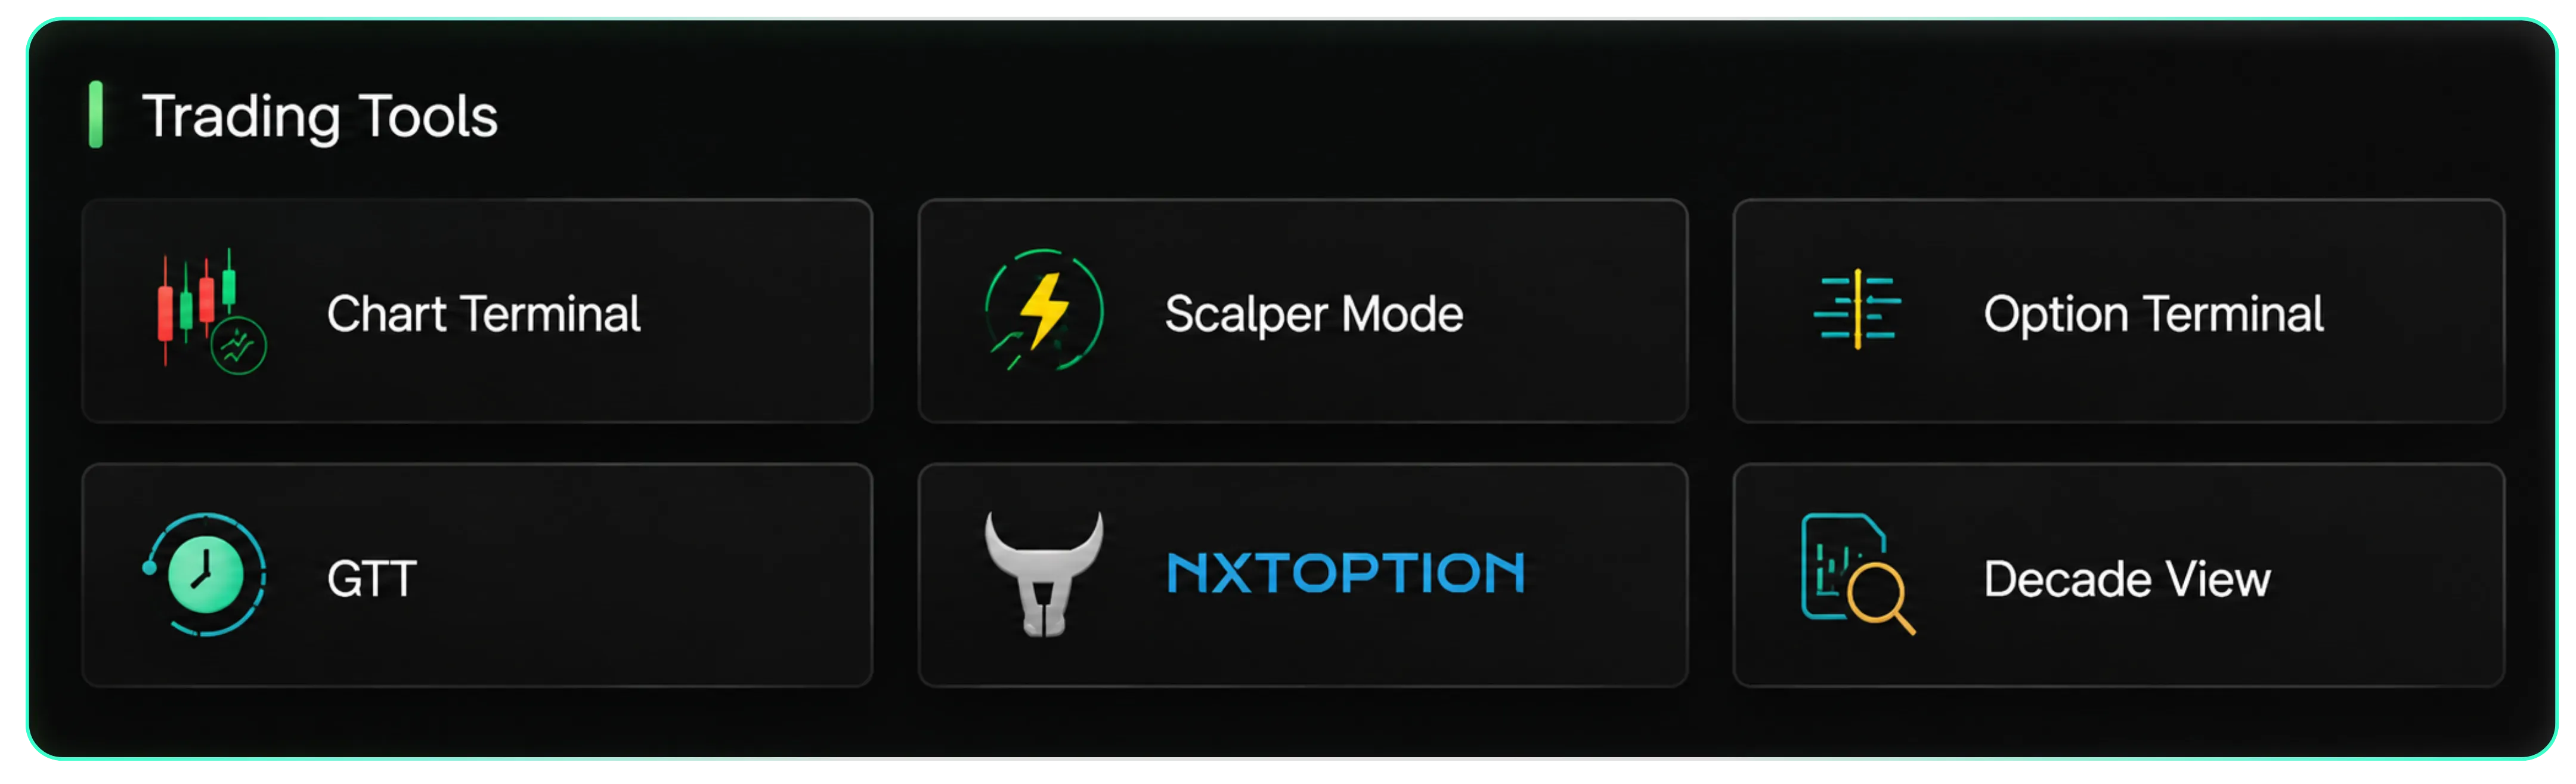
The Trading Tools panel puts six shortcuts within one click:
- Chart Terminal opens a full charting workspace for technical analysis.
- Scalper Mode is built for fast, in-and-out intraday trading with quick order execution.
- Option Terminal gives a dedicated options chain with a trading interface.
- GTT (Good Till Triggered) lets you place conditional orders that stay active until your trigger price hits, so you don't have to watch the market all day.
- NxtOption is the advanced options toolkit covering strategy building, simulation, and volatility analysis.
- Decade View is where fundamentals live, a long-term look at a company's financials and performance stretched across ten years, useful for checking whether a stock's story holds up over a full business cycle, not just the last few quarters.
Customize Your Dashboard Layout
The Stocks tab is fully yours to arrange. A settings panel lists every widget: Top Stocks, Advance/Decline, Holdings, Funds, Positions, IPO, Market Movers, Quick Navigation, Trading Tools, Market Scan, Index Scan, ETFs, Results, and Recent Searches, each with a toggle to switch it on or off. In the example shown, Top Stocks, Funds, IPO, Index Scan, Results, and Recent Searches are kept on, while Holdings, Positions, Market Movers, and Trading Tools are switched off, leaving a leaner Stocks tab built around what that trader actually monitors.
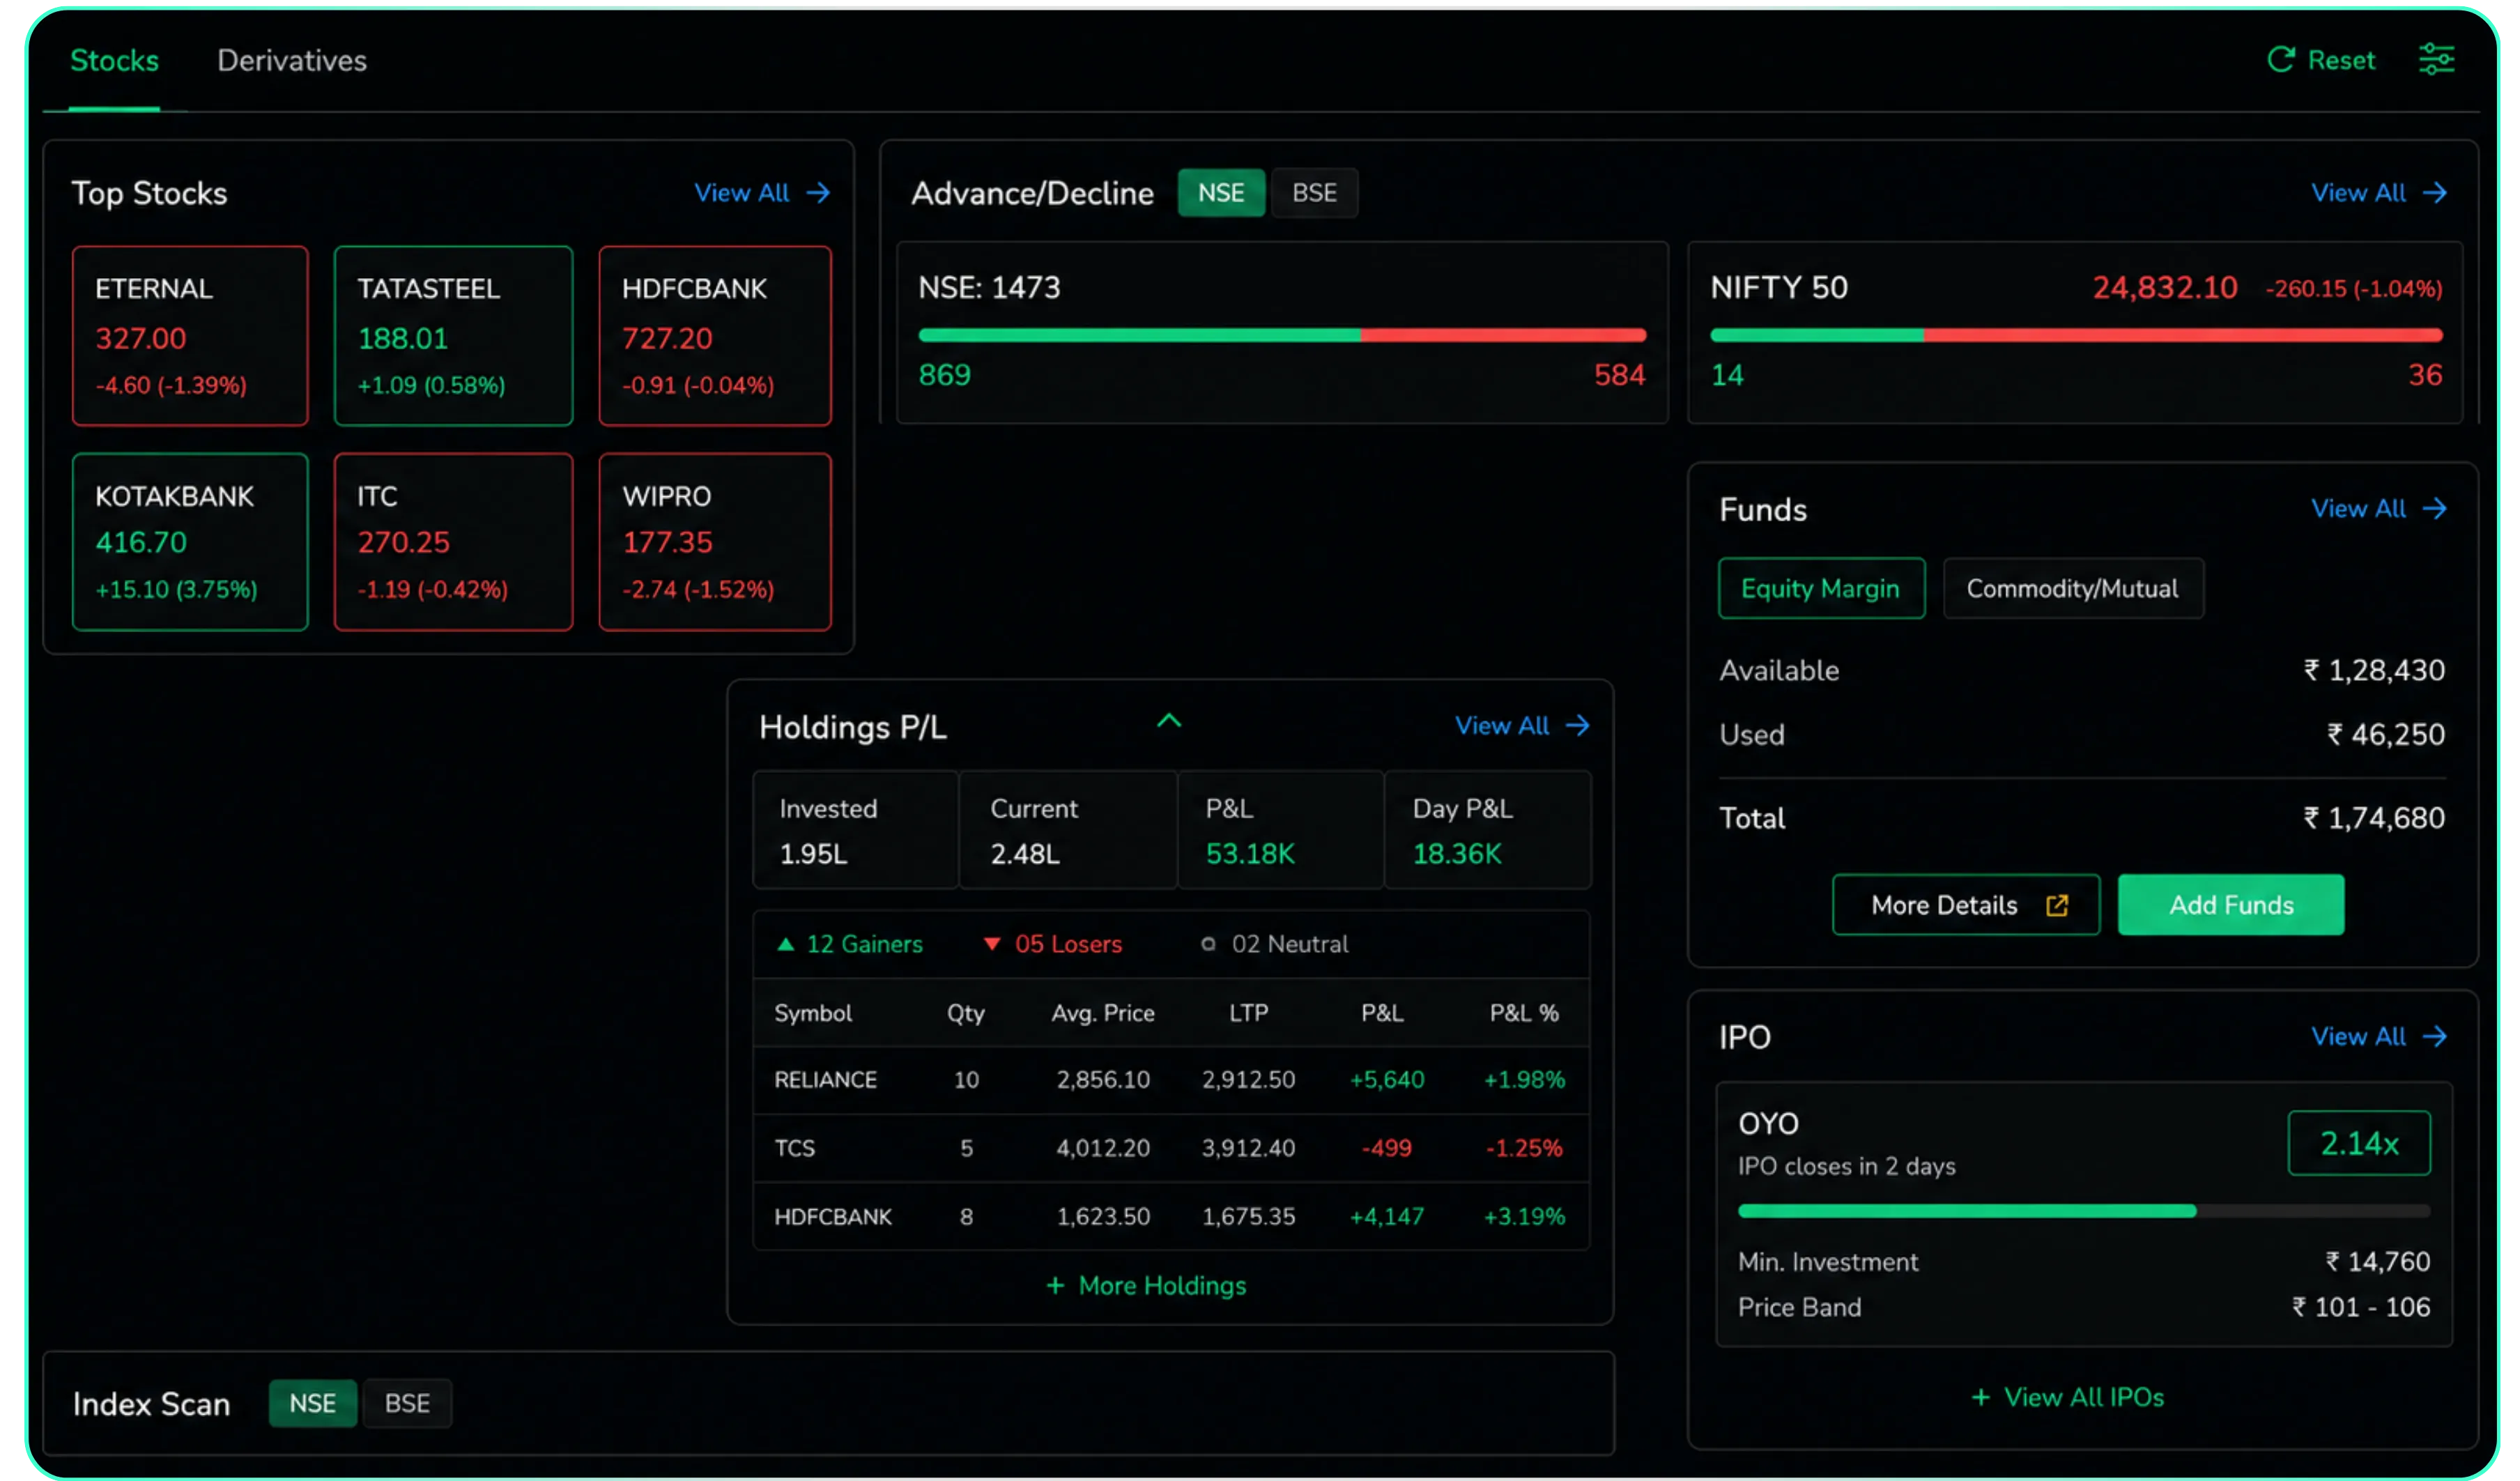
Widgets can also be resized, so a widget you check constantly, like Top Stocks or Funds, can be made larger while less-used ones stay compact. This lets you fit more of what matters into the visible screen without scrolling.
Once the widgets you want are on and sized the way you like, they can be dragged into any order using the handle on each card. Move Funds above Top Stocks, or push Index Scan further down, whatever mirrors how you actually work through the dashboard each morning. A reset link at the top restores the default layout if you want to start fresh.
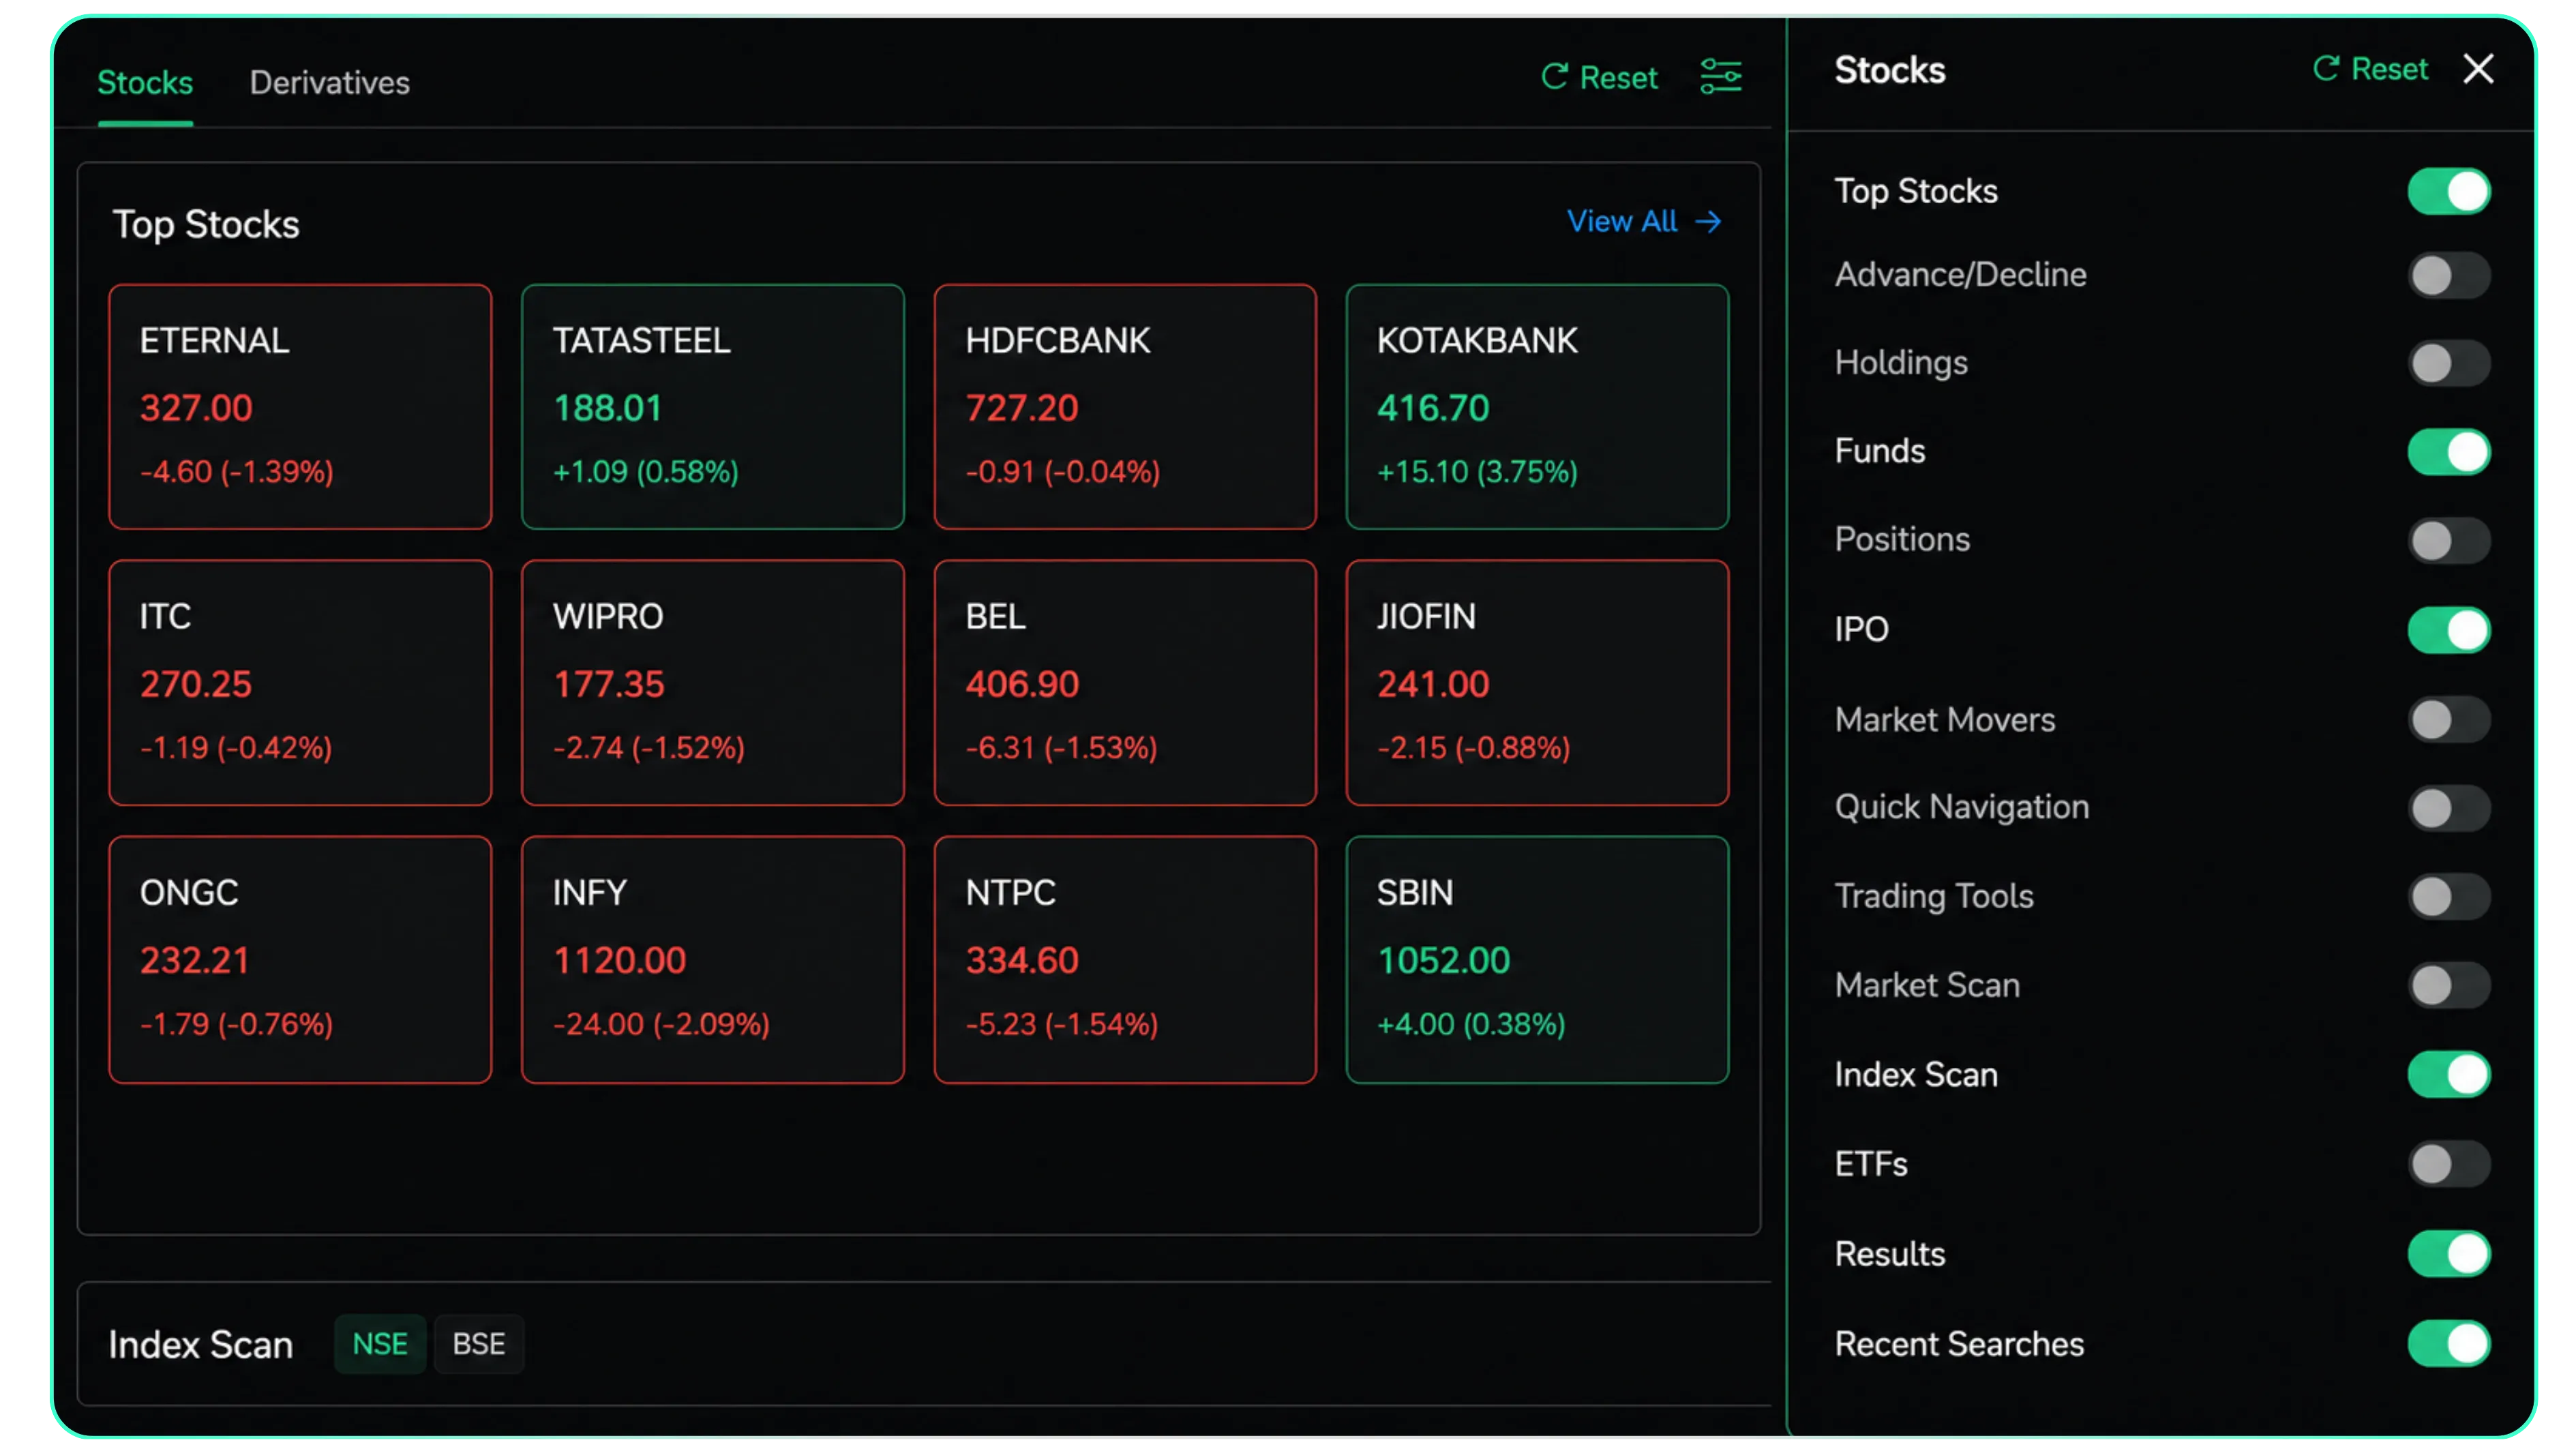
Use case: if you are a pure investor who never trades options or IPOs, switch off Trading Tools and IPO entirely, resize Holdings to take up more space, and drag it to the top so your portfolio is the first thing you see.