Most trading platforms show one row per stock in your holdings: quantity, 𝐚 𝐬𝐢𝐧𝐠𝐥𝐞 𝐚𝐯𝐞𝐫𝐚𝐠𝐞 𝐩𝐫𝐢𝐜𝐞, a single P&L figure. It makes things easier, but retail investors may pay a price for that convenience.
The issue
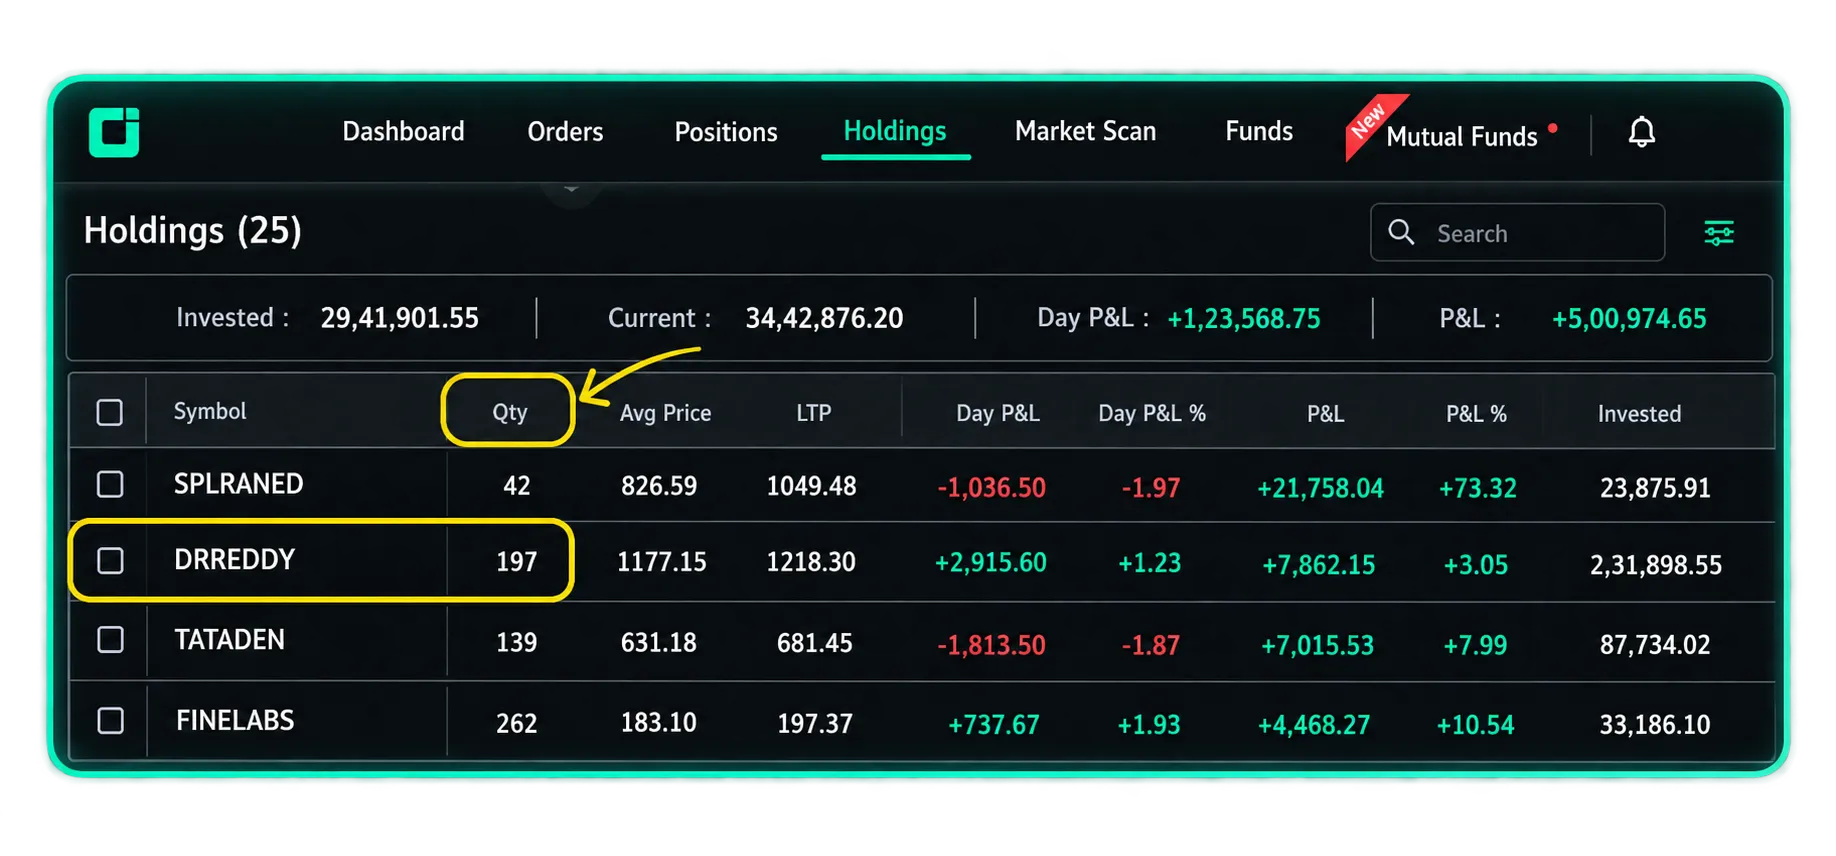
The "average price" on a holdings screen is a weighted blend of every purchase made in that stock, regardless of when those purchases happened. Consider a typical position in DRREDDY: the holdings page shows 197 shares at an average price of ₹1,177.15, with the position comfortably in profit.
Four different purchases are combined into one number. The June purchase was made at a higher price and is currently at a loss. But the average price does not show this clearly because the loss is offset by a large purchase made at a lower price in March 2025.
Why this matters
Decision quality is Mixed : A profitable average can contain one poorly timed purchase alongside several well-timed ones. Without seeing each purchase separately, it is difficult to know which decisions worked and which did not Averaging can Misleading :When investors buy more shares, they may compare the current price only with their latest purchase. They may not realise that the latest purchase was itself made at a high price.
Tax treatment is lot-specific : In India, the holding period for capital gains is calculated separately for each lot. A single average price does not show which purchases qualify as short-term or long-term.
The record of intent is lost :Looking at the purchase dates and prices can reveal whether an investor added because their conviction increased or simply because the stock price was rising. The average price hides this information
How CubePlus addresses this
Tradejini's CubePlus places a small icon next to the quantity field on the holdings screen.
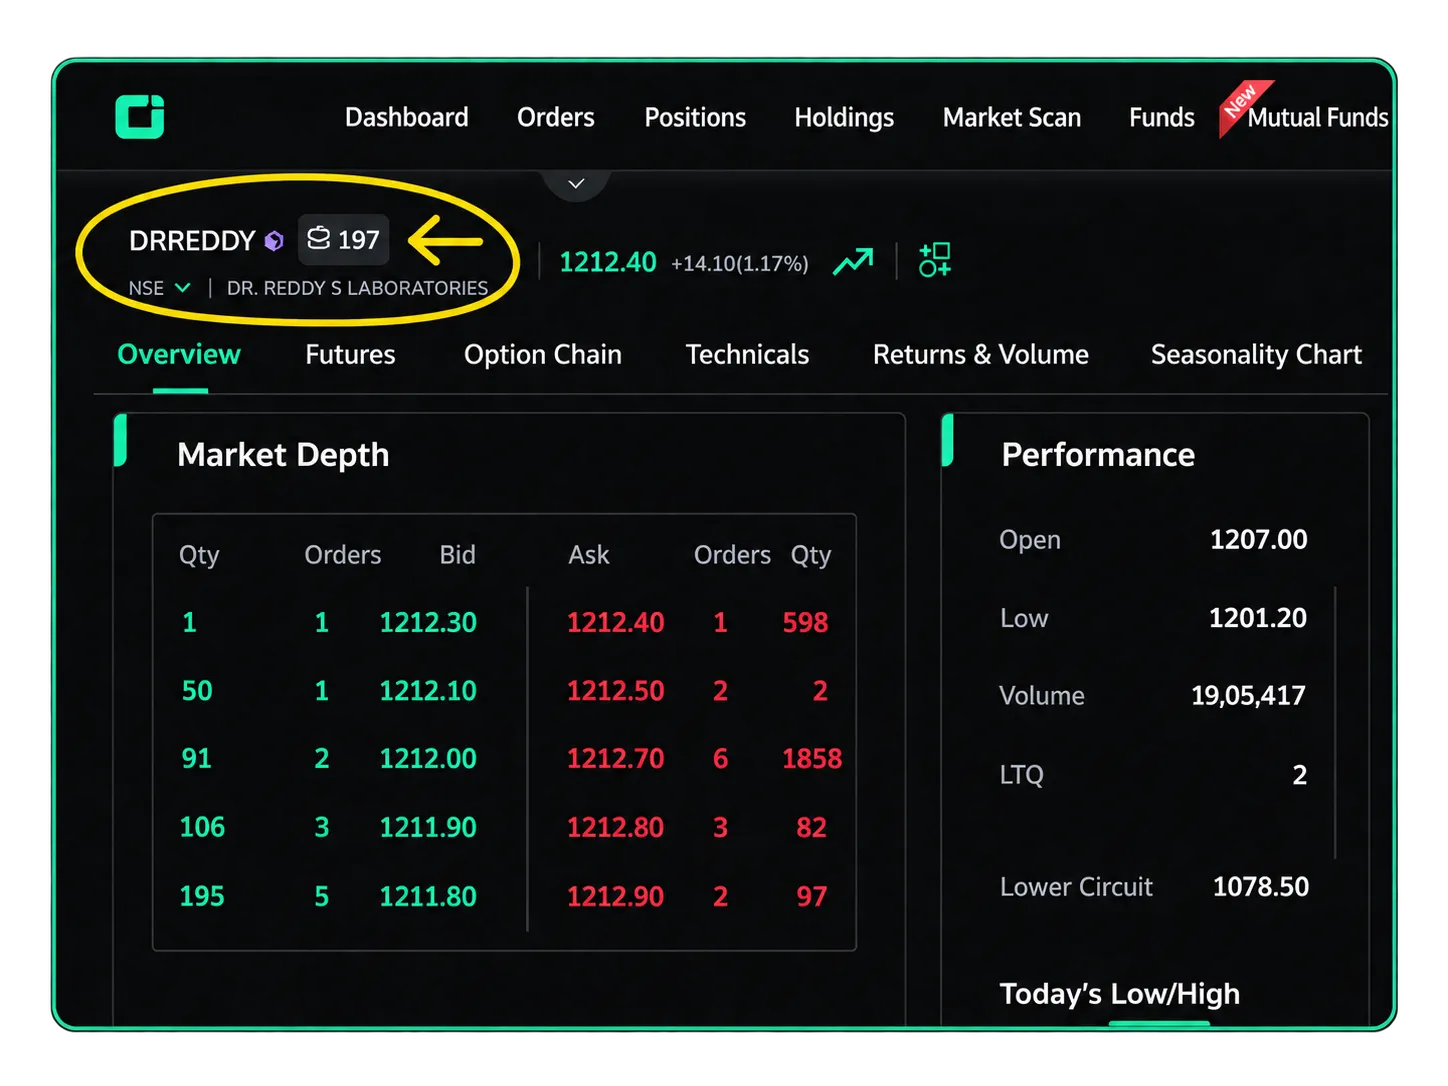
Selecting it replaces the single blended row with the complete purchase ledger for that stock: each date, quantity, price, and the current P&L for that specific lot.
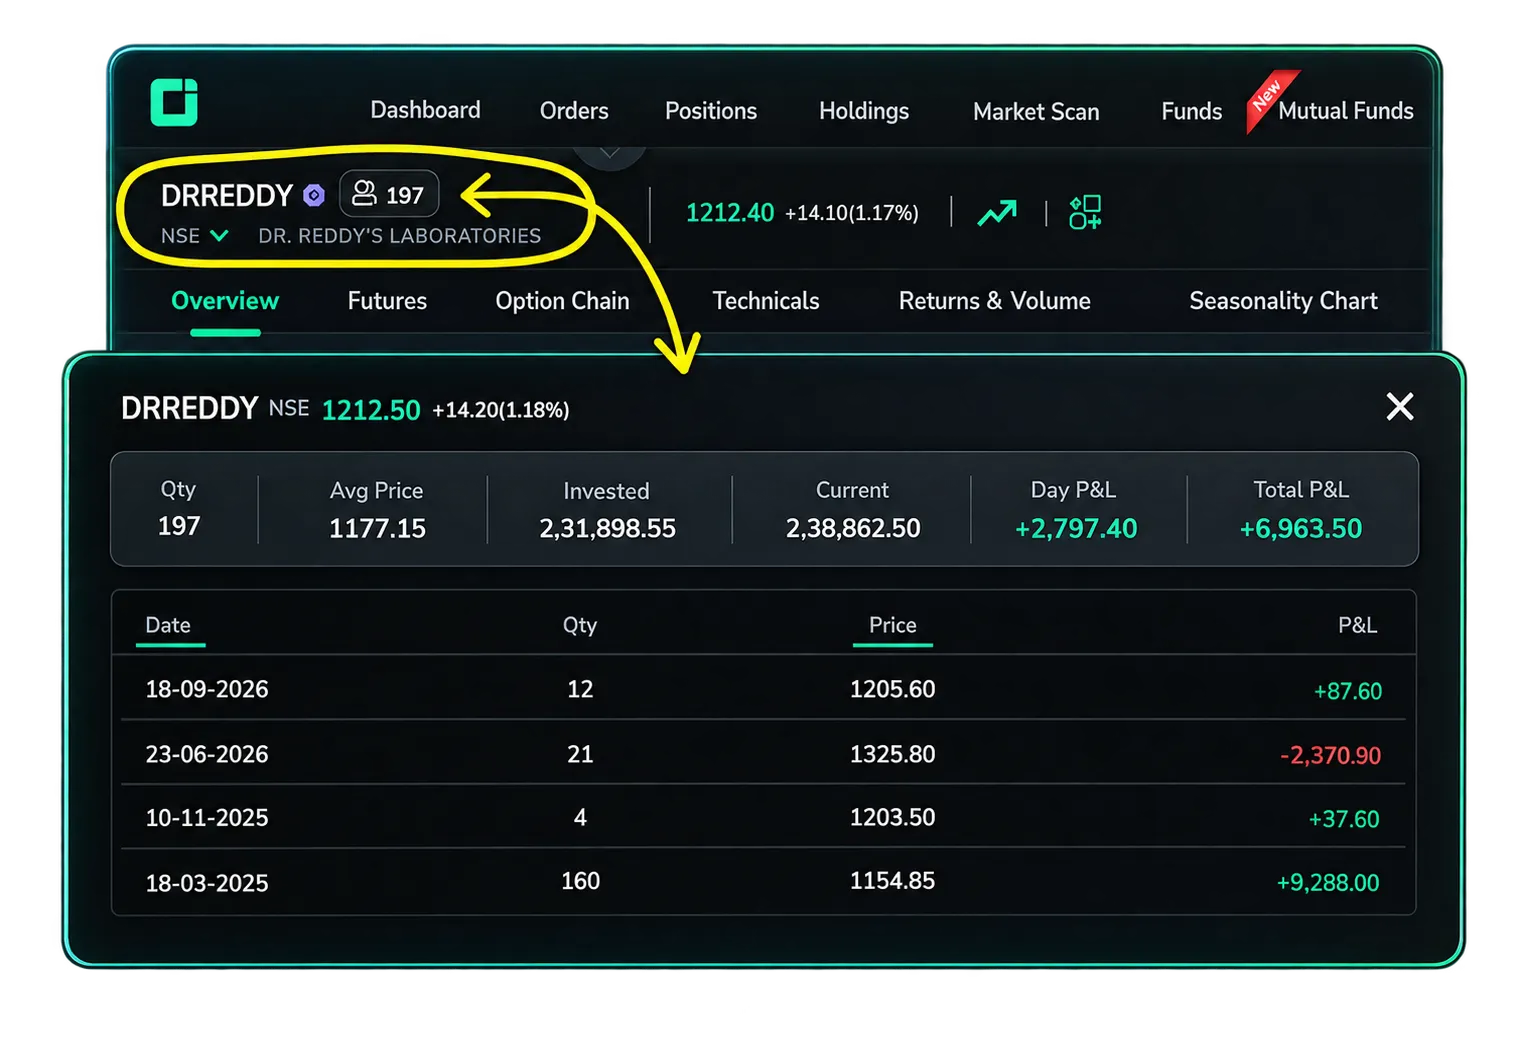
In the DRREDDY example, this converts "197 shares, net profitable" into a more precise picture: three lots are performing well, and one lot from June warrants closer review.
A practical approach to using this feature
Check the lot breakup for larger holdings Regularly: It shows which specific purchase is doing well and which isn't.
Before adding to a stock you already own, compare the price to your last purchase, not just the average: If it wasn't cheaper than your last buy, it's a new decision, not averaging down.
When planning to sell, check each lot's purchase date individually rather than going by the average: In India, shares held for more than one year are taxed as long-term capital gains (lower tax), while shares held less than a year are taxed as short-term (higher tax).
Disclaimer: The information provided in our blogs is for informational purposes only and should not be construed as financial, investment, or trading advice. Trading and investing in the securities market carries risk. Always conduct your own research and consult with a qualified financial advisor before making any investment decisions. Past performance is not indicative of future results. Copyrighted and original content for your trading and investing needs.
© 2026 — Tradejini. All Rights Reserved.

%252FCubePlus_Shield_Part%25203%2520Blog%2520Thumbnail.webp%3Falt%3Dmedia%26token%3Da5581624-5761-476f-8451-40c157b54840&w=3840&q=75)
%252FShield%2520on%2520Cubeplus%2520part2.webp%3Falt%3Dmedia%26token%3D252a5b48-a580-4e8d-b939-c82d4696eaef&w=3840&q=75)