


Mastering the MACD Indicator: A User-Friendly Guide
The MACD (Moving Average Convergence Divergence) indicator is one of the most popular tools in the trading world. Think of it as your fitness tracker for the market, giving you insights into momentum and trends. Let’s break it down:
Key Components:
- Fast and Slow Moving Averages:
- The fast-moving average represents short-term activity, similar to tracking your daily steps.
- The slow-moving average gives the bigger picture, like a monthly fitness report.
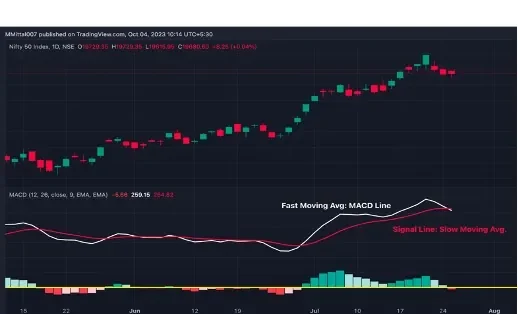
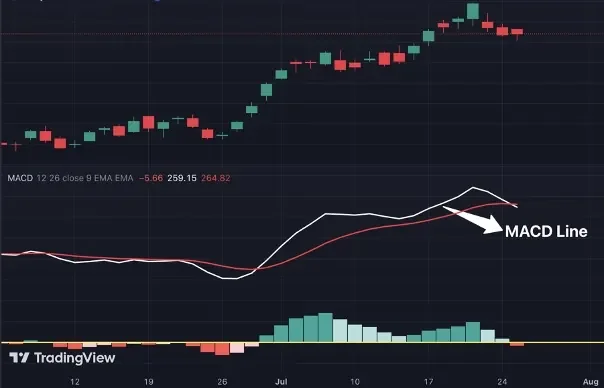
- MACD Line:
- This is the difference between the fast and slow moving averages. It shows if you’re picking up momentum or slowing down, much like your hourly steps compared to daily averages.
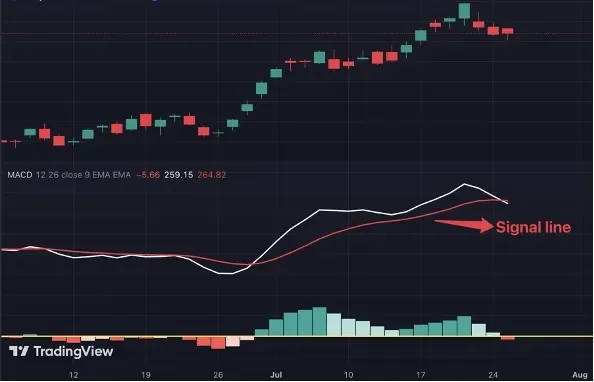
- Signal Line:
- Think of this as your goal tracker. It helps you see if you’re exceeding or falling behind your targets.
- Histogram:
- This visual tool shows the intensity of momentum. Rising bars indicate increasing strength (bullish momentum), while shrinking bars suggest weakening trends (bearish momentum).

How to Use the MACD in Trading:
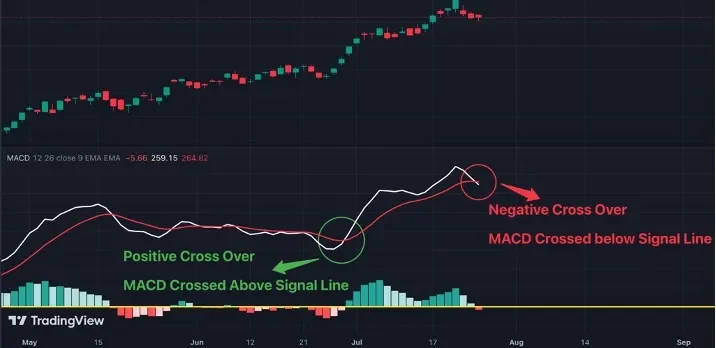
1. MACD Line and Signal Line Crossovers:
- Bullish Signal (Green Light): MACD Line crosses above the Signal Line.
- Bearish Signal (Red Light): MACD Line crosses below the Signal Line.
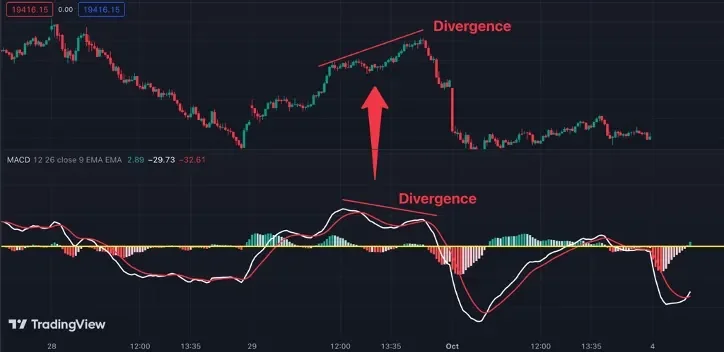
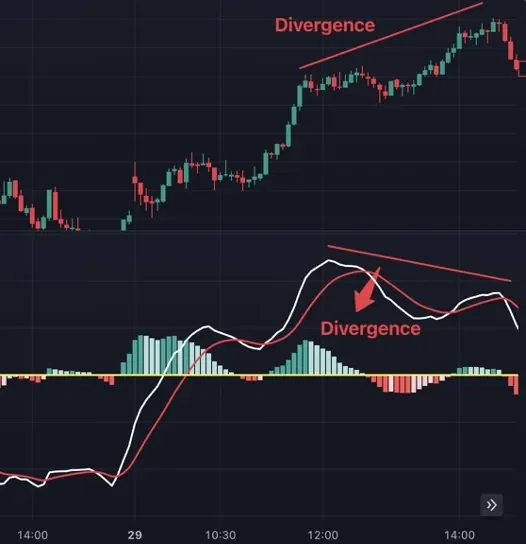
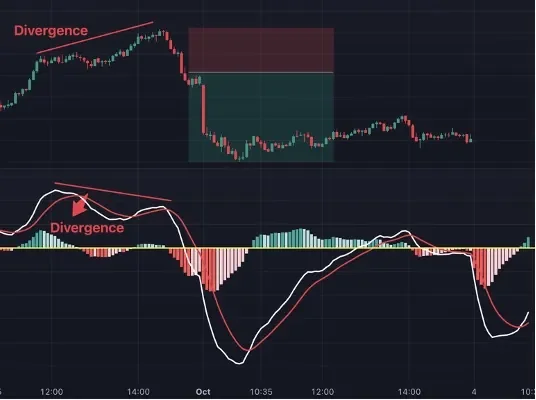
2. Divergence:
- Bullish Divergence: Price makes lower lows, but the MACD Line makes higher lows. This suggests a potential upward reversal.
- Bearish Divergence: Price makes higher highs, but the MACD Line makes lower highs, hinting at a downward reversal.
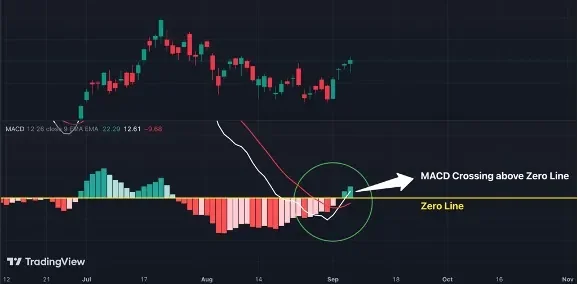
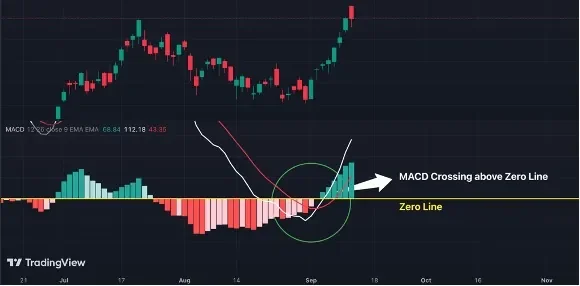
3. Trend Confirmation:
- A rising MACD Line above the zero line confirms an uptrend.
- A falling MACD Line below the zero line confirms a downtrend.
4. Entry and Exit Points:
- Entry: Buy when the MACD Line crosses above the Signal Line during an uptrend.
- Exit: Sell or tighten stop-loss orders when the MACD Line crosses below the Signal Line during a downtrend.'
5. Divergence Trading:
Think of divergence as a roadmap to possible detours. When you see it (price making higher highs, MACD Line making lower highs), it's like a signpost for a bullish reversal. The opposite suggests a bearish reversal.
Practical Tips:
- Use the Histogram: Treat it as your early warning system. Shrinking bars mean momentum is fading, signaling it’s time to tighten risk management.
- Combine with Other Indicators: Use the MACD with support/resistance levels or RSI for more robust signals.
- Stay Alert to Divergence: Divergence is a powerful sign of potential reversals. Spotting it early can help you adjust strategies effectively.
Final Thoughts:
The MACD is a versatile tool that helps traders identify trends, momentum, and potential reversal points. Whether you're new to trading or a seasoned investor, mastering the MACD can give you an edge in navigating the markets.
Happy Trading! 🎯
Also Read: Insider Trading: What It Is, Key Examples, and Why It’s Illegal