


At its core, the Double Top, Triple Top, and Catapult formations are reversal and continuation patterns unique to Point & Figure (P&F) charts, and they are central to understanding Point & Figure Double Top Triple Top setups. Unlike candlestick or bar charts that plot time, P&F charts focus entirely on price movement, offering technical analysis time-free charts that show a direct reflection of supply and demand.
Also Read: Decoding Price Battles Through Point & Figure Charts
A Double Top appears when two columns of Xs reach the same resistance level, and the next breakout above it confirms that demand has overtaken supply, which aligns with classic P&F reversal continuation patterns. A Triple Top extends this logic. Price tests the same resistance three times, showing persistent distribution until buyers finally absorb selling pressure.
A Bullish Catapult (and its bearish counterpart) acts as a confirmation pattern, a Triple Top breakout followed by a brief pullback (rising bottom) and another Double Top breakout, confirming control by buyers. This is a core structure in P&F Catapult pattern analysis and is widely used to distinguish between Bullish Bearish Catapult formation signals.
These patterns are effective because they remove time-based noise. Every new column on a P&F chart represents a decisive price move on one side. buyers or sellers. wins control. This structured, price-only representation reinforces the P&F chart reading supply demand principle and echoes the logic behind the volume principle, where conviction matters more than raw volume bars.
Component Breakdown
| Component | Pattern Type | Description | Ideal Time Duration |
|---|---|---|---|
| First Top/Bottom | Double / Triple | Price tests a level of resistance (Xs) or support (Os) twice or thrice | Develops over several columns |
| Breakout Column | Double / Triple | The confirming move beyond prior resistance or support | Should occur within a few columns |
| Rising Bottom / Lower Top | Catapult | Shows weakening supply (rising bottom) or weakening demand (lower top) | Short corrective phase |
| Confirmation Breakout | Catapult | The final move that validates the prior setup | Immediate or within 1–2 reversals |
This component sequencing highlights how P&F reversal continuation patterns evolve structurally while preserving objective breakout logic.
Visual Identification Guide
Here's exactly what to look for when scanning Point & Figure charts for these formations:
- Locate equal tops or bottoms. Identify two (Double) or three (Triple) peaks or troughs formed at the same price level.
- Check the column type. Xs denote rising prices (demand). Os denote falling prices (supply).
- Confirm reversal strength. Each column change requires a three-box reversal, filtering out minor noise and improving clarity in technical analysis time-free charts.
- Watch for breakout columns. A break above prior X-column highs or break below prior O-column lows signals a control shift.
- Assess spacing. Valid patterns form with moderate separation. Tight spacing suggests volatility, not structure.
- Volume proxy. Though P&F doesn’t plot volume, sustained wide X-columns show strong participation and reinforce the volume principle.
- Confirmation clue. In Catapults, look for a rising bottom (bullish) or lower top (bearish). they confirm fading opposition.
Smart Tip:
A strong breakout column that adds several boxes beyond prior resistance indicates conviction. Small breakouts without continuation often imply traps.
Also Read: Trading Success Starts with Time Frame Discipline
Market Psychology & Context
Understanding why these setups work means reading the behavioral tug-of-war behind the chart.
Double Tops and Bottoms: The first approach to resistance attracts sellers. The retreat resets expectations. The second attempt tests whether they remain. When price exceeds the old level, supply has thinned and demand dominates, a clean demonstration of P&F chart reading supply demand mechanics.
Triple Tops and Bottoms: Three equal tests reflect a drawn-out battle between accumulation and distribution. Repeated tests exhaust one side. When the price finally breaks through, it signals a lasting shift in control.
Catapults: The Catapult captures a moment of professional accumulation. After a strong breakout (Triple Top), short-term traders book profits, forming a mild pullback. The next Double Top breakout confirms renewed demand and gives confidence to add to the position. This represents a classic Bullish Bearish Catapult formation structure depending on trend direction.
This sequence, test. retest. confirm. maps human emotion: fear, hesitation, conviction. It works because P&F charts reveal structure, not speculation, showing the exact point where supply ends and demand begins.
Practical Trading Application (Quick Recap)
Double Top – Quick Recap
Formation: Two equal highs separated by a pullback.
Signal: Break above prior high = bullish breakout.
Bias: Demand overcomes supply.
Stop: Below prior O-column low.
Double Bottom – Quick Recap
Formation: Two equal lows separated by a rebound.
Signal: Break below prior low = bearish continuation.
Bias: Supply dominates.
Stop: Above prior X-column high.
Triple Top / Bottom – Quick Recap
Formation: Three equal highs/lows at the same level.
Signal: Breakout beyond the third test confirms reversal.
Bias: Stronger and more reliable than Double patterns.
Stop: Opposite side of base formation.
Bullish Catapult – Quick Recap
Formation: Triple Top breakout → pullback → rising bottom → new Double Top breakout.
Bias: High-probability continuation pattern.
Stop: Below rising bottom.
Bearish Catapult – Quick Recap
Formation: Triple Bottom breakdown → rebound → lower top → new Double Bottom breakdown.
Bias: Accelerated continuation of downtrend.
Stop: Above lower top.
These applications form the core of P&F Catapult pattern analysis, a refined price-only approach.
Real Chart Examples
Bullish Double Top Breakout on Laurus Labs
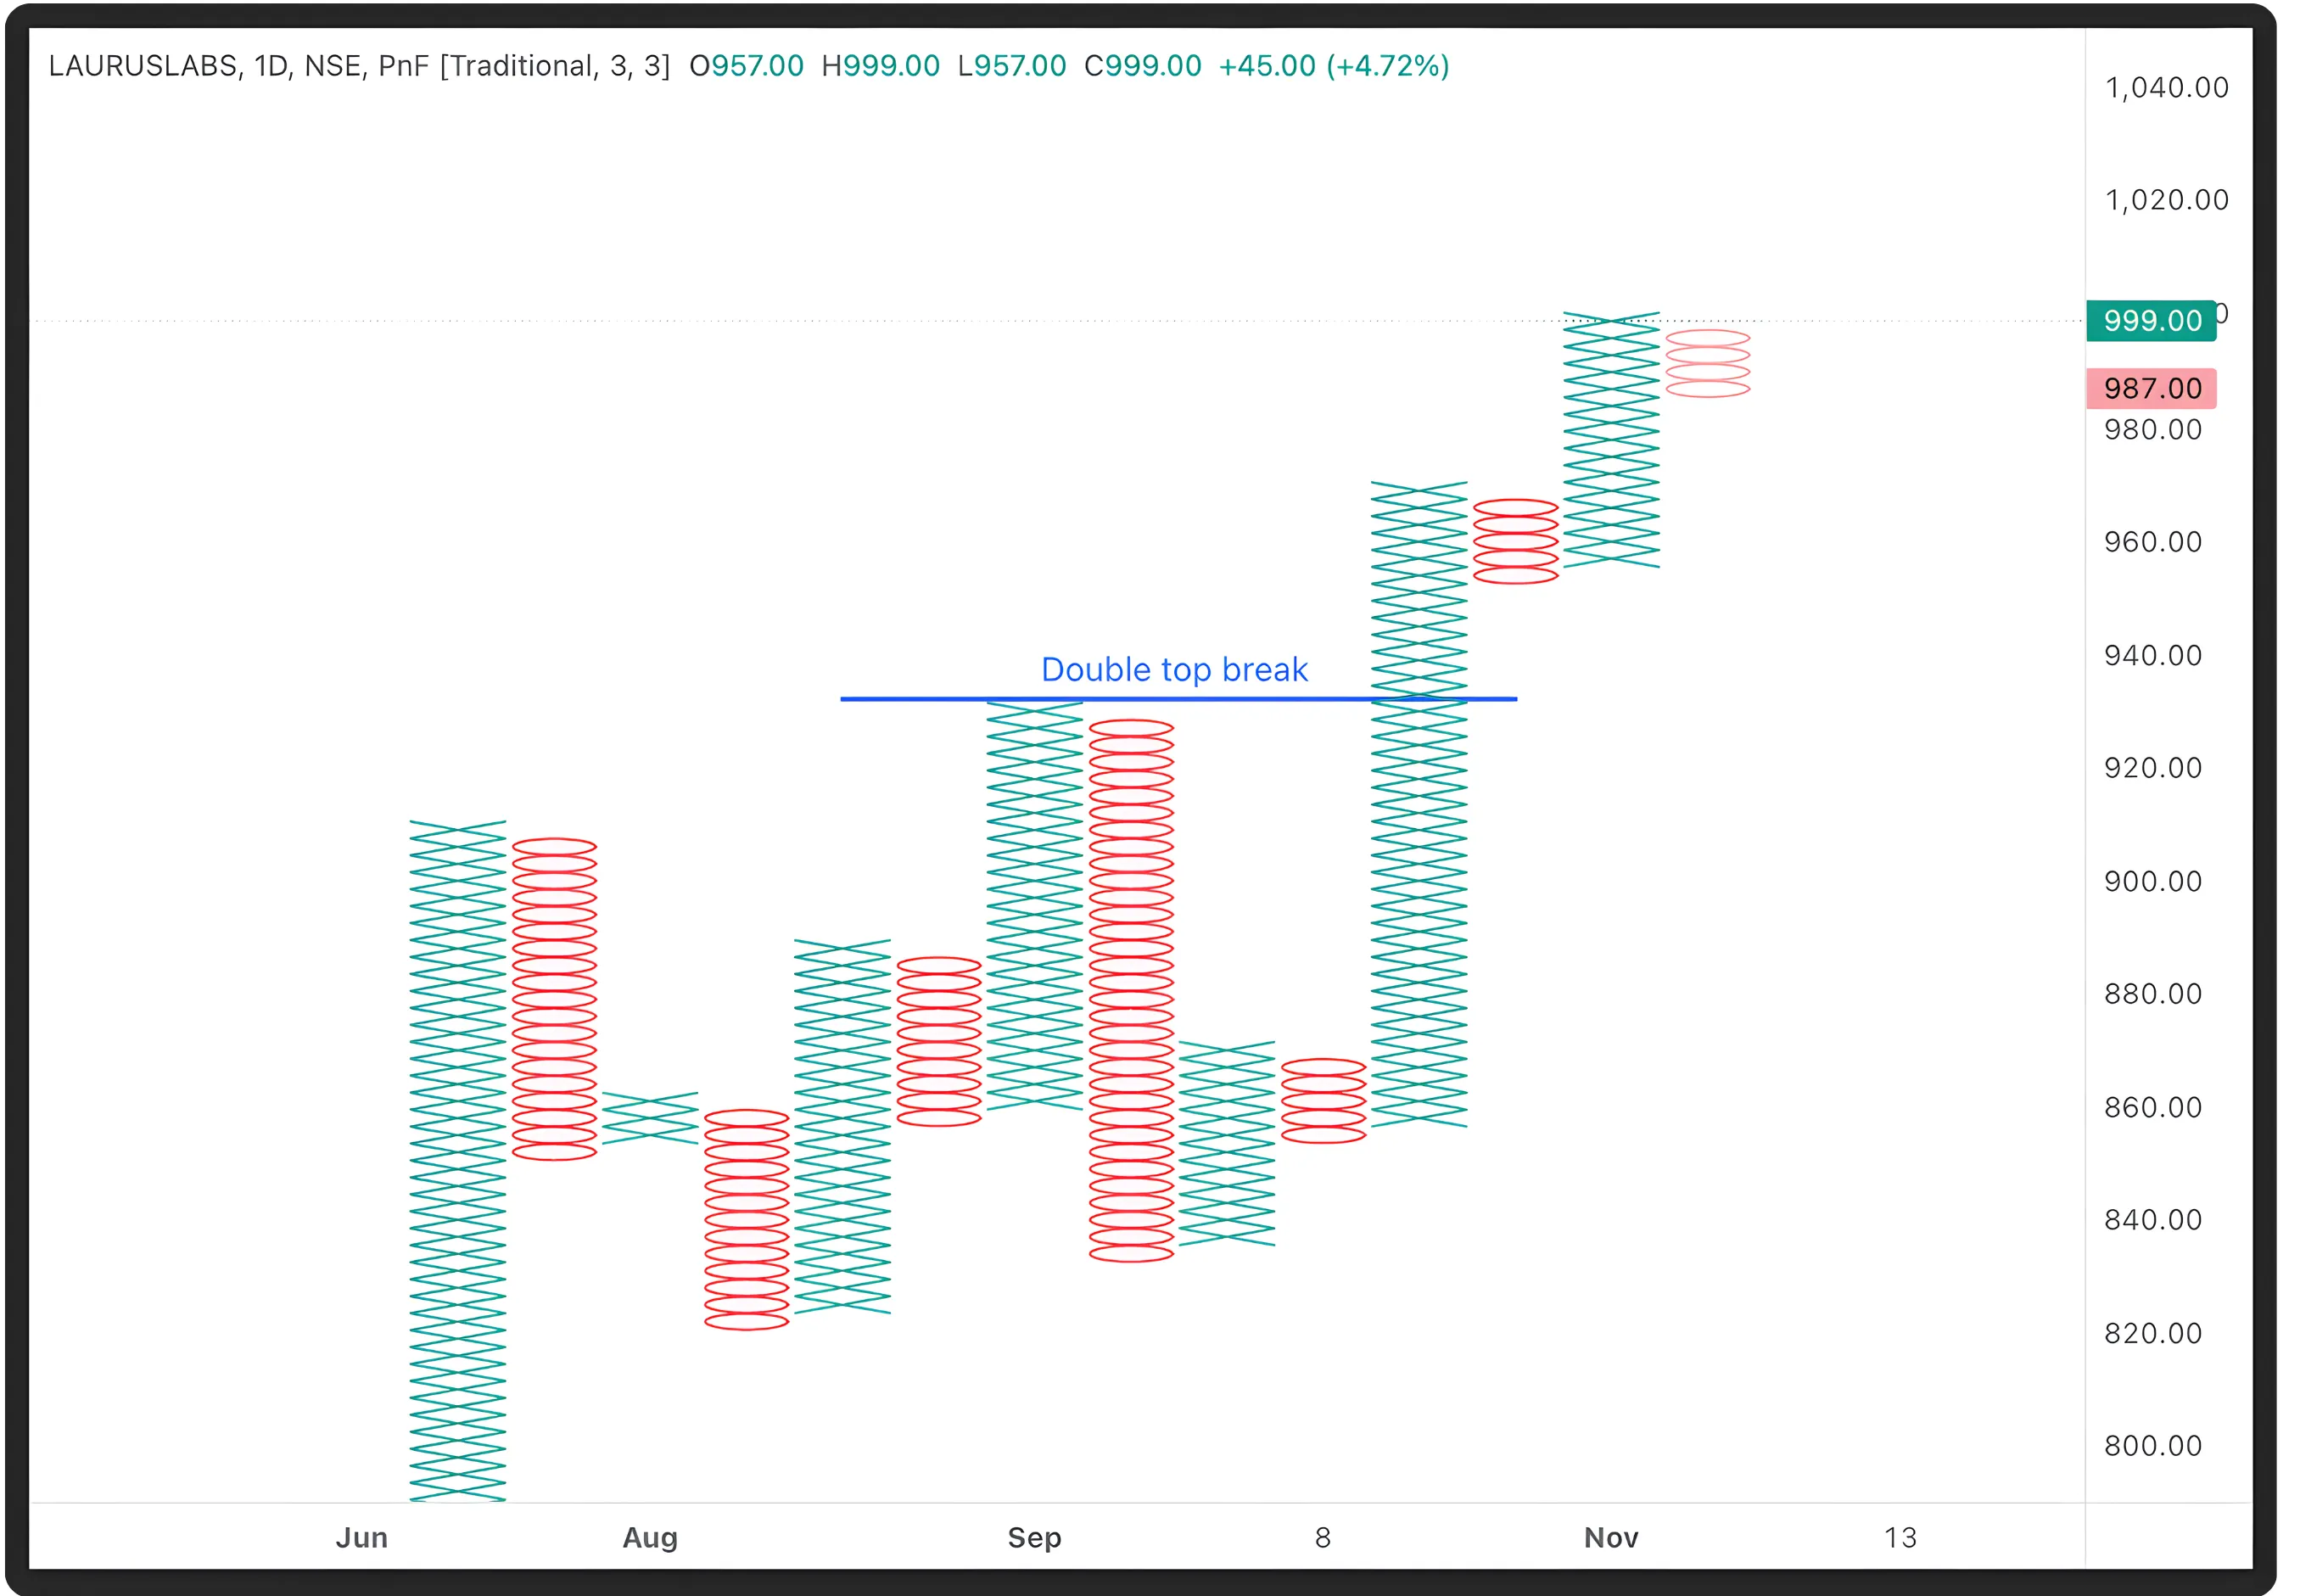
Chart Details:
Stock/Index: LAURUSLABS · NSE
Date Range: June 2025 – November 2025
Pattern Type: Double Top (Bullish)
Price at Pattern Start: ₹860 (approx)
Pattern Explanation: Price created two equal columns of Xs at around ₹920, met resistance, reversed briefly into Os, and then formed a new X-column breaking above that level, confirming a Double Top breakout on the Point & Figure chart. This aligns with classic Point & Figure Double Top Triple Top logic.
Entry: Breakout above ₹920 confirmed by follow-through into ₹940–₹960.
Stop Loss: Below prior O-column near ₹880.
Target: Base height (~₹60) projected upward → ~₹980.
Key Takeaway:
Demand decisively overtook supply, validating bullish control.
Also Read: A closer look at Laurus Labs beyond the market noise
Bullish Triple Top Breakout on HDFCBANK
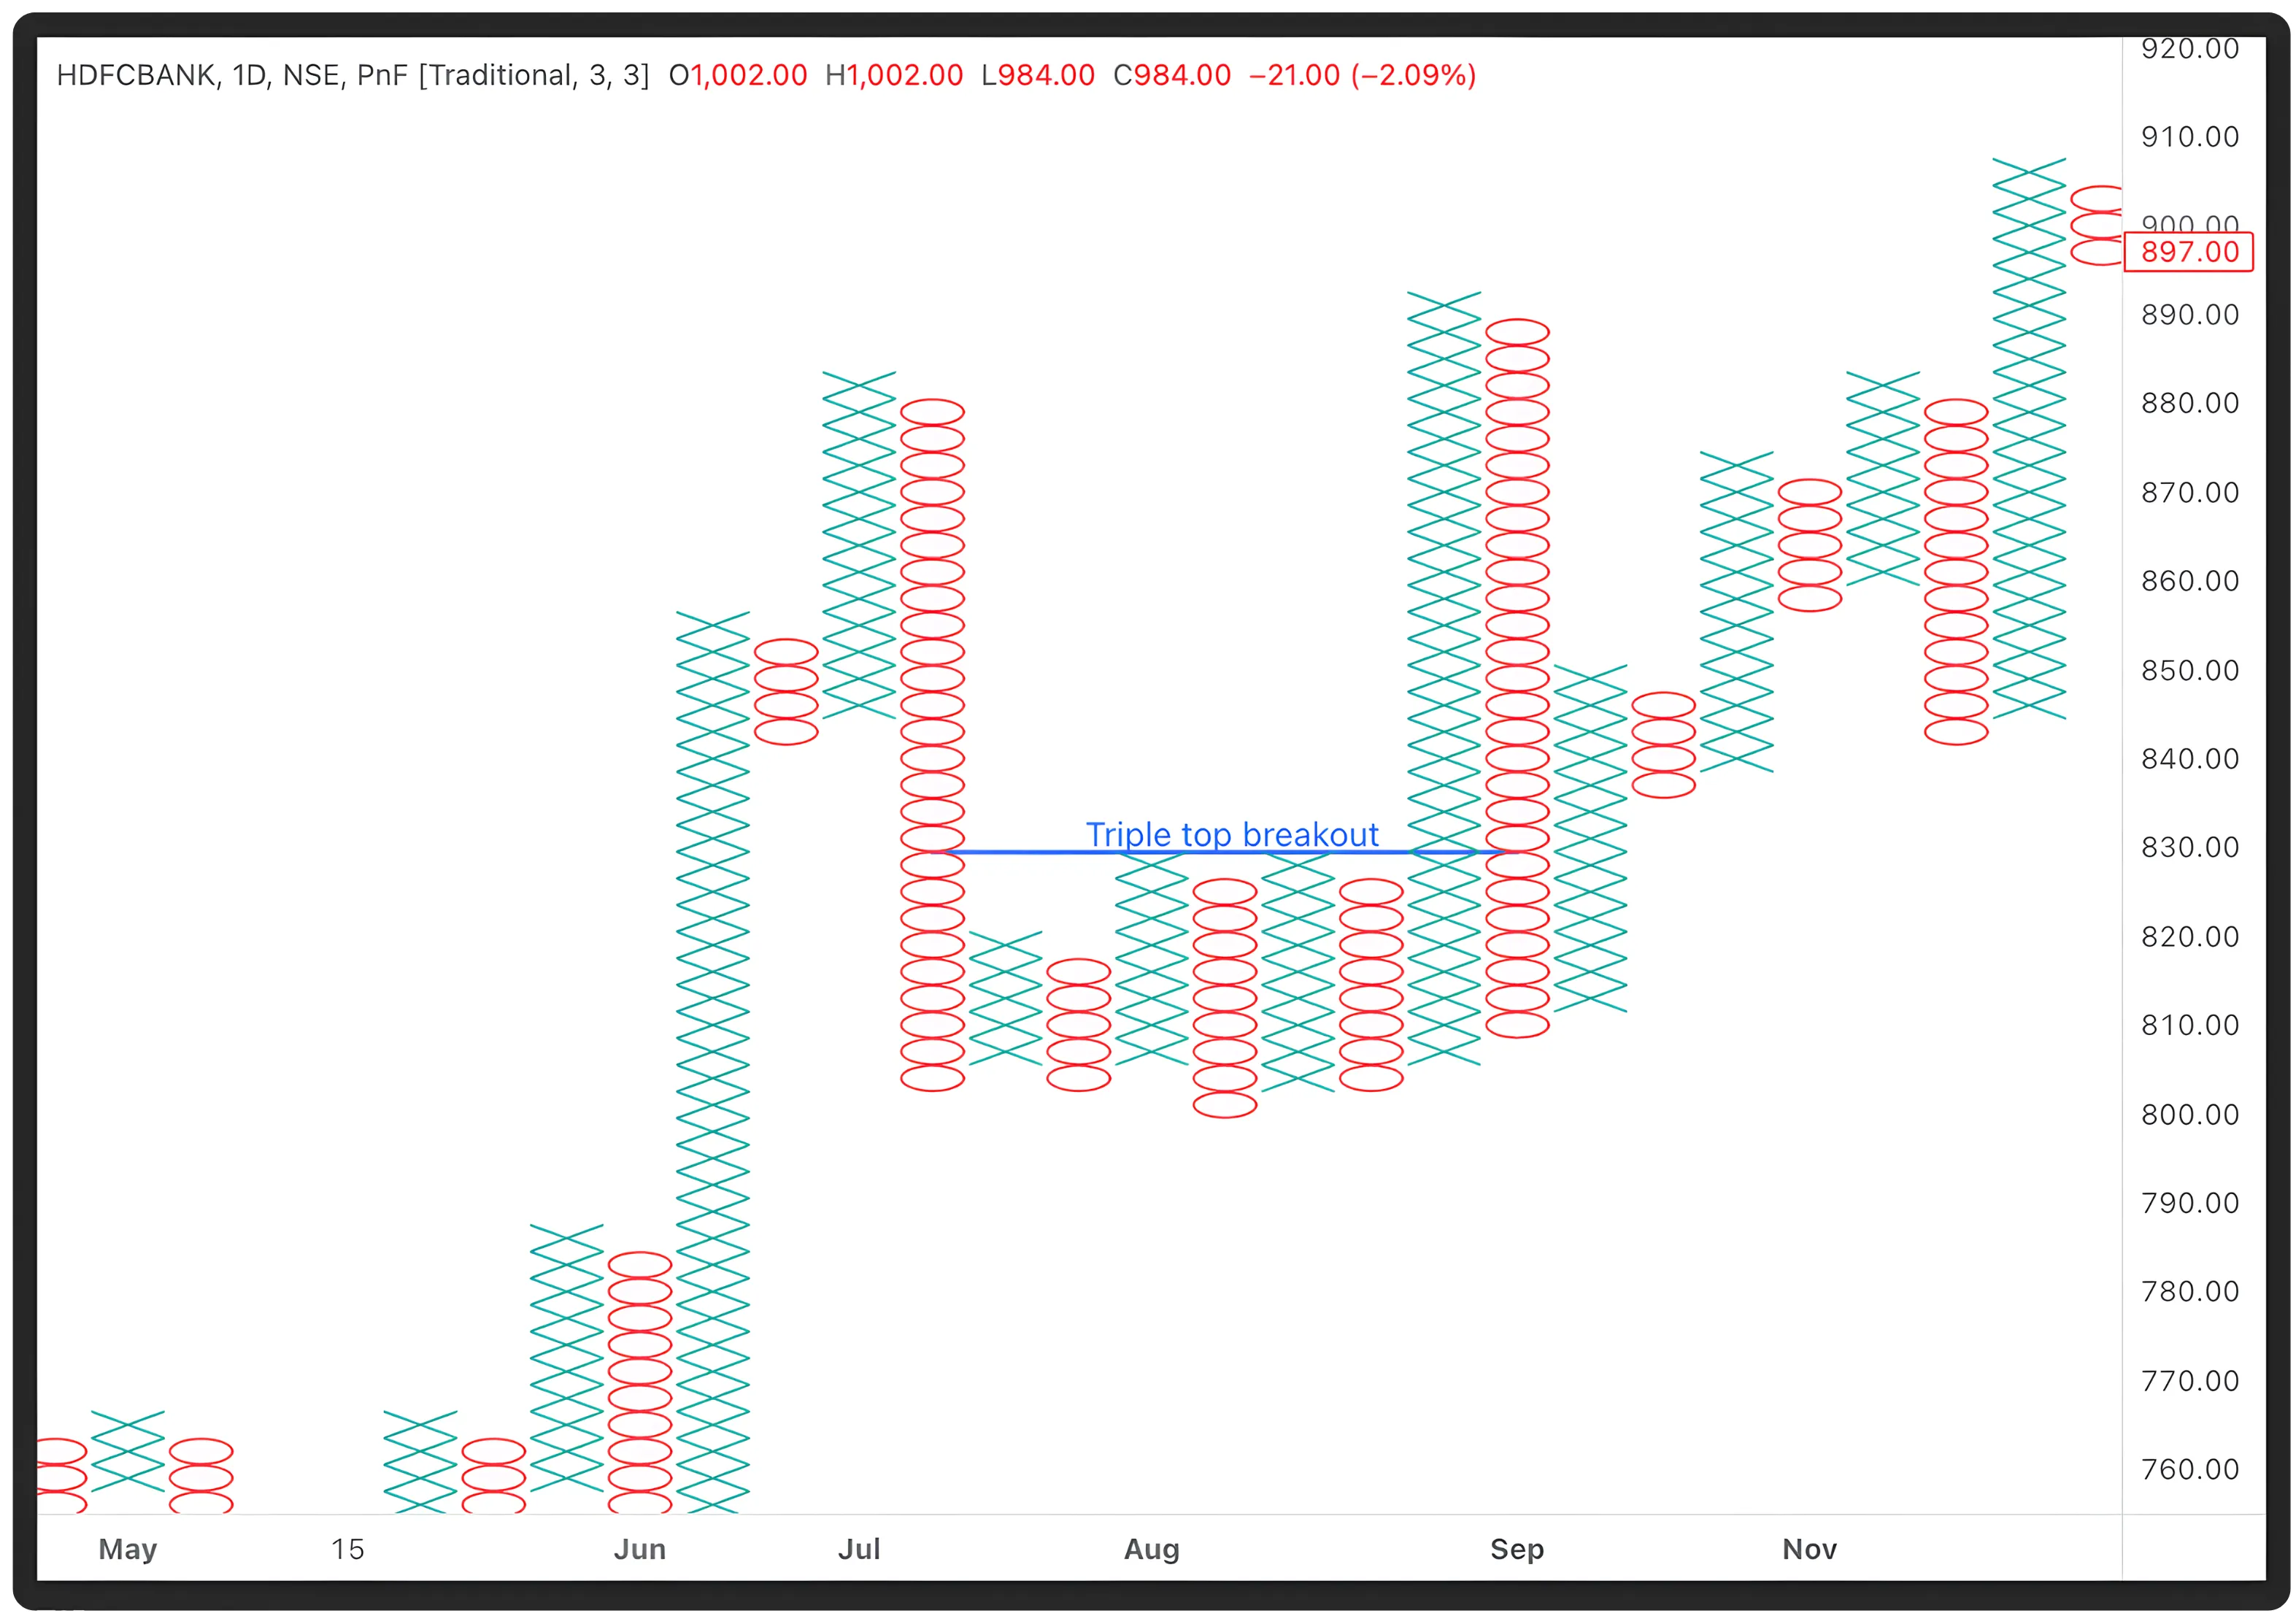
Chart Details:
Stock/Index: HDFCBANK · NSE
Date Range: May 2025 – November 2025
Pattern Type: Bullish Triple Top
Price at Pattern Start: ₹800 (approx)
Pattern Explanation:
The stock formed three equal X-columns at the ₹830 resistance level, showing repeated selling pressure. Demand re-entered after each pullback. On the third test, a strong X-column broke decisively above ₹830, confirming buyers had absorbed all available supply.
Entry: Above ₹830 with strong follow-through.
Stop Loss: Below prior O-column near ₹800.
Target: Base height (~₹30) projected upward → ~₹860.
Key Takeaway:
The third breakout showed full absorption of supply, a textbook Triple Top consistent with P&F reversal continuation patterns.
Bearish Catapult on Infosys
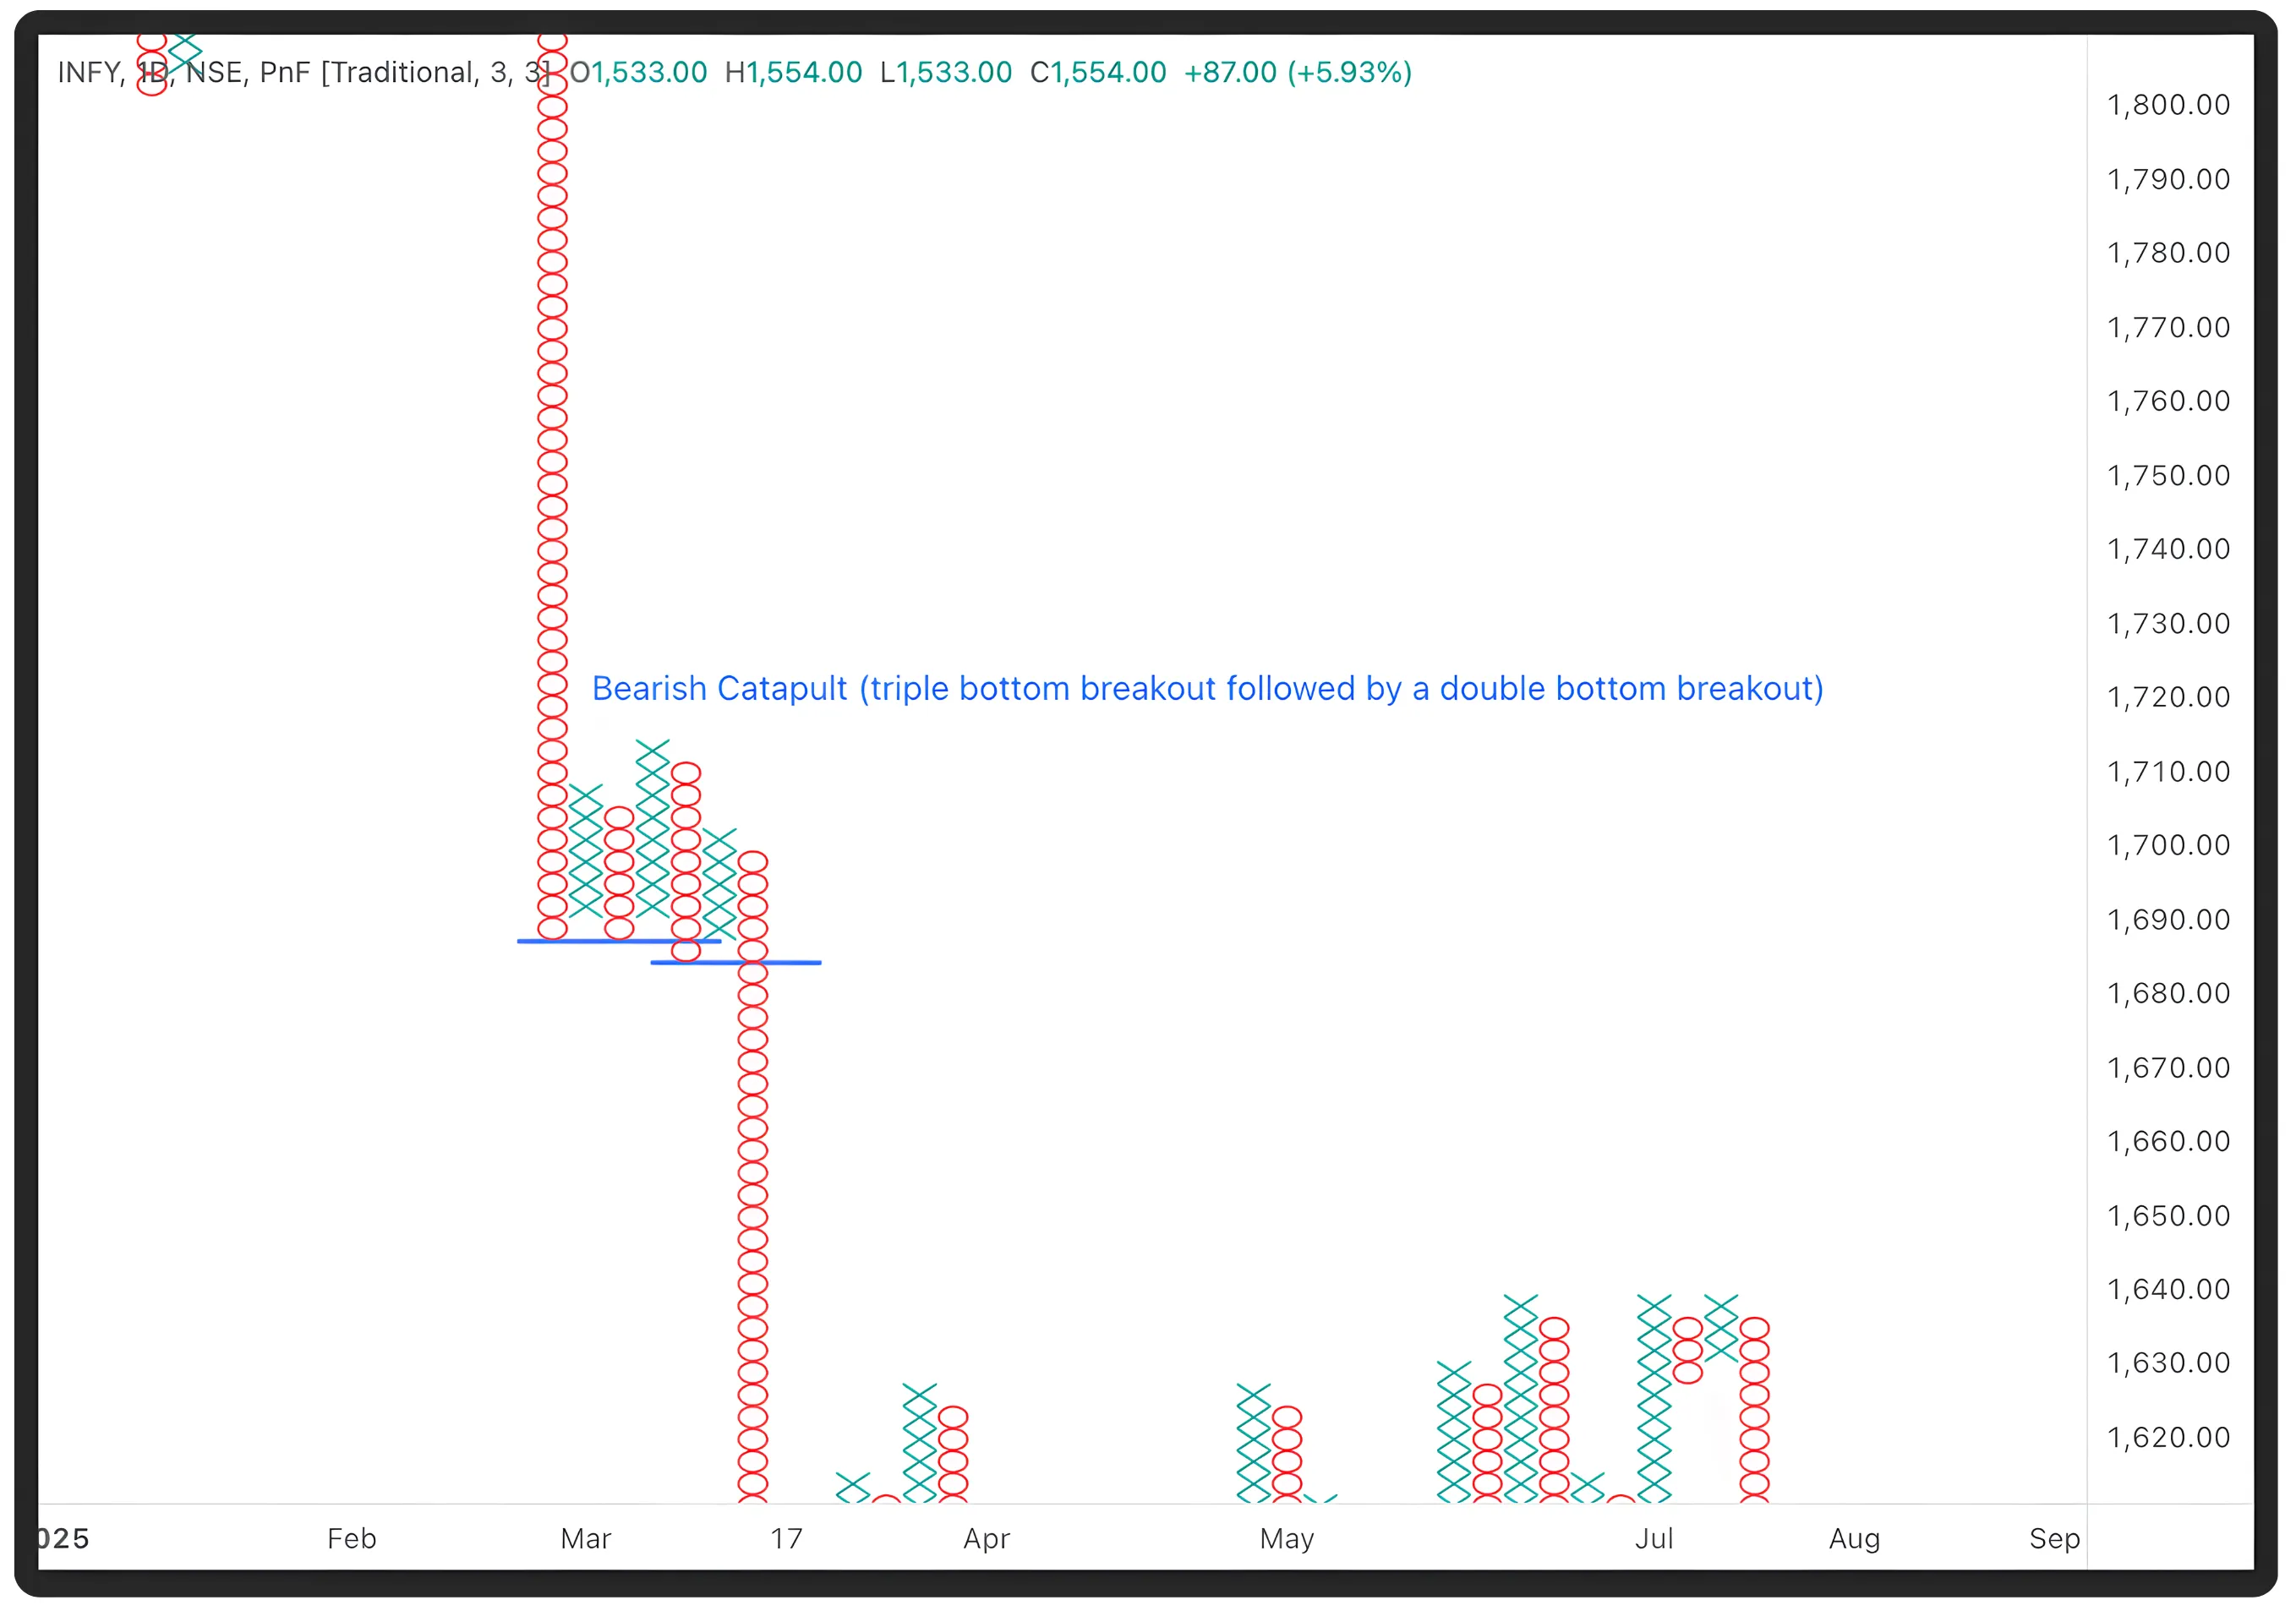
Chart Details:
Stock/Index: INFY · NSE
Date Range: February 2025 – July 2025
Pattern Type: Bearish Catapult
Price at Pattern Start: ₹1,740 (approx)
Pattern Explanation:
A Triple Bottom breakdown occurred near ₹1,710, indicating seller control. After a mild rebound forming a lower top near ₹1,730, the subsequent Double Bottom breakdown below ₹1,710 confirmed renewed selling pressure, validating the Bearish Catapult structure.
Entry: Breakdown below ₹1,710.
Stop Loss: Above lower top near ₹1,730.
Target: Base height (~₹60) projected downward → ~₹1,650.
Key Takeaway:
Supply decisively reasserted control. A clean demonstration of the Bearish Catapult formation.
Strategic Summary
The Double Top, Triple Top, and Catapult formations form the structural language of Point & Figure charting, offering a time-free lens into the market’s internal struggle. Their strength lies in clarity and logic: every column of Xs or Os represents a deliberate market shift. When the chart breaks prior resistance or support, it is not noise. It is a signal that control has changed hands.
Used correctly, these patterns provide objective entry, stop, and target levels aligned with market psychology. They are best applied in trending markets, confirmed by sector breadth and relative strength.
The Catapult pattern adds conviction. It transforms a breakout into a confirmed trend, suitable for traders adding to winning positions.
While no formation guarantees success, P&F patterns excel at revealing when supply and demand have flipped decisively, reinforcing the foundational P&F chart reading supply demand model.
For retail traders, mastering these setups creates an edge: clear chart reading, disciplined execution, and structured exits across these time-free charts.
Technical Specifications
| Specification | Guideline | Details |
|---|---|---|
| Chart Type | Point & Figure | Xs = demand, Os = supply |
| Box Size | 1–2% of price | Adjust to volatility of asset |
| Reversal Size | 3 boxes | Filters out minor reversals |
| Ideal Timeframe | Daily charts | Captures swing-level structure |
| Pattern Validity | Within 4–6 columns | Longer formations lose impact |
| Volume Confirmation | Optional | Check trend strength via breadth |
| Best Market Context | Trending | Avoid sideways congestion |
These specifications help structure precise P&F Catapult pattern analysis and improve consistency in execution.
Open your account on CubePlus today to start trading using Points and Figures charts.
Disclaimer: The information provided in our blogs is for informational purposes only and should not be construed as financial, investment, or trading advice. Trading and investing in the securities market carries risk. Always conduct your own research and consult with a qualified financial advisor before making any investment decisions. Past performance is not indicative of future results. Copyrighted and original content for your trading and investing needs.
© 2025 — Tradejini. All Rights Reserved.


