


The primary thing investors look for on a stock page is a clear snapshot of the company’s financial health. CubePlus makes that easy by putting everything that matters (revenue trends, profitability, balance sheet strength, cash flows, ratios, and ownership) inside a single Financials tab that’s built to be read in minutes, not hunted for.
Once you search a stock and open its page, the Financials section lays out the entire business story in a simple flow. You start with high-level charts, move into detailed statements, and end with ratios and shareholding patterns. Every part feels connected, and every number has context.
Step 1: Search the stock and open the Financials tab
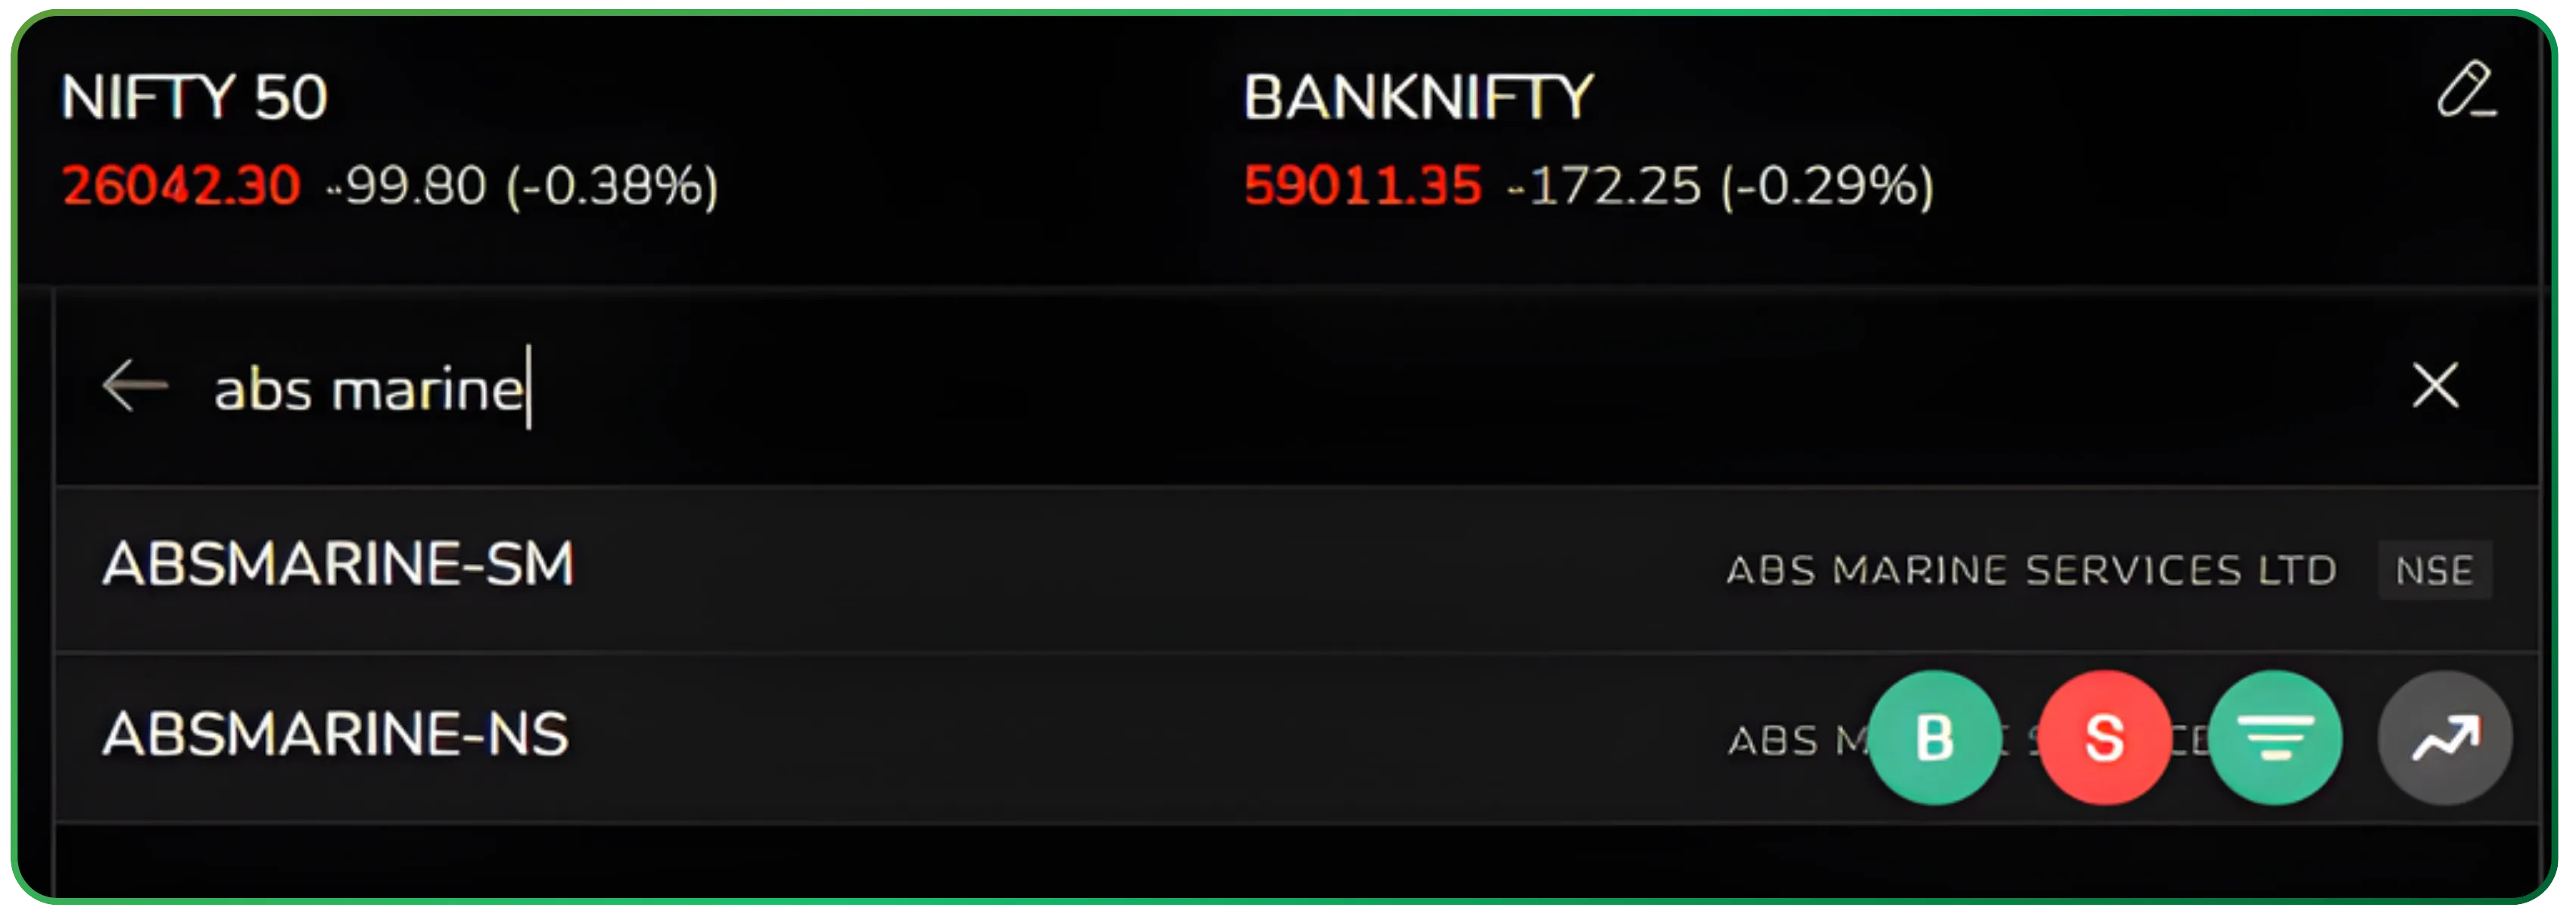
Start by typing the company name or symbol in the search bar. Pick the stock from the dropdown and open its page and add to the watchlist .Then click on the stock name, which opens a new window.
A clean and organised financial dashboard
At the top, you’ll see the main navigation tabs—Overview, Technicals, Returns, Seasonality, and Financials. Head to the Financials tab. This is where you get the complete breakdown of the company’s performance, laid out in a structured, investor-friendly format.
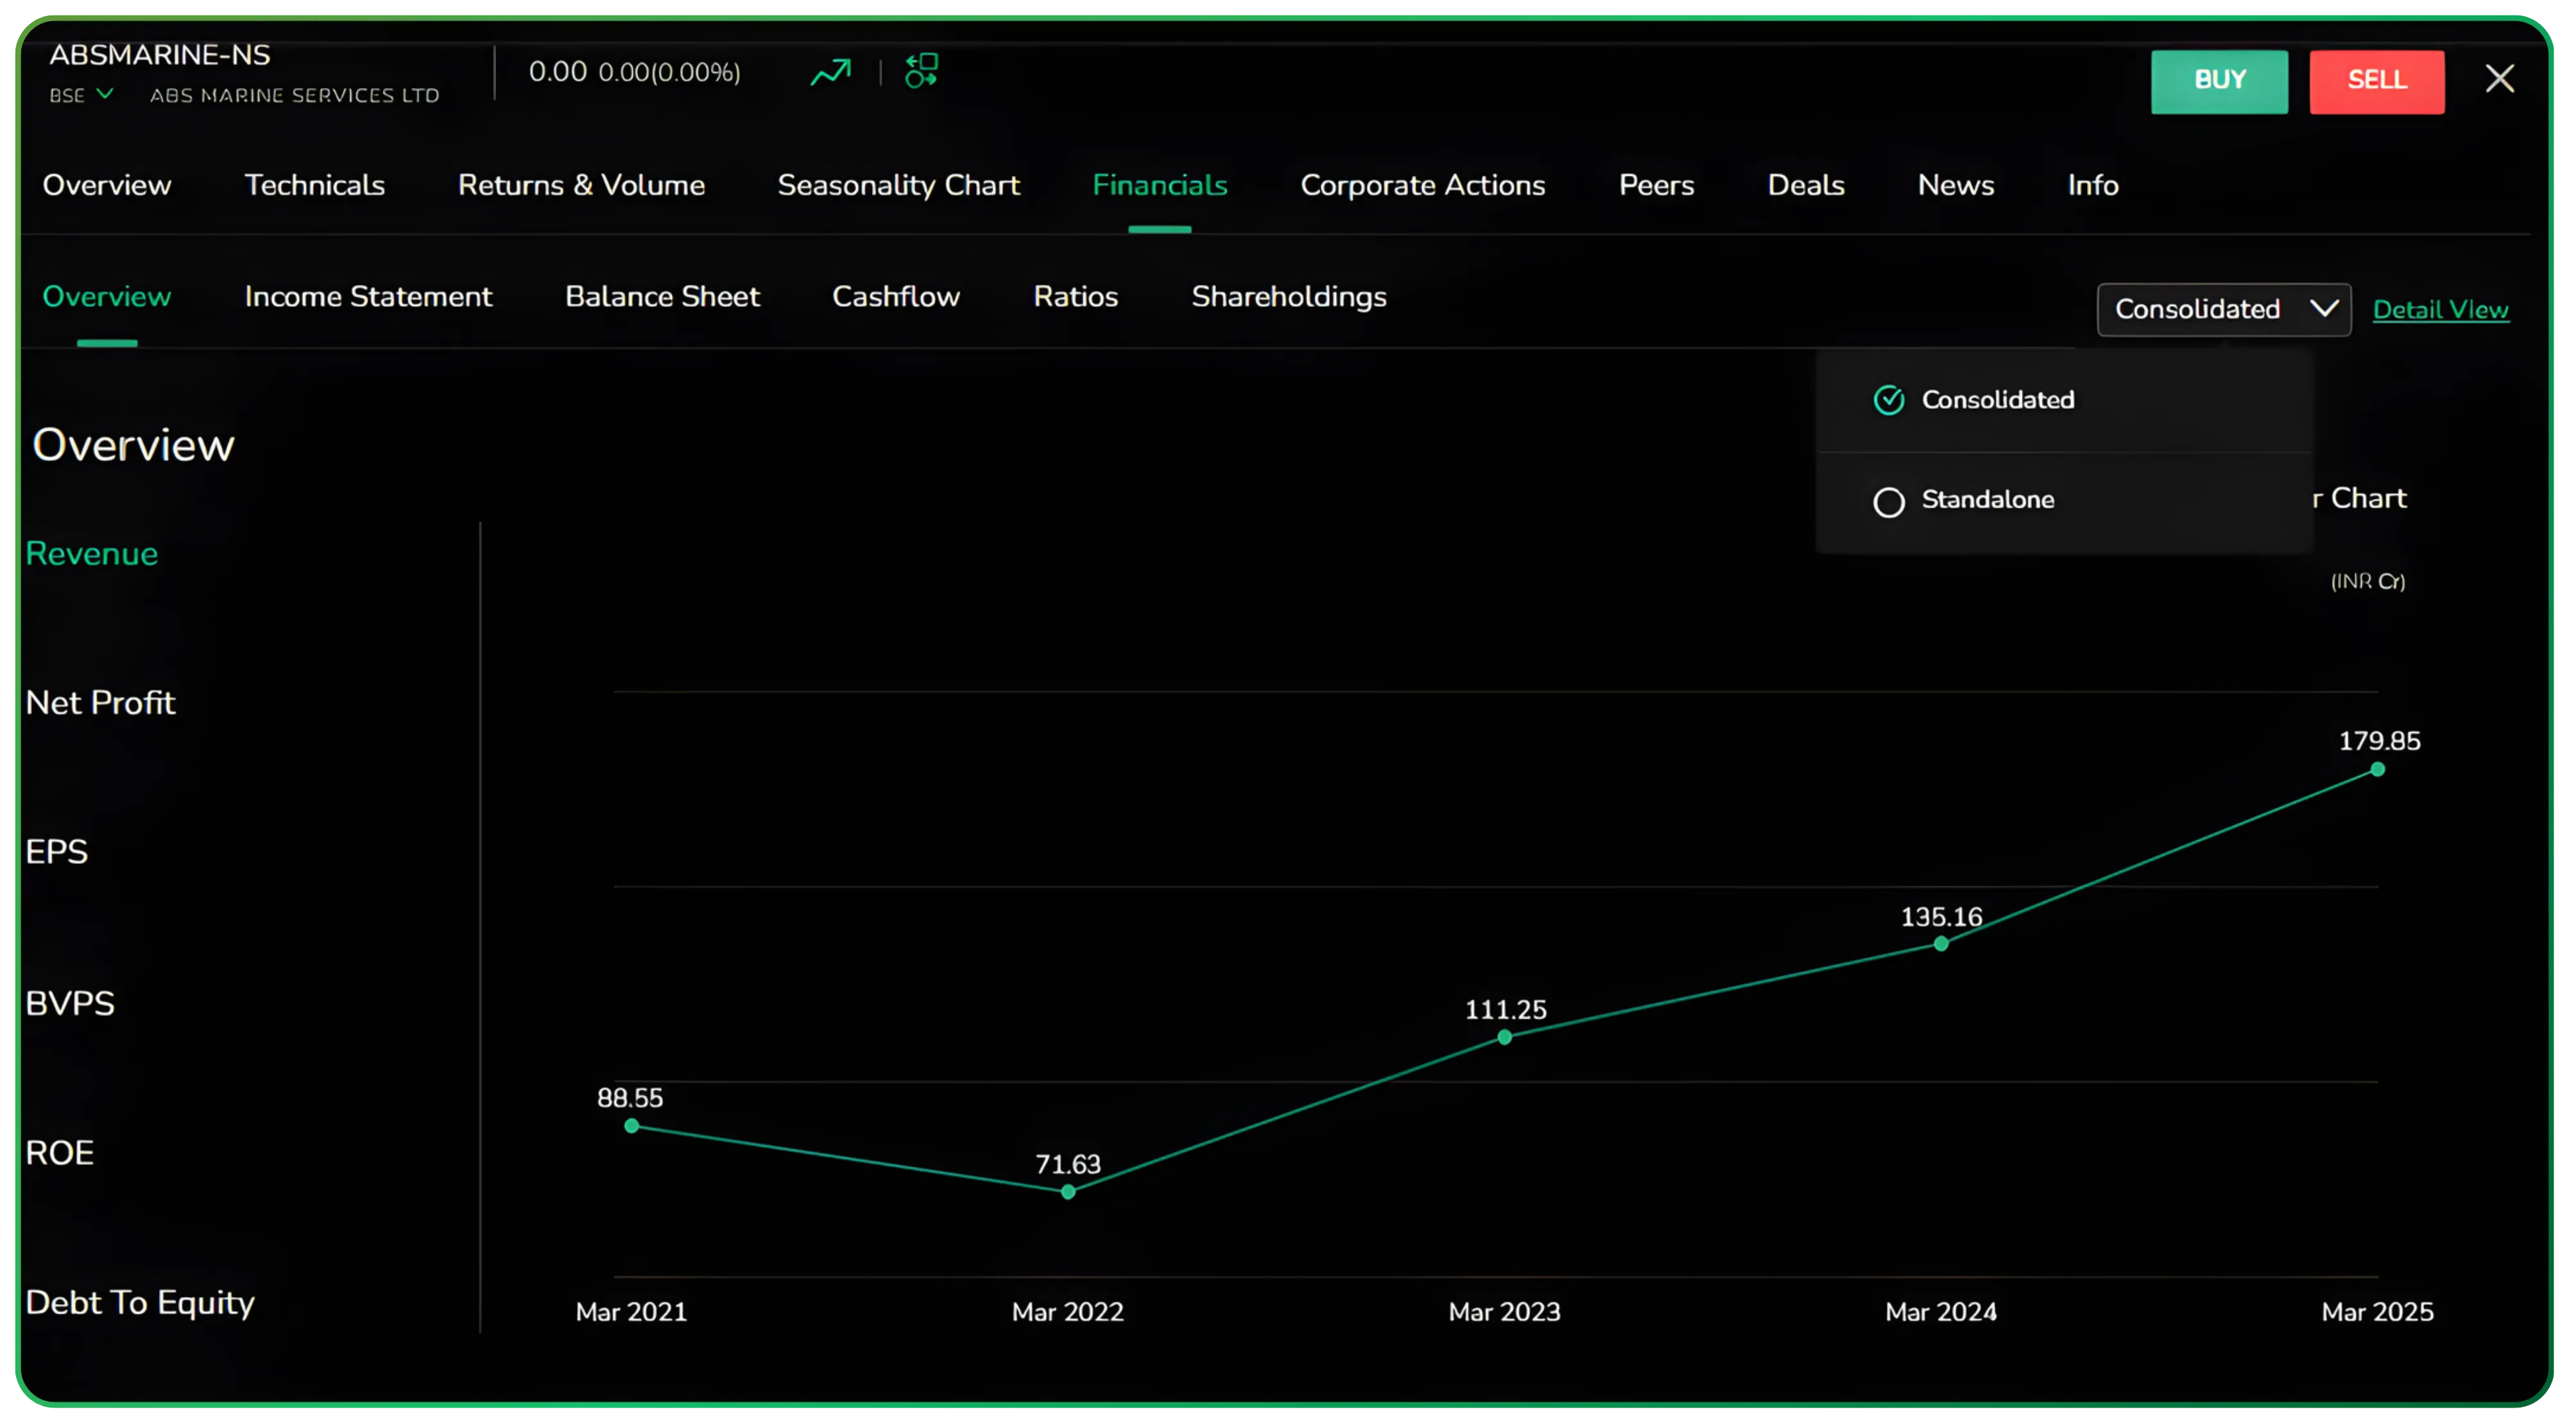
The Financials tab groups everything into clear sections: Overview, Income Statement, Balance Sheet, Cashflow, Ratios, and Shareholdings. Each one opens instantly, so you can move through the company’s fundamentals without any friction.
You can switch between consolidated and standalone results with a single toggle, and choose whether you want to see yearly, half-yearly, or quarterly data. The entire layout is built to help you read numbers quickly without digging through PDFs or juggling multiple screens.
This layout gives you comprehensive data drawn directly from a company’s financial statements, helping you move through company analysis without any extra effort
Financial overview: trends before tables
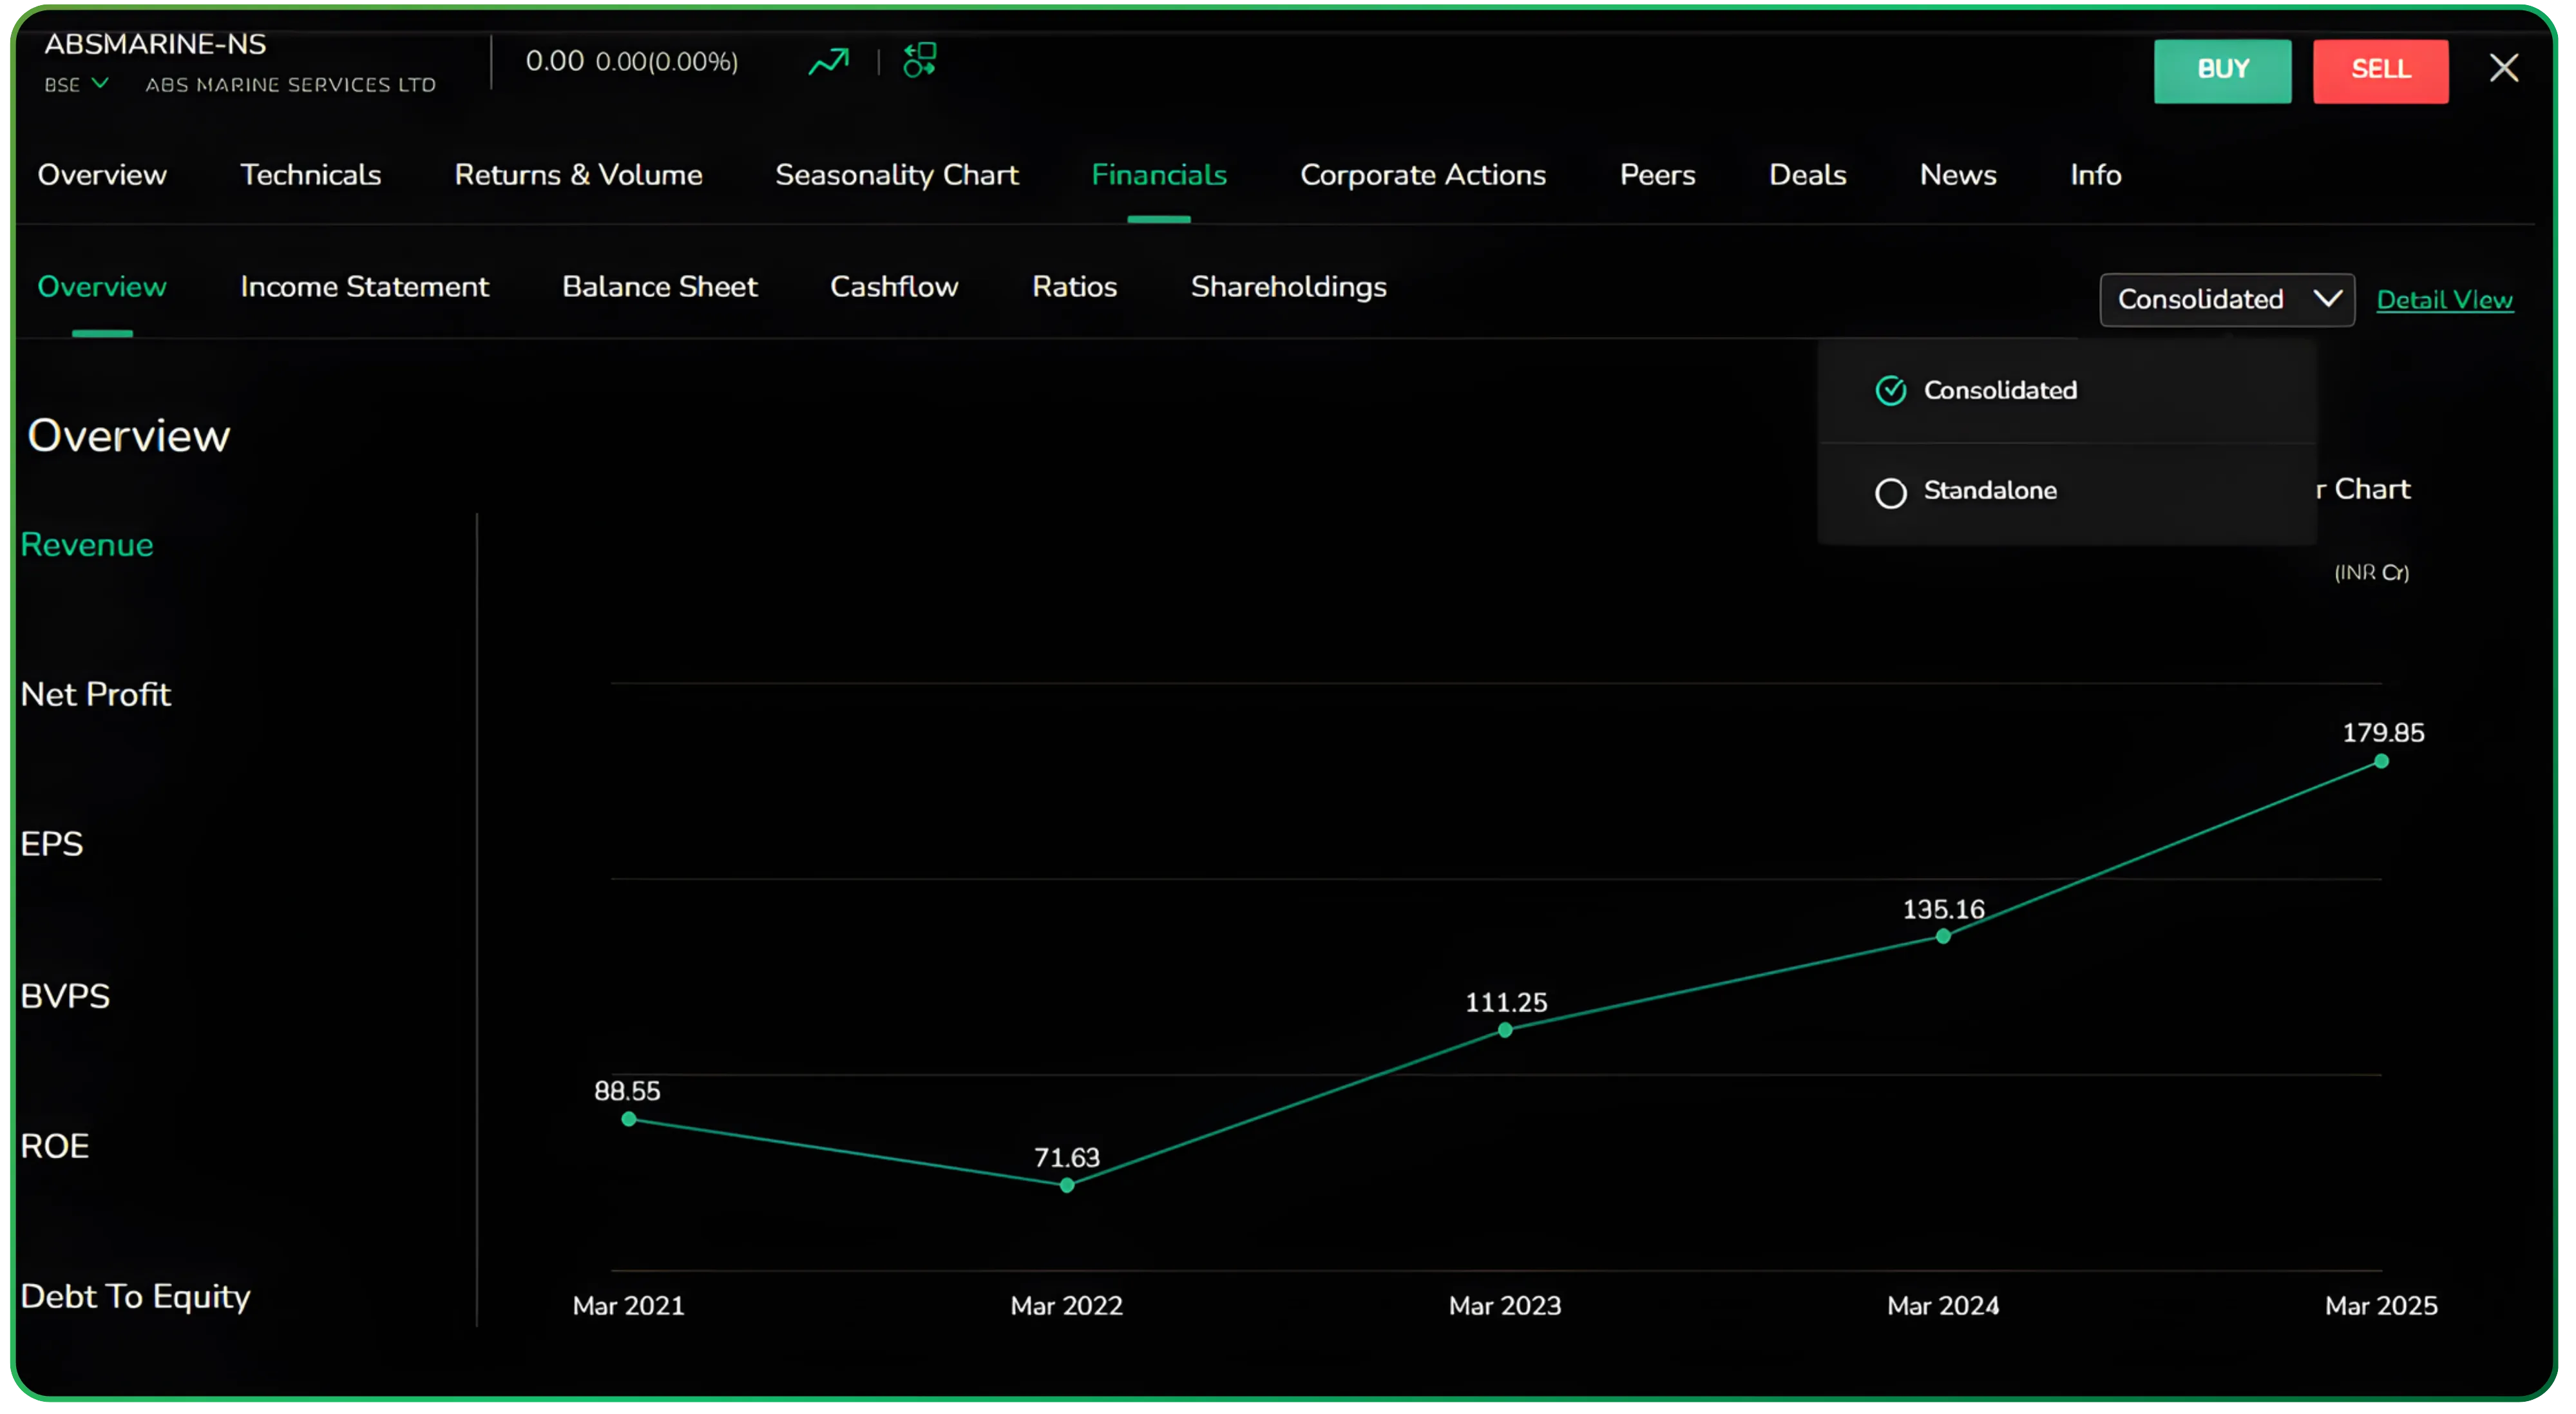
The Overview section presents the core trend charts upfront: Revenue, Net Profit, EPS, Book Value, ROE, and Debt to Equity. Instead of diving straight into rows of numbers, you first see how the business is moving over time.
These charts help you grasp the company’s direction at a glance—whether it’s growing steadily, facing pressure, or going through sharp swings. It sets the context before you get into the detailed statements and makes it easier to understand what kind of business you’re dealing with.
These trend visuals serve as a quick historical data snapshot before you dive deeper into the financials.
Fundamental analysis concentrates on data from financial records, economic reports, company assets, and market share.
Income statement: growth, margins, and operating leverage
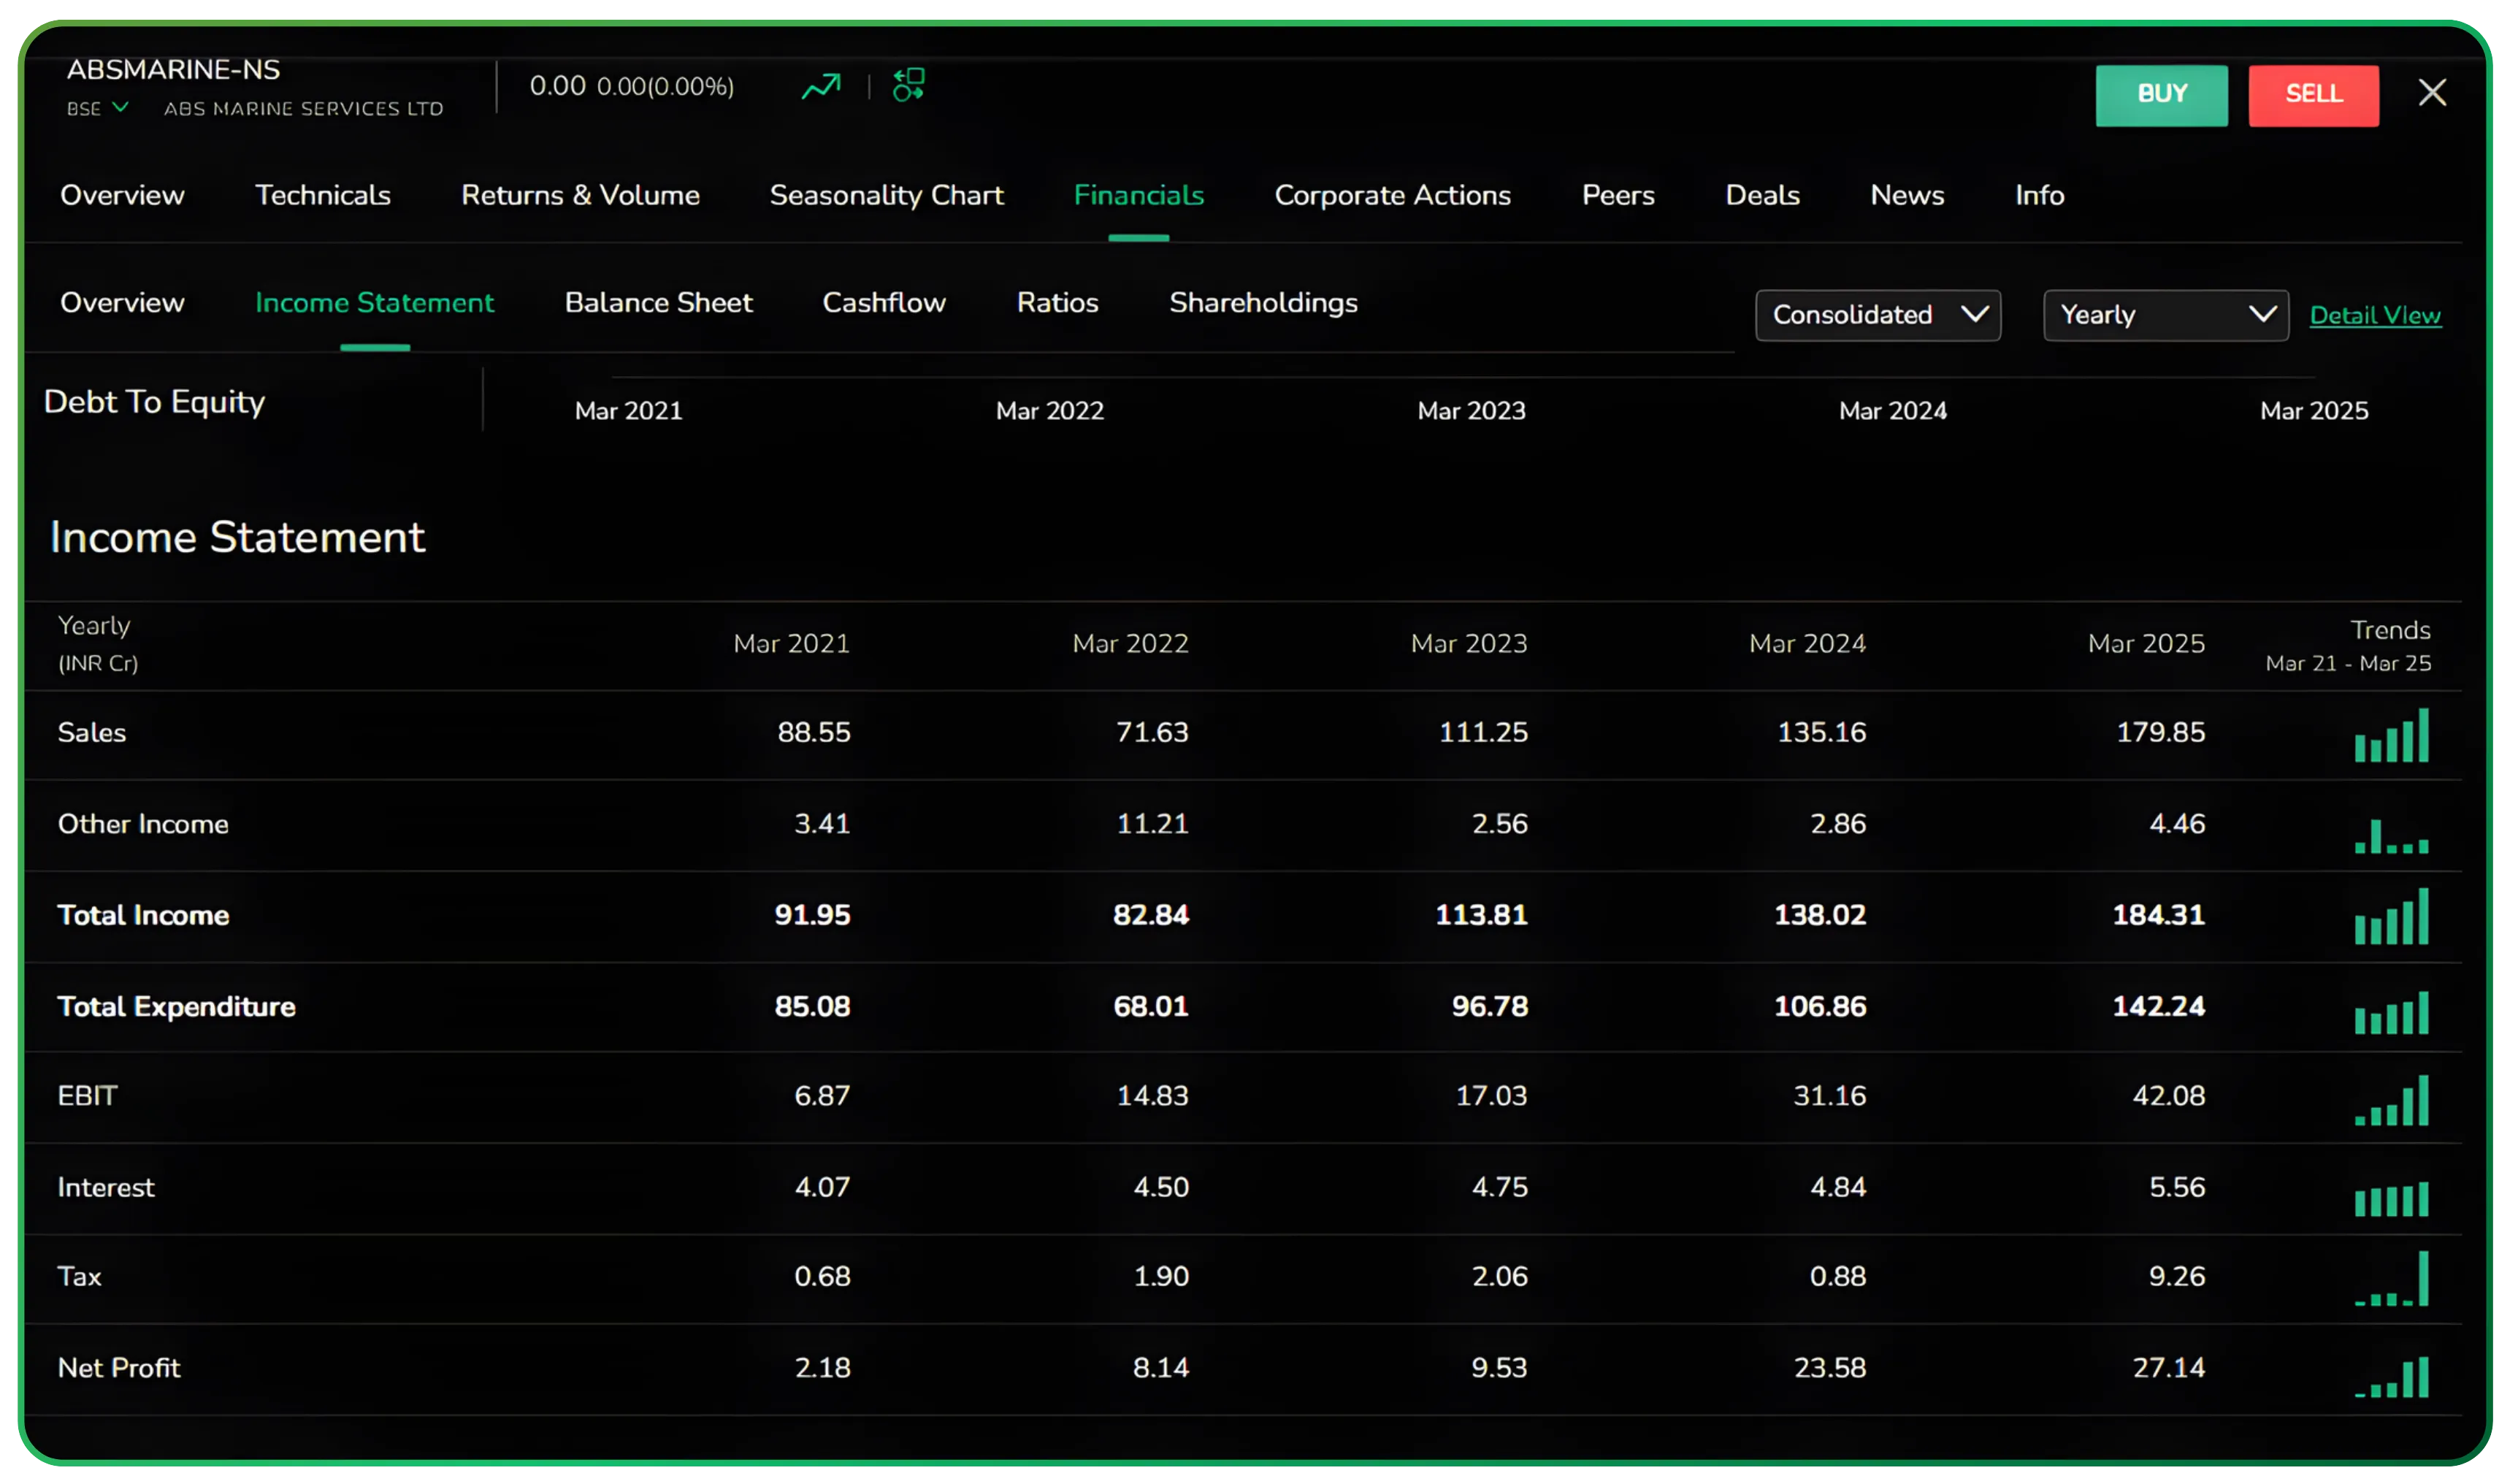
The Income Statement section breaks down the essentials clearly—sales, total income, expenditure, EBIT, interest, tax, and net profit. Each line item comes with a small trend marker, so you immediately see whether the numbers are strengthening or weakening over time.
This layout makes it easy to spot margin expansion, operating leverage, or rising cost pressures without exporting anything to Excel. The story sits right in front of you.
It also gives you a clear view of the company’s profitability and earnings momentum over time.
Investors analyze metrics on a company's financial statements, including the balance sheet, income statement, and cash flow statement.
Balance sheet: capital structure at a glance
The Balance Sheet section lays out the company’s financial position in a straightforward way. Equity and liabilities sit on one side, assets on the other, with clear visibility into reserves, borrowings, fixed assets, and current assets.
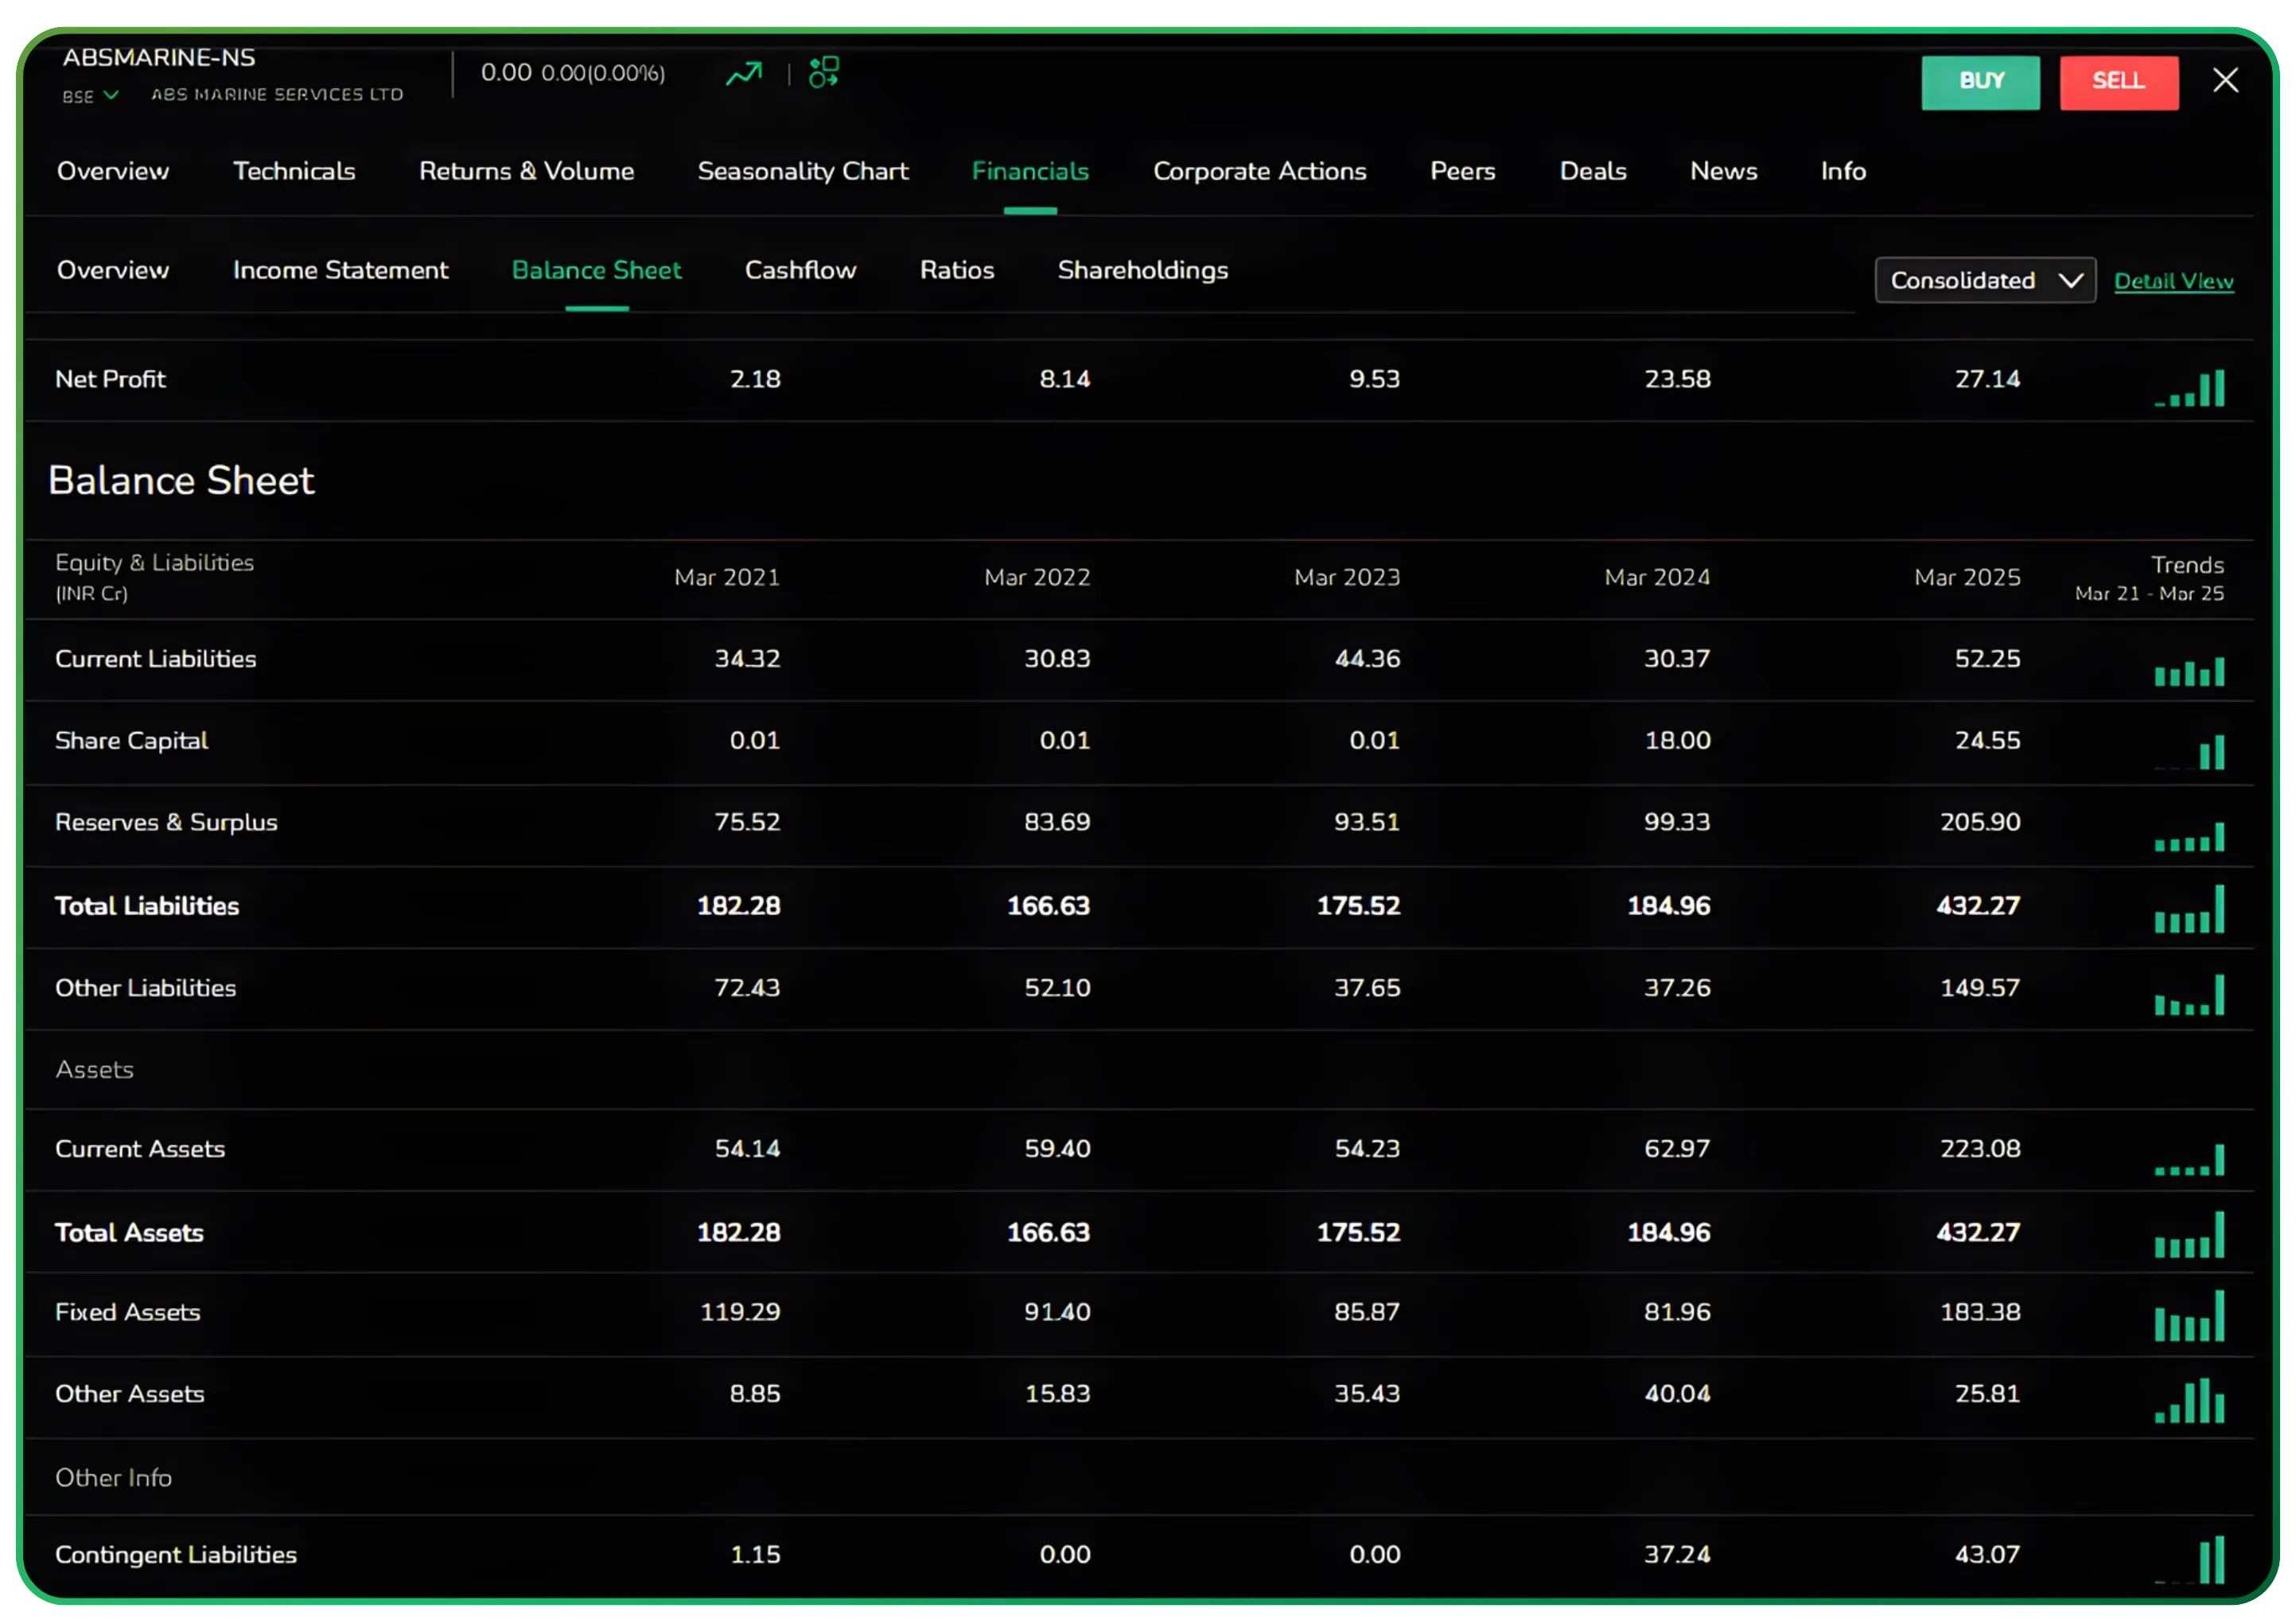
This structure helps you answer the big questions quickly: Is the company funding growth through debt or internal cash flows? Are assets growing in line with profits? Is working capital tightening? For long-term investors, this single screen offers a quick and reliable view of balance sheet strength.
The balance sheet view also helps you understand the company’s financial position across assets, liabilities, and debt levels.
Understanding a company’s financial health involves analyzing its balance sheet, assets, and liabilities.
If you want to take your order management even further, check out our walkthrough on How to Use Bracket Orders Effectively on CubePlus.
Cash flow: where the real picture emerges
The Cash Flow section separates numbers into operating, investing, and financing activities, along with the net cash flow for each period. This breakdown matters because profits alone don’t reveal how healthy a business actually is.
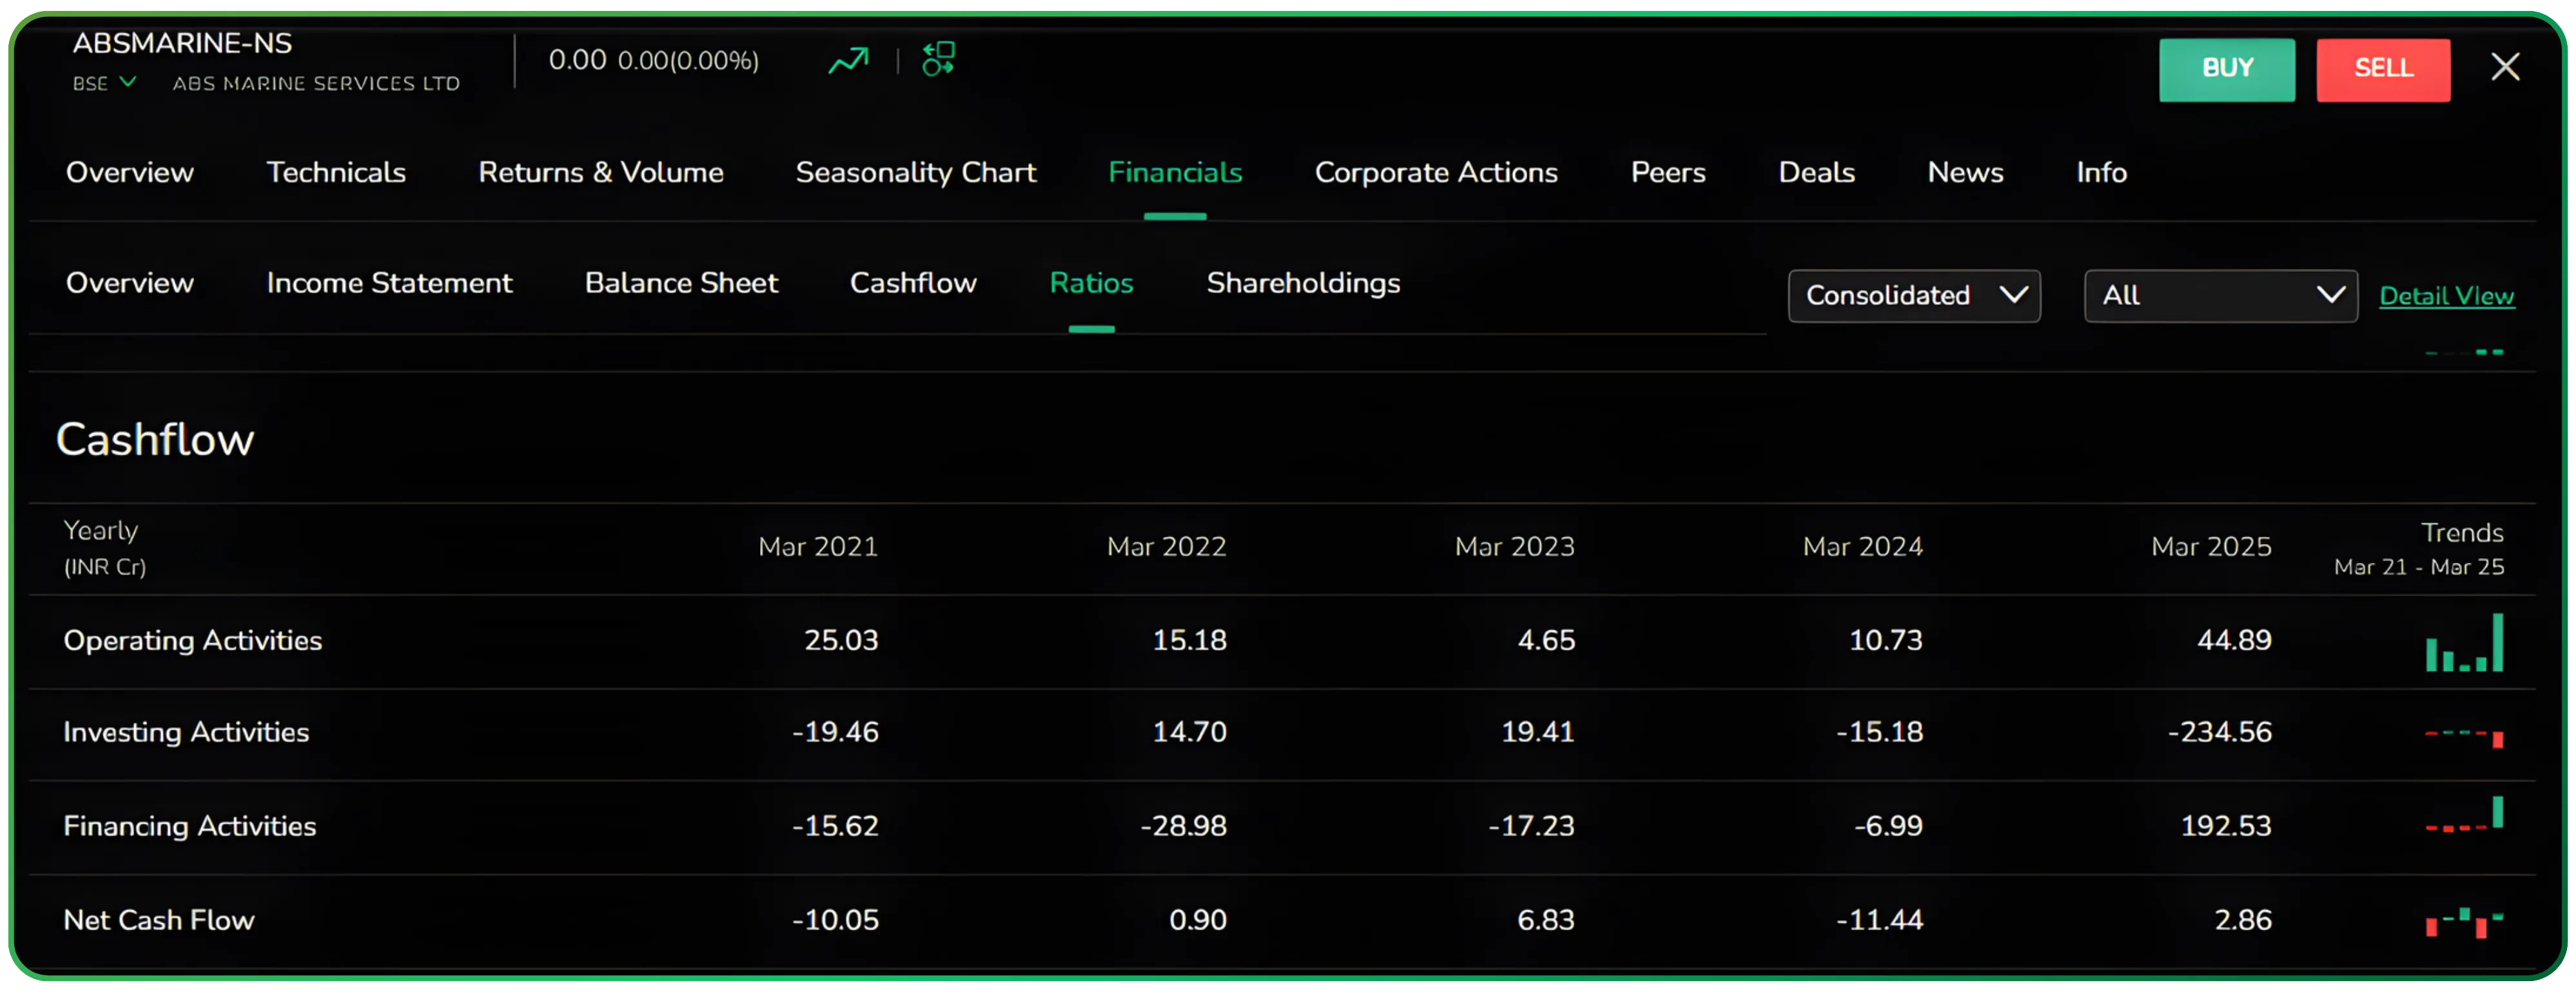
You can quickly see whether earnings are turning into genuine cash or getting pulled into capex, debt repayments, or working capital. It’s an easy way to distinguish between businesses generating solid cash and those showing profits only on paper.
Strong operating cash flows also reduce risk levels, which matters especially for long-term investing.
Fundamental analysis evaluates a company's financial health, industry dynamics, competitive positioning, and growth potential.
Ratios: everything that matters in one place
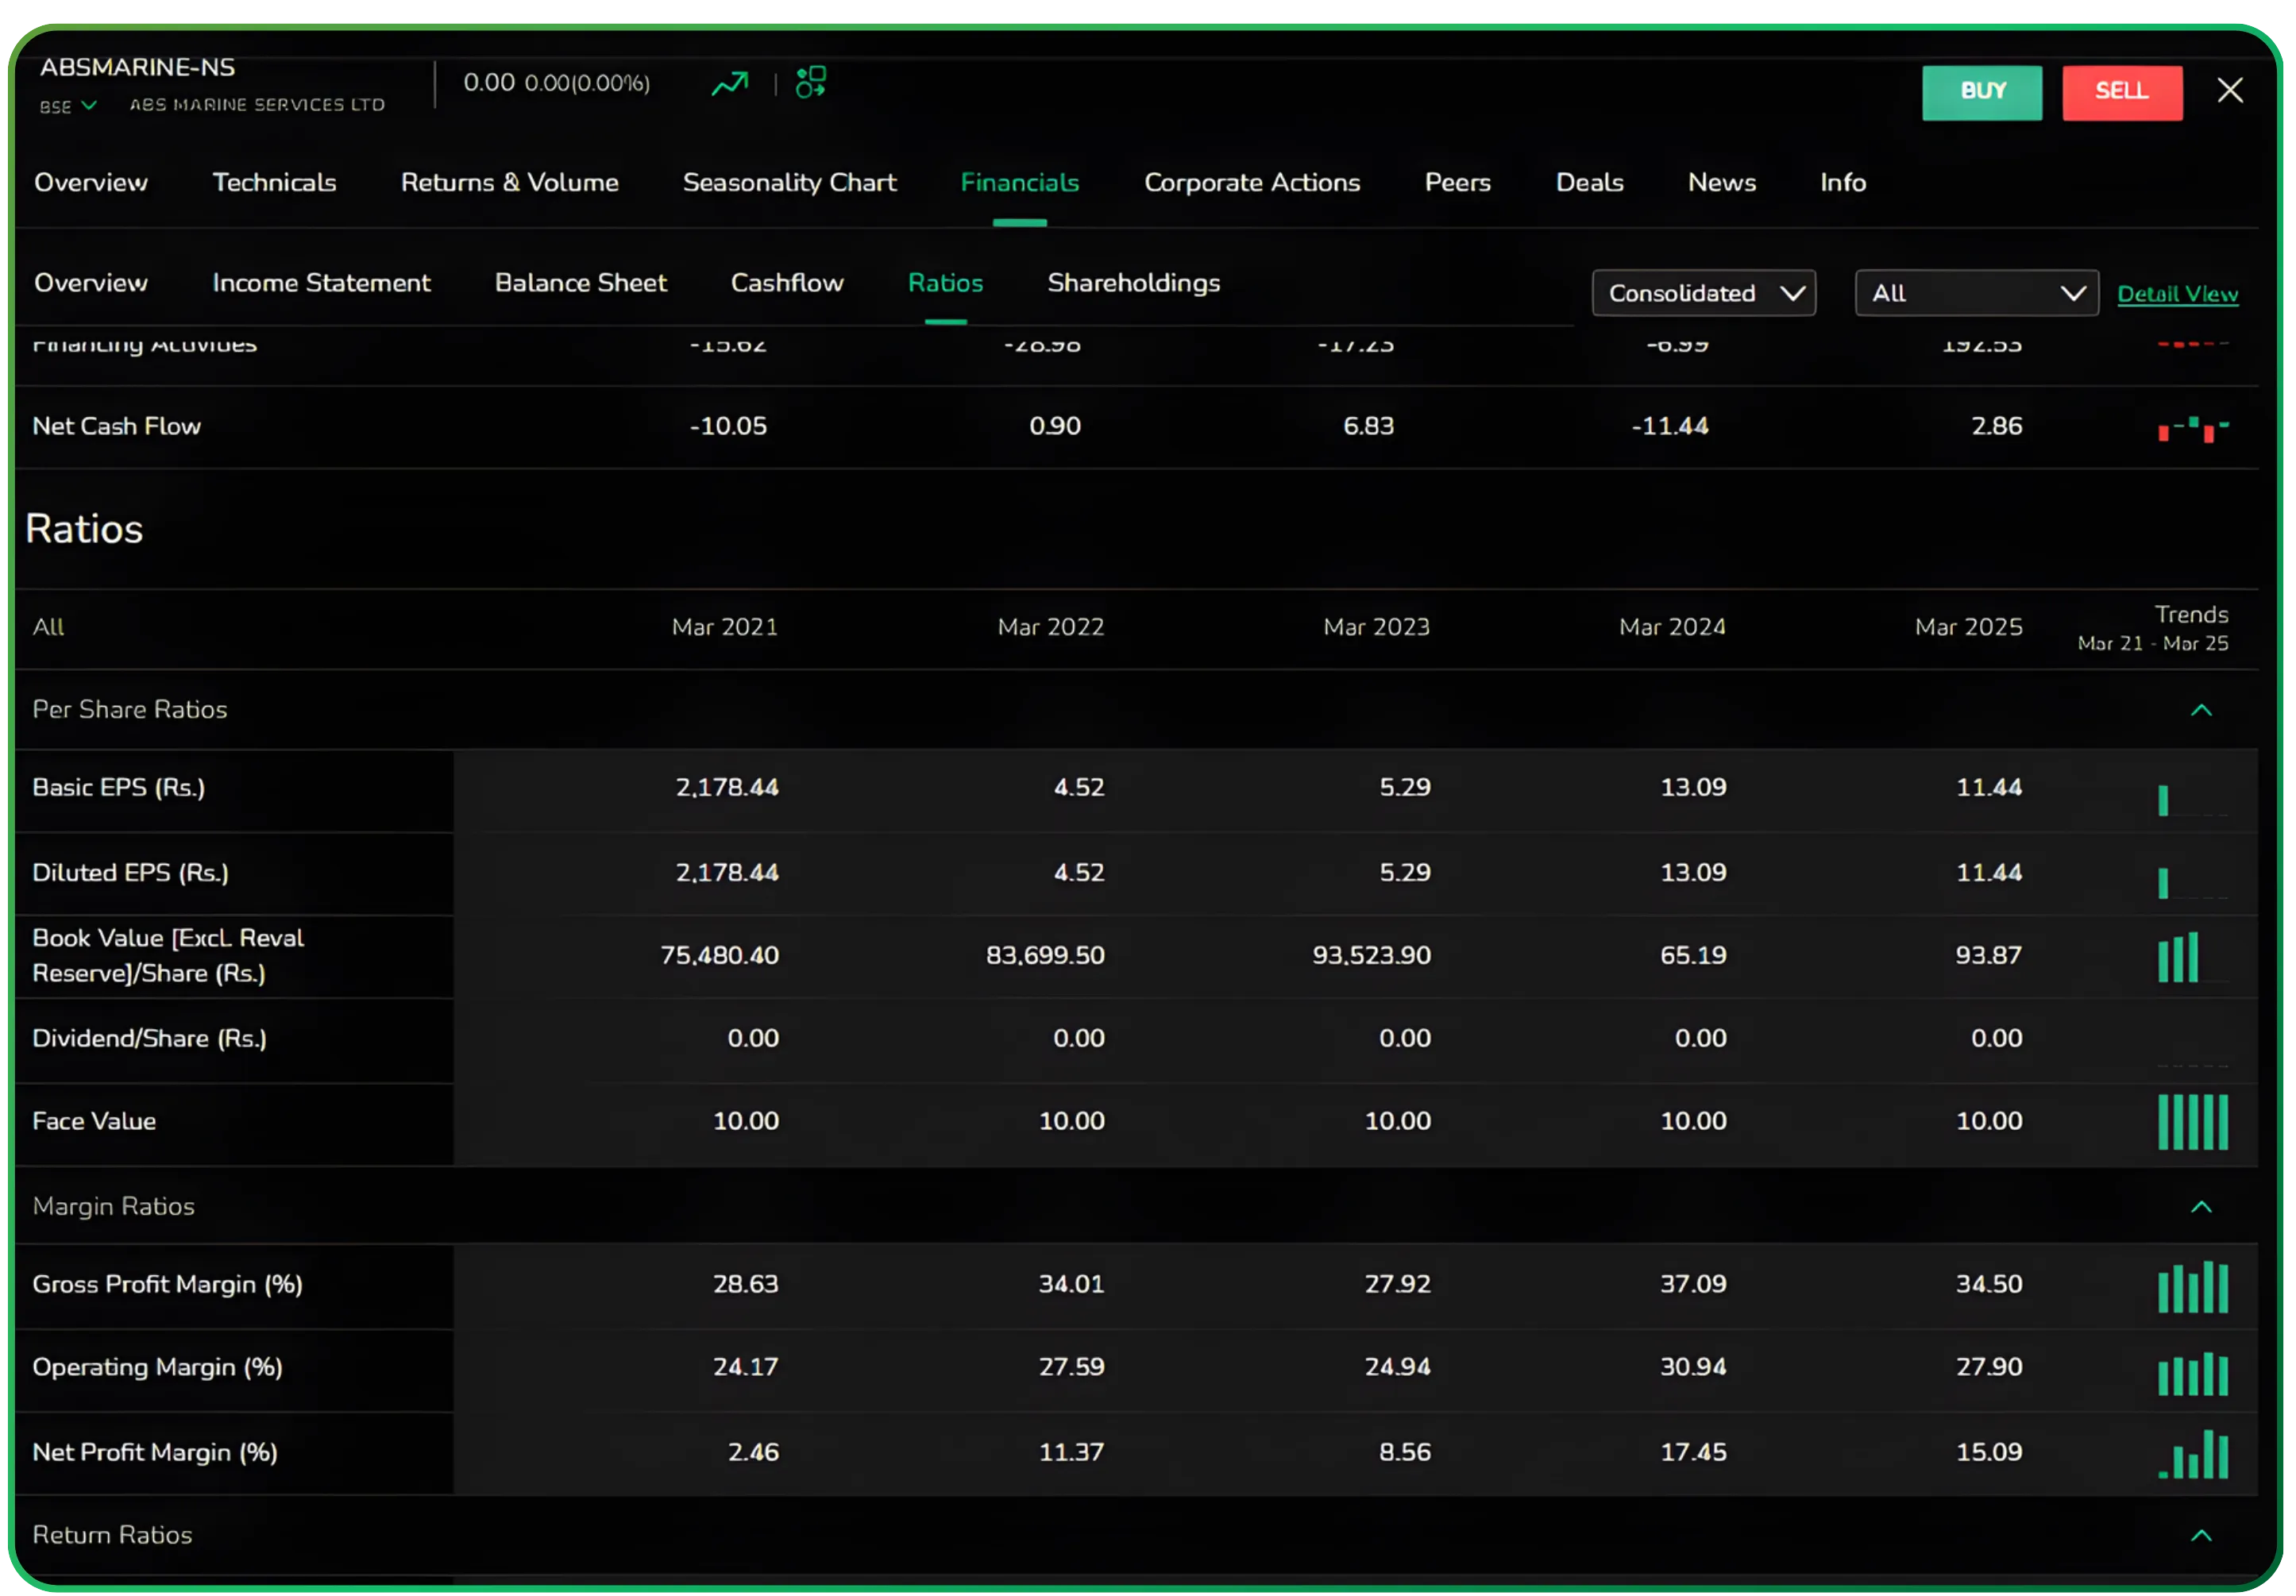
CubePlus brings all key ratios into a single screen—profitability margins, return ratios like ROE, ROCE, and ROA, liquidity and leverage metrics, growth indicators, and valuation ratios such as PE, PB, and EV/EBITDA.
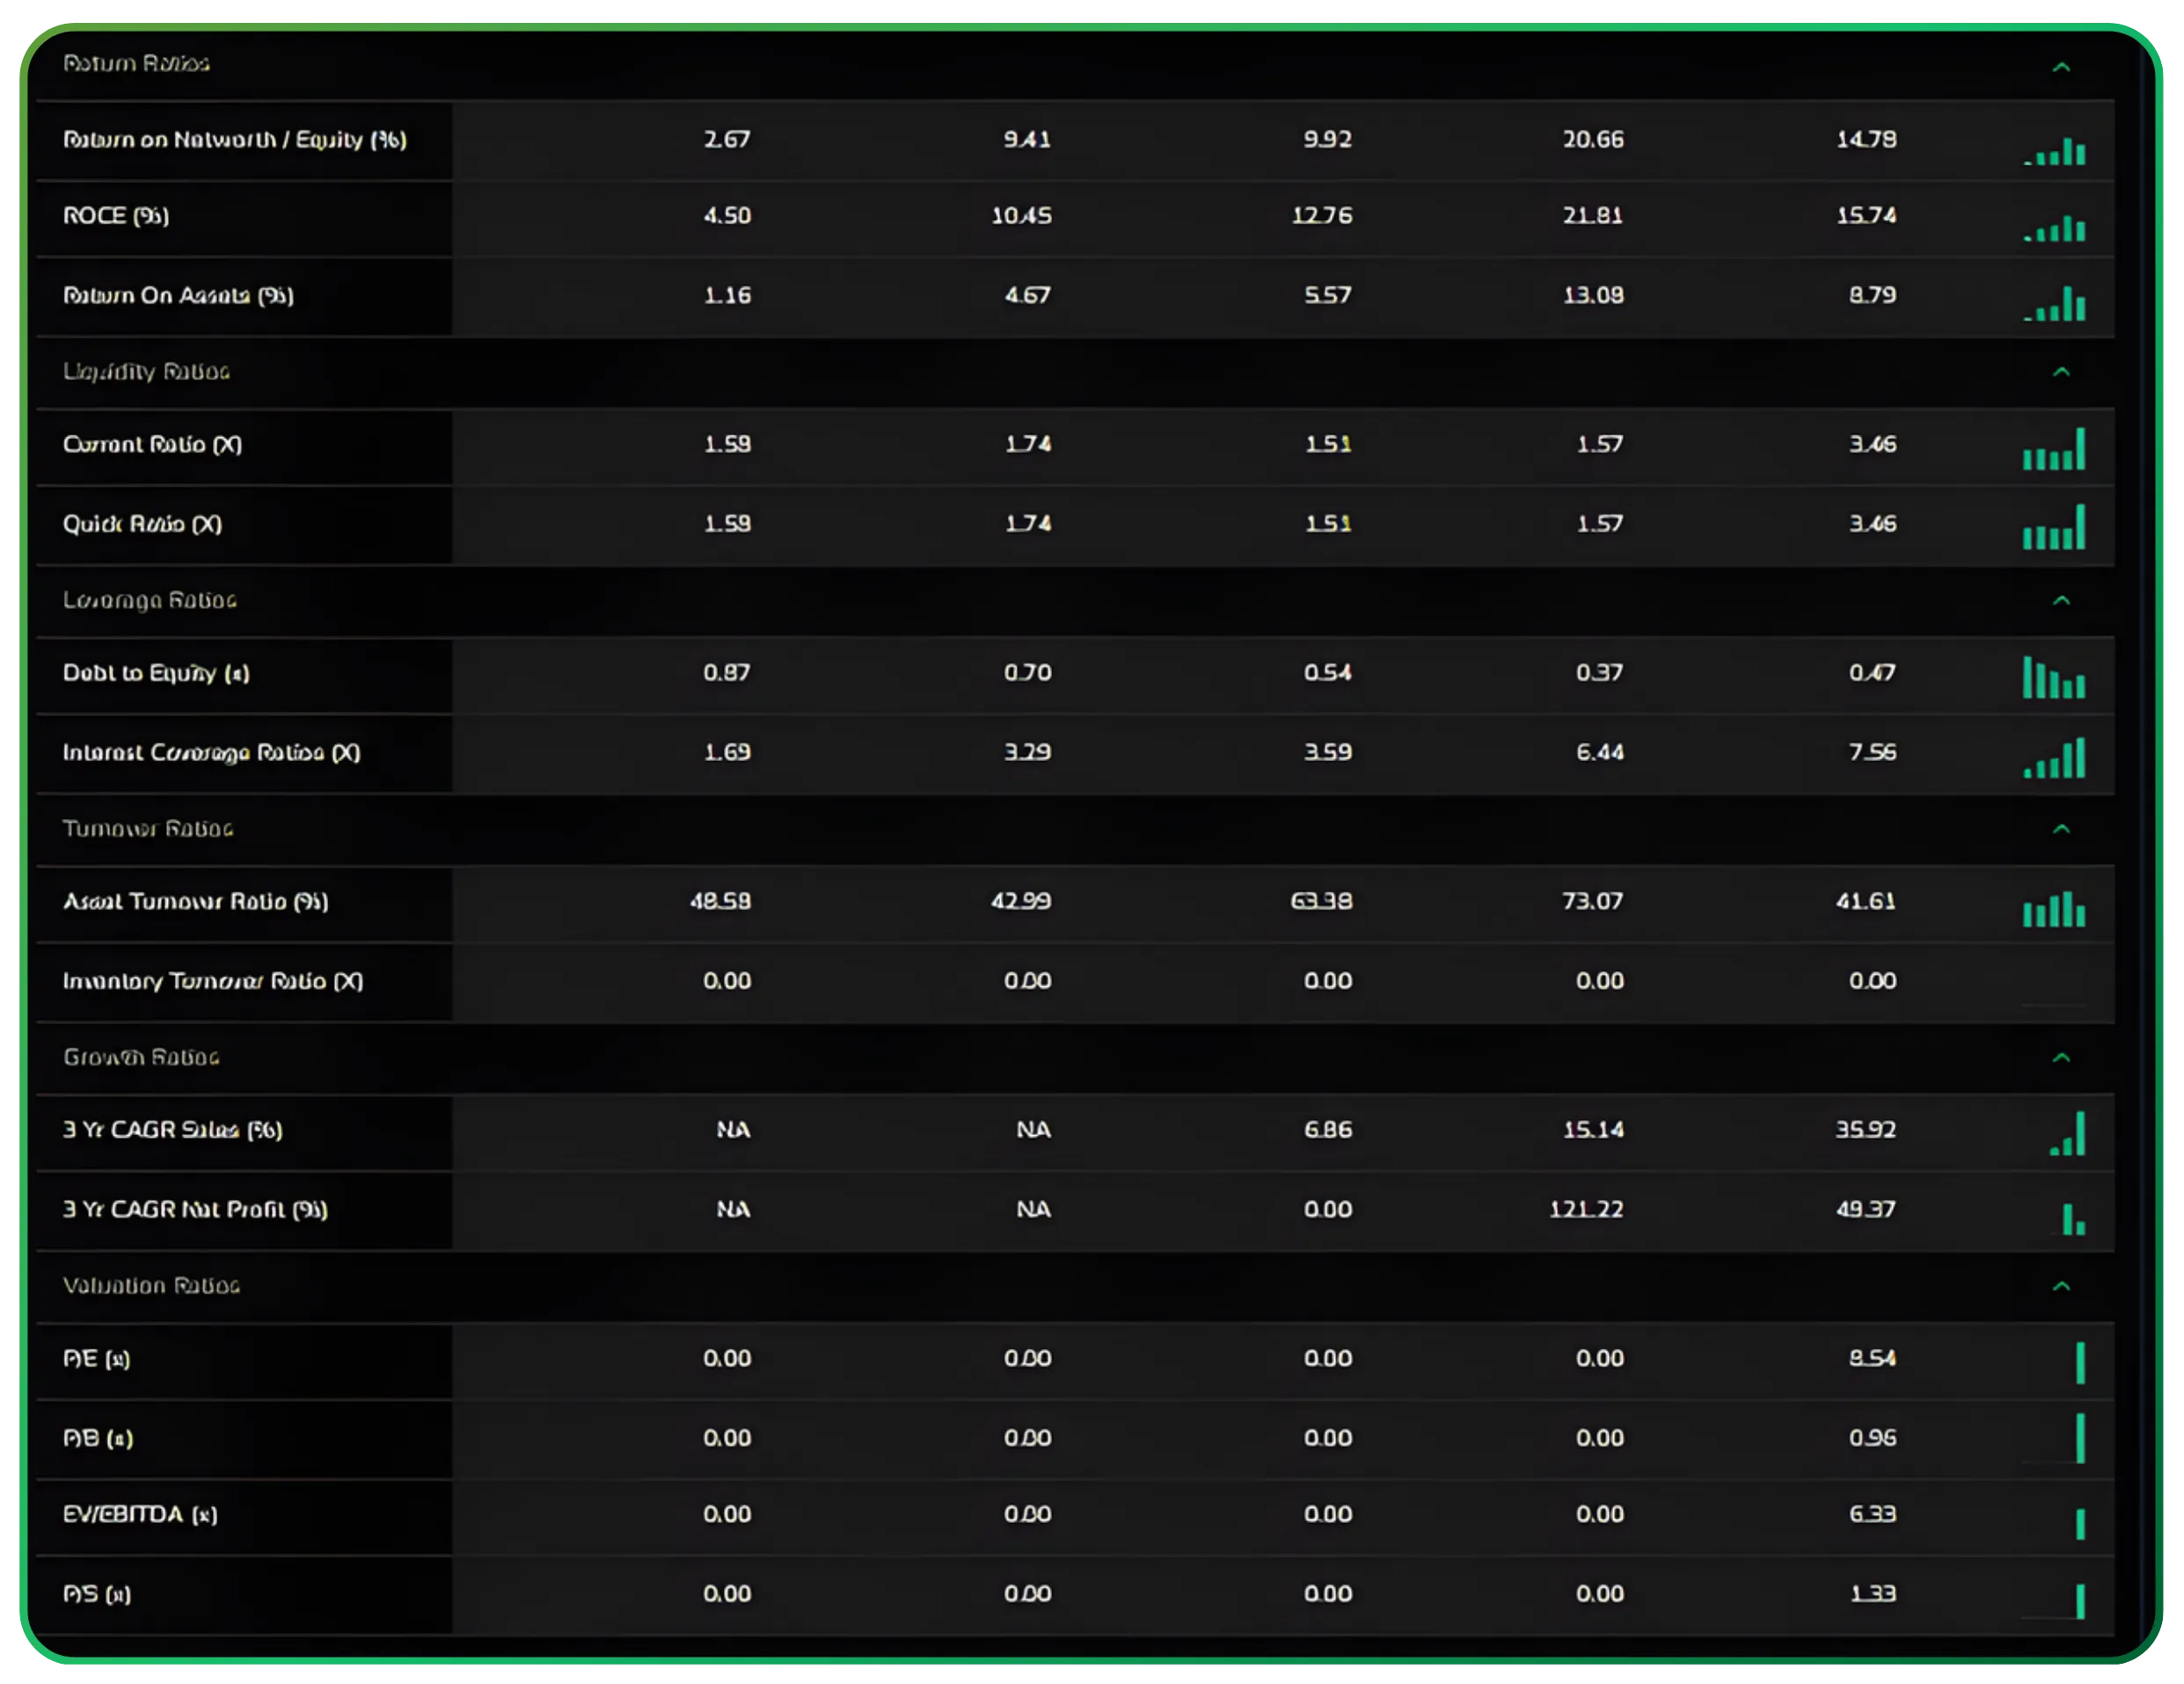
Each ratio includes a trend marker, which helps you understand not just the current value but the direction in which the business is moving. It’s a quick, structured way to judge overall performance without jumping between multiple sections.
You’ll also find valuation indicators like the price-to-earnings ratio, helping you evaluate performance in context with profitability and efficiency metrics.
Different ratios can be used to determine how healthy a company is.
Investors can identify undervalued stocks and stocks with continued profit growth through fundamental analysis.
Shareholding: clear visibility into ownership
The Shareholding section lays out the promoter, FII, DII, and public ownership split, along with quarterly trend charts, a list of major holders, and a view of the company’s capital structure over time.
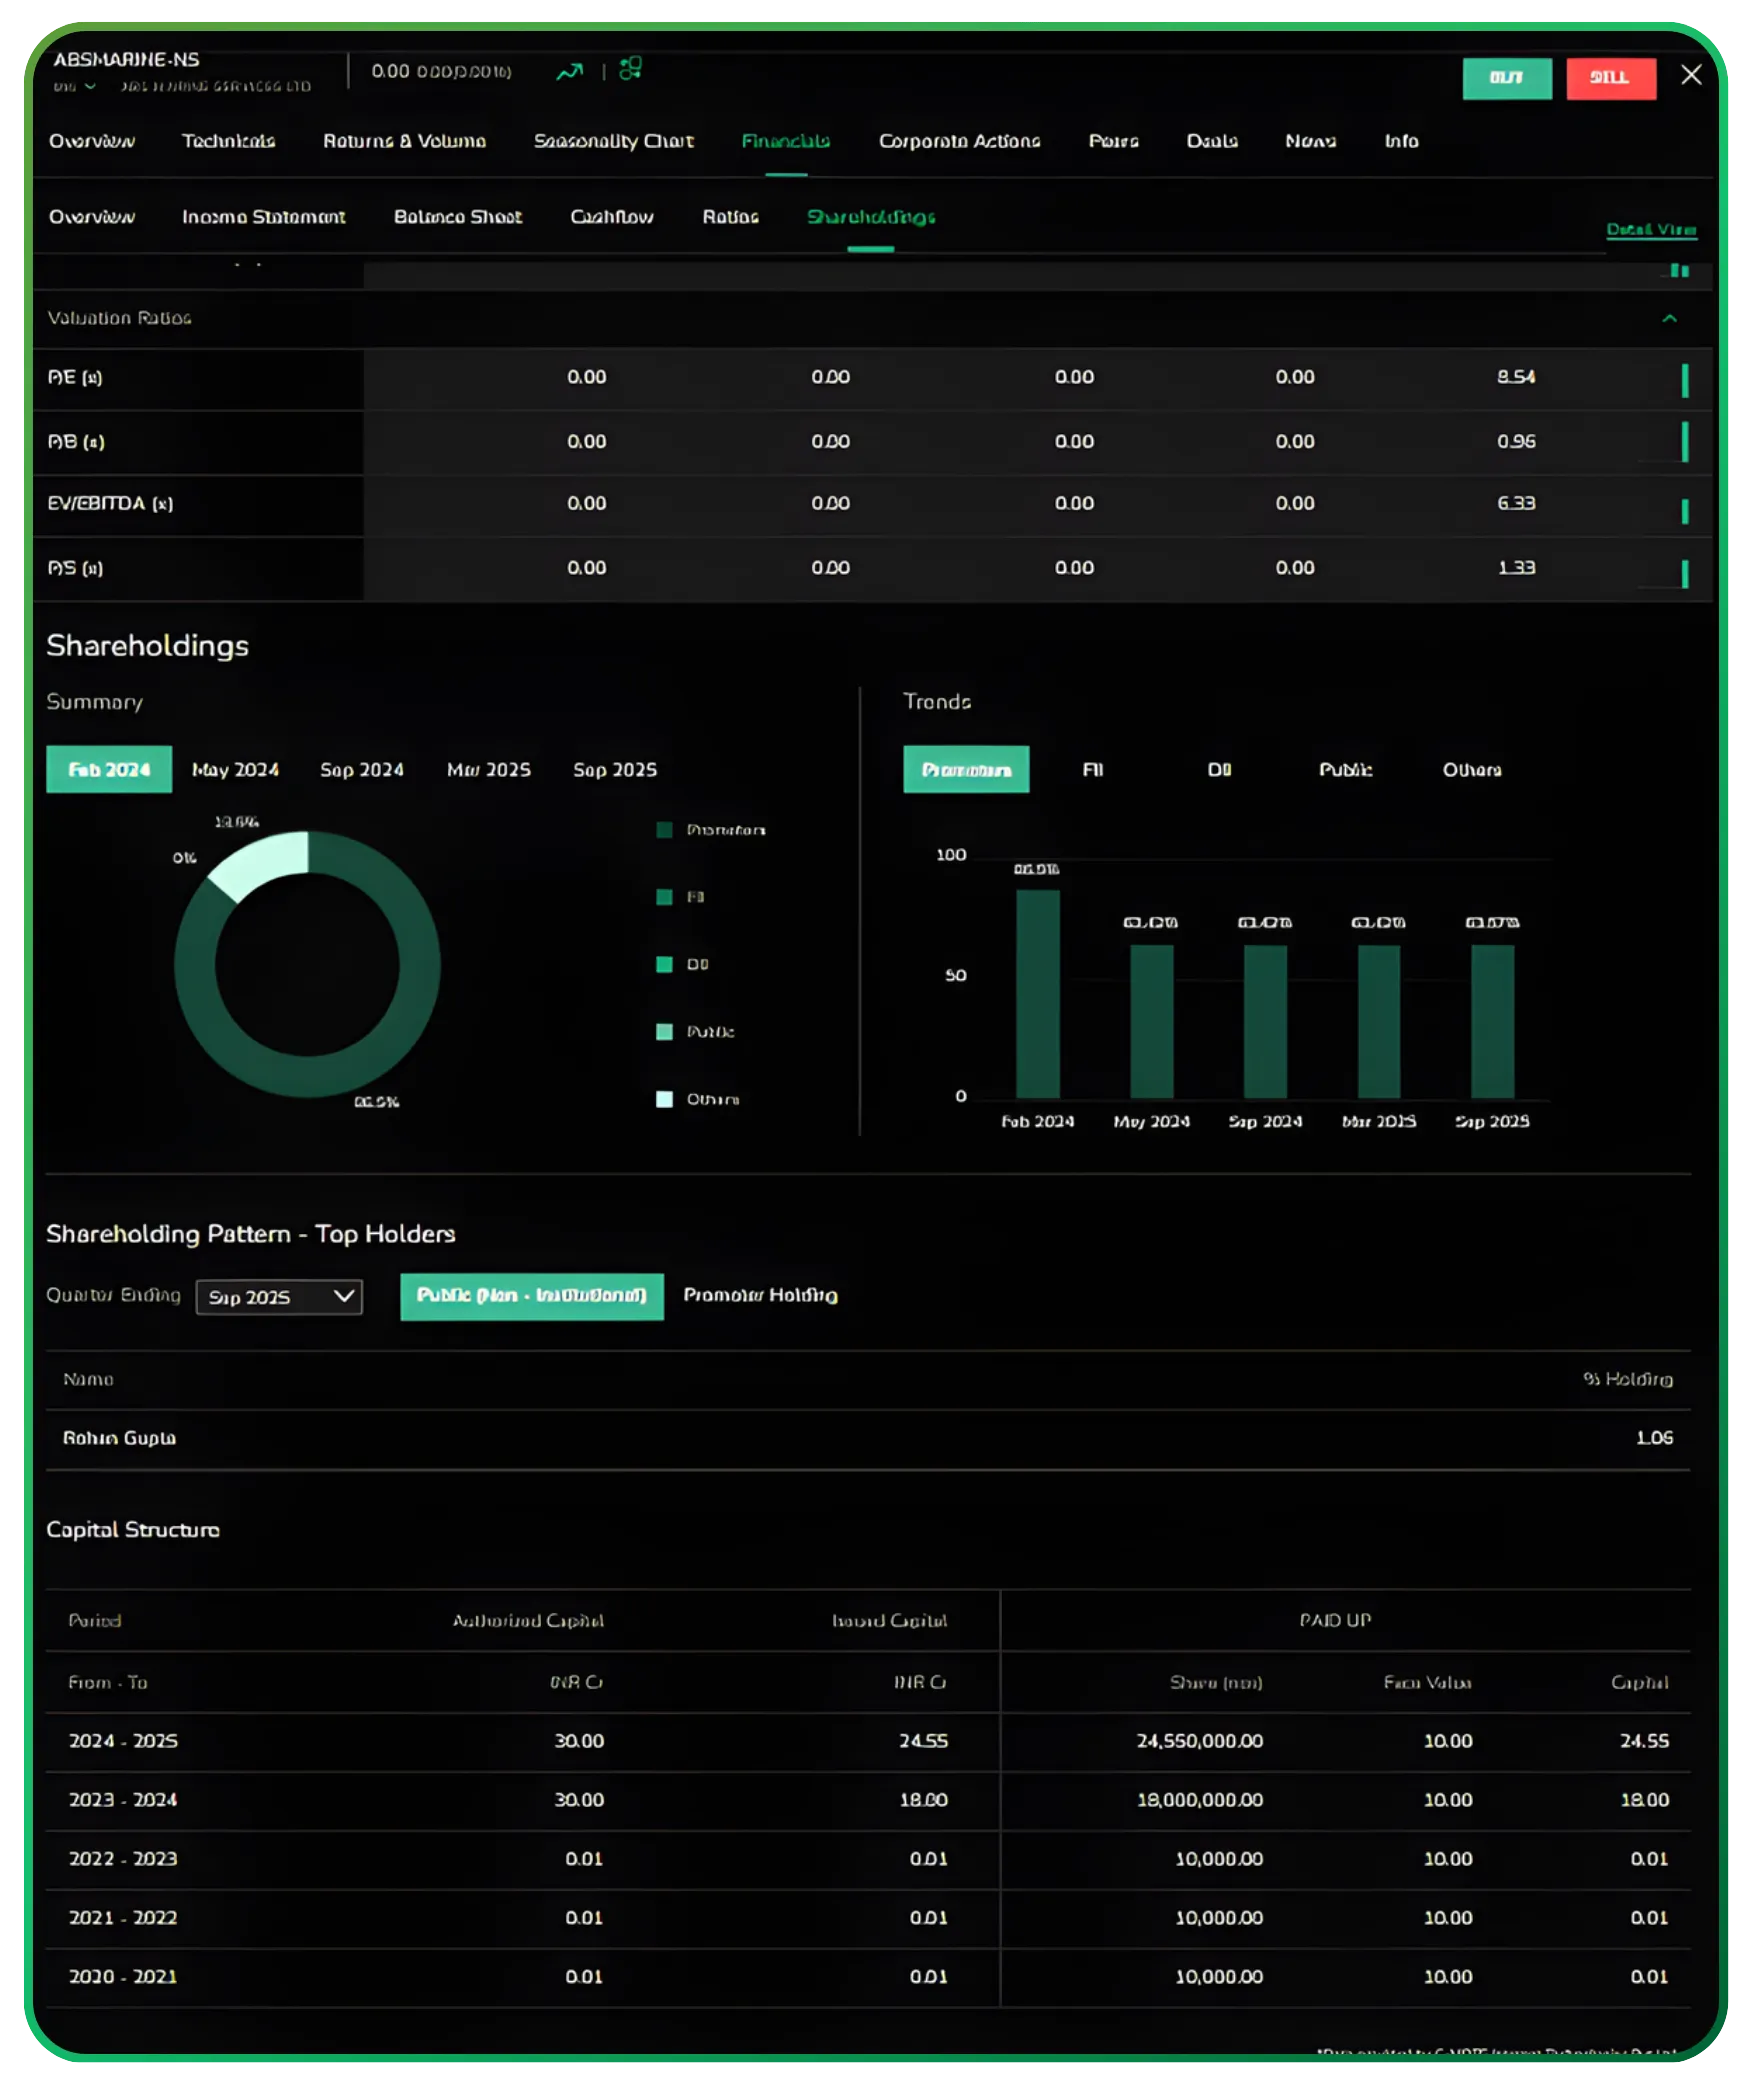
This makes it easy to track subtle but important shifts—whether promoters are increasing their stake, whether institutional interest is building, or if any dilution has taken place. You get the full ownership picture without digging through separate filings.
These ownership trends give investors additional context when doing market analysis across various aspects of the business.
Why this matters for serious investors
CubePlus goes beyond presenting numbers. It gives you a structured way to understand a business. The flow from trends to financial statements, ratios, and ownership mirrors how an analyst evaluates a company, which means you spend less time navigating screens and more time interpreting what the numbers are saying.
Whether you're scanning ideas, digging into a company you already own, or validating an investment thesis, the Financials tab turns raw data into insight without any extra effort.
If you’d like to deepen your market analysis, don’t miss our guide on using Active by Volume and Active by Value for smarter trading decisions.
Corporate actions and news: the updates that shape the numbers
Right below the financials, CubePlus brings in all key corporate actions and company-specific news in an organised timeline. You’ll see board meeting notices, AGM dates, filings, and regulatory updates arranged neatly by date. The News section follows the same structure, highlighting announcements, disclosures, and any event that could influence the company’s fundamentals or stock behaviour.
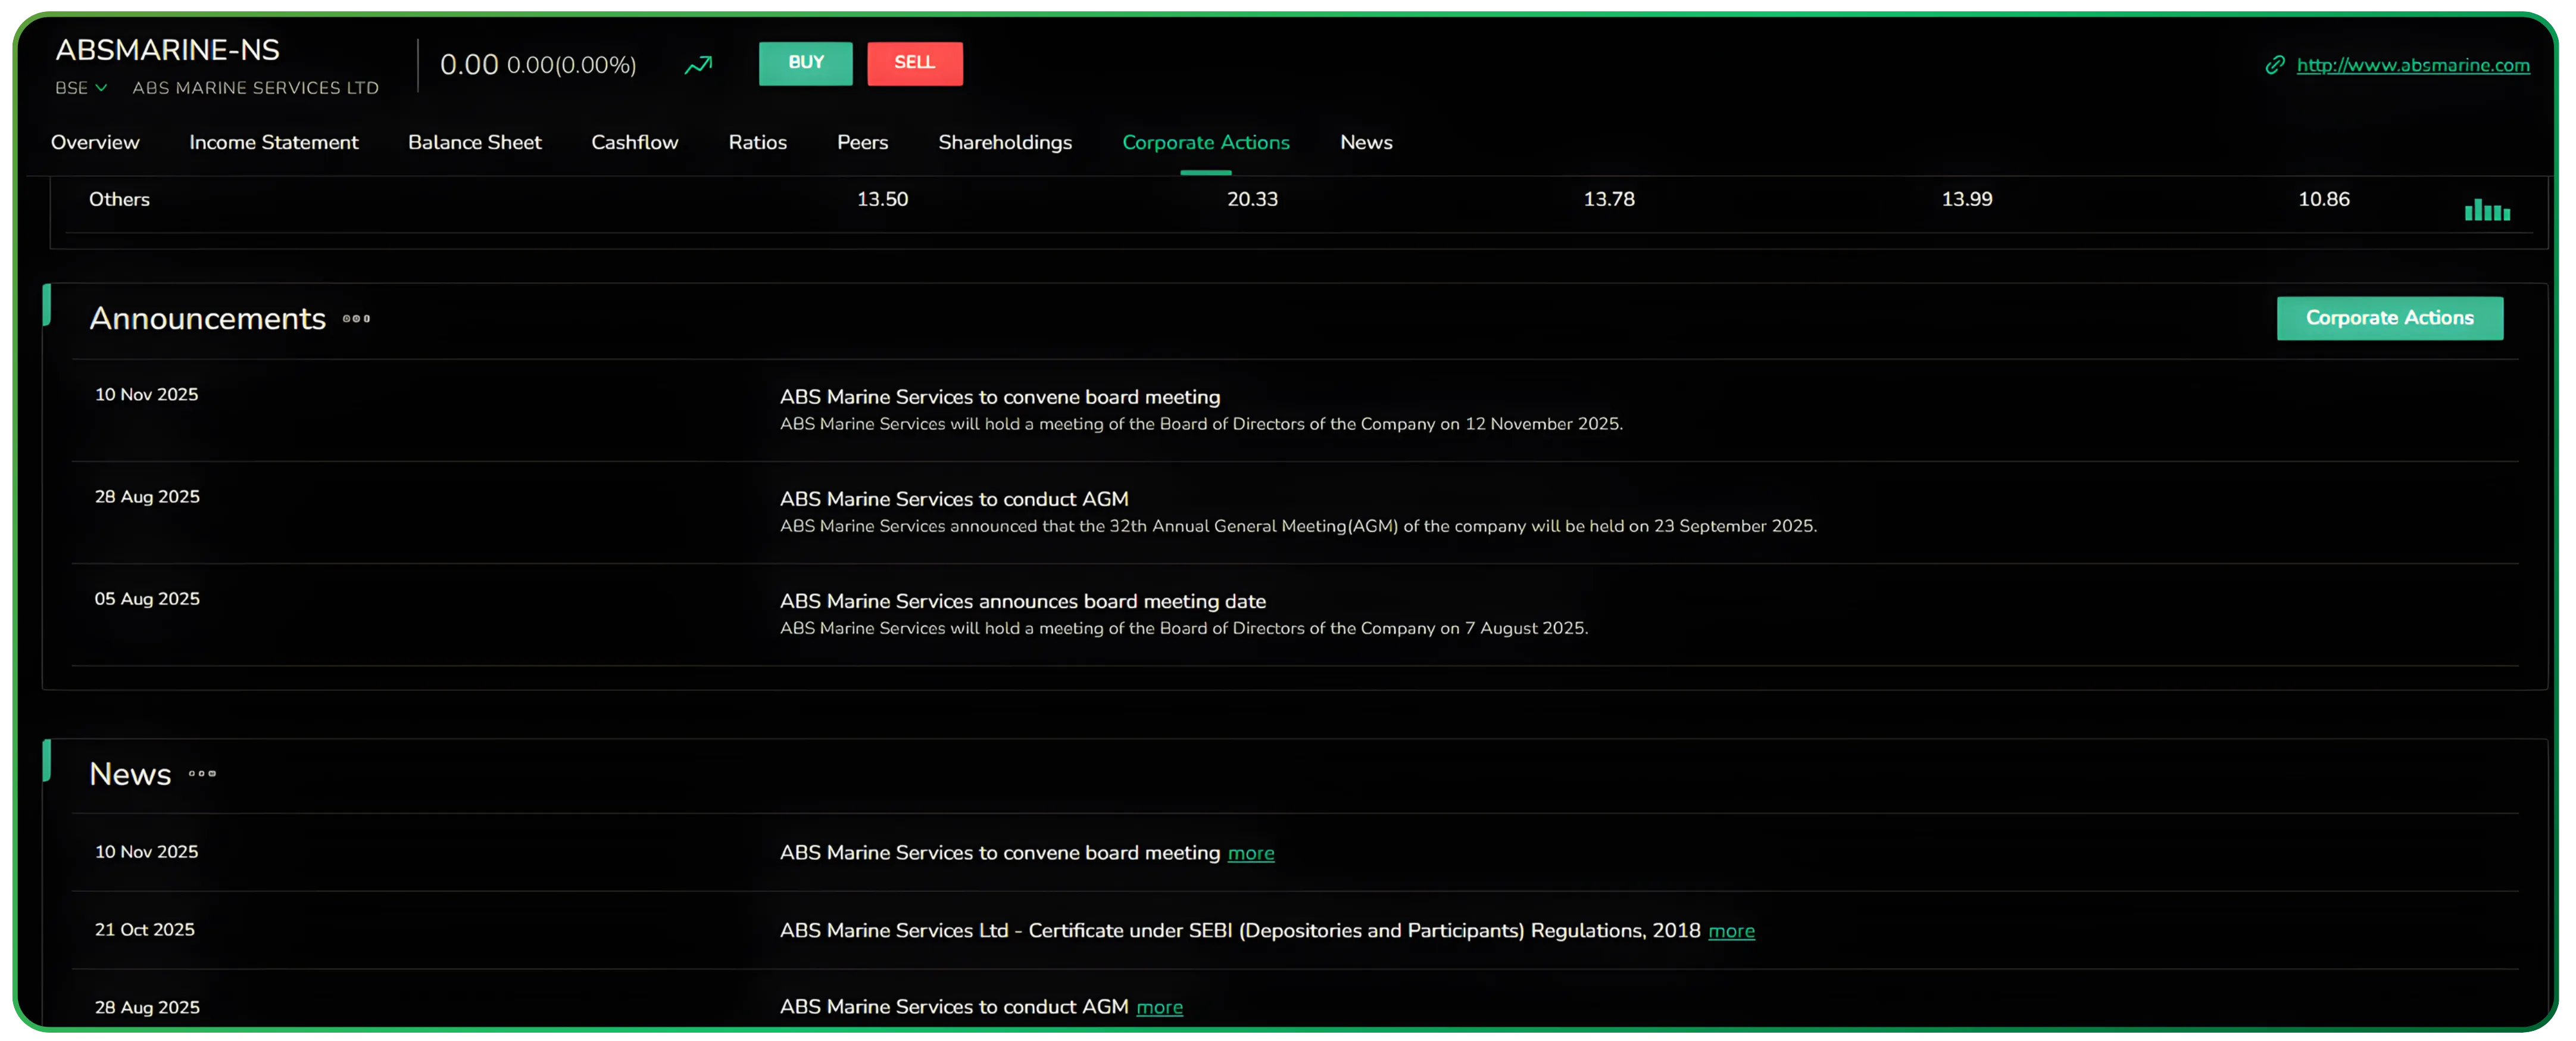
This keeps you aware of the events happening around the business—management decisions, compliance updates, or operational developments—without needing to check separate sources. It’s a quick way to stay updated on everything that could matter to your analysis.
The constant flow of structured market data ensures you never miss updates that can influence your analysis.
Successful investors think in decades rather than months when making investment decisions.
Investors should focus on long-term investing rather than short-term trading.
A stock financial analysis tool should combine fundamental, technical, and quantitative analysis features for informed investment decisions.
Access to detailed financial statements and historical data allows for in-depth fundamental analysis and peer comparisons.
Investors can use financial ratio analysis to evaluate a company's financial health, profitability, efficiency, and stability over time.
Bottom line
If your research begins with financials, CubePlus gives you a clear, organised view of everything that matters. Nothing feels hidden or scattered. The layout is clean, quick to navigate, and designed for investors who want to understand the business behind the stock, not just the price on the screen.
Start using CubePlus today and see how much smoother your order management can be.
Disclaimer: The information provided in our blogs is for informational purposes only and should not be construed as financial, investment, or trading advice. Trading and investing in the securities market carries risk. Always conduct your own research and consult with a qualified financial advisor before making any investment decisions. Past performance is not indicative of future results. Copyrighted and original content for your trading and investing needs.
© 2026 — Tradejini. All Rights Reserved.