


Accessing historical market data is a fundamental requirement for backtesting strategies and developing algorithmic trading systems. The Tradejini CubePlus API provides an Interval Chart endpoint designed for this purpose.
The following steps outline the technical process for authenticating your session and retrieving historical OHLCV (Open, High, Low, Close, Volume) data and for derivatives, you will also get open interest change data as well.
Phase 1: Authentication and Session Token Generation
Before accessing market data, you must generate a dynamic Access Token. This token is valid for the current trading session and must be regenerated daily.
Generate API Credentials:
Log in to the Tradejini Developer Portal.
- Navigate to "Create New App," select "Individual," and submit to receive your API Key (Client ID).
Generate the Daily Access Token:
Use the individual-token-v2 endpoint.
Required Parameters:
userid: Your Client ID.
password: Your trading account password.
totp: The 6-digit code from your authenticator app.
In the Authorization header, use your Client ID in the format: Bearer < API KEY >
Refer to this blog for step by step and clear understanding of the Authentication Process. Simplifying API Access
Phase 2: Identifying the Symbol (Scrip Master)
The API requires a specific Symbol ID rather than a generic stock name. Use the Scrip Master endpoints to locate this ID.
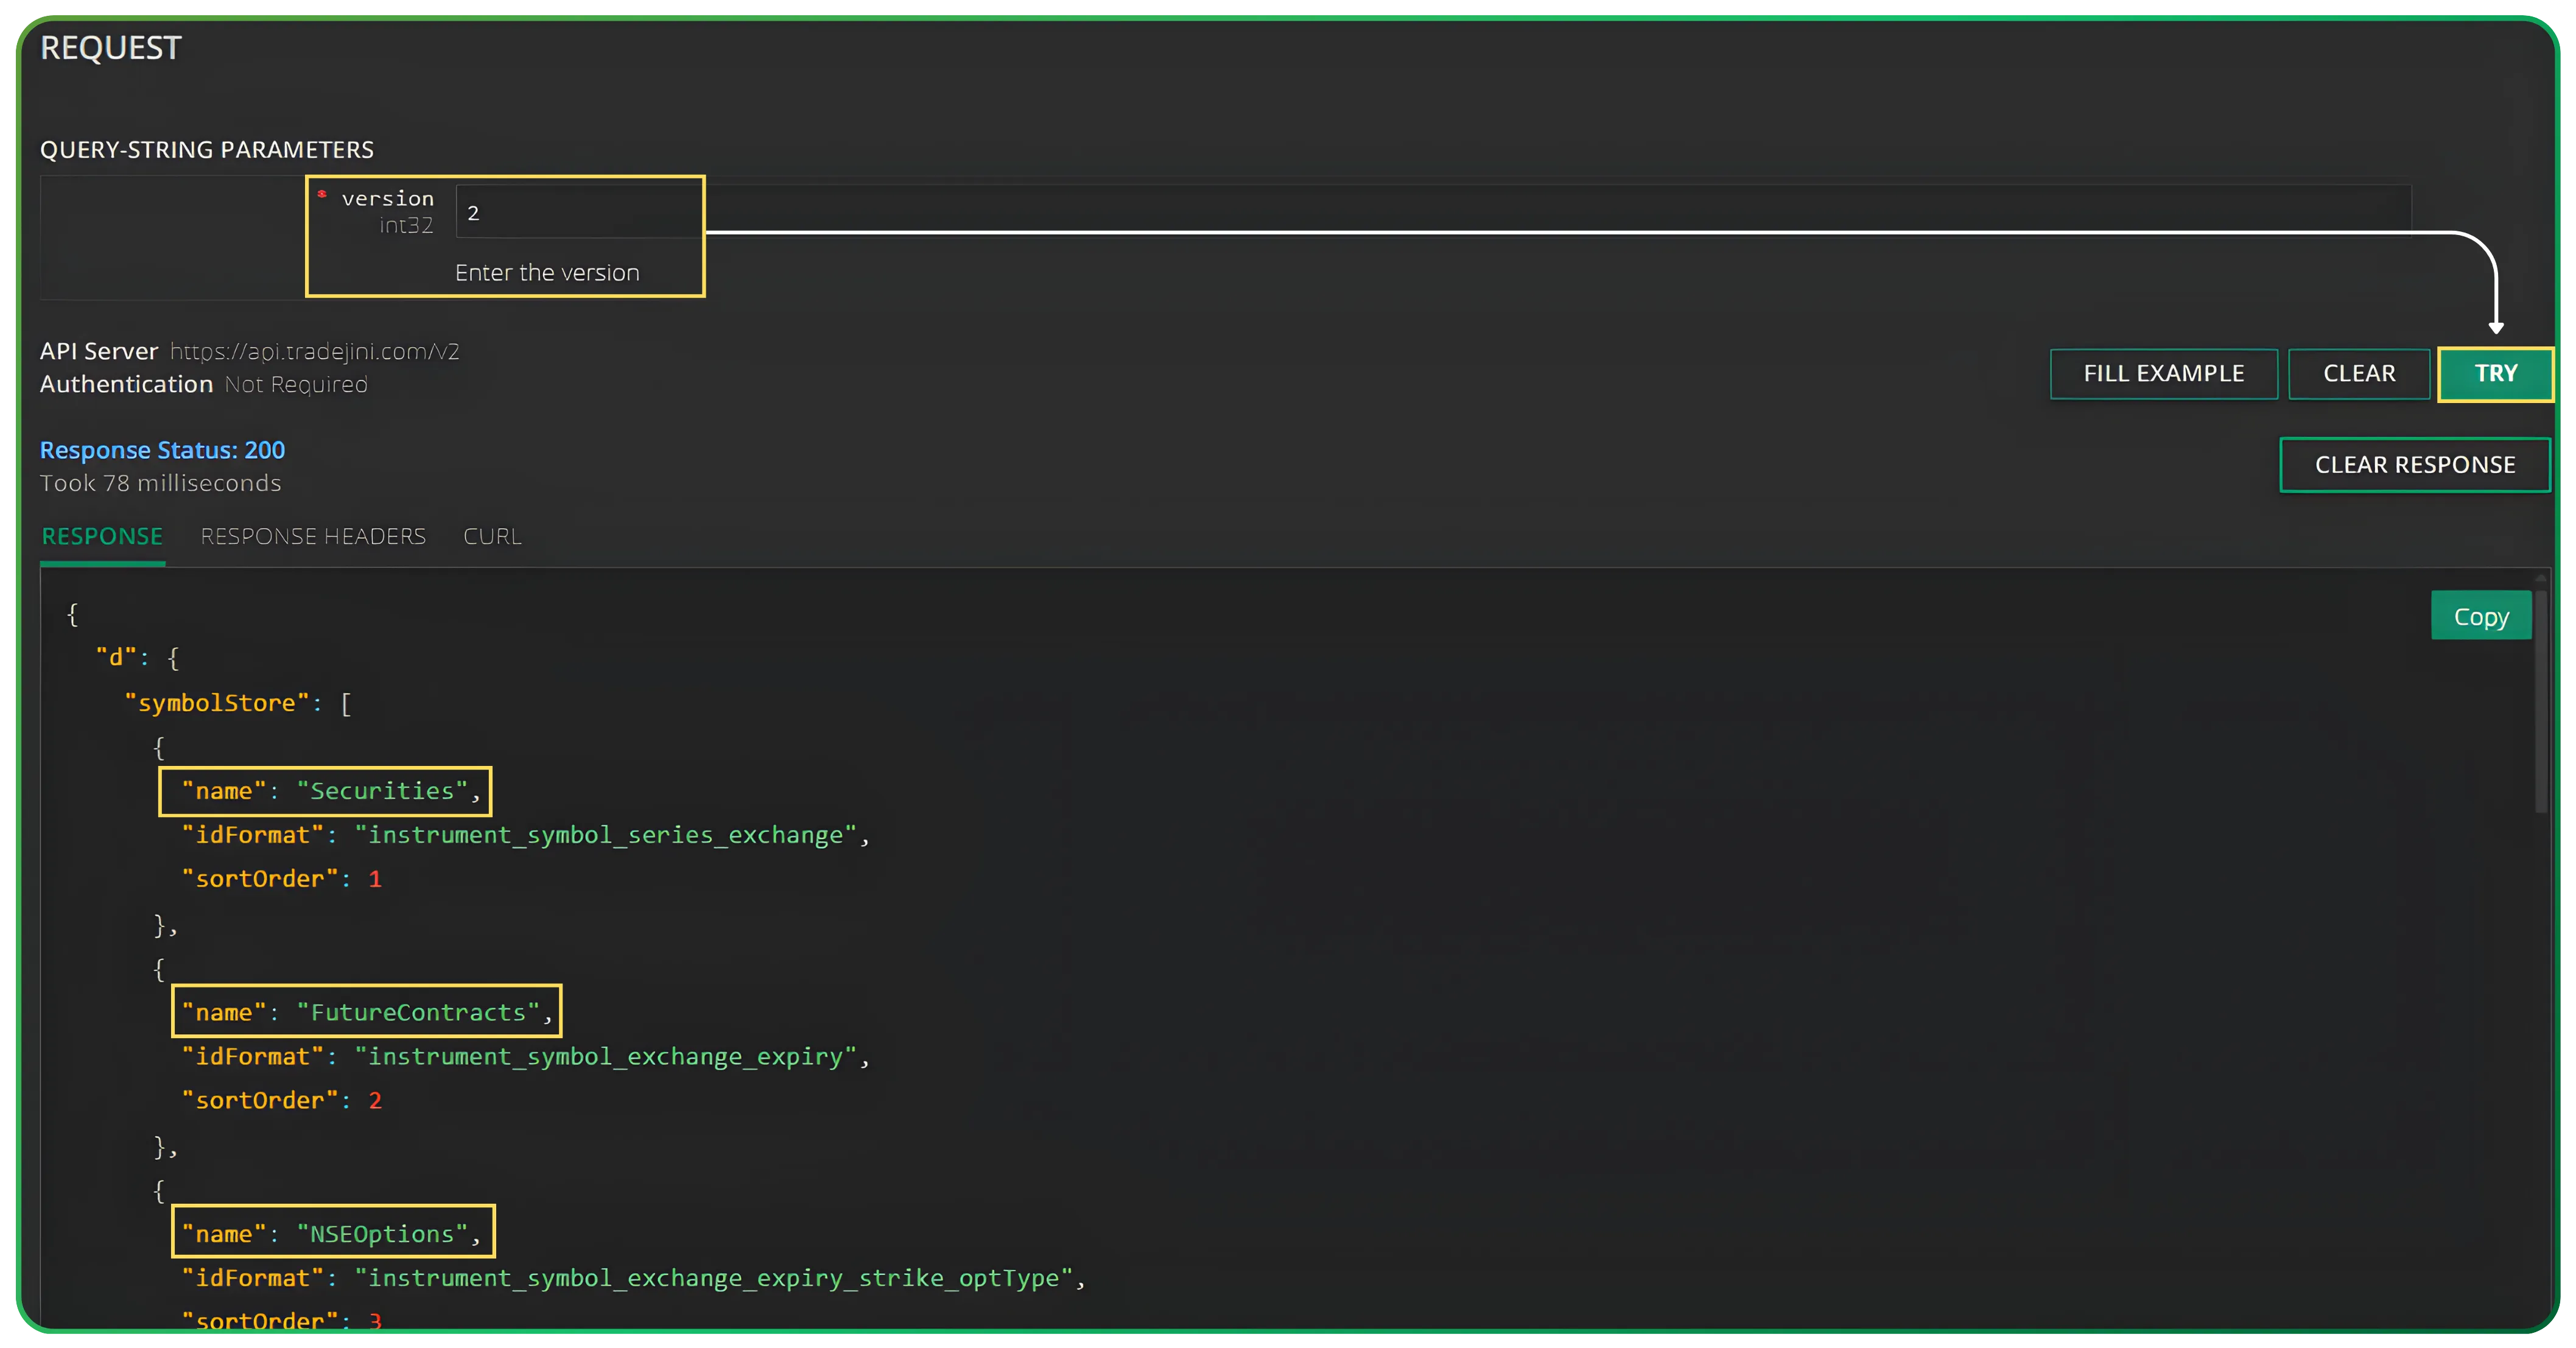
1. Scrip Master Groups
- Endpoint: /api/mkt-data/scripts/symbol-store
- Action: Enter version “2” and click Try.
- Purpose: This returns a list of scrip groups. Identify the group you need (e.g., Securities for Equity).
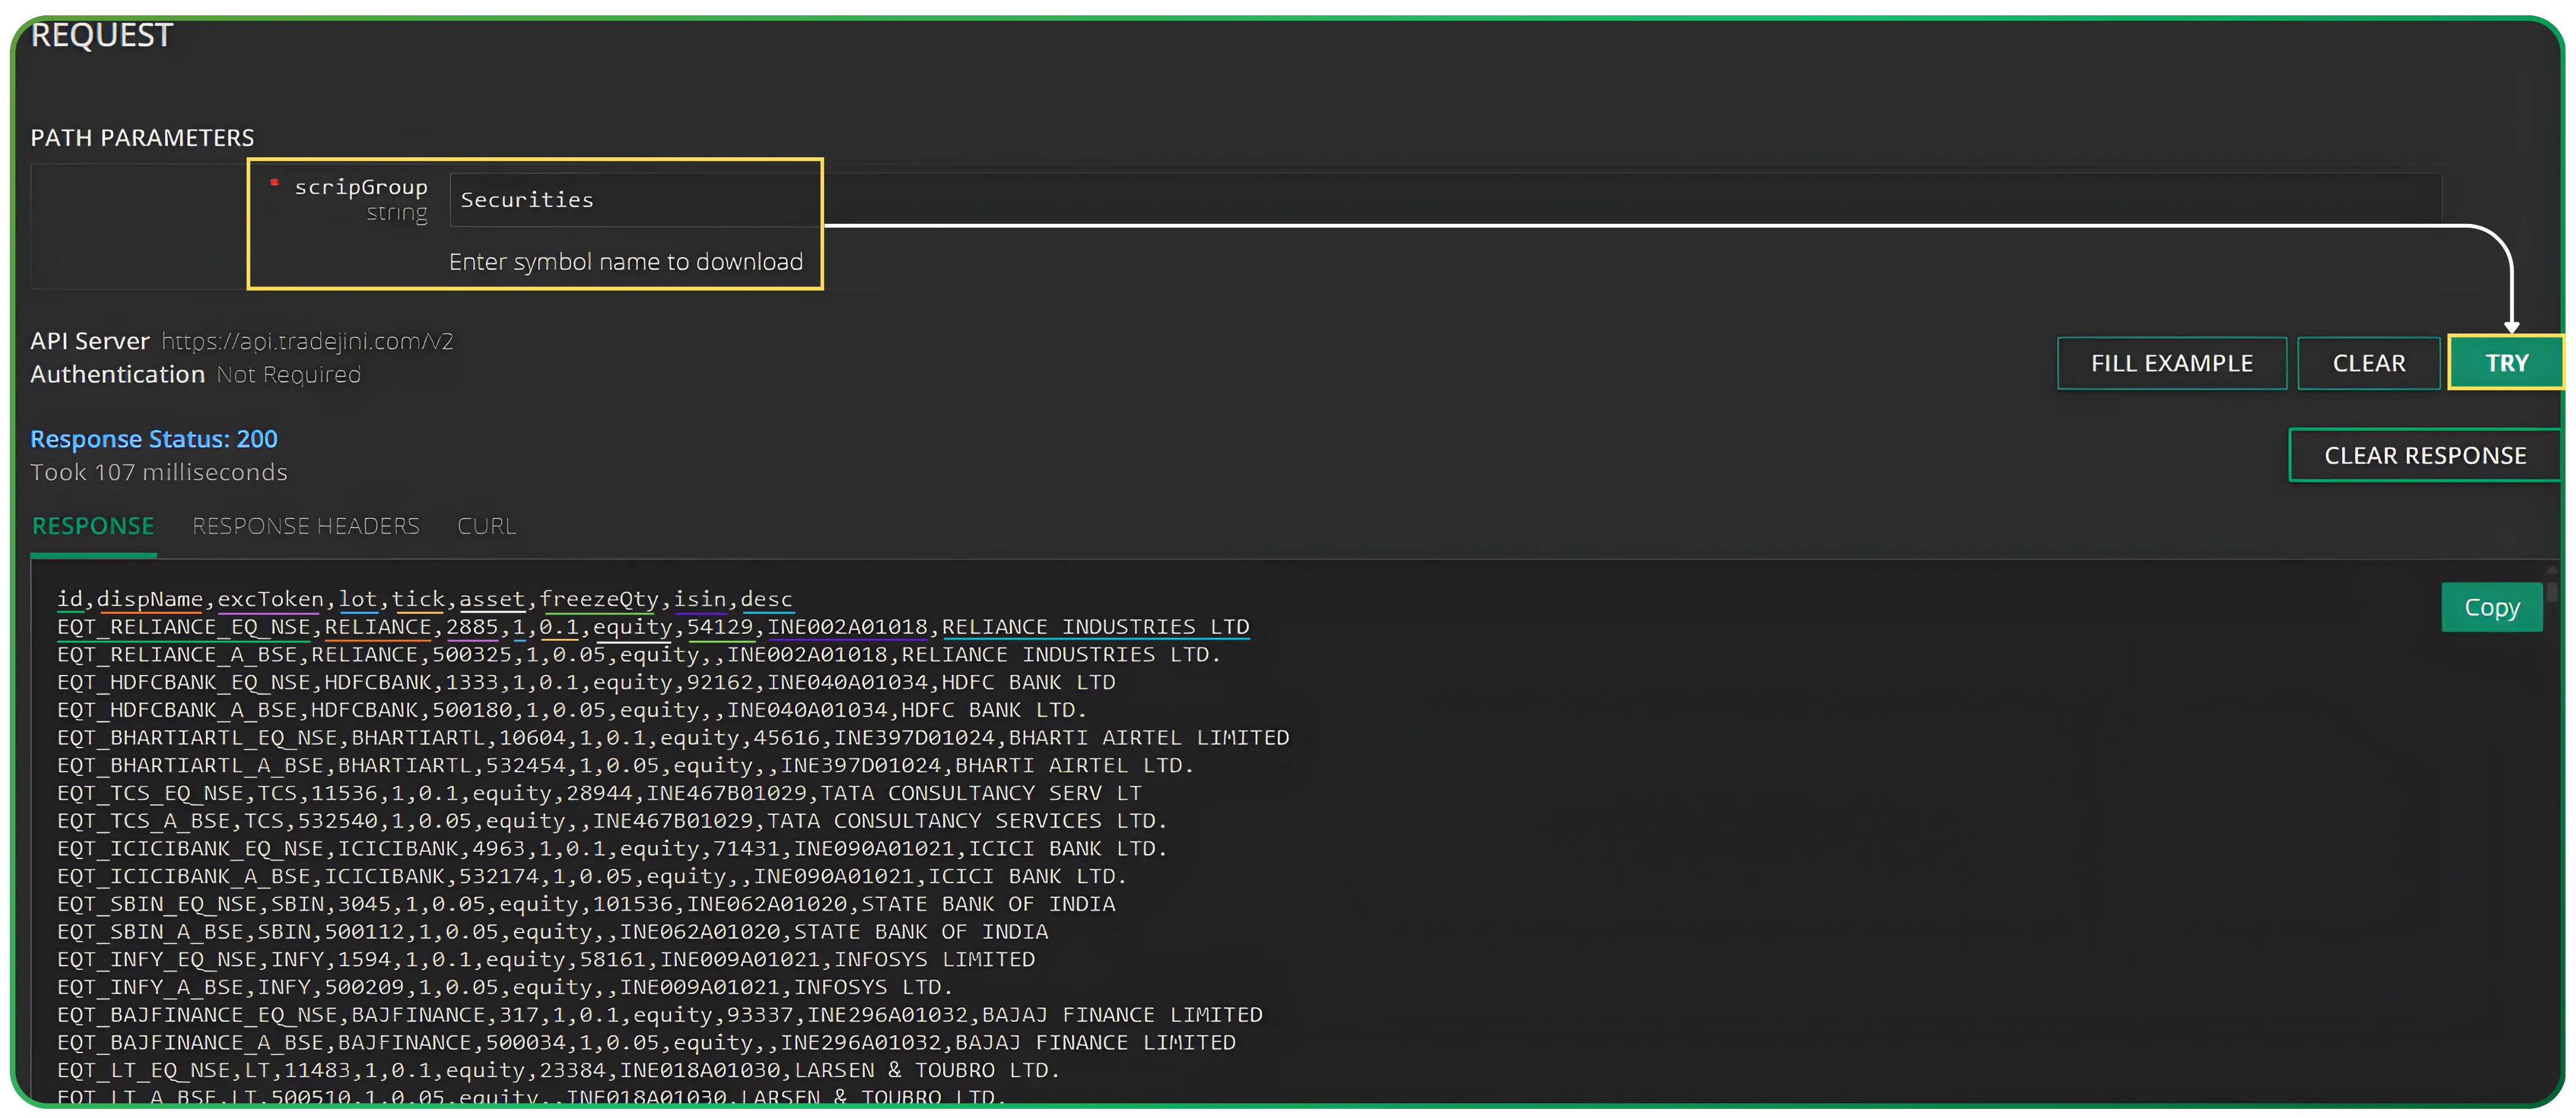
2. Scrip Master Data
Search for the specific scrip group (e.g., Securities).
- Action: Click Try to retrieve the full list of assets in that group.
- Purpose: Locate your target asset (e.g., RELIANCE) and copy the exact id string, such as
EQT_RELIANCE_EQ_NSE.
To know how to integrate Tradejni CubePlus with Algo Platforms, read Tradejini API Setup Guide For Algo Platforms
Phase 3: Fetching Historical Data
Once you have the authenticated session and the correct Symbol ID, you can use the Interval Chart service.
API Endpoint:
GET /api/mkt-data/chart/interval-data
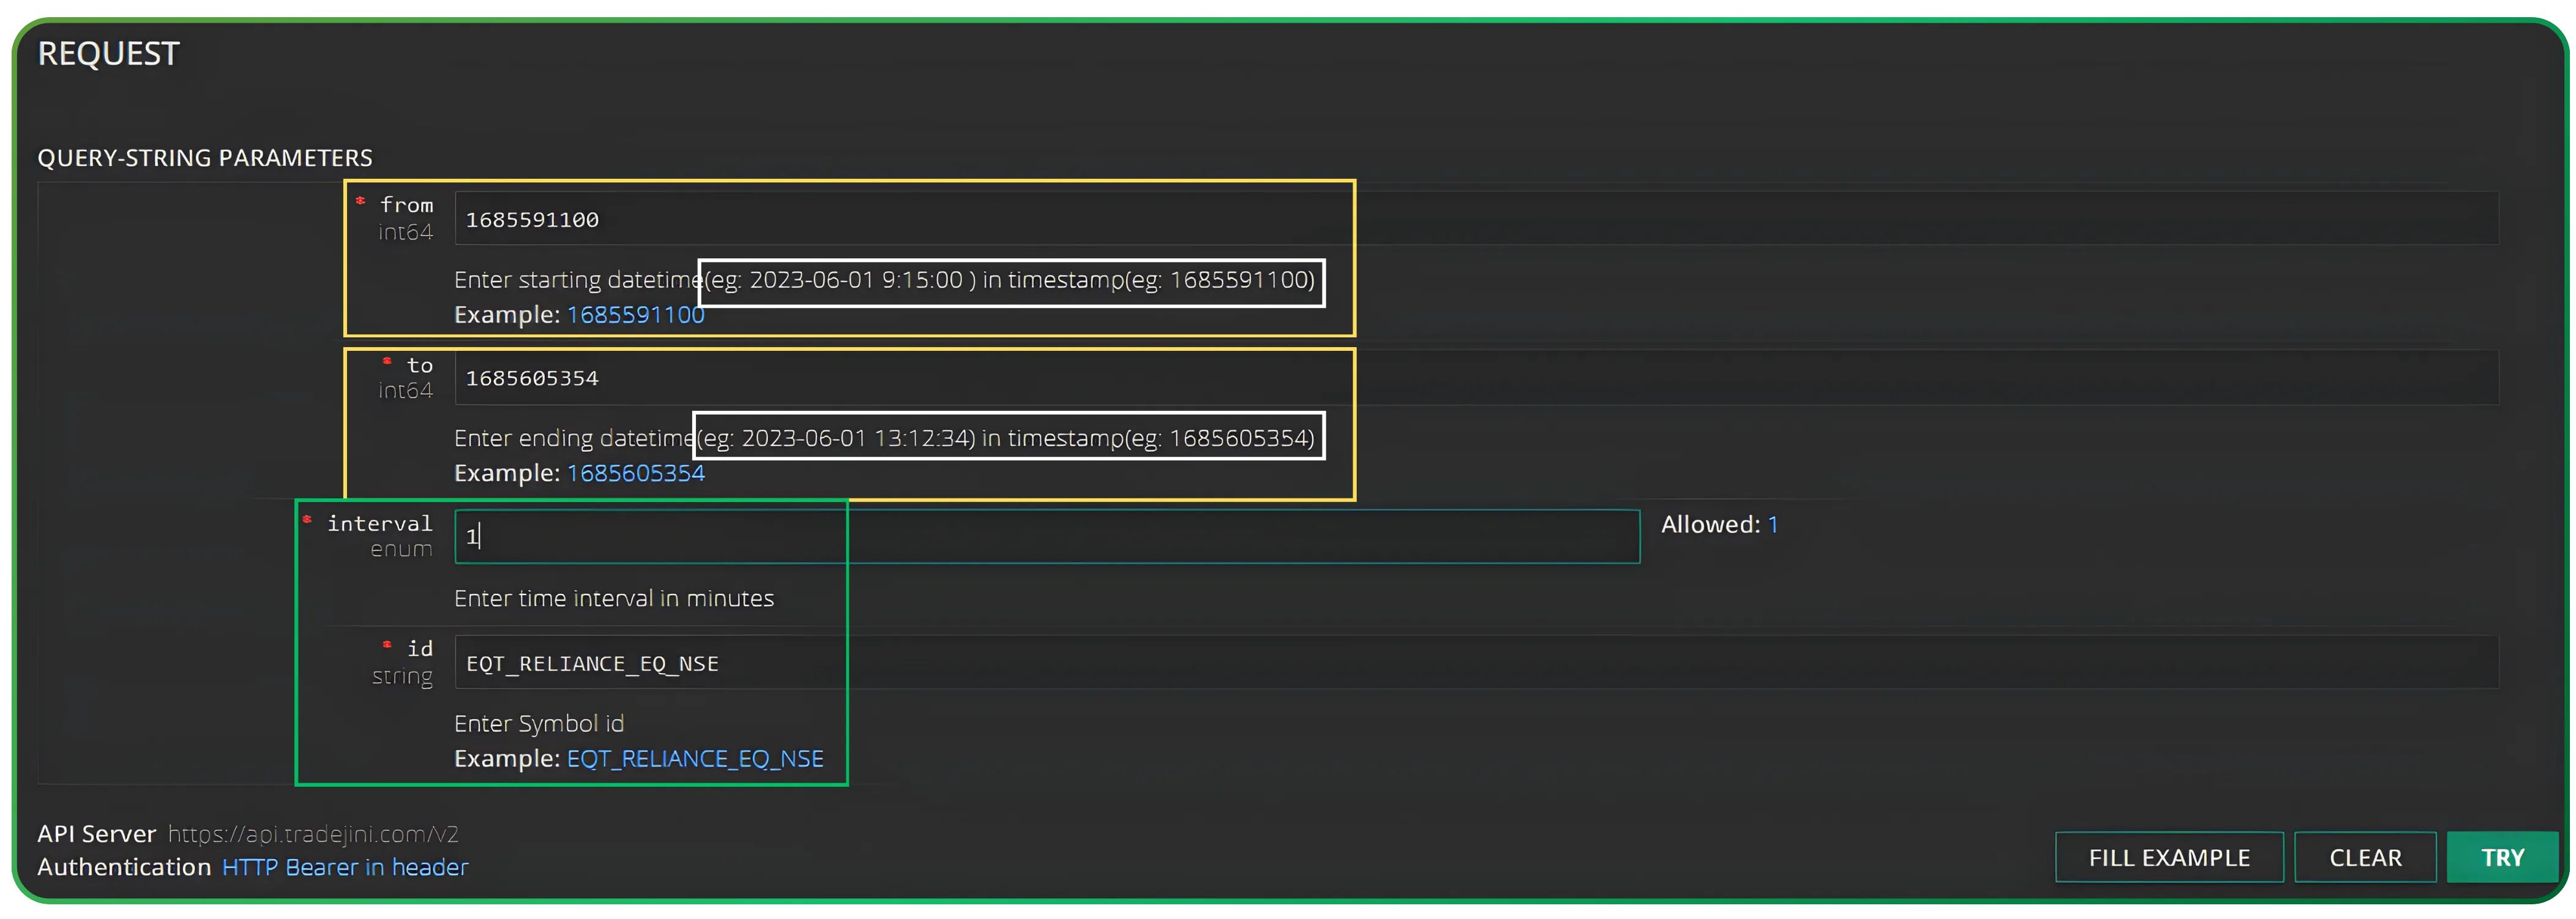
Required Query Parameters:
- id: The Symbol ID obtained from the Scrip Master (e.g., EQT_RELIANCE_EQ_NSE).
- from: The starting date and time in Unix Timestamp format (e.g., 1685591100).
- to: The ending date and time in Unix Timestamp format (e.g., 1685605354).
- interval: The time duration for each data point in minutes (e.g., 1, 5, 15).
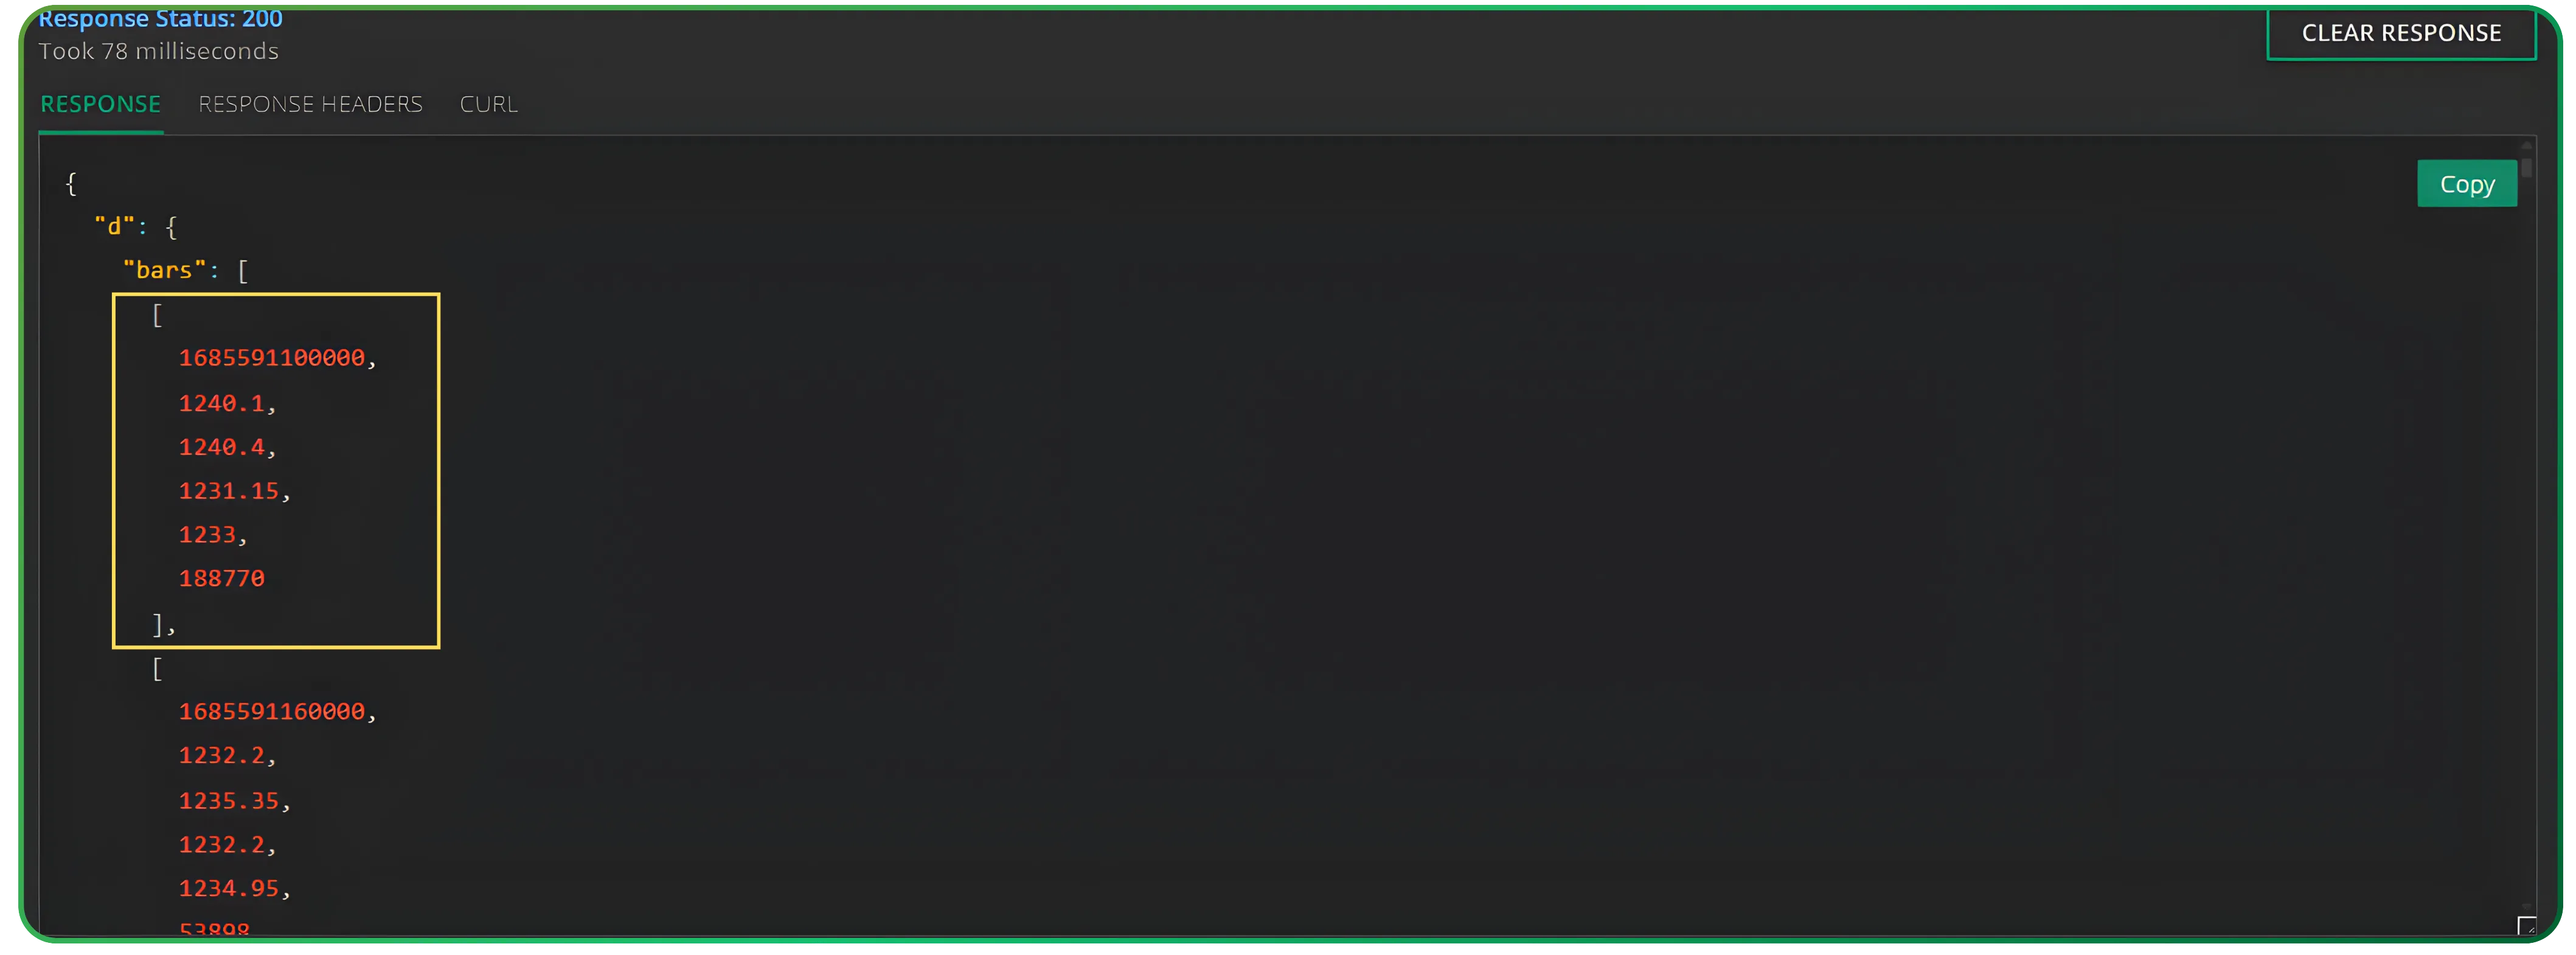
Output:
Clicking Try will return a JSON response containing:
- OHLCV Data: Open, High, Low, Close, and Volume for each interval.
- Open Interest (OI): For derivative symbols, an additional field for "Open Interest Change" is included in the response array.
Technical Summary
- Authenticate daily to obtain a Bearer Token.
- Query Scrip Master to find the precise Symbol ID for your asset.
- Execute Interval Chart request using Unix timestamps and the chosen minute interval.
By following this workflow, you can programmatically integrate historical market data into your trading applications or data analysis pipelines.
Open an account with Tradejini CubePlus and enjoy the free API access. Click the link to join and stay tuned for more Algo related articles and videos using our Tradejini API
Disclaimer: The information provided in our blogs is for informational purposes only and should not be construed as financial, investment, or trading advice. Trading and investing in the securities market carries risk. Always conduct your own research and consult with a qualified financial advisor before making any investment decisions. Past performance is not indicative of future results. Copyrighted and original content for your trading and investing needs.
© 2025 — Tradejini. All Rights Reserved.