


In the ever-evolving landscape of technical analysis, traders continuously seek indicators that adapt to market volatility while minimizing false signals. Two such tools that have gained traction among experienced traders are the McGinley Dynamic indicator and the Majority Rule oscillator. When used in combination, these indicators can provide a robust framework for identifying high-probability trading opportunities.
In this article, we'll explore how these indicators work, why they're particularly effective together, and how Tradejini's CubePlus platform enables traders to leverage these advanced charting tools for better decision-making.
Understanding the McGinley Dynamic Indicator
The McGinley Dynamic, developed by John R. McGinley in 1990, was designed to address a fundamental flaw in traditional moving averages—their inability to adjust to varying market speeds. Unlike simple or exponential moving averages that use fixed smoothing constants, the McGinley Dynamic automatically adjusts its speed based on market volatility.
The McGinley Dynamic tracks price more closely during trending markets while avoiding the whipsaws that plague traditional moving averages during consolidation periods. This self-adjusting characteristic makes it particularly valuable for traders who want a single indicator that works across different market conditions.
The mathematical formula incorporates a smoothing factor that changes based on the relationship between the current price and the previous McGinley Dynamic value. When price moves rapidly, the indicator speeds up to follow. When markets consolidate, it slows down to filter out noise. This adaptive behavior is what distinguishes it from conventional moving averages.
The McGinley Dynamic indicator can be used similarly to traditional moving averages for trend identification. When price trades above the McGinley Dynamic, it suggests an uptrend. When the price falls below, it indicates a downtrend. However, the real power emerges when combining it with complementary indicators that confirm momentum and trend strength.
The Majority Rule Indicator: Measuring Market Consensus
The Majority Rule is a momentum oscillator that measures the "agreement" or "consensus" among different price action components. While less widely known than mainstream oscillators like RSI or MACD, the Majority Rule provides unique insights into market strength by evaluating whether the majority of trend components are aligned in the same direction.
Majority Rule typically oscillates between values that indicate strong bullish consensus (higher readings) and strong bearish consensus (lower readings). The middle range suggests indecision or mixed signals across different timeframes or price components.
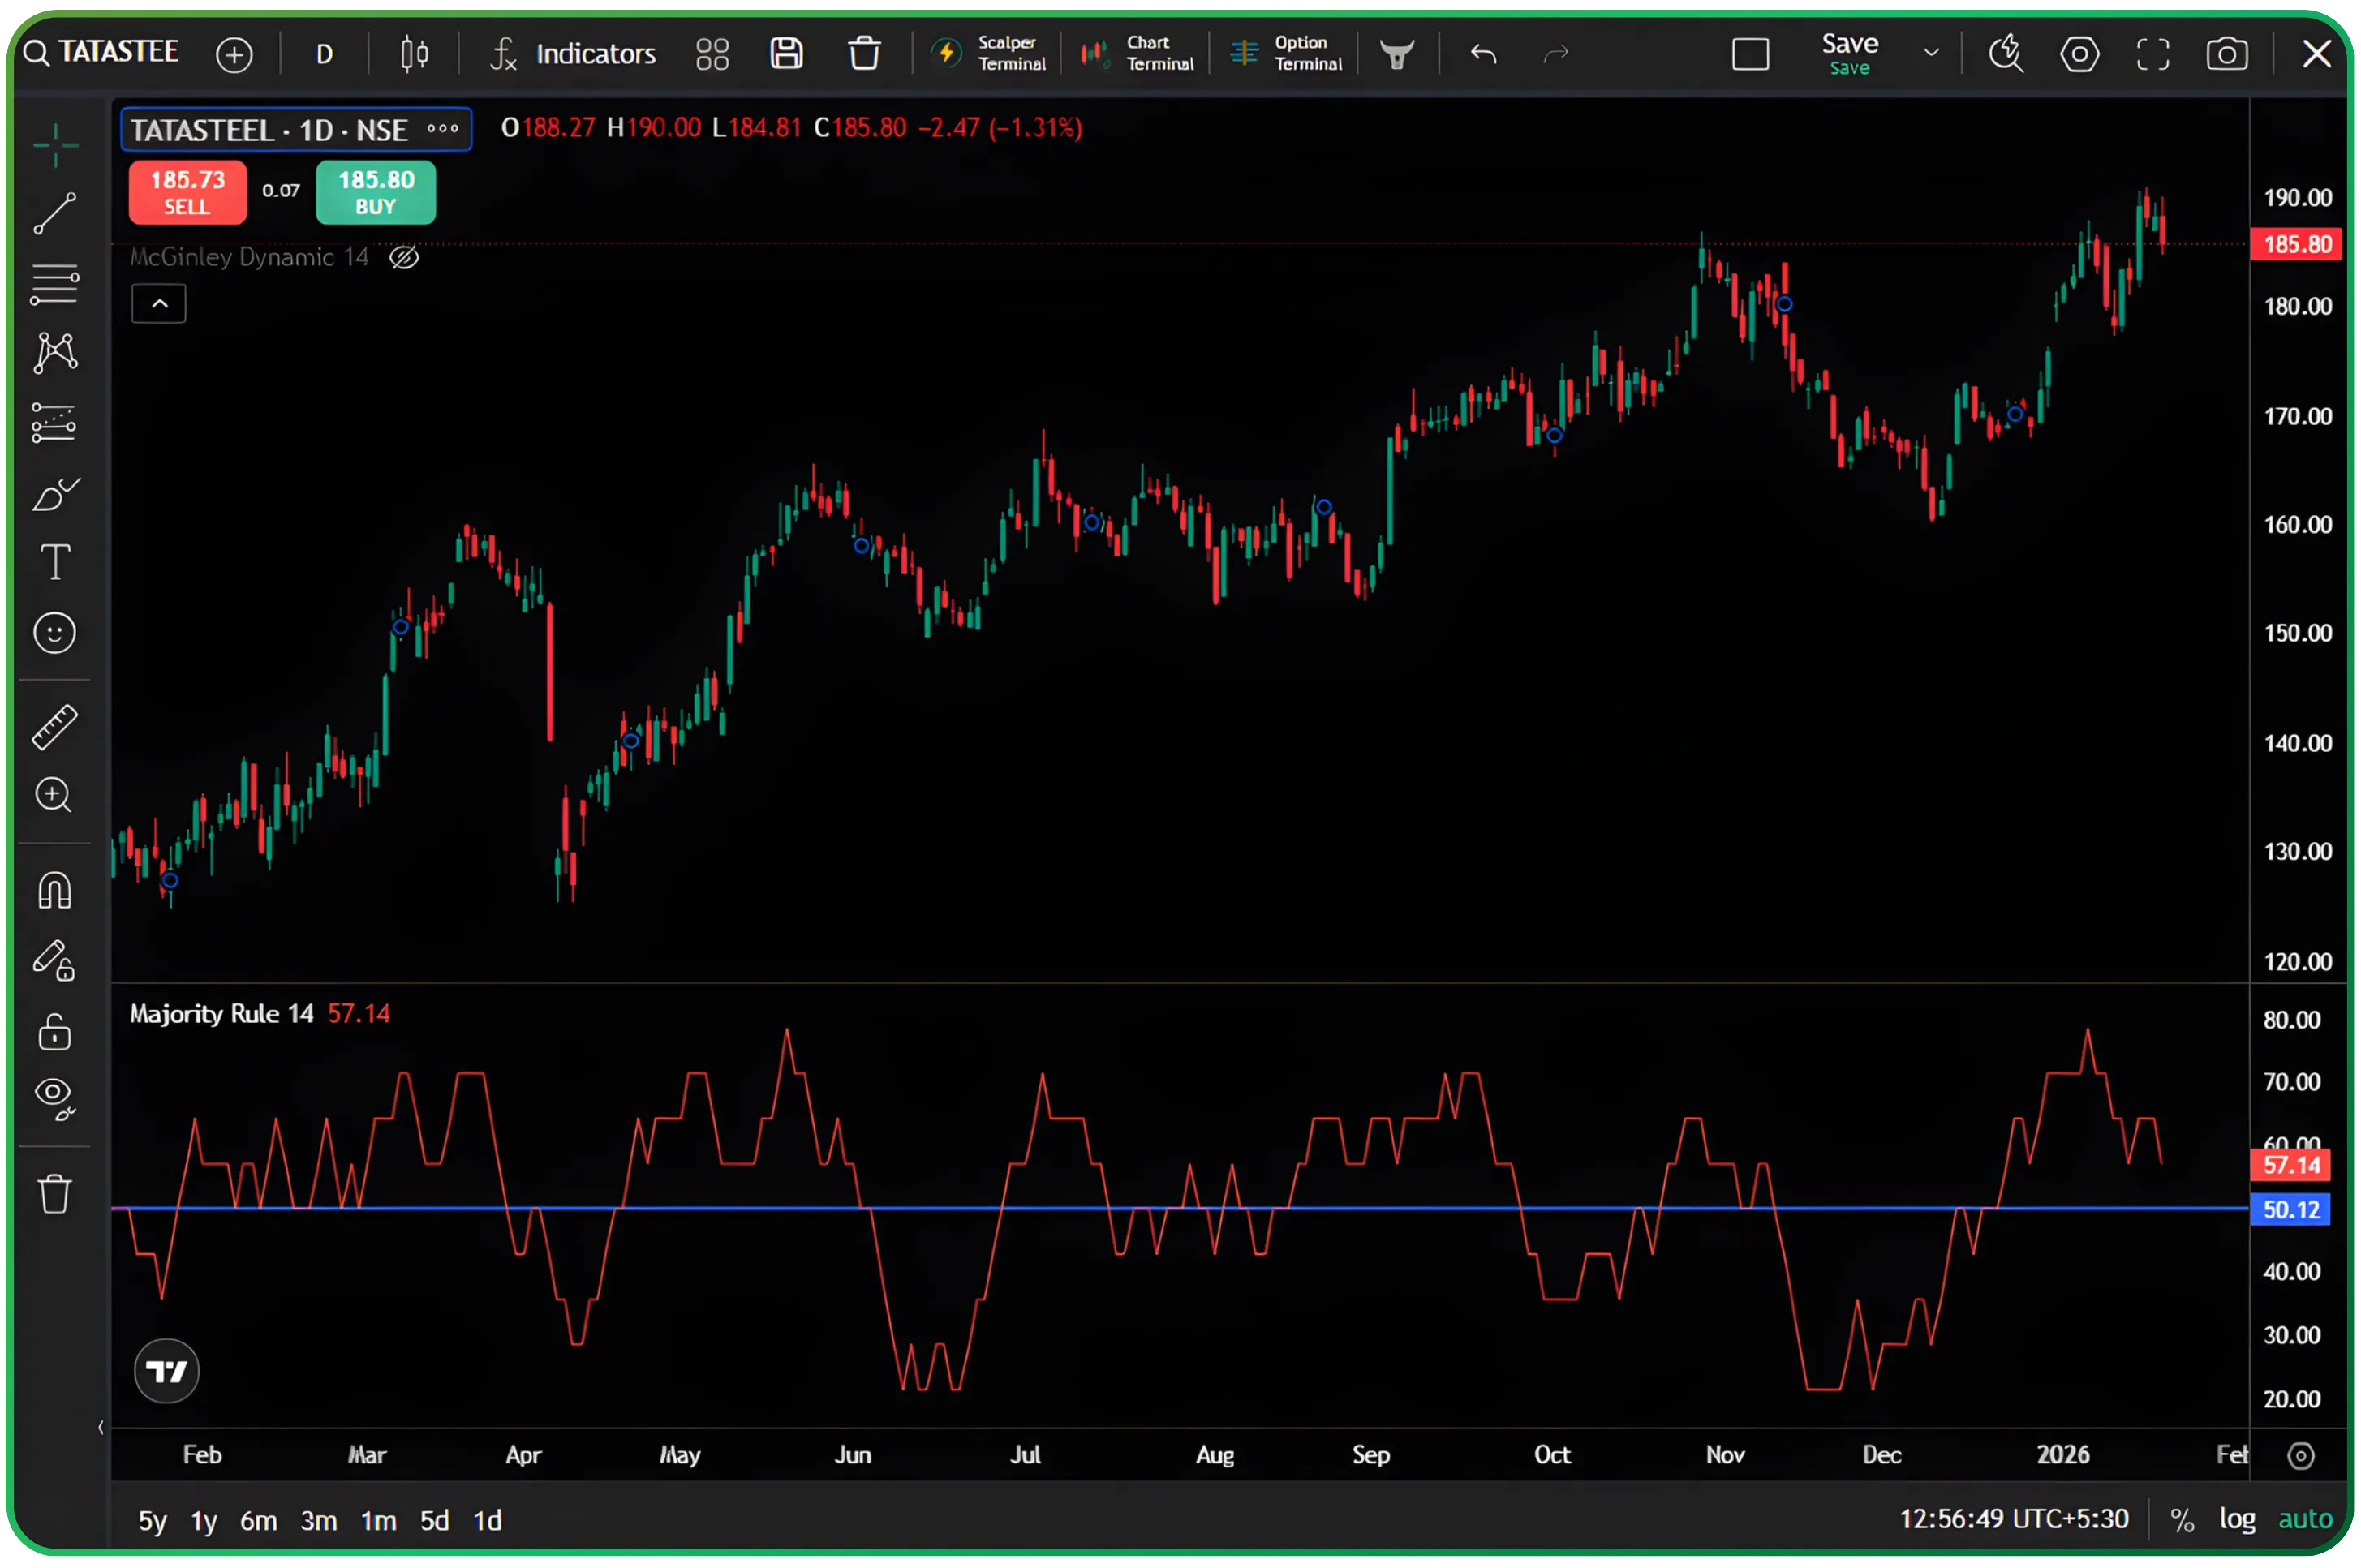
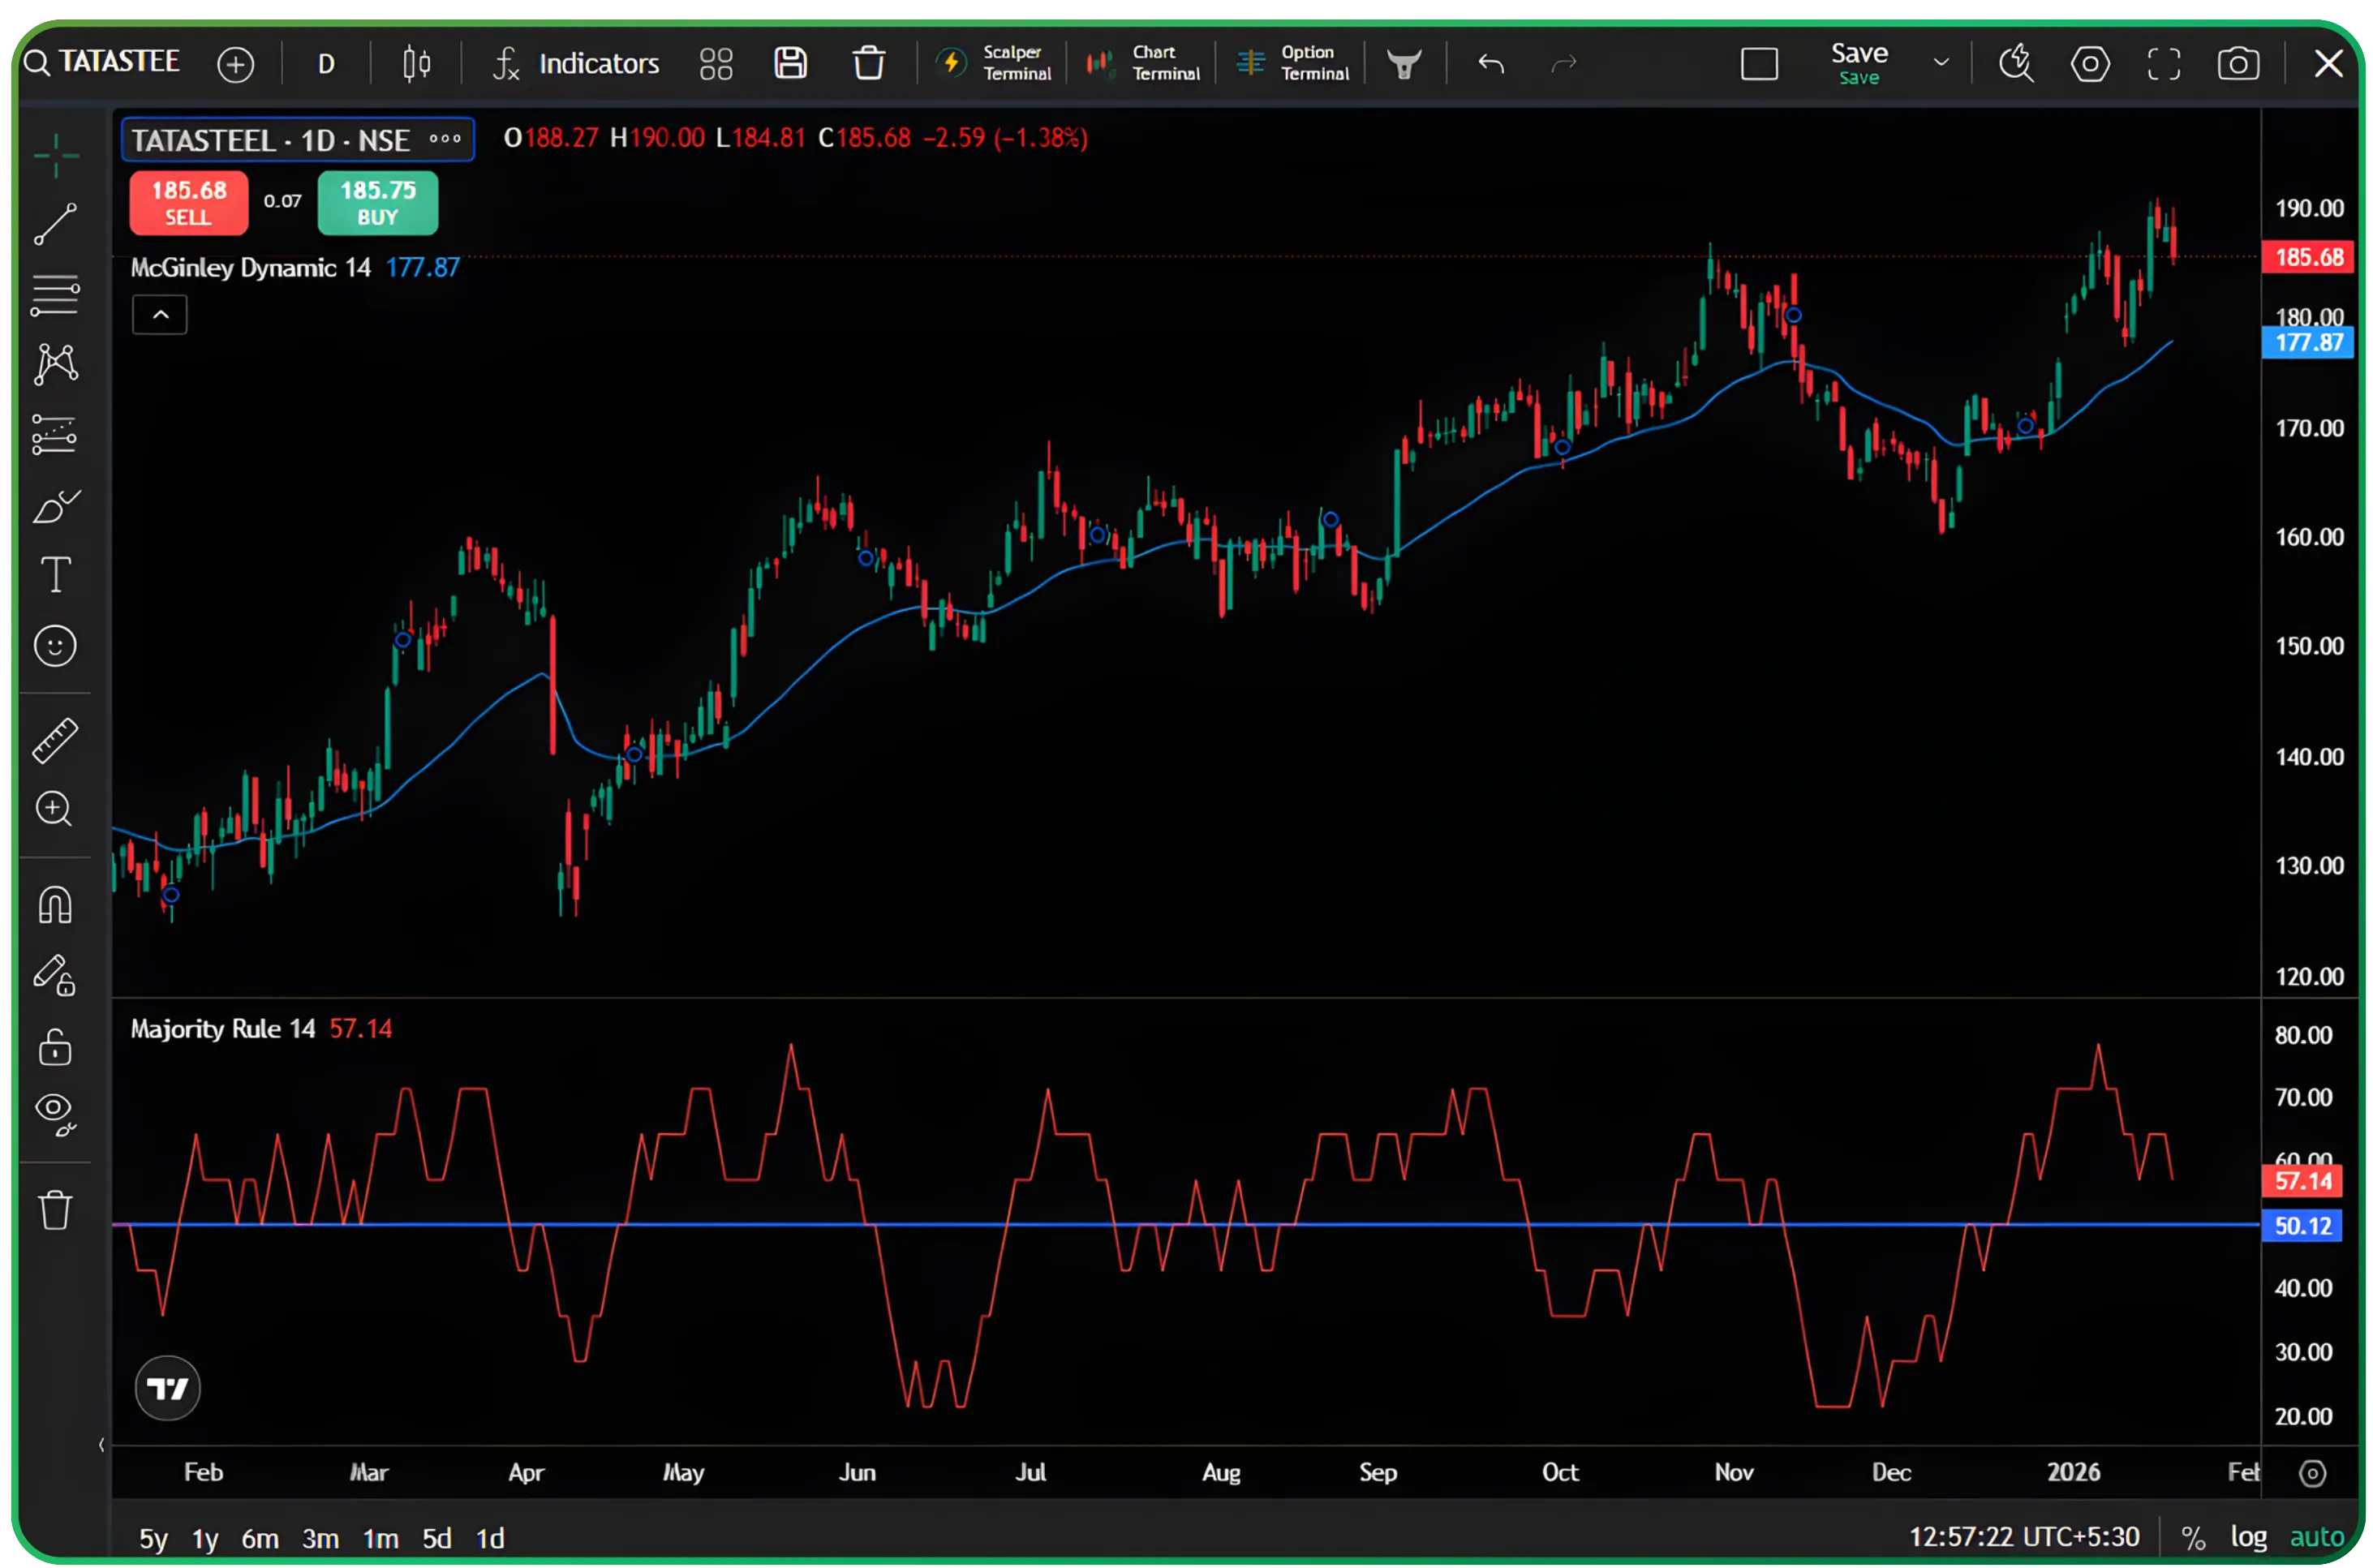
Looking at the Tata Steel chart, we can observe the Majority Rule indicator in the lower panel. The oscillator fluctuates between approximately 20 and 80, with a reference line typically around 50. When the indicator rises above 50, it suggests that the majority of measured components are bullish. When it falls below 50, bearish forces dominate. Extreme readings near 80 or above indicate very strong bullish consensus, while readings near 20 or below signal strong bearish alignment.
The value of the Majority Rule lies in its ability to confirm whether a trend identified by price action or other indicators has broad-based support across multiple analytical dimensions. A strong uptrend accompanied by rising Majority Rule readings suggests genuine momentum, while a price advance with declining or low Majority Rule values may indicate a weak move prone to reversal.
The McGinley Dynamic Indicator is often used in conjunction with other indicators, such as the relative strength index (RSI) and moving average convergence divergence (MACD), for additional confirmation. Traders should use the McGinley Dynamic indicator in conjunction with other indicators for confirmation.
Combining McGinley Dynamic and Majority Rule: A Synergistic Approach
The true power of technical analysis often emerges not from any single indicator but from the intelligent combination of complementary tools. The McGinley Dynamic and Majority Rule work exceptionally well together because they address different aspects of market behavior—trend direction and momentum consensus.
Trend Identification with McGinley Dynamic
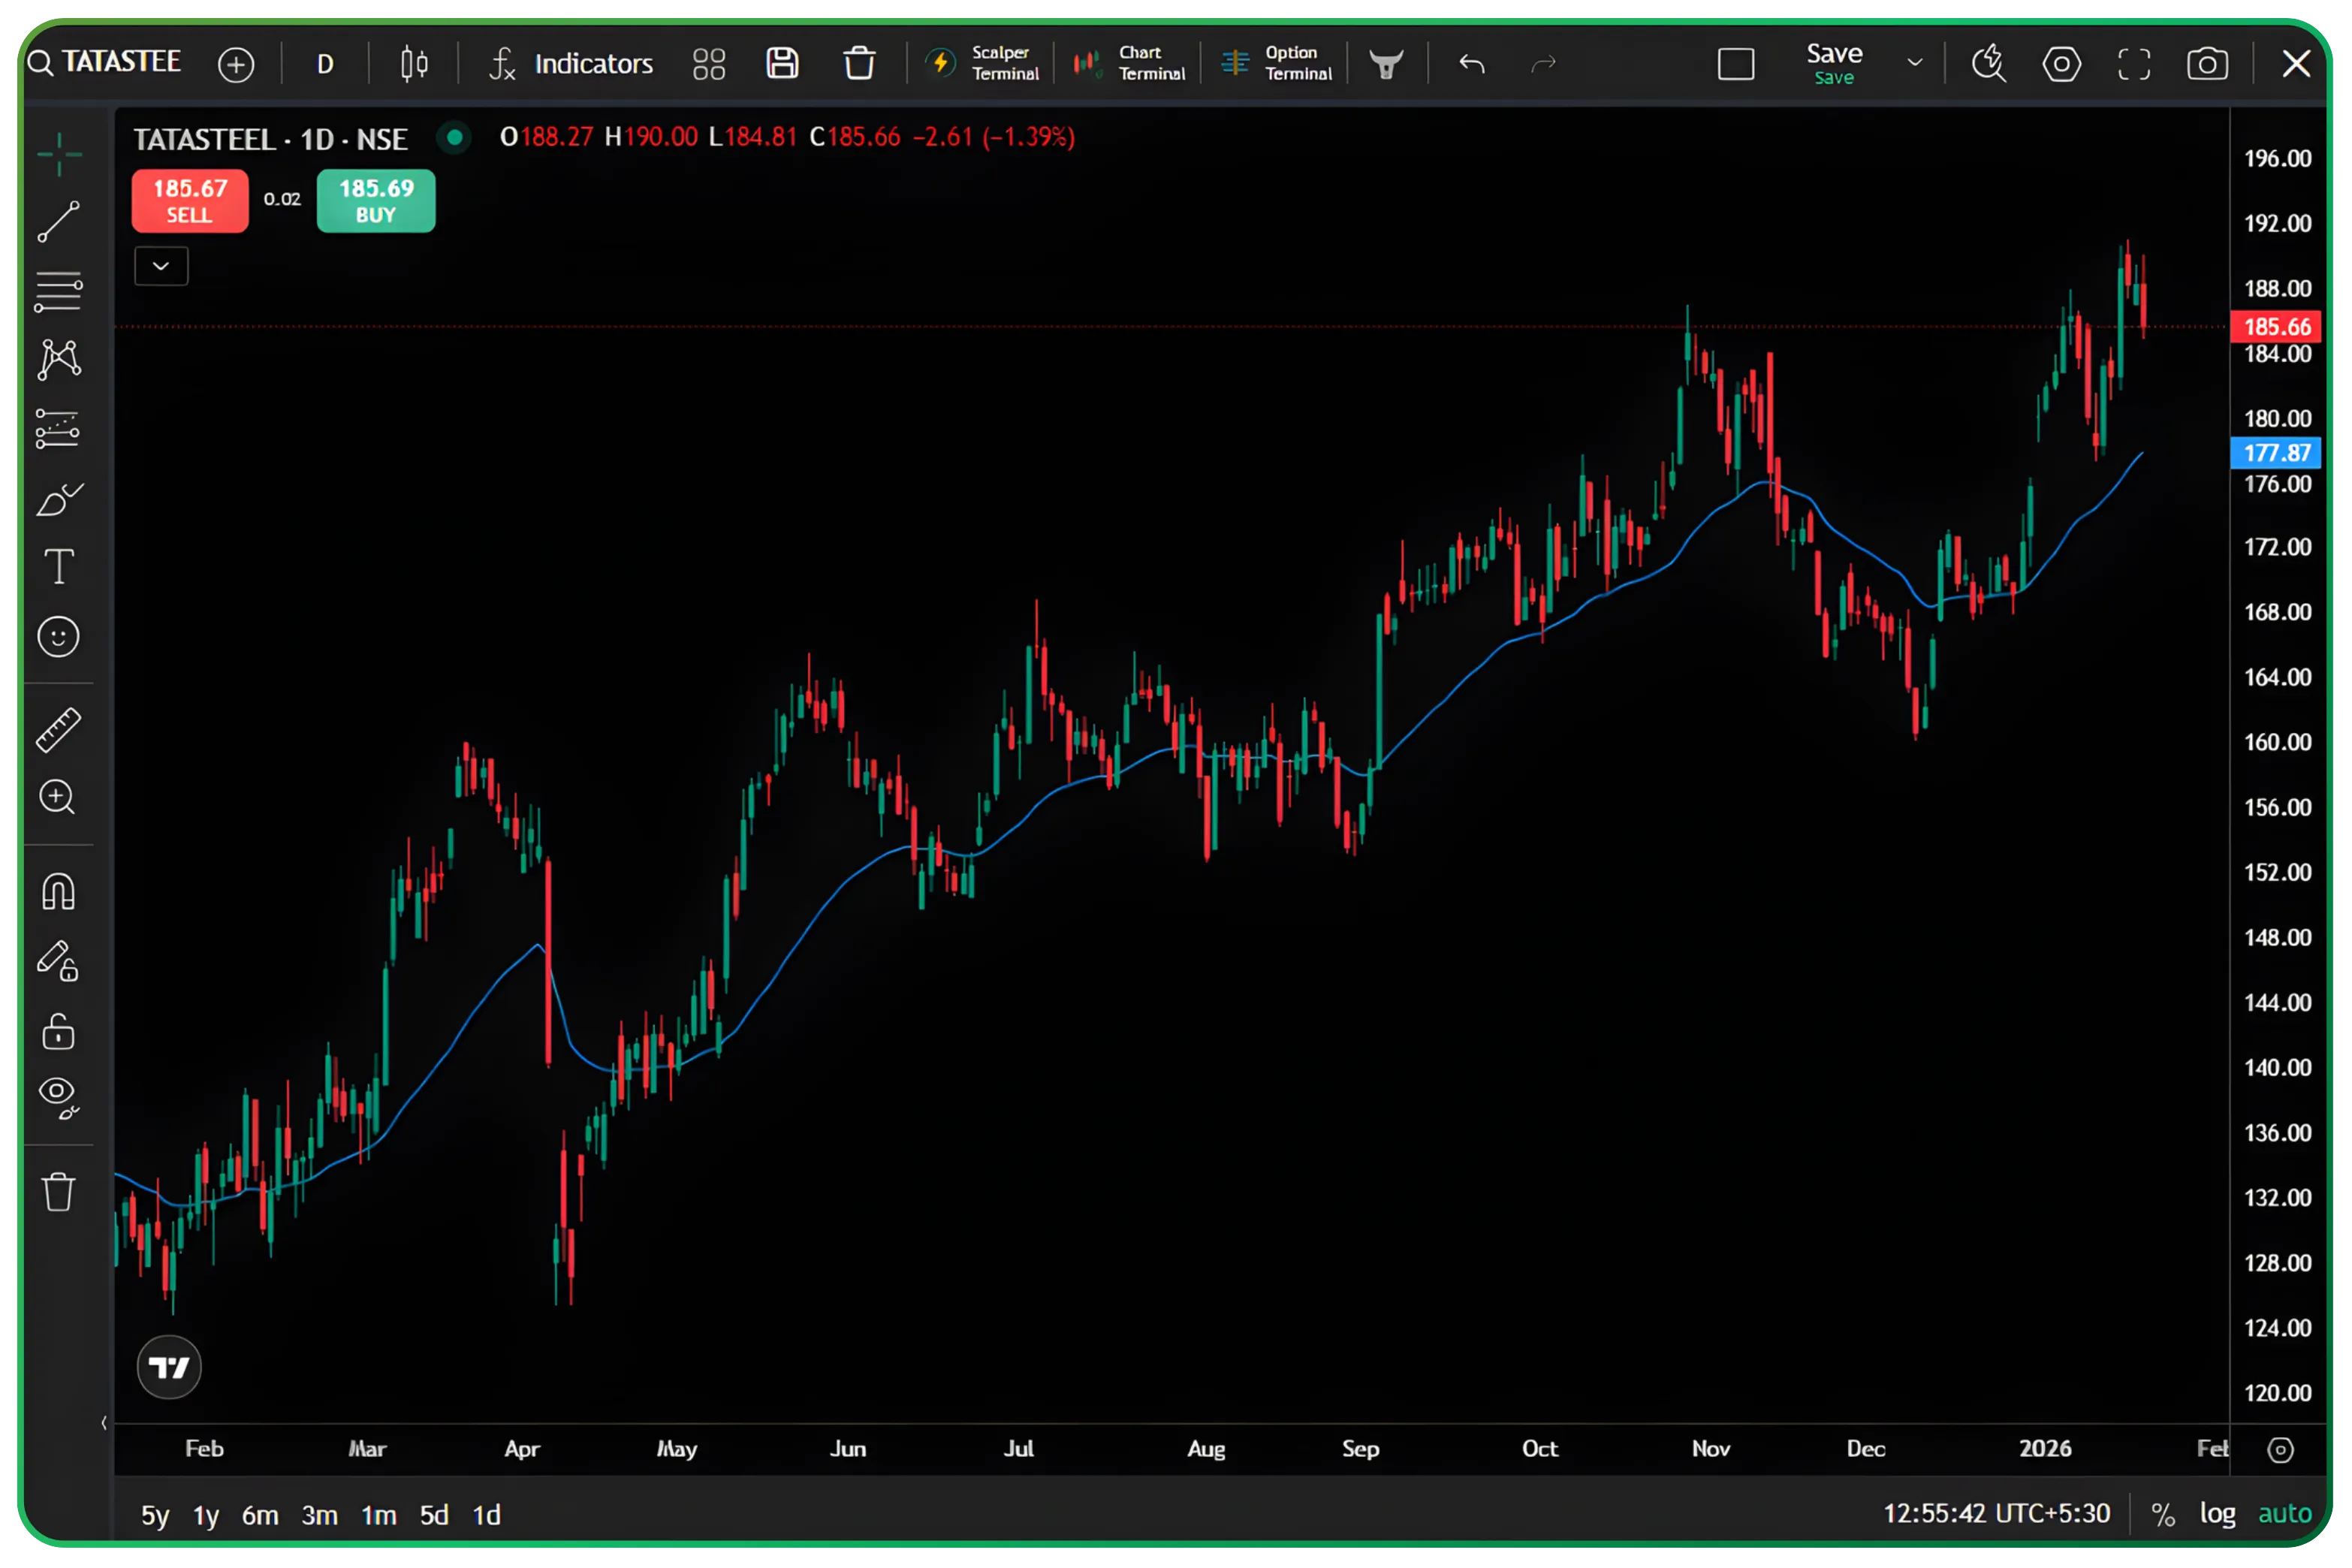
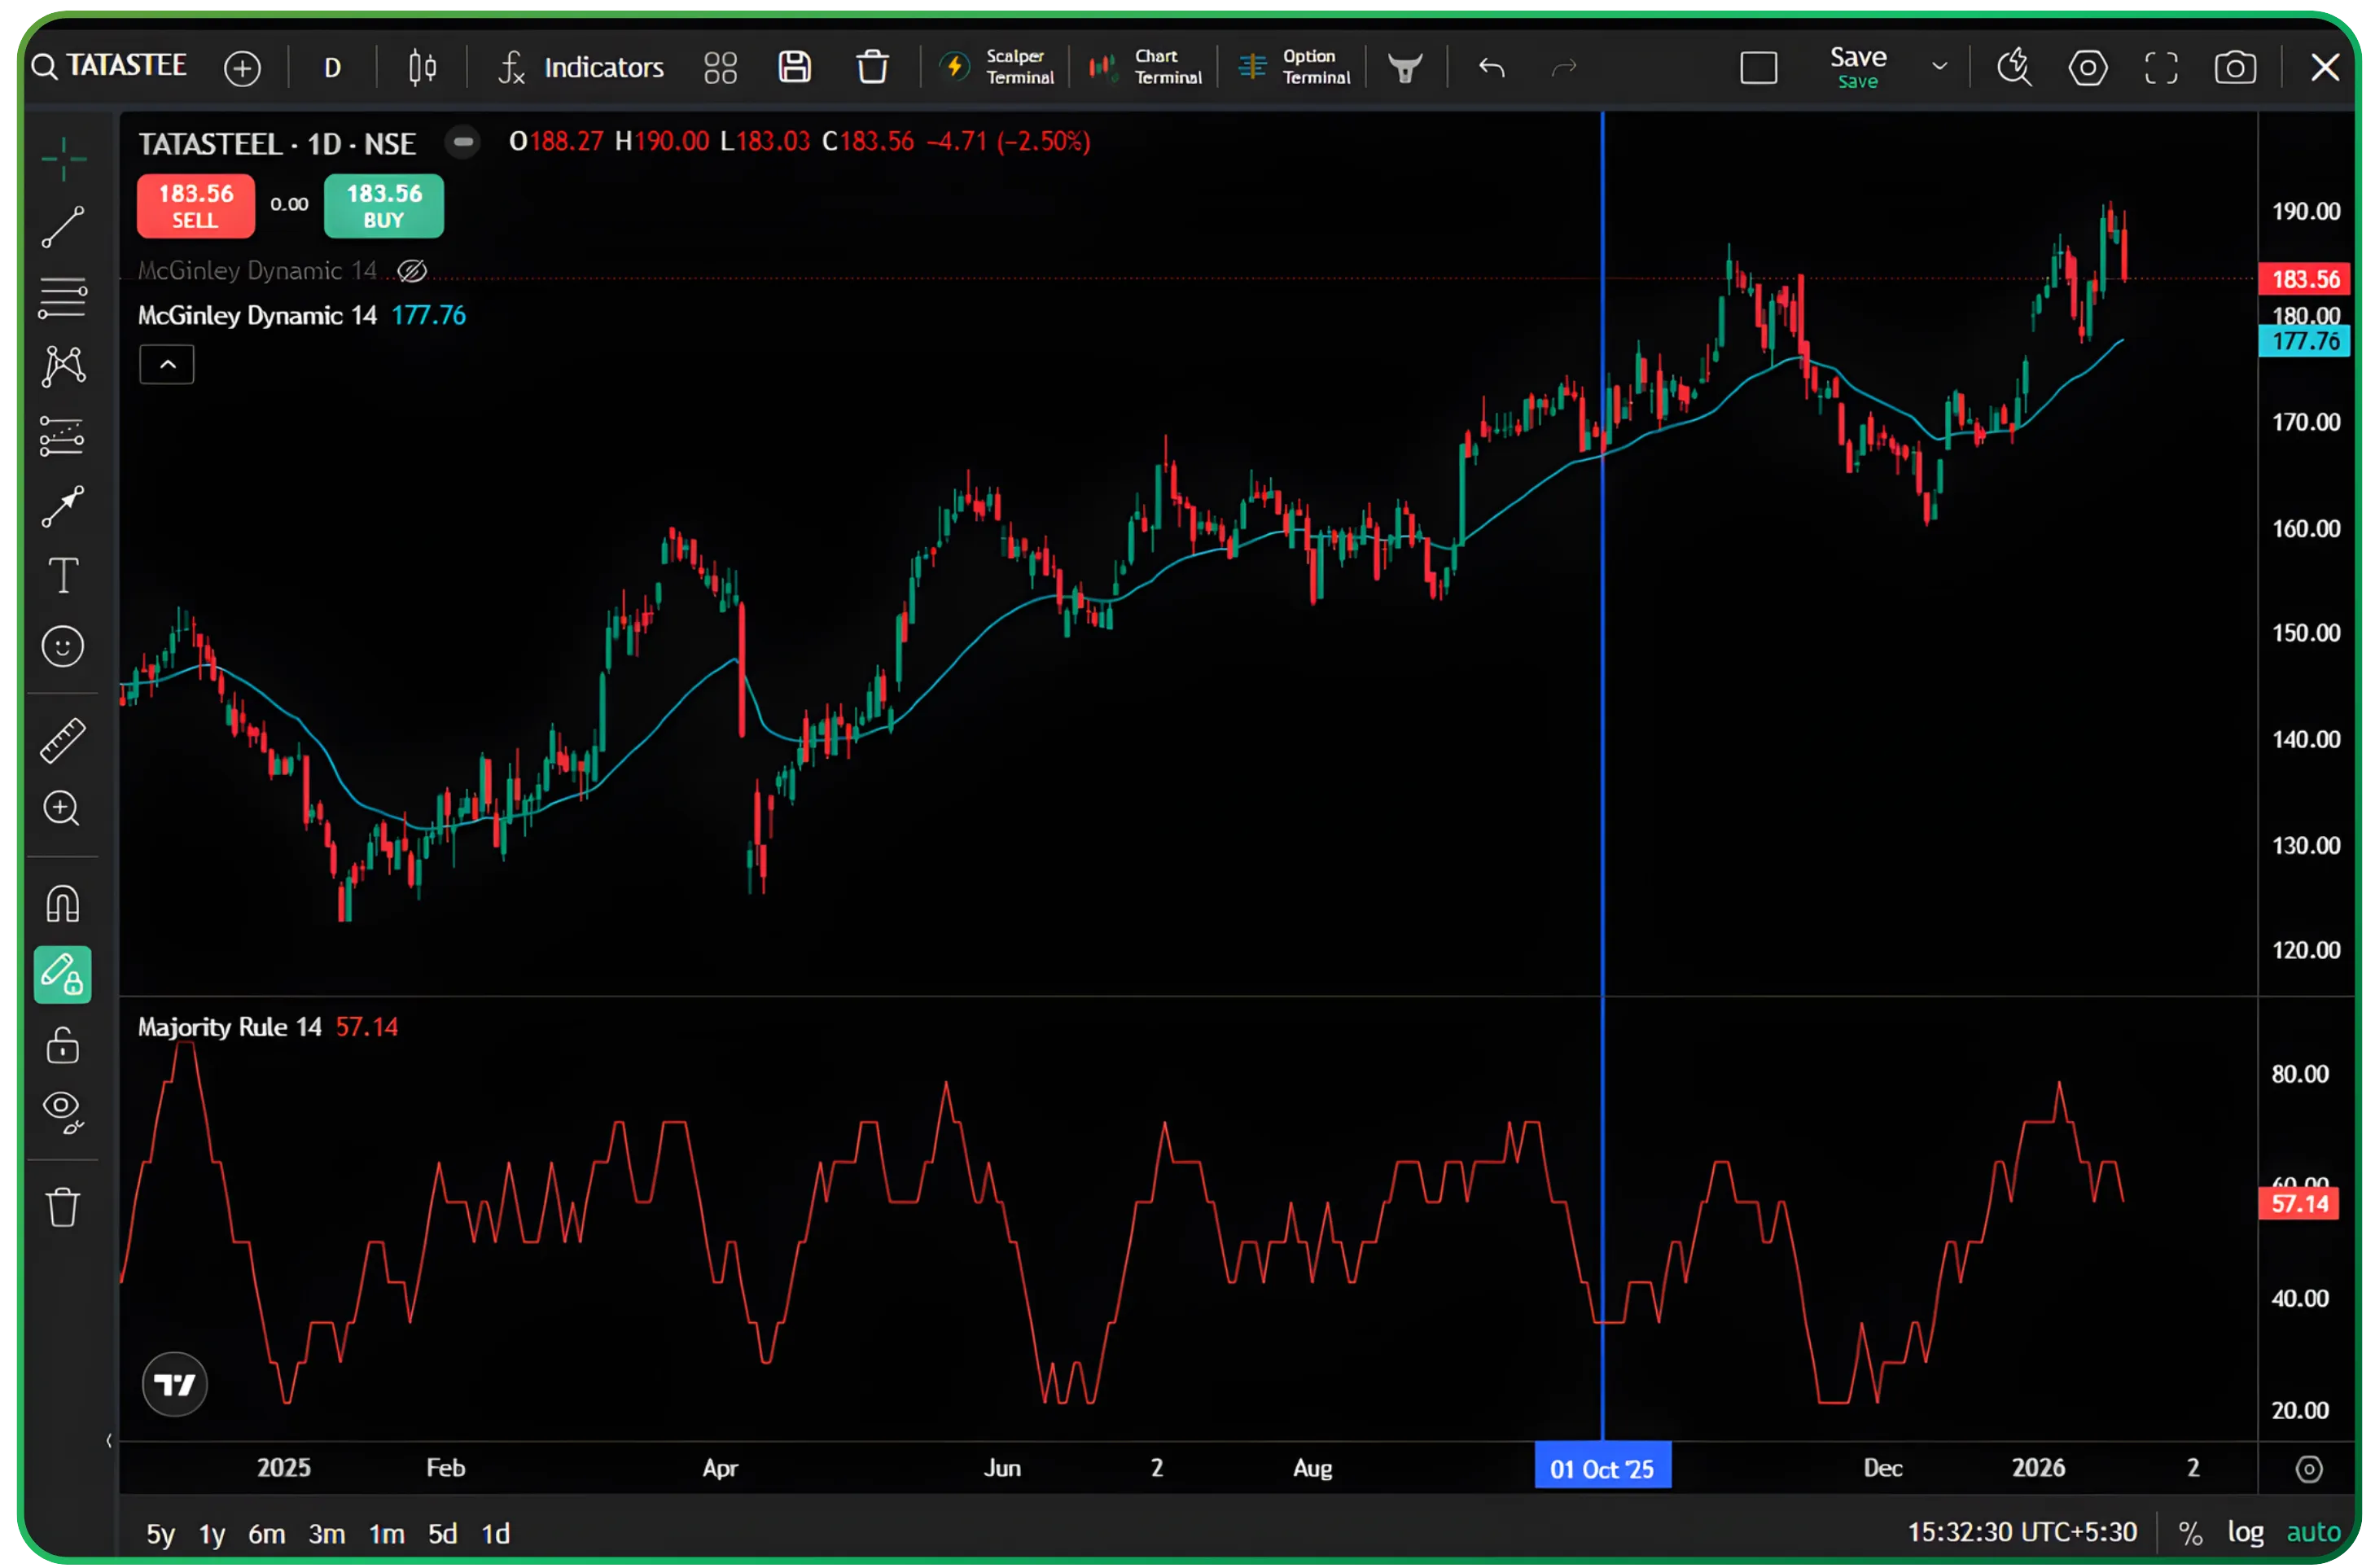
The first step in this approach involves using the McGinley Dynamic to establish the primary trend direction. In the Tata Steel chart, we can see the blue line representing the McGinley Dynamic overlaid on the price chart. Throughout 2025, the price generally remained above this adaptive moving average, indicating a sustained uptrend despite several corrections along the way.
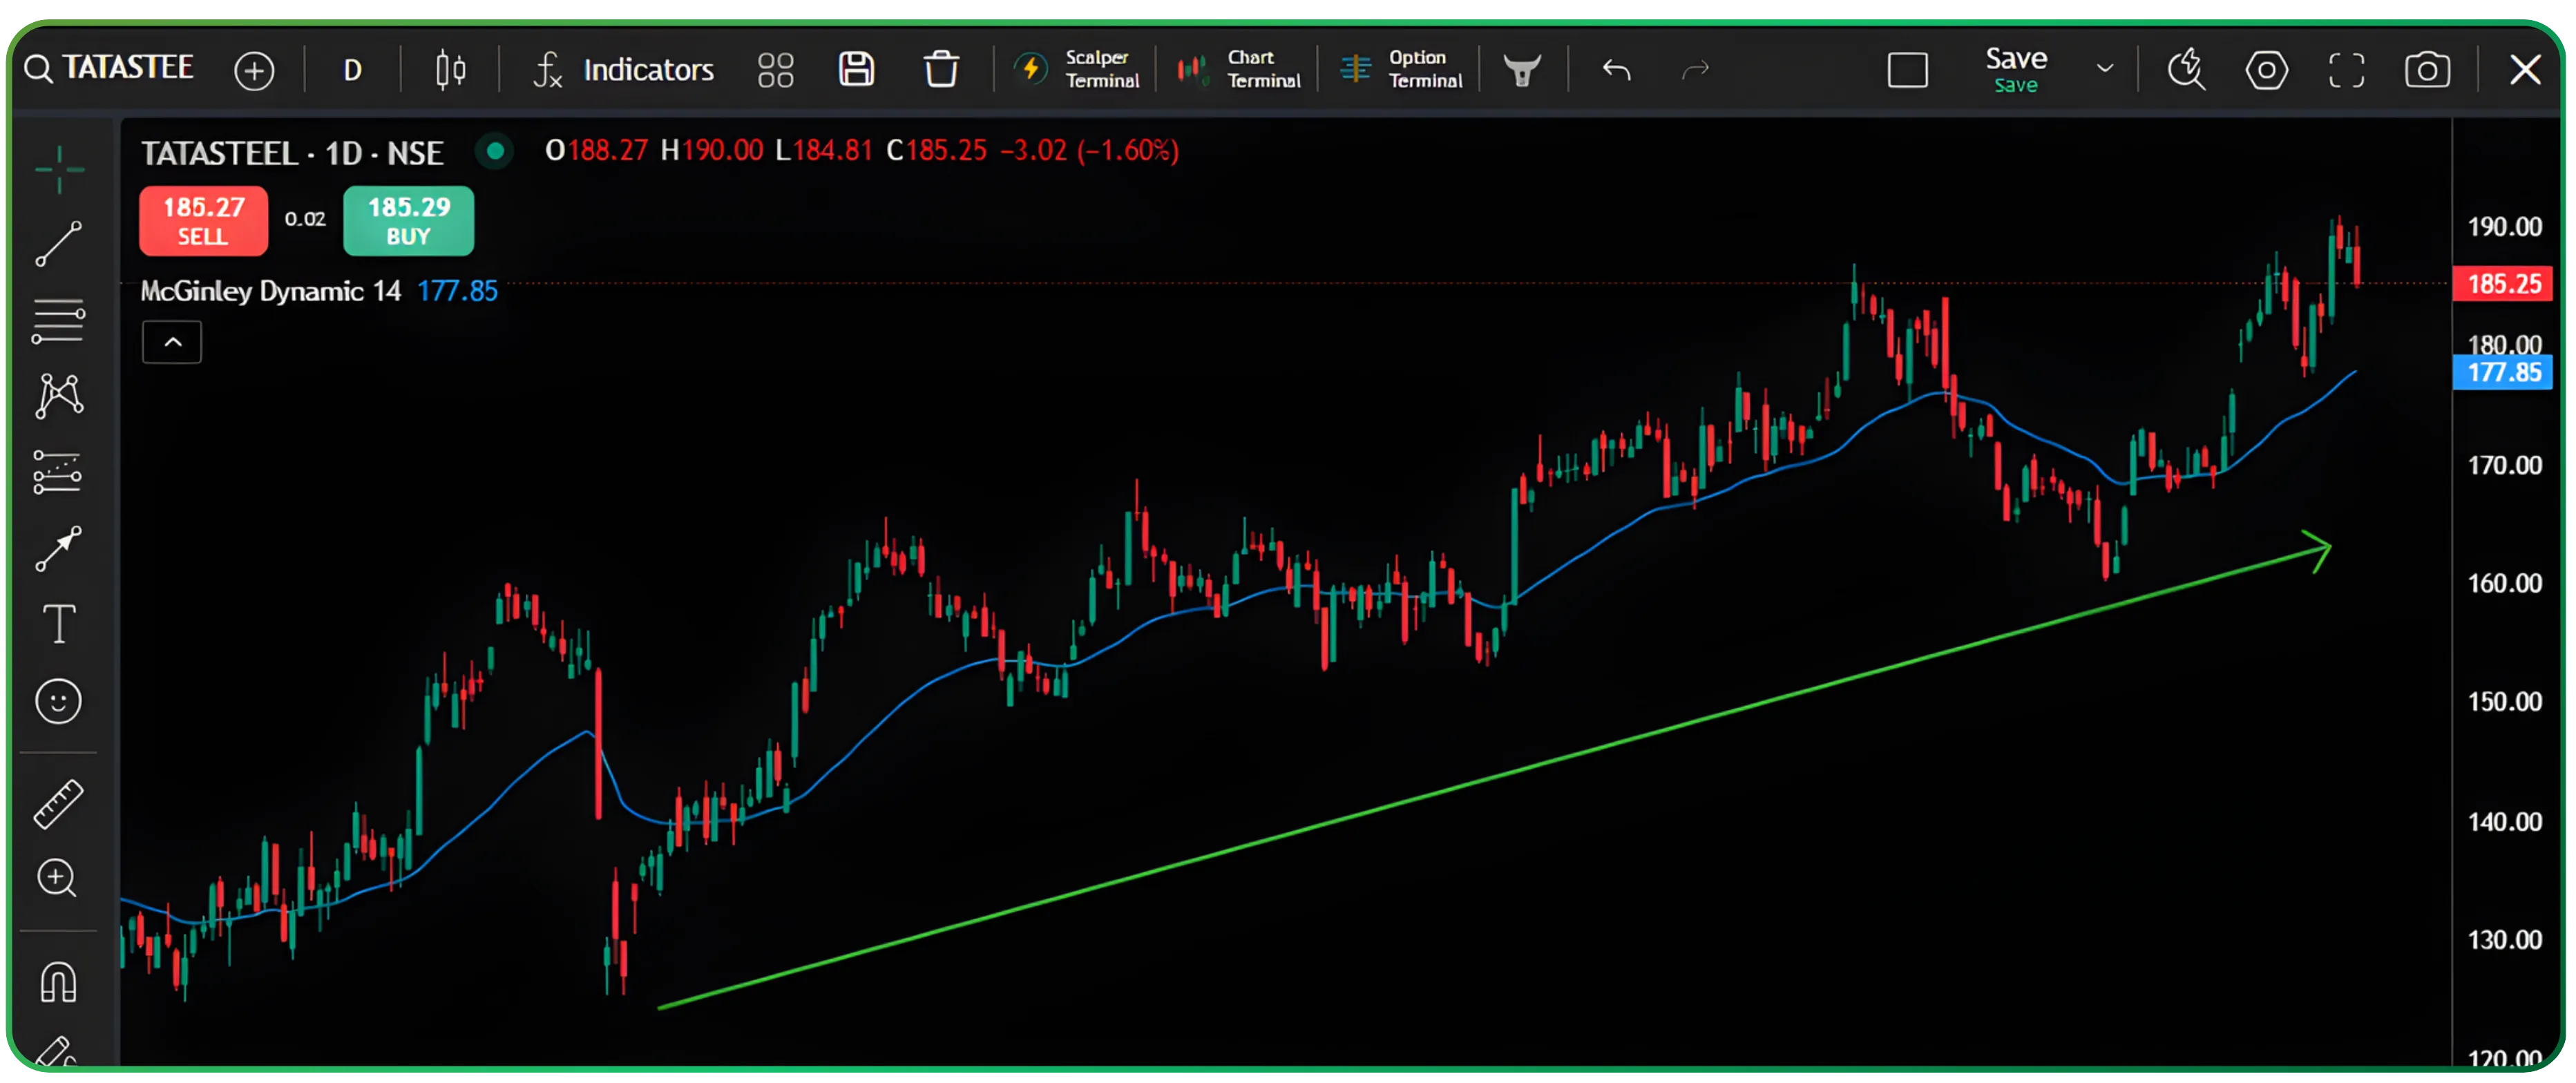
The beauty of the McGinley Dynamic is evident in how it navigates the volatile periods visible in the chart, particularly around April and again in October-November. Unlike a traditional moving average that might have generated multiple crossover signals during these choppy periods, the McGinley Dynamic smoothly tracked the underlying trend while filtering much of the noise.
When price trades consistently above the McGinley Dynamic with the line itself trending upward, traders can maintain a bullish bias. Conversely, when price falls below a declining McGinley Dynamic, a bearish stance becomes appropriate. The adaptive nature means traders don't need to constantly adjust their indicator settings as volatility changes—the McGinley Dynamic does this automatically.
Momentum Confirmation with Majority Rule
While the McGinley Dynamic tells us the direction, the Majority Rule helps us understand the strength and sustainability of that trend. This is where the combination becomes particularly powerful for timing entries and exits.
Examining the Tata Steel chart, notice how the Majority Rule behaved during the strong uptrend from September through October. As price rallied from around 155 to nearly 190, the Majority Rule consistently printed readings above 50, often reaching 60-80 range. This confirmed that the upward price movement had broad momentum support, making it a high-confidence trending environment for traders.
Contrast this with periods like late April into May, where despite price attempting to move higher, the Majority Rule repeatedly dropped to the 30-40 range. This divergence between price attempting to rally and the Majority Rule showing weak consensus foreshadowed the eventual breakdown and correction that followed. Traders using both indicators together would have recognized this as a warning sign to tighten stops or reduce position size.
Also read: Understanding Heikin Ashi Candles for Trend Trading — a simple way to smooth price action and spot trends with greater clarity, especially when combined with adaptive indicators like McGinley Dynamic.
Practical Trading Strategies
Strategy 1: Trend Following with Consensus Confirmation
This approach suits traders who prefer to ride established trends rather than attempt to catch reversals. The rules are straightforward and objective.
For long positions, traders wait for price to be trading above an upward-sloping McGinley Dynamic. This establishes the bullish trend context. Entry signals occur when the Majority Rule rises above 50 after a pullback, confirming that momentum consensus is returning to the bulls. The strongest setups occur when the Majority Rule crosses above 50 while price simultaneously bounces off or holds above the McGinley Dynamic line.
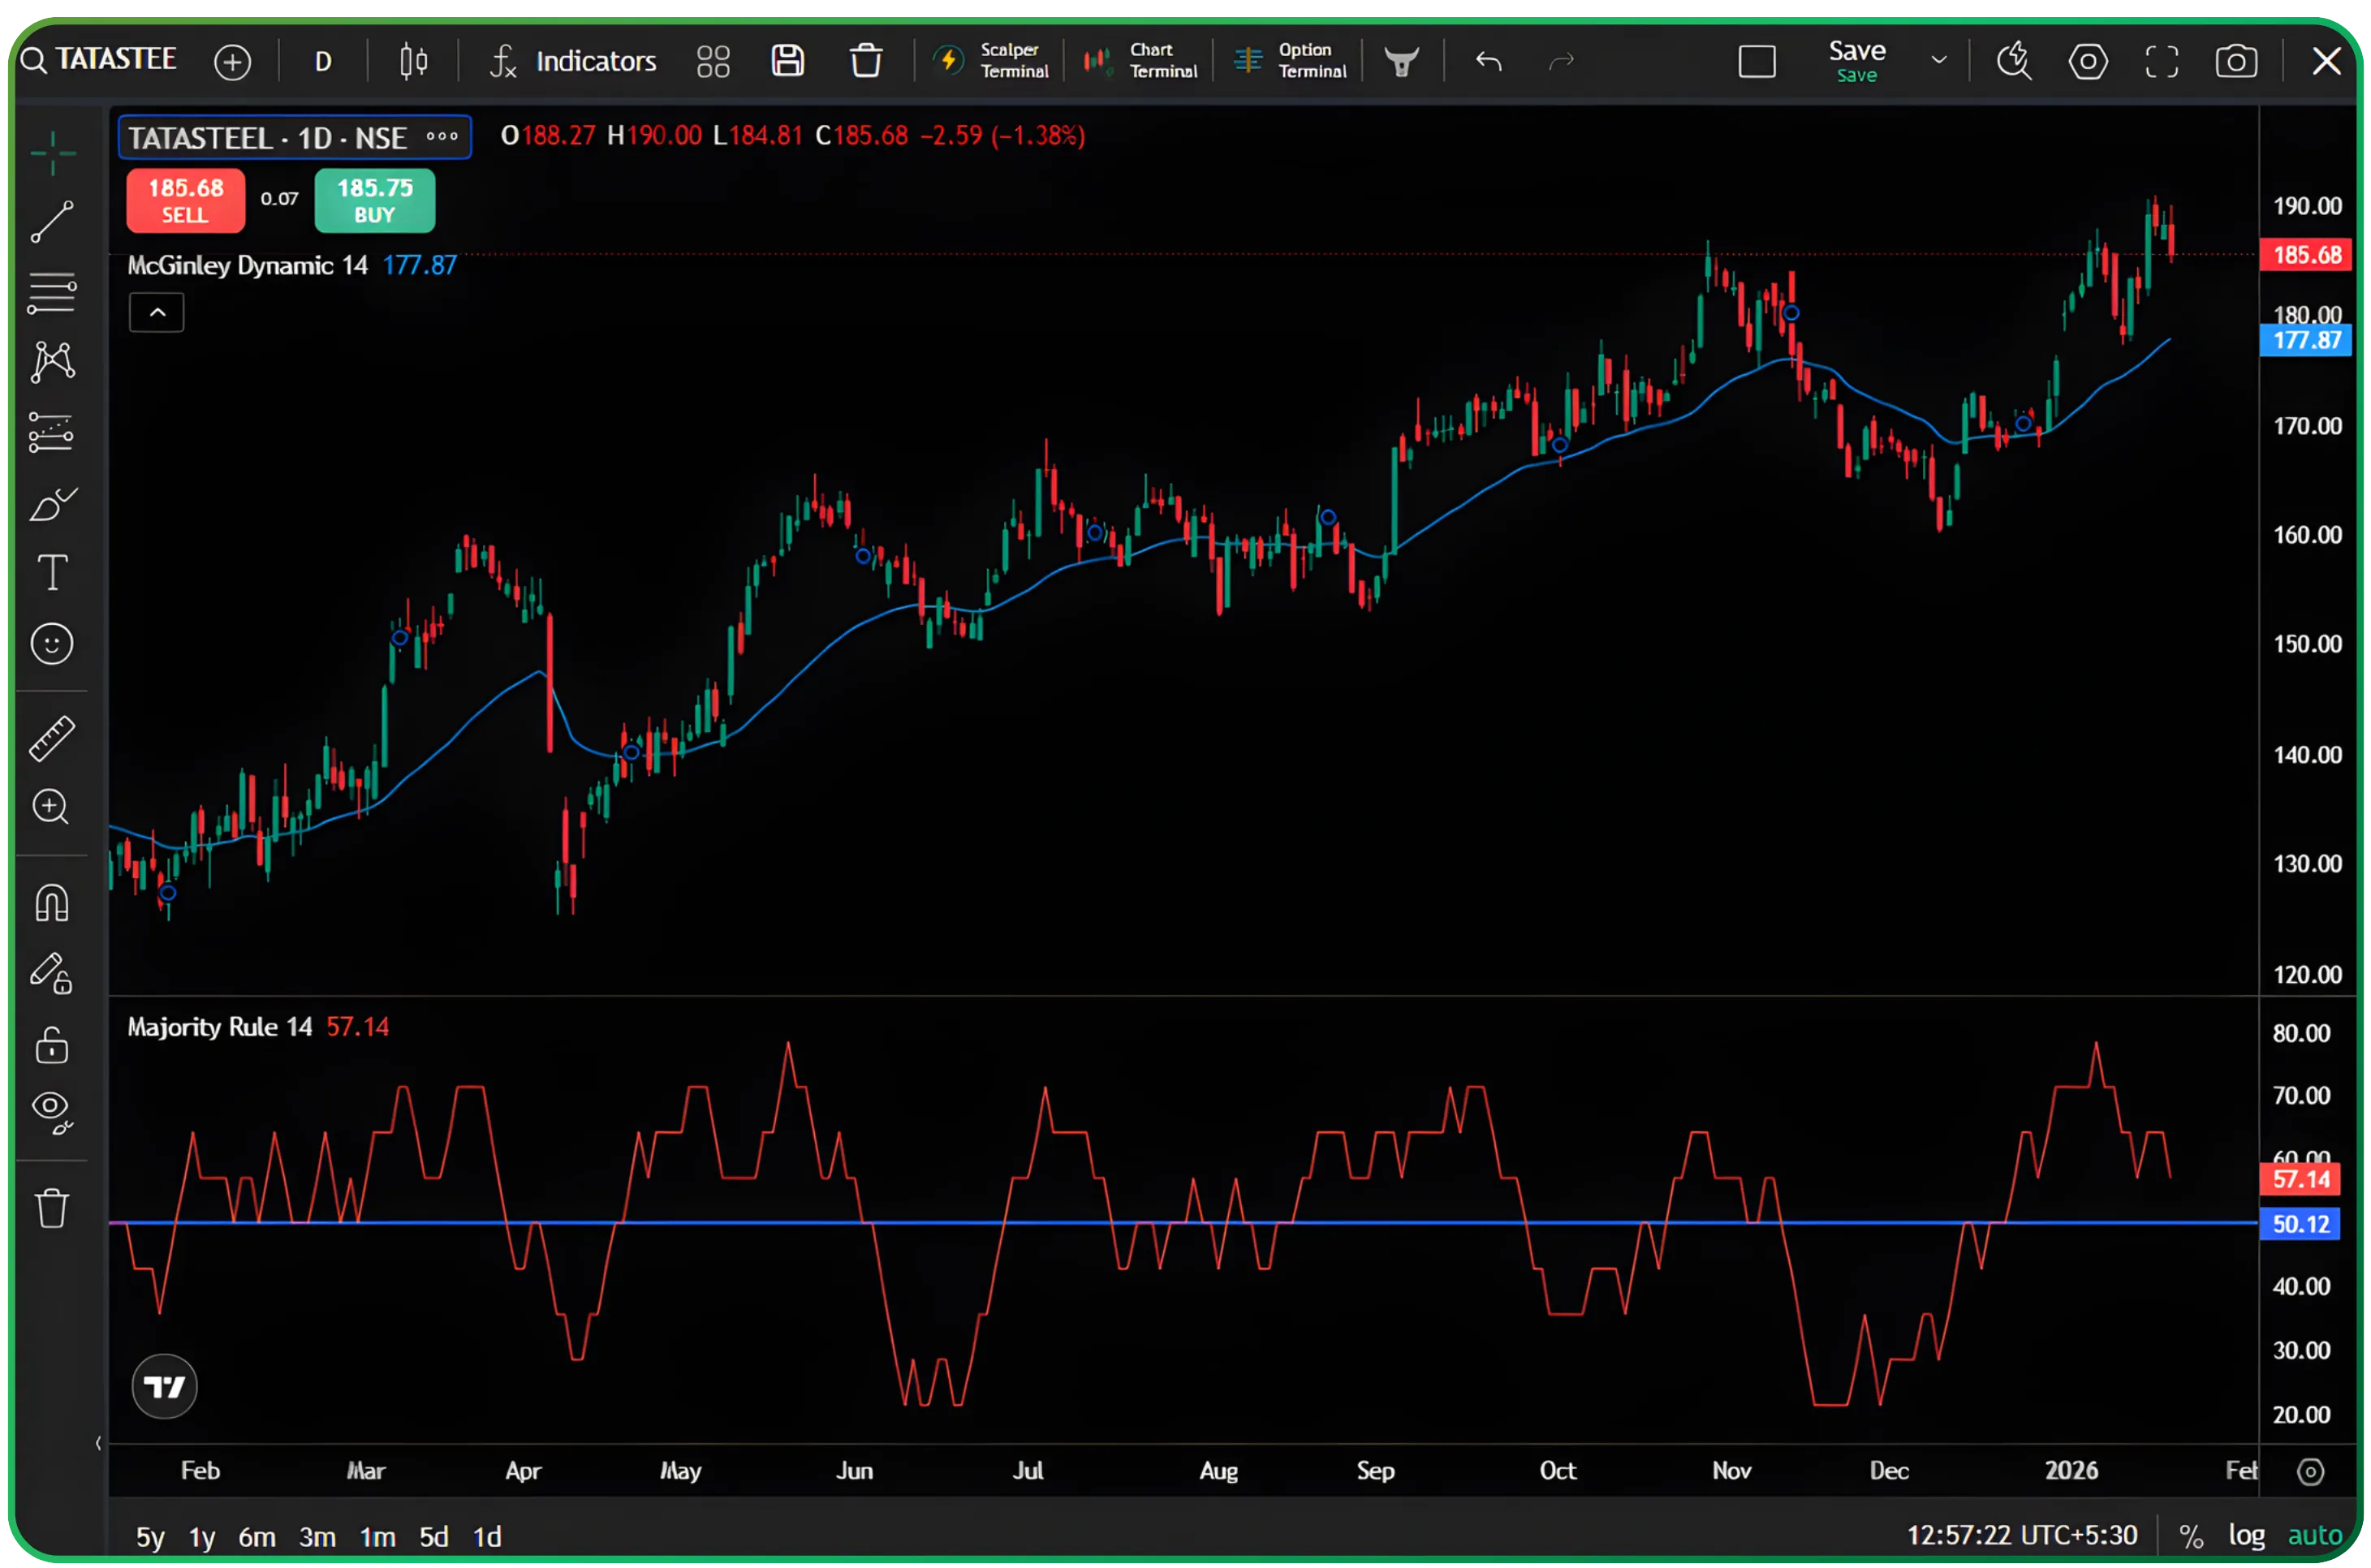
In the August 2025 portion of the Tata Steel chart, we can see this setup playing out. After a drop in September that briefly pushed the Majority Rule below 50, the indicator recovered back above 50 in early August while price held above the McGinley Dynamic. This confluence provided a high-probability long entry opportunity that led to the subsequent rally toward 185.
Position management becomes clearer with this dual-indicator approach. Traders can hold positions as long as price remains above the McGinley Dynamic and the Majority Rule stays above 50. When either condition fails, it signals reduced trend confidence and suggests taking profits or tightening stops.
For short positions, the logic simply inverts. Traders look for price below a declining McGinley Dynamic, and short when the Majority Rule drops below 50 after a bounce, confirming bearish momentum consensus.
Strategy 2: Divergence Detection for Reversal Anticipation
More advanced traders can use divergences between price action and the Majority Rule to anticipate potential trend reversals, with the McGinley Dynamic providing the ultimate confirmation.
Bearish divergence occurs when price makes a higher high but the Majority Rule makes a lower high, suggesting weakening momentum despite rising prices. In the Tata Steel chart, observe the October peak around 188. While price reached new highs, careful examination of the Majority Rule shows it didn't achieve the same enthusiasm levels seen in earlier rallies. This subtle divergence preceded the correction that followed.
For divergence-based trades, the McGinley Dynamic serves as the trigger. After spotting bearish divergence, traders wait for price to actually cross below the McGinley Dynamic before entering short positions. This ensures they're not fighting the trend prematurely. Similarly, bullish divergence (price making lower lows while Majority Rule makes higher lows) followed by a price cross above the McGinley Dynamic can signal high-probability long entries at trend reversals.
Strategy 3: Extreme Reading Mean Reversion
When the Majority Rule reaches extreme levels above 70-80 or below 20-30, it often suggests an overbought or oversold condition that may lead to at least a temporary reversal. However, the McGinley Dynamic helps filter these signals to avoid fighting strong trends.
For counter-trend trades, traders might consider fading extremely high Majority Rule readings (above 75) only if price has already moved significantly above the McGinley Dynamic, creating stretched conditions. The actual entry would occur when the Majority Rule starts falling back from extreme levels and price begins moving back toward the McGinley Dynamic line.
This approach requires more skill and is generally suited for experienced traders, as counter-trend trading carries higher risk. The key is using the McGinley Dynamic as a guardrail, never fighting the trend it defines, but rather looking for tactical pullbacks within that trend when momentum readings become extreme.
The McGinley Dynamic indicator can generate false signals during periods of low volatility or increased market choppiness, leading to whipsaws.
Accessing These Tools Through Tradejini CubePlus
For Tradejini clients, accessing these advanced indicators is straightforward through the CubePlus trading platform.
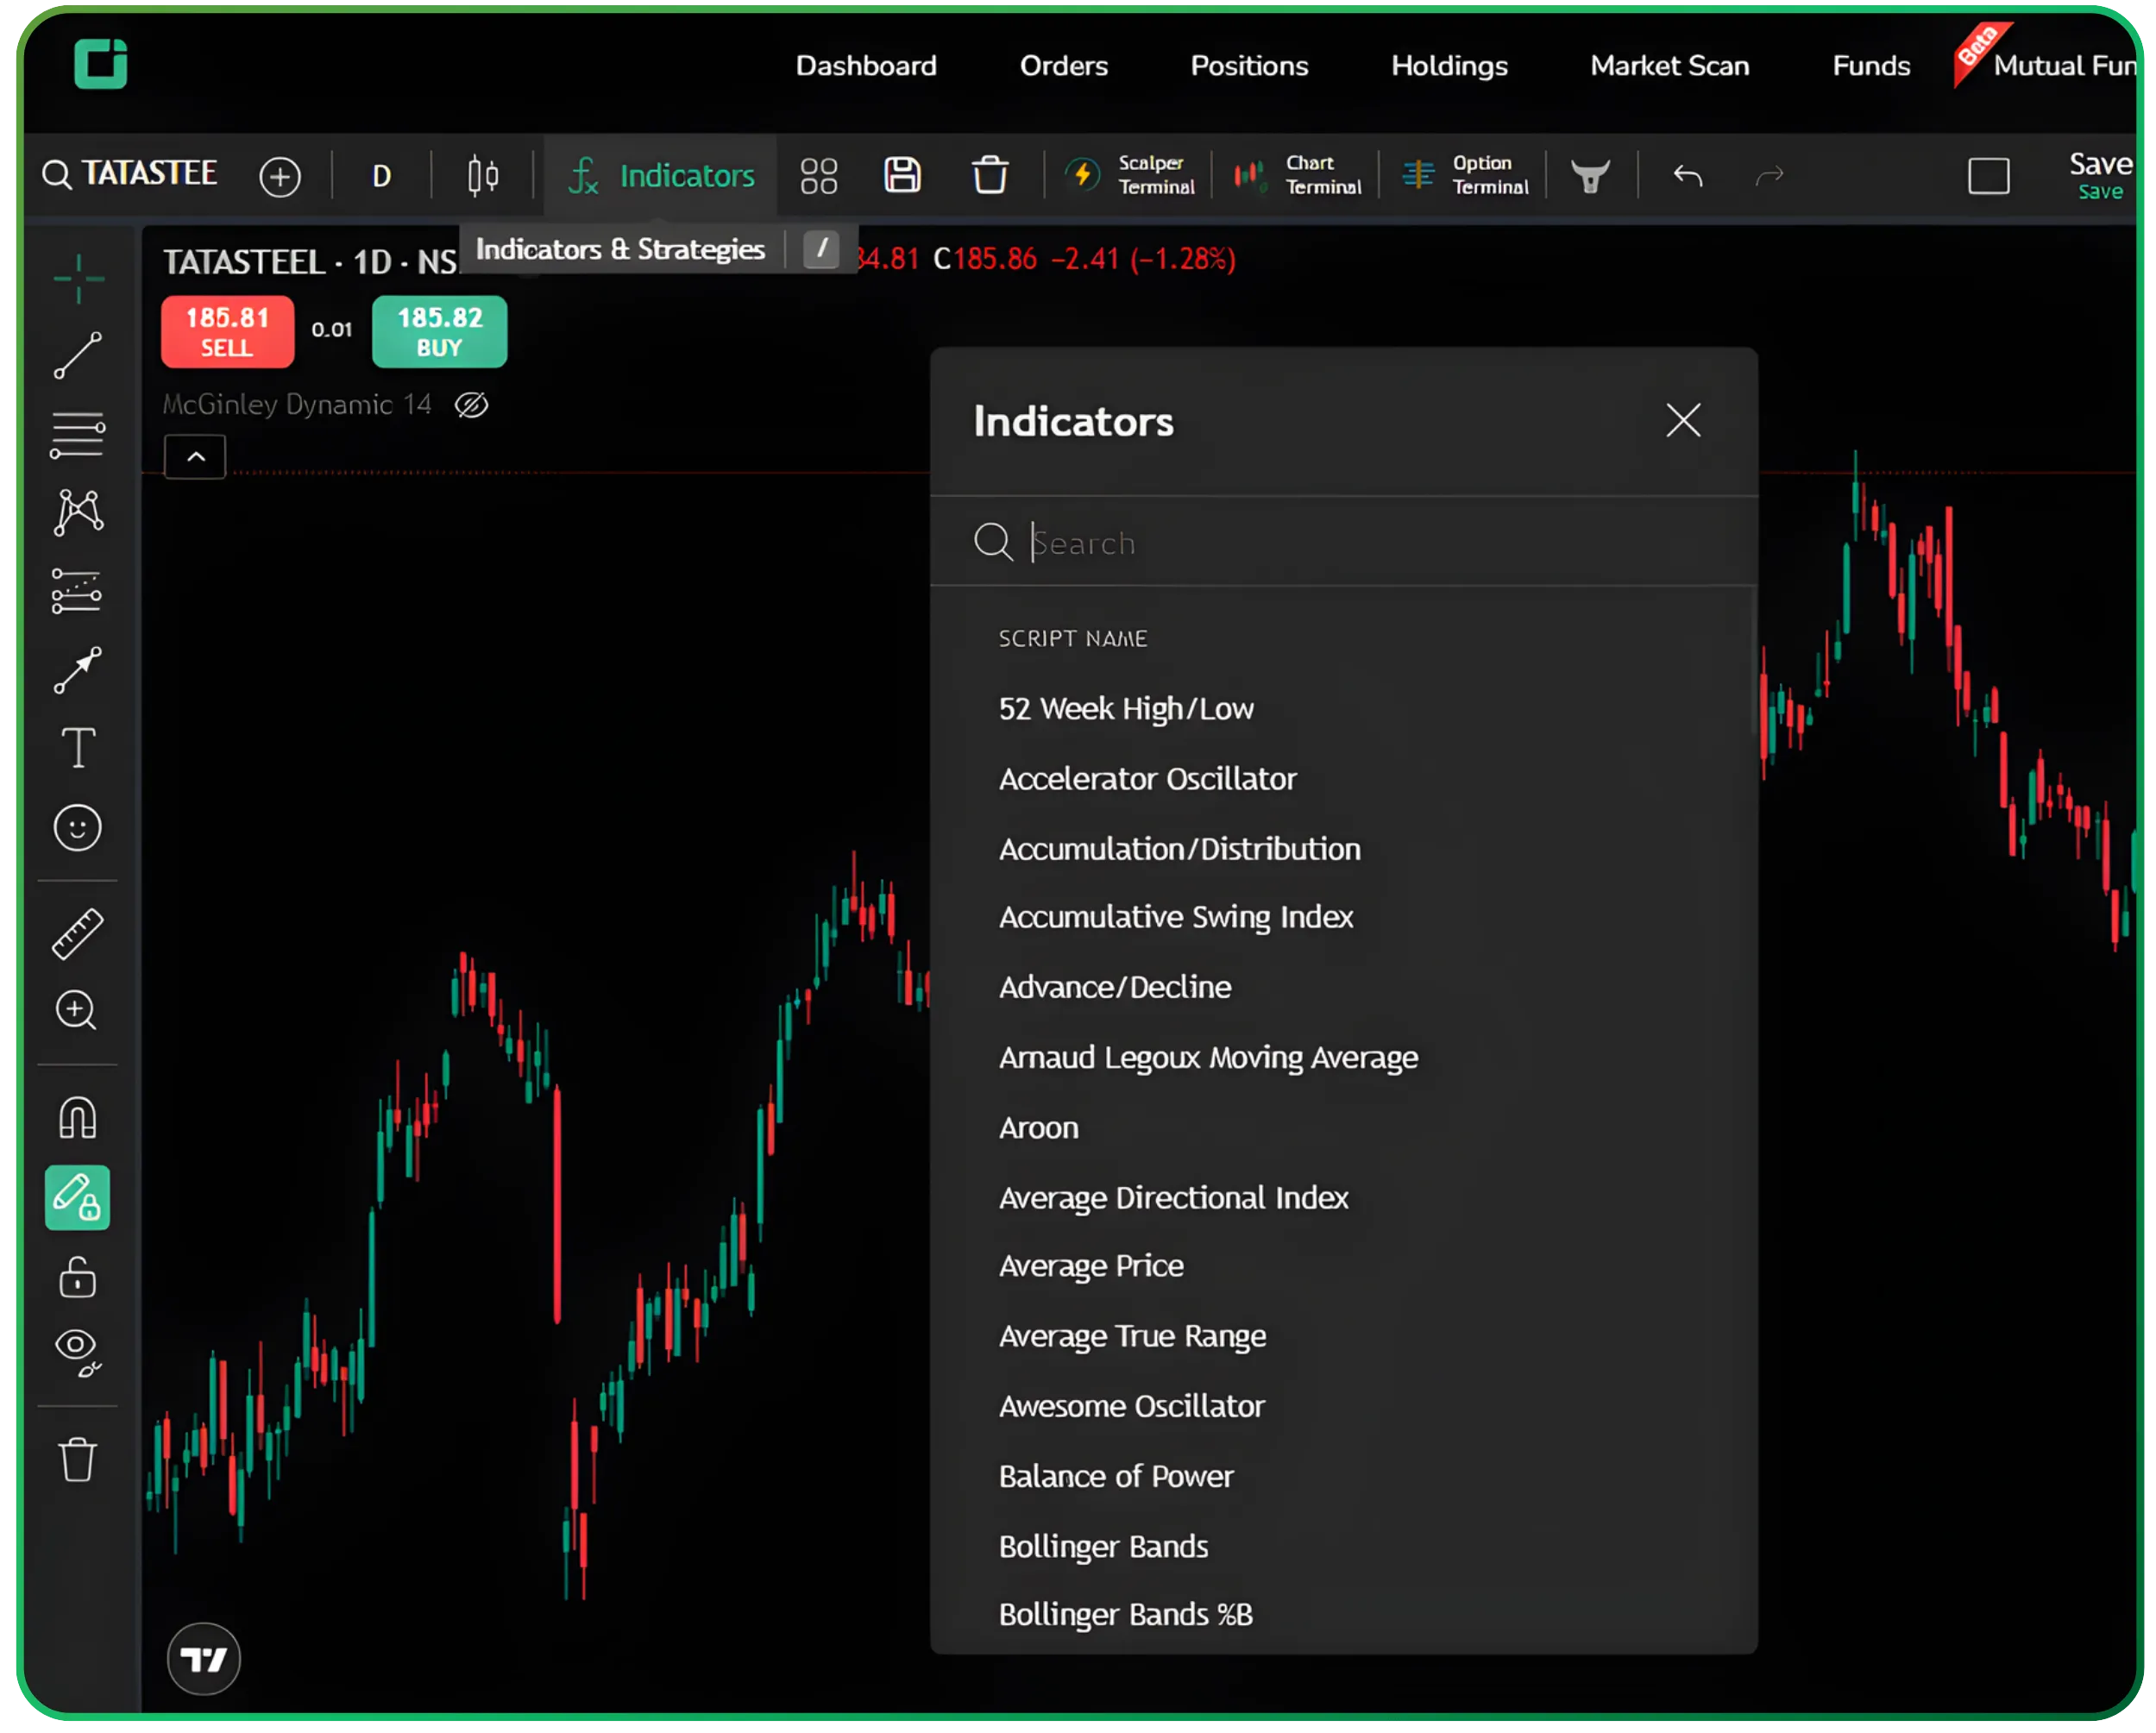
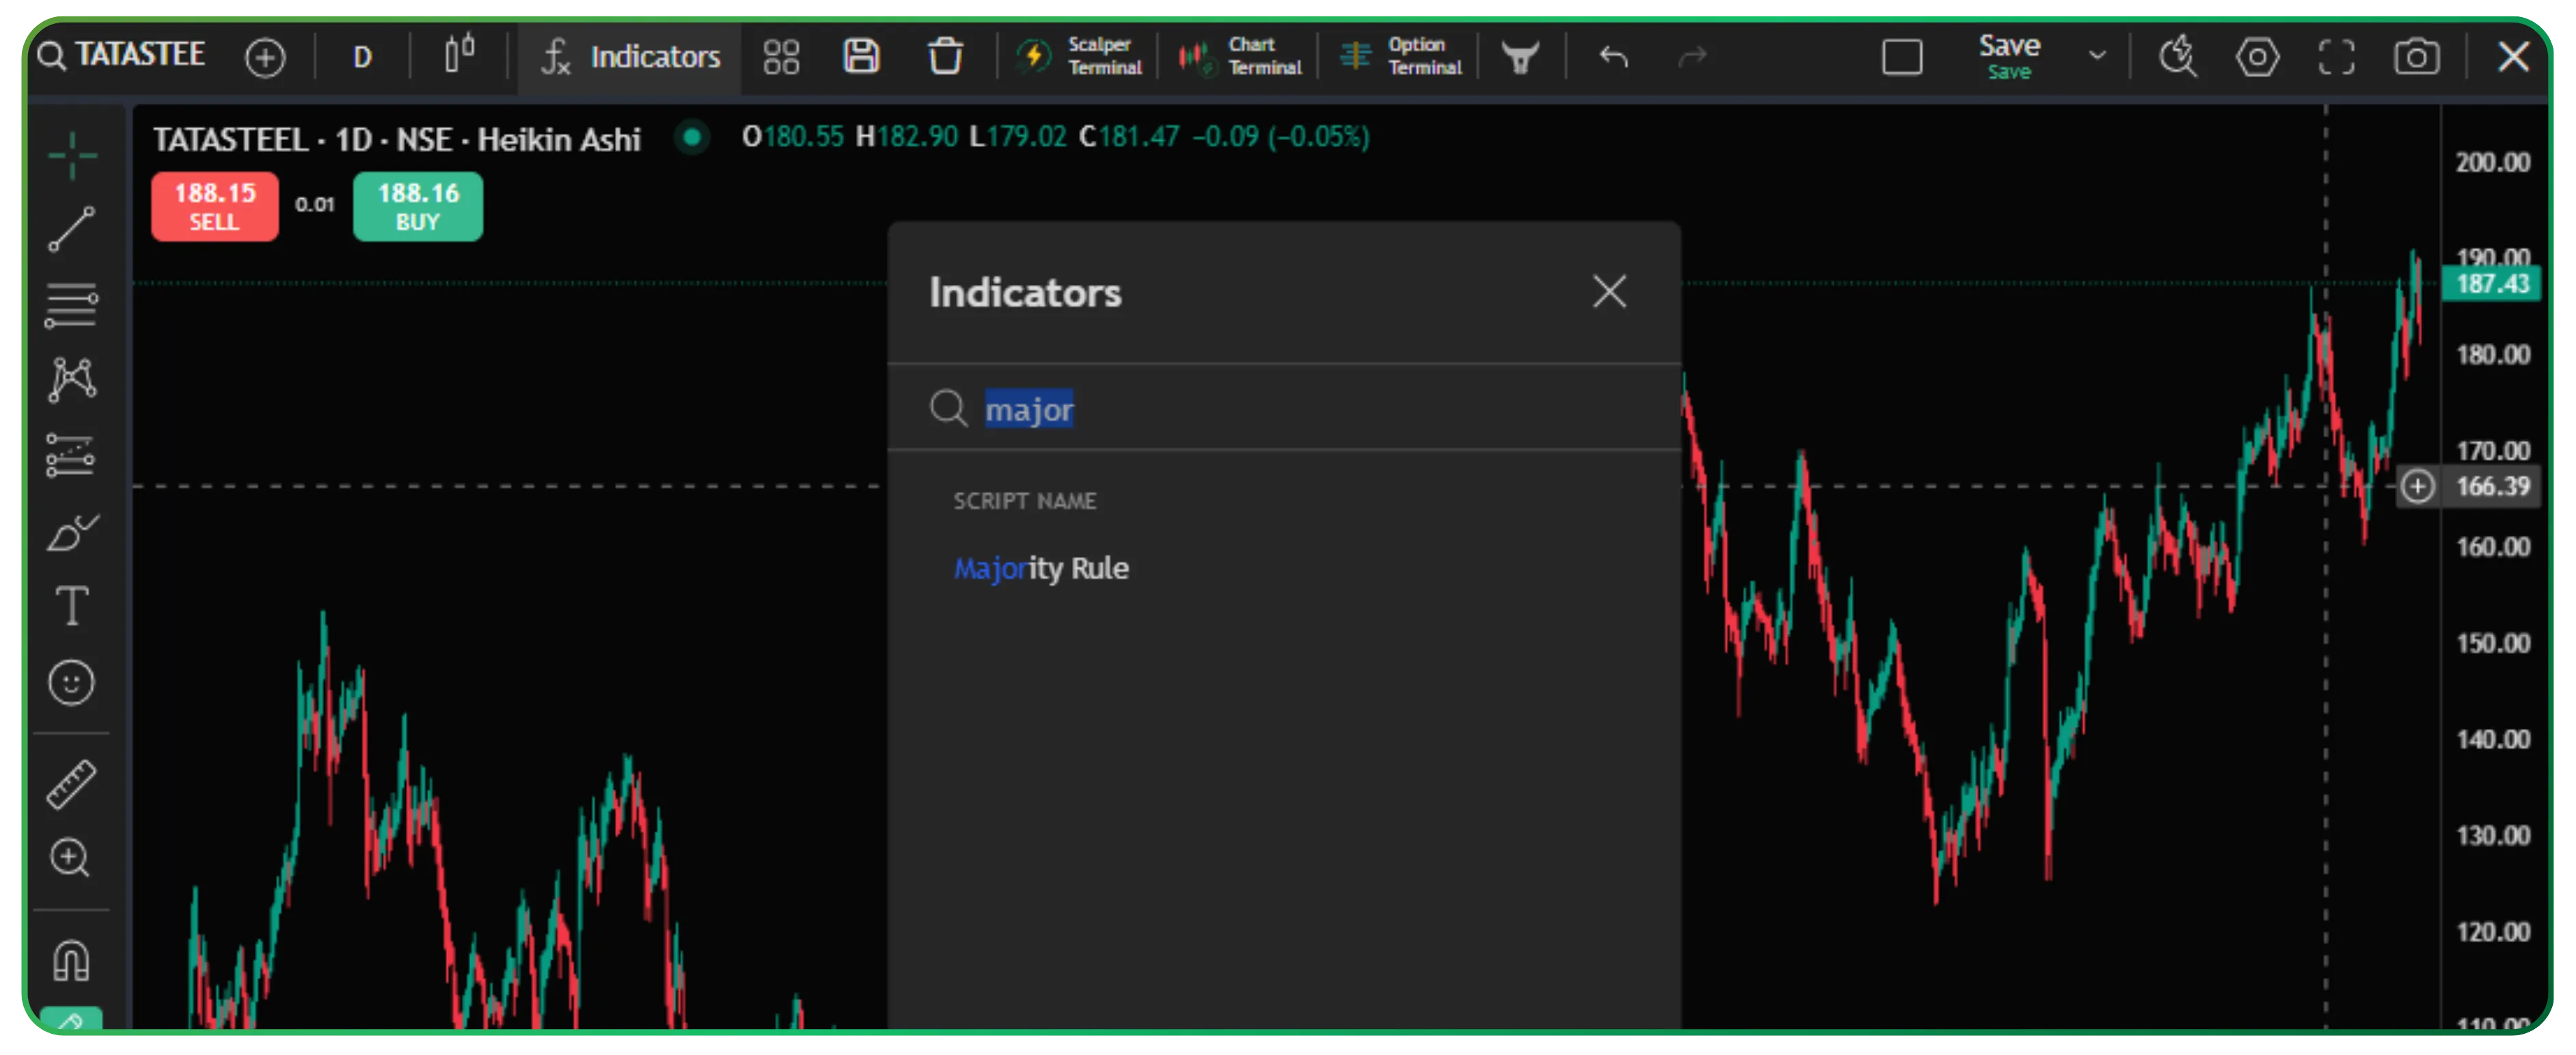
The platform offers an intuitive interface where traders can add multiple technical indicators to their charts with just a few clicks. Both the McGinley Dynamic and Majority Rule indicators are available in the indicator library.
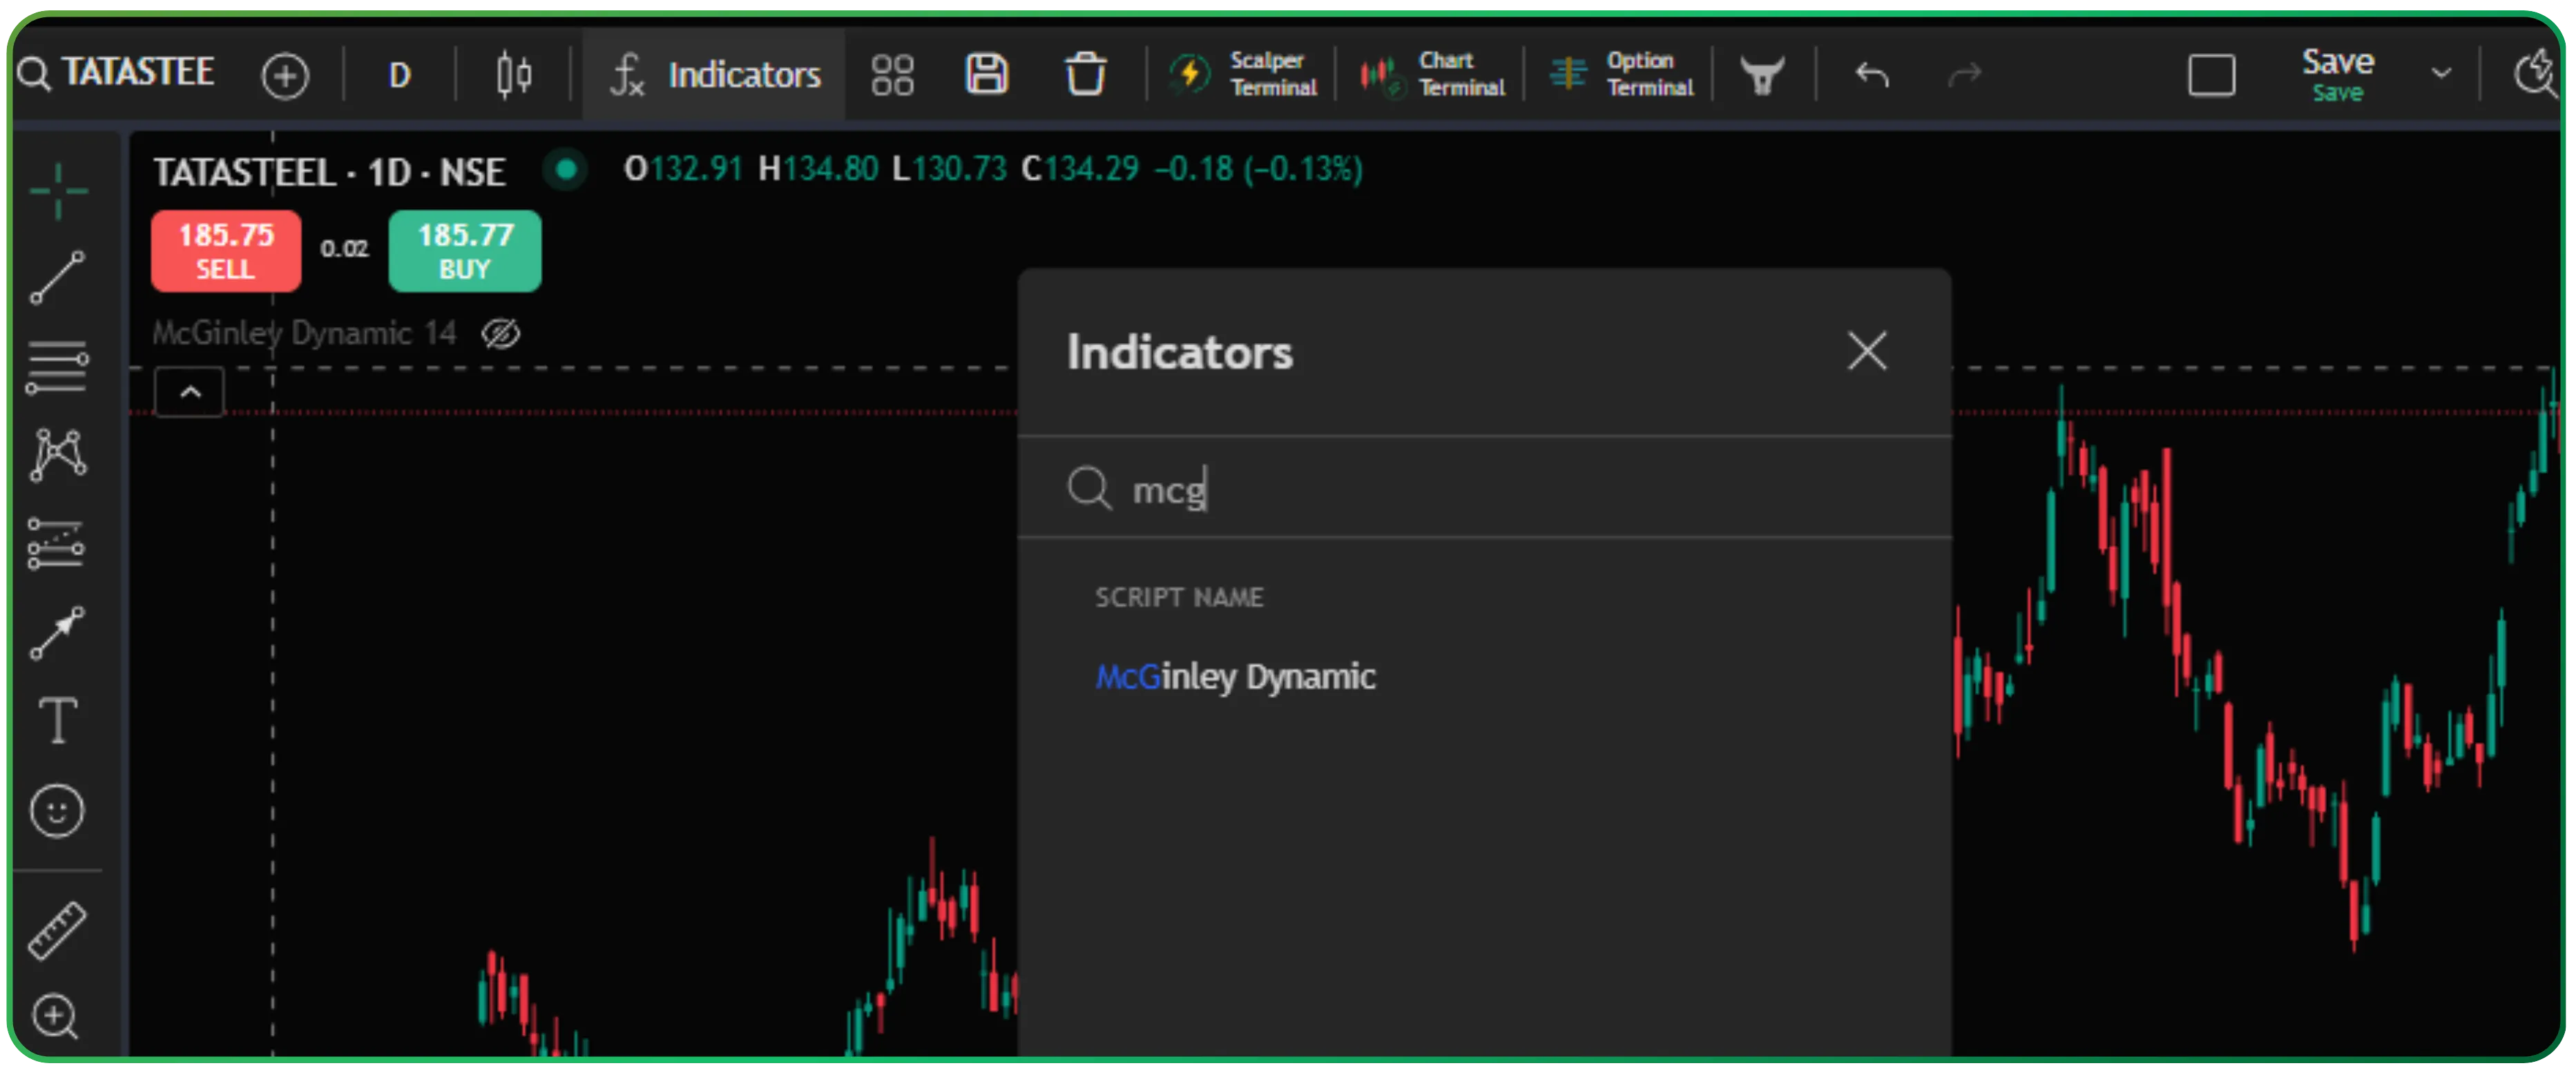
The process typically involves opening a chart for your desired security, clicking on the indicators menu, searching for "McGinley Dynamic" and adding it to the price chart, then searching for "Majority Rule" and adding it to a separate panel below the price action. The platform allows for customization of indicator parameters, colors, and settings to match individual trading preferences.
One of the significant advantages of using CubePlus is the ability to save custom templates. Once traders have configured their charts with the McGinley Dynamic and Majority Rule combination, along with any other tools or drawing tools, they can save this as a template. This means the same analytical setup can be instantly applied to any stock or instrument, ensuring consistency in analysis across the entire portfolio.
Also read: Understanding Market Participation Through Positive and Negative Volume Indices — a clear way to see who’s really driving the move, smart money or the crowd.
Advantages of This Combined Approach
The synergy between the McGinley Dynamic and Majority Rule offers several advantages over using traditional single-indicator approaches.
Reduced False Signals: One of the biggest challenges with moving average-based systems is whipsaw trades during choppy markets. By requiring both trend alignment and momentum consensus, traders filter out many of the ambiguous setups that lead to potential losses. A price crossover of a moving average means little if momentum indicators show mixed signals.
Adaptability Across Market Conditions: The self-adjusting nature of the McGinley Dynamic combined with the momentum-consensus reading of the Majority Rule means this approach works across varying volatility regimes. The indicators automatically adapt without requiring constant parameter optimization, saving traders from the endless tweaking that often leads to curve-fitting.
Clear Entry and Exit Framework: Combining these indicators provides objective criteria for both trade initiation and management. Traders know they want to be long when price is above an rising McGinley Dynamic with Majority Rule above 50, and short in the opposite configuration. This clarity reduces emotional decision-making and provides a rules-based framework that can be backtested and refined.
Multi-Dimensional Market View: While some indicators focus purely on price, others on volume, and still others on momentum, this combination captures both trend dynamics and momentum consensus. This multi-dimensional perspective provides a more complete picture of market conditions than any single indicator can offer.
Works Across Timeframes and Instruments: Whether trading intraday on futures, swing trading stocks, or position trading ETFs, the fundamental logic remains consistent. The indicators scale appropriately to different timeframes, making this a versatile approach suitable for various trading styles.
Limitations and Considerations
No technical analysis approach is perfect, and traders should understand the limitations and potential drawbacks of this methodology.
Lagging Nature: Despite the McGinley Dynamic's adaptive qualities, it remains a trend-following tool that inherently lags price action. In rapidly reversing markets, traders will give back some profits before the indicators signal an exit. This is a characteristic of all trend-following systems: the trade-off for avoiding false signals during the trend is slower reaction to genuine reversals.
Whipsaws in Transitional Markets: While this combination reduces false signals compared to single indicators, it cannot eliminate them entirely. During markets transitioning between trending and ranging behavior, traders may experience several small losing trades before a clear trend emerges. This is why position sizing and risk management remain crucial regardless of the indicator setup used.
Requires Patience and Discipline: These indicators work best for traders who can wait for proper setups rather than forcing trades. During extended consolidations, both the McGinley Dynamic and Majority Rule may provide few clear signals. Impatient traders might be tempted to override their rules, leading to inconsistent results.
Parameter Sensitivity: While the McGinley Dynamic is less parameter-sensitive than traditional moving averages, the Majority Rule's effectiveness can vary depending on its calculation settings. Traders need to understand the parameters they're using and ideally test them on historical data for their preferred instruments and timeframes.
Not a Holy Grail: Perhaps most importantly, no combination of indicators can predict the future with certainty. Unexpected news, sudden shifts in market sentiment, or liquidity events can invalidate even the most reliable-looking technical setups. Proper risk management through position sizing and stop-loss placement remains essential regardless of how confident a setup appears.
Best Practices for Implementation
For traders interested in incorporating this approach into their trading arsenal, several best practices can improve results and reduce the learning curve.
Start by paper trading or using very small position sizes while developing familiarity with how these indicators behave on your preferred instruments. Each market has its own personality, and what works perfectly on large-cap stocks may need adjustments for small-caps or commodities. The learning process is crucial and shouldn't be rushed.
Maintain a trading journal specifically focused on trades taken using this system. Document not just entries and exits but also the indicator readings at the time, market context, and your rationale. Over time, patterns will emerge showing which setups within this framework offer the highest probability and which tend to underperform.
Consider the broader market context before taking signals. Even the best individual stock setup can fail if the overall market is moving strongly against you. Checking major indices and their indicator configurations before entering positions adds an additional layer of confirmation.
Combine this technical approach with basic fundamental awareness. A technically perfect short setup on a stock just before its earnings announcement carries unnecessary risk. Similarly, fading an overbought reading in a stock that just announced a major contract win may prove painful. Technical and fundamental analysis work best together, not in isolation.
Final Thoughts
The combination of the McGinley Dynamic and Majority Rule indicators offers traders a sophisticated yet practical approach to navigating financial markets. By addressing both trend identification and momentum confirmation, this dual-indicator framework provides a more complete picture of market conditions than either tool could offer independently.
For Tradejini clients, accessing these powerful analytical tools through the CubePlus platform removes the technical barriers that once kept institutional-grade charting out of reach for retail traders. The seamless integration between advanced charting and trade execution creates an efficient workflow from analysis to action.
However, tools are only as effective as the hands that wield them. Success with this or any technical approach requires patience, discipline, proper risk management, and a commitment to continuous learning. The indicators provide the framework, but the trader must supply the judgment, emotional control, and strategic thinking that separate consistent winners from the crowd.
Whether you're a seasoned technical analyst looking to refine your approach or a developing trader seeking a robust methodology, the McGinley Dynamic and Majority Rule combination deserves serious consideration. Study how they interact, test them on historical data, and gradually incorporate them into your trading process. With time and experience, this powerful pairing may become a cornerstone of your analytical toolkit.
Disclaimer: The information provided in our blogs is for informational purposes only and should not be construed as financial, investment, or trading advice. Trading and investing in the securities market carries risk. Always conduct your own research and consult with a qualified financial advisor before making any investment decisions. Past performance is not indicative of future results. Copyrighted and original content for your trading and investing needs.
© 2026 — Tradejini. All Rights Reserved.


