


Trend trading is less about finding the perfect entry and more about staying aligned with a move once it begins. Most traders don’t exit trends because the trend has failed. They exit because the chart keeps unsettling them.
Traditional candlesticks record every fluctuation faithfully. Heikin Ashi takes a different view. It smooths price action so that direction, not daily drama, becomes the focus.
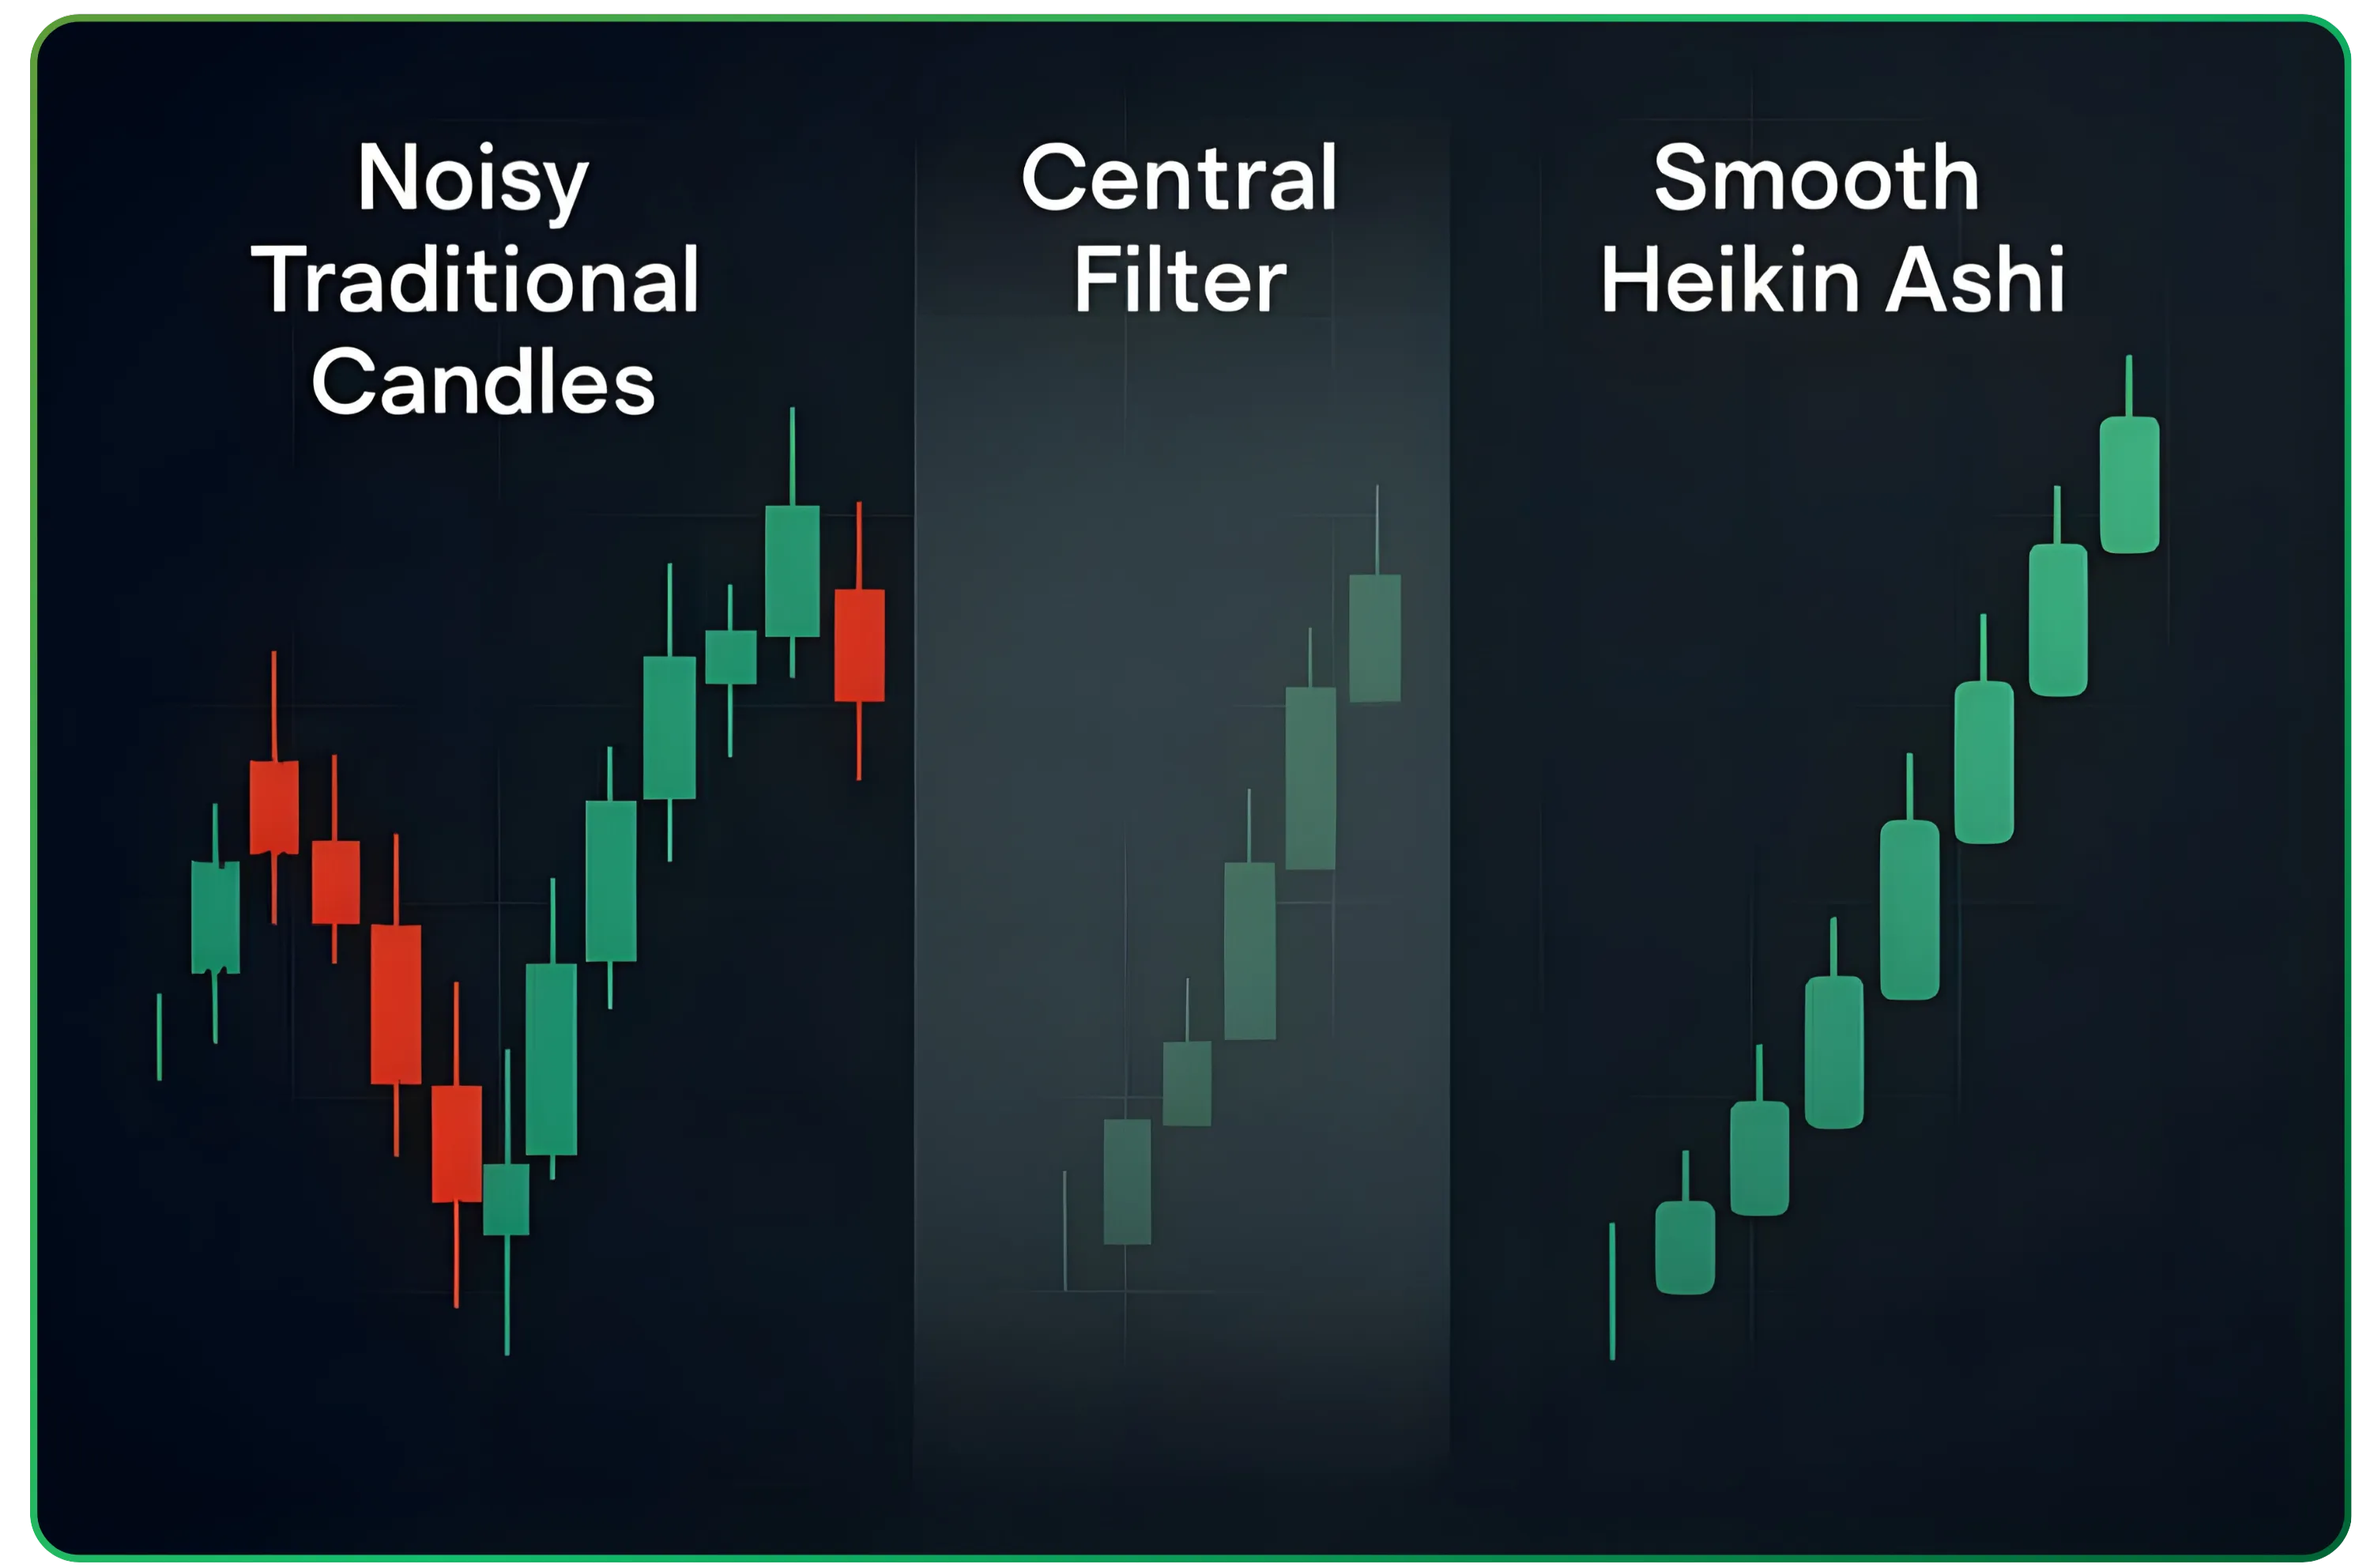
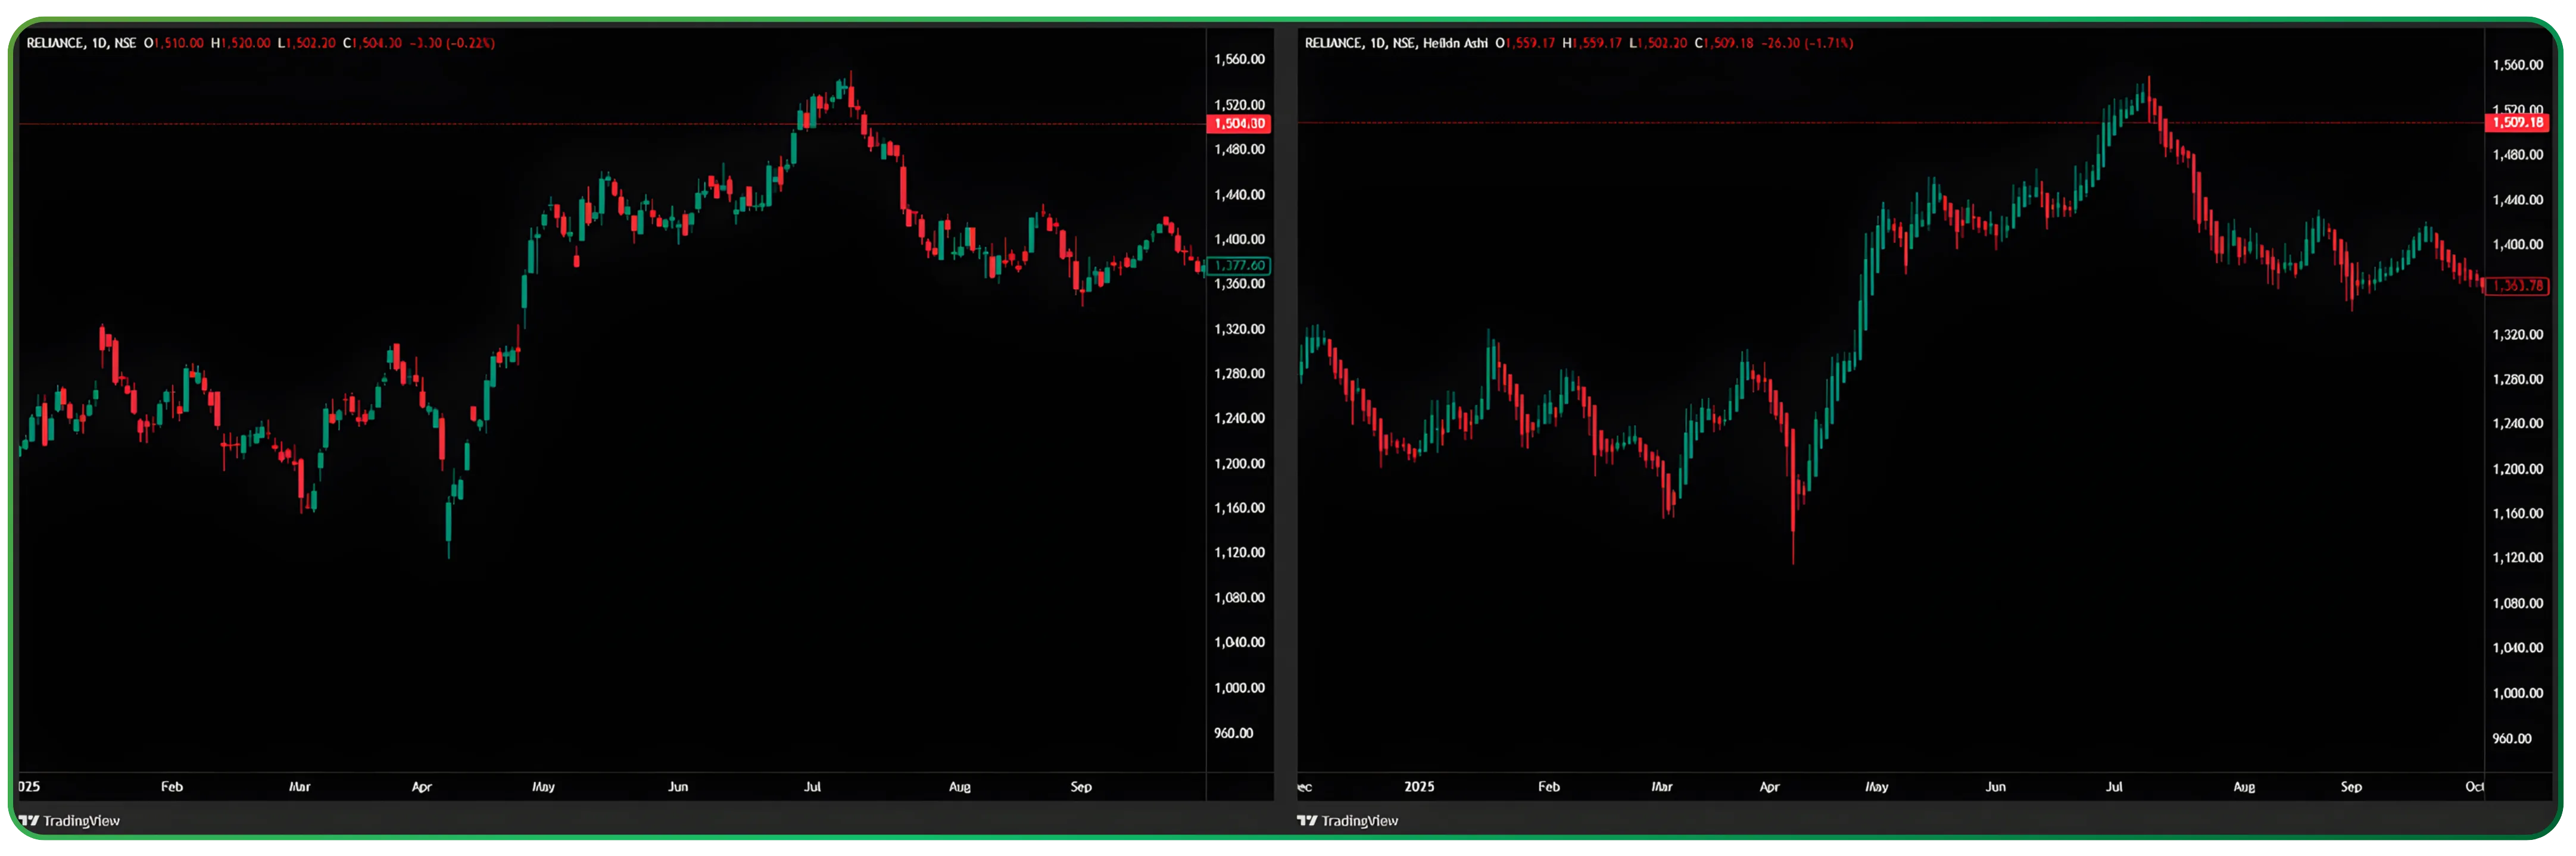
The difference is subtle in theory and obvious on the chart.
Heikin Ashi candles are a modified chart type used in technical analysis to reduce market noise and make trend identification easier than with a traditional candlestick chart.
The problem Heikin Ashi is trying to solve
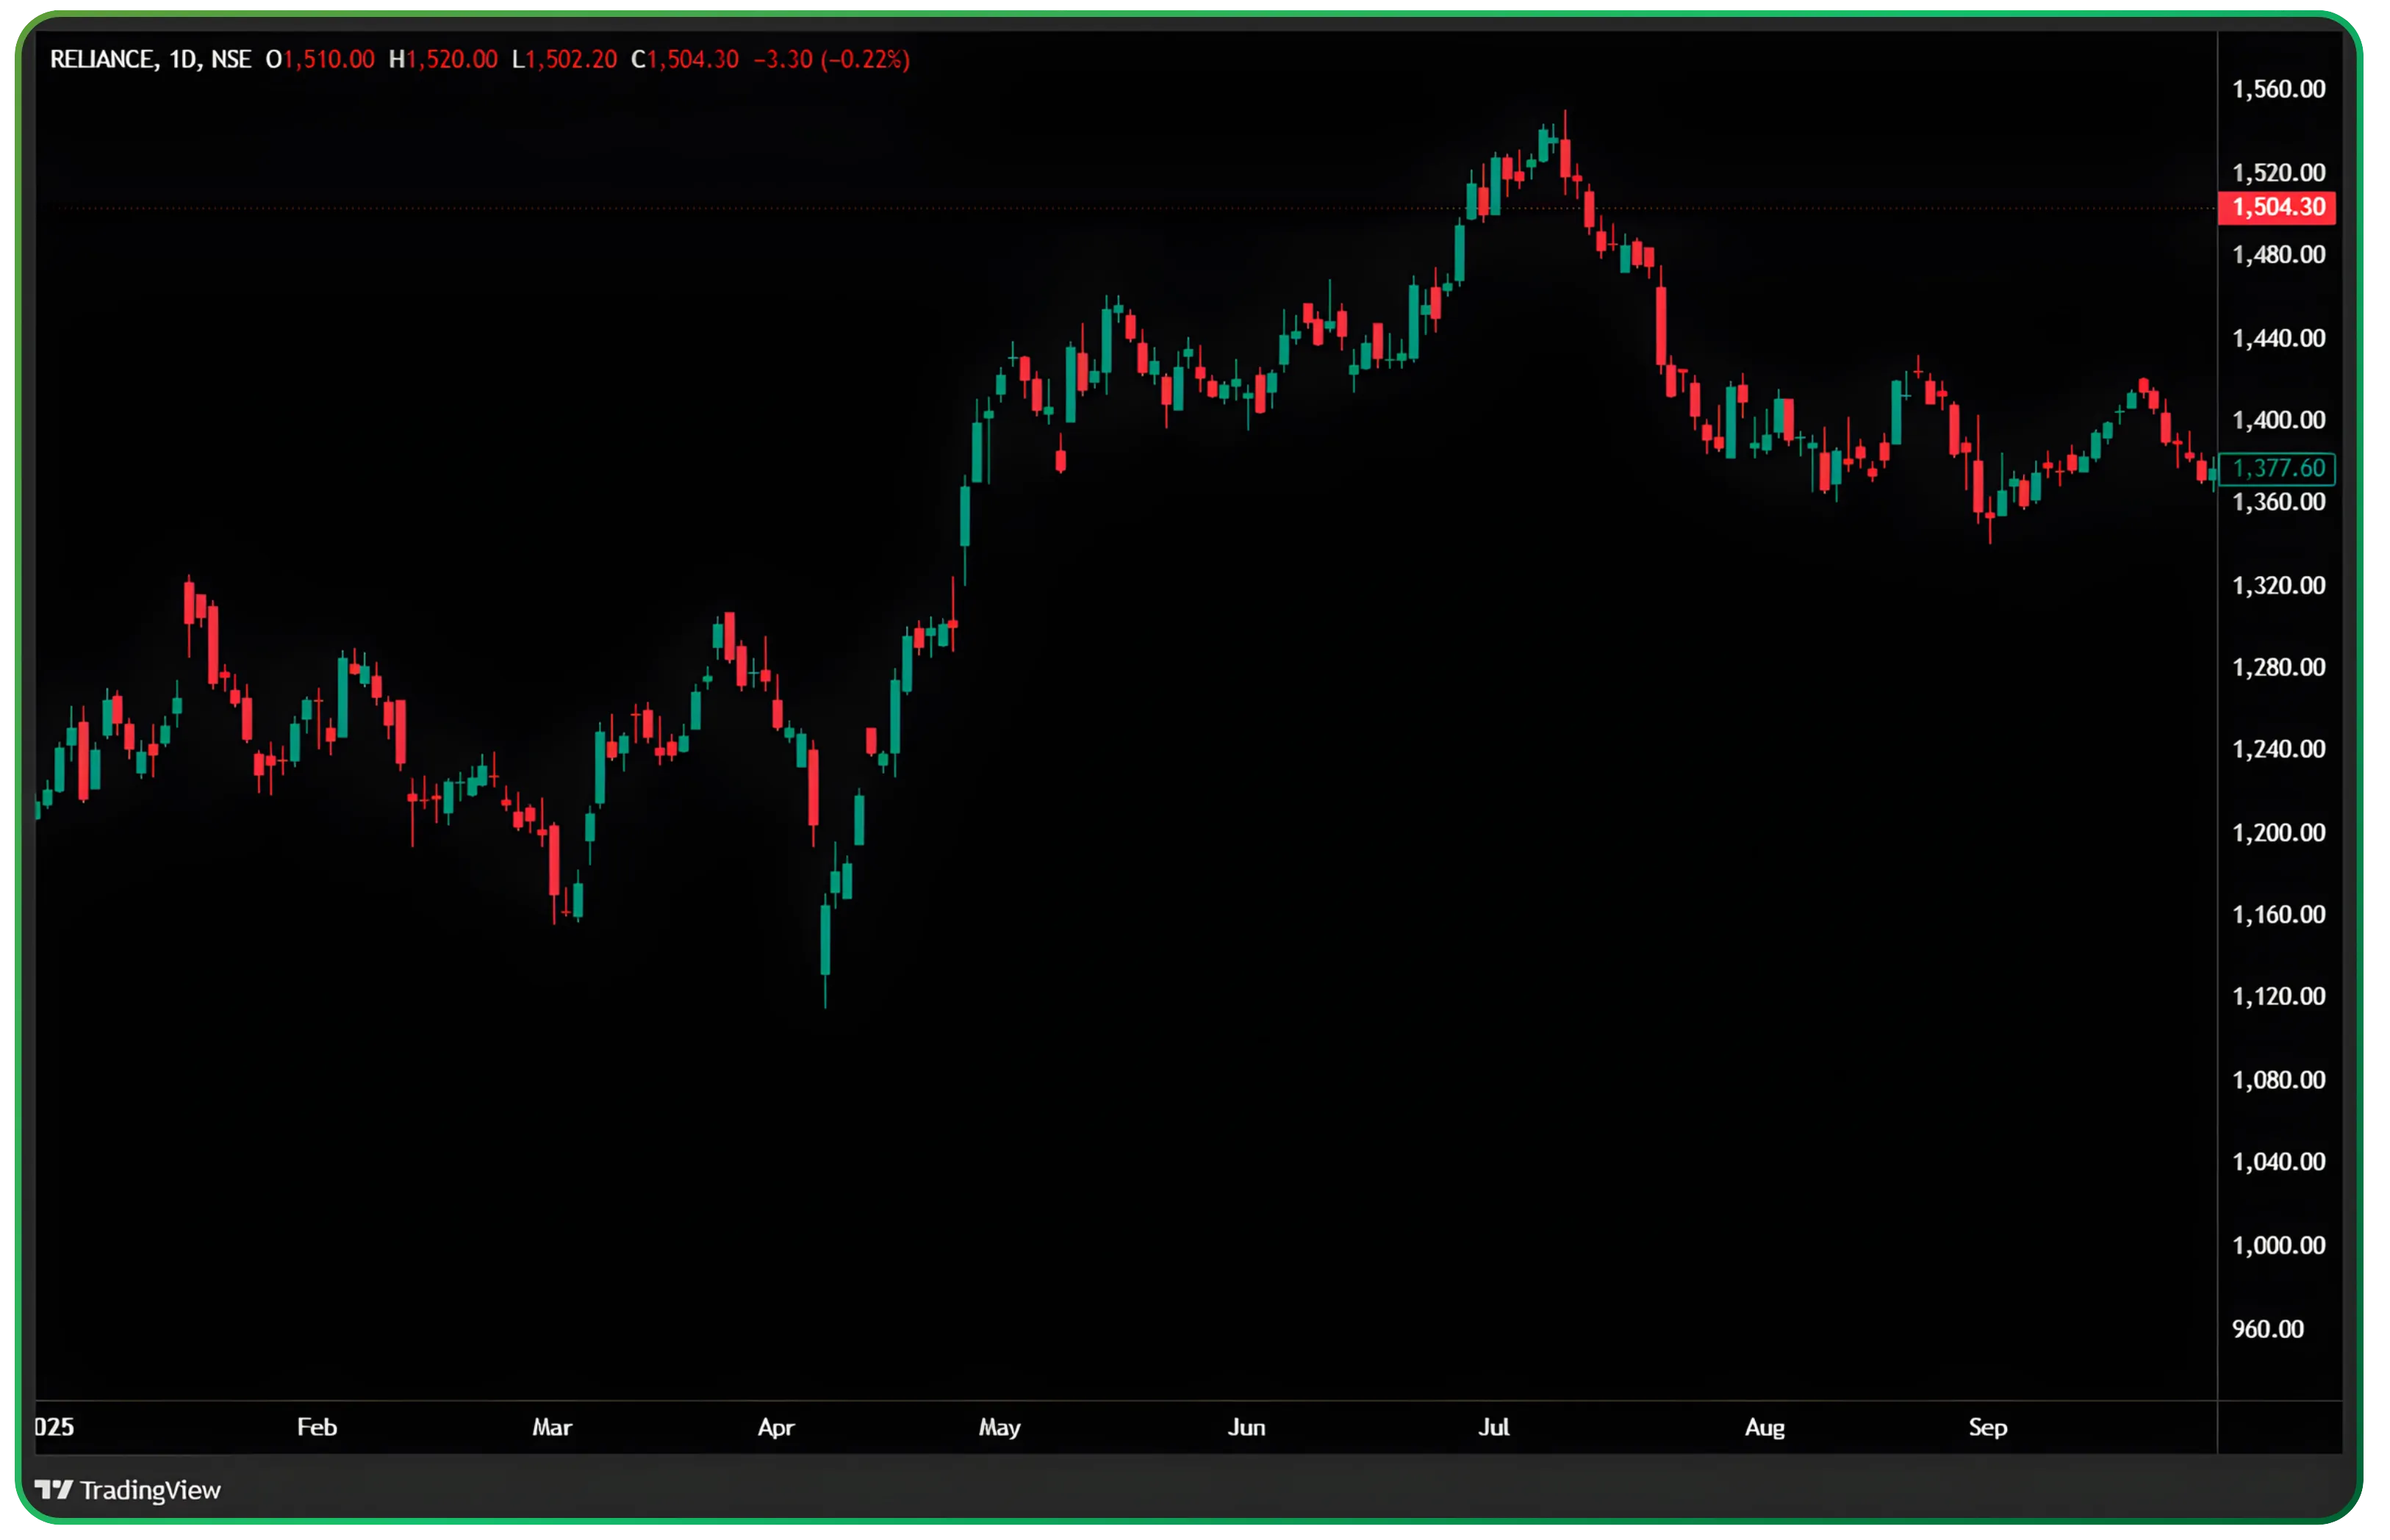
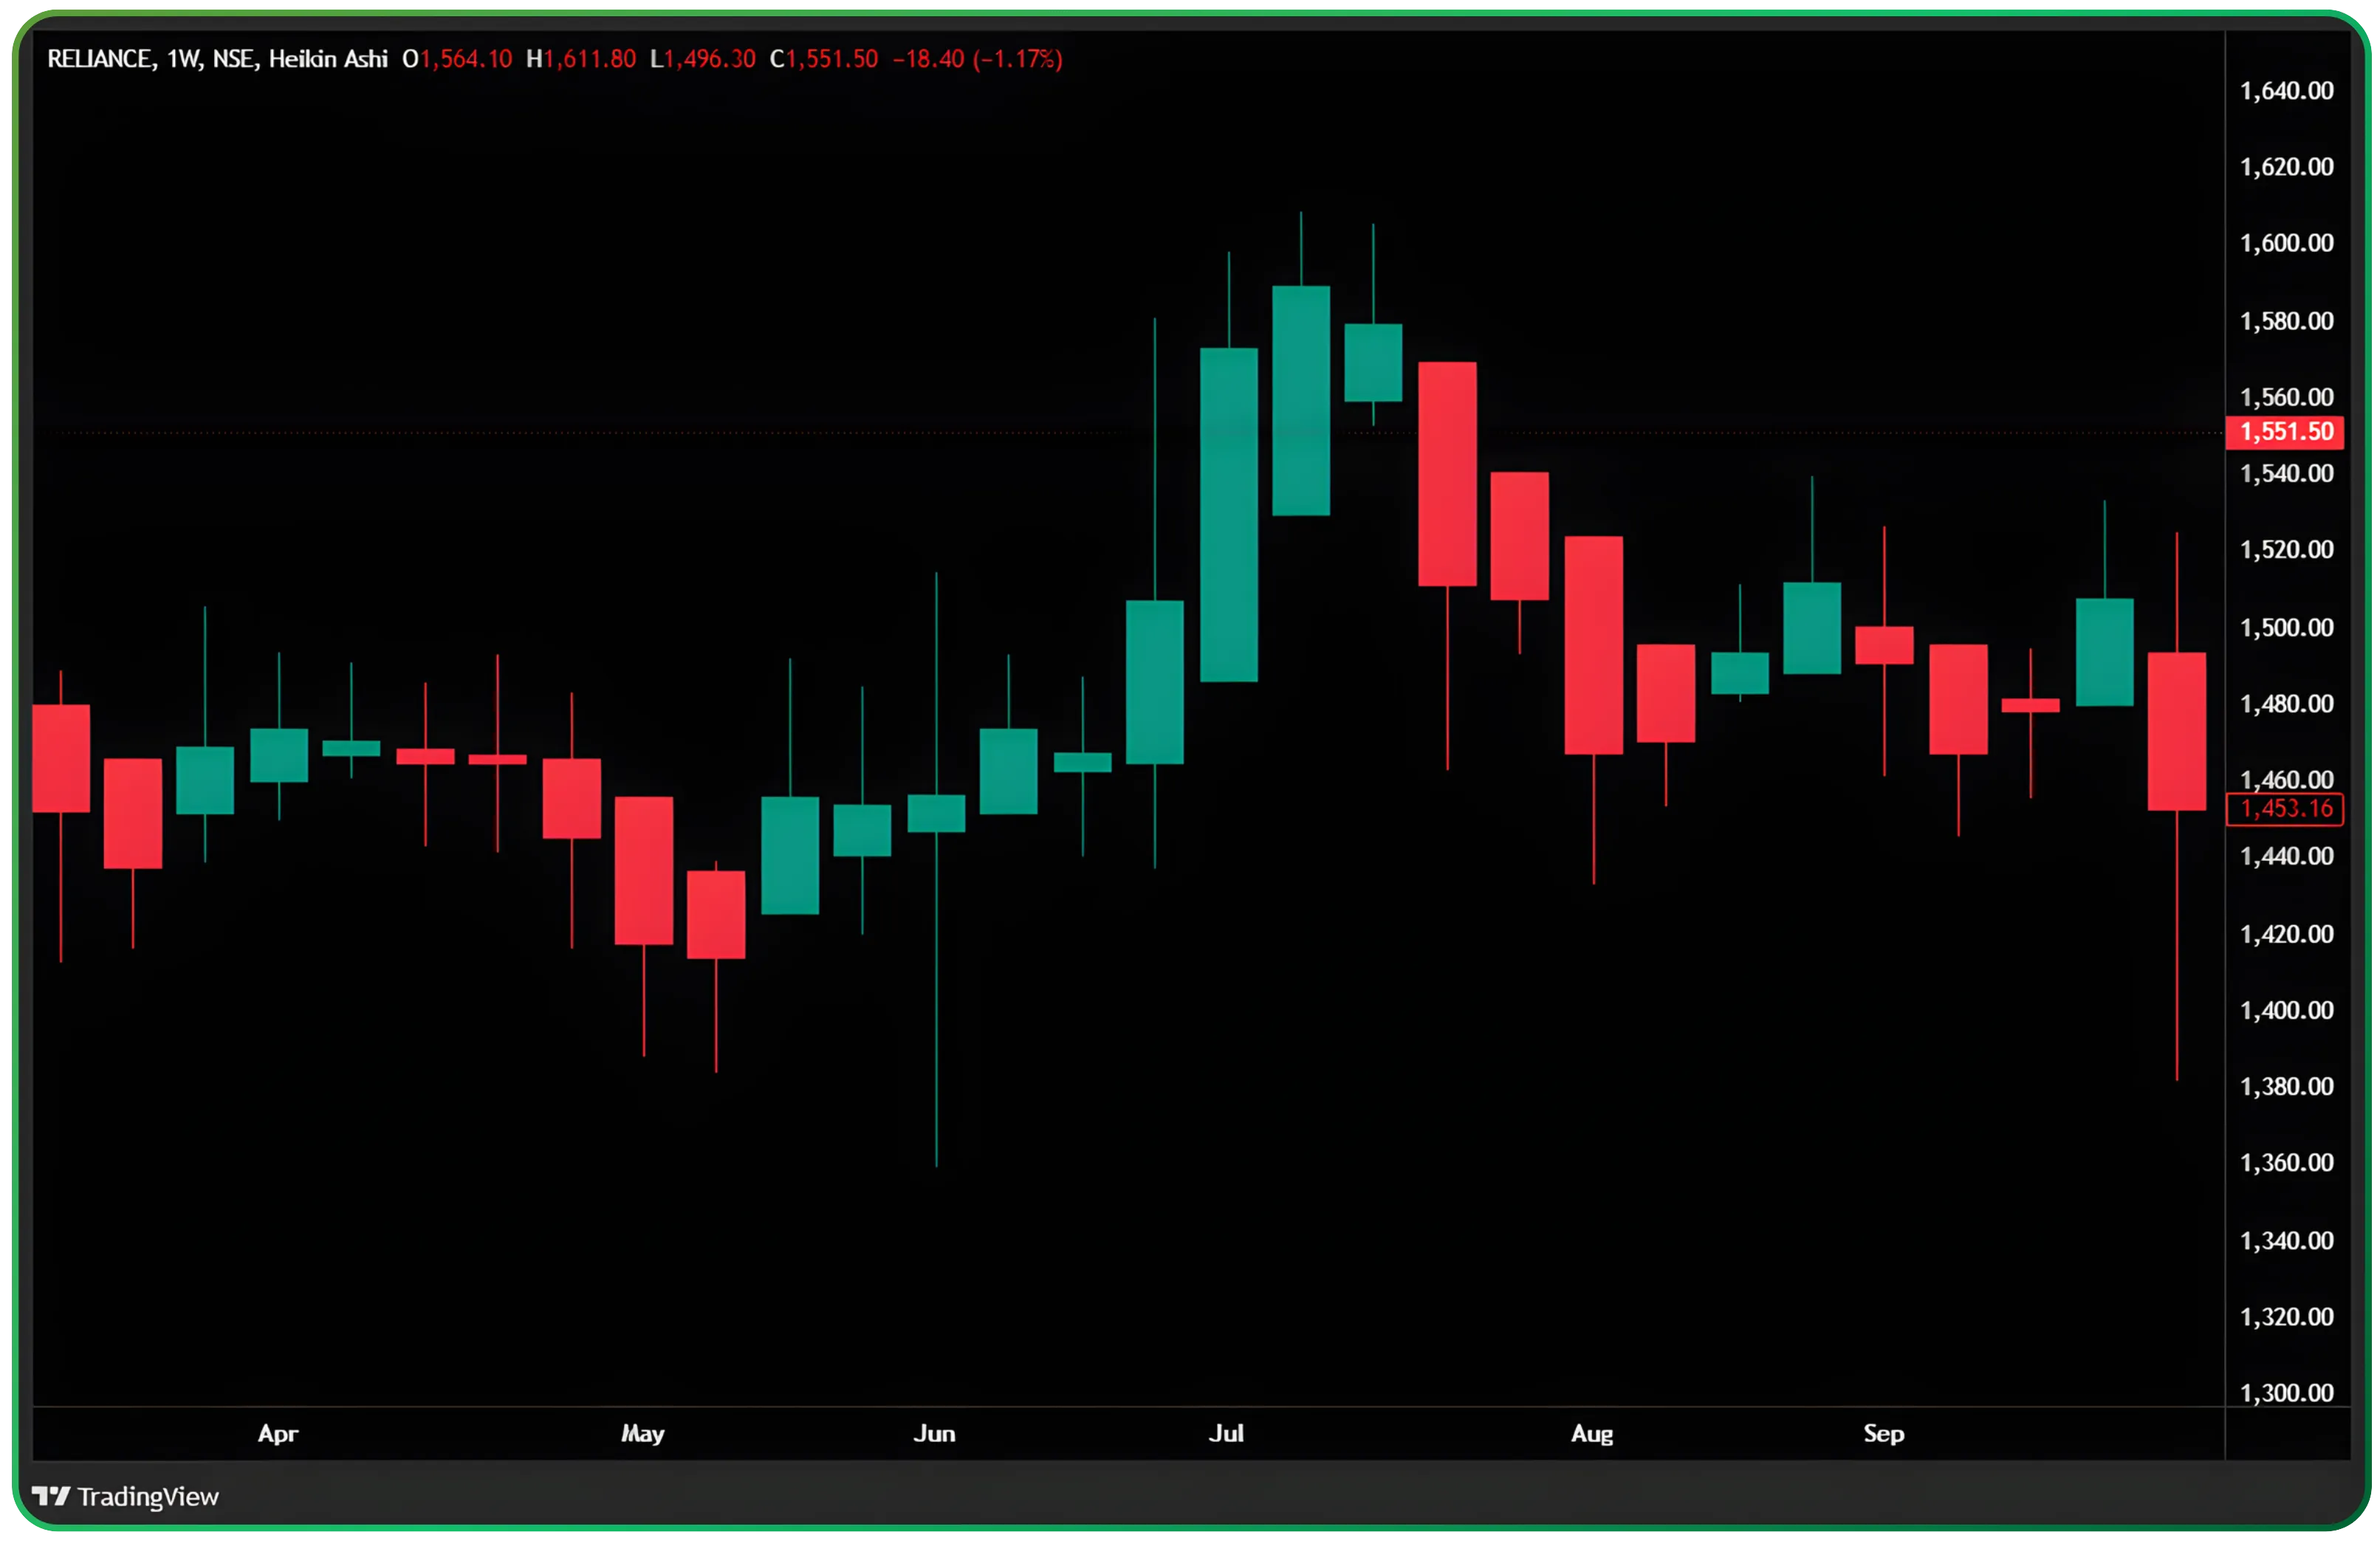
This chart shows Reliance on a one-day timeframe using standard candlesticks.
Even though the broader structure is directional, the path is visually restless. Candle colours change frequently. Wicks extend in both directions. Short pullbacks appear dramatic even when they are structurally insignificant.
On a traditional candlestick chart, normal candlesticks reflect every price movement and price gap, making real market price behaviour harder to interpret during trends.
For a trend trader, this creates friction. Every counter-coloured candle feels like a question. Every long wick feels like a warning. The trend is visible, but conviction is repeatedly tested.
This is not a flaw of candlesticks. It is simply the cost of seeing everything.
What changes when the same data is viewed through Heikin Ashi
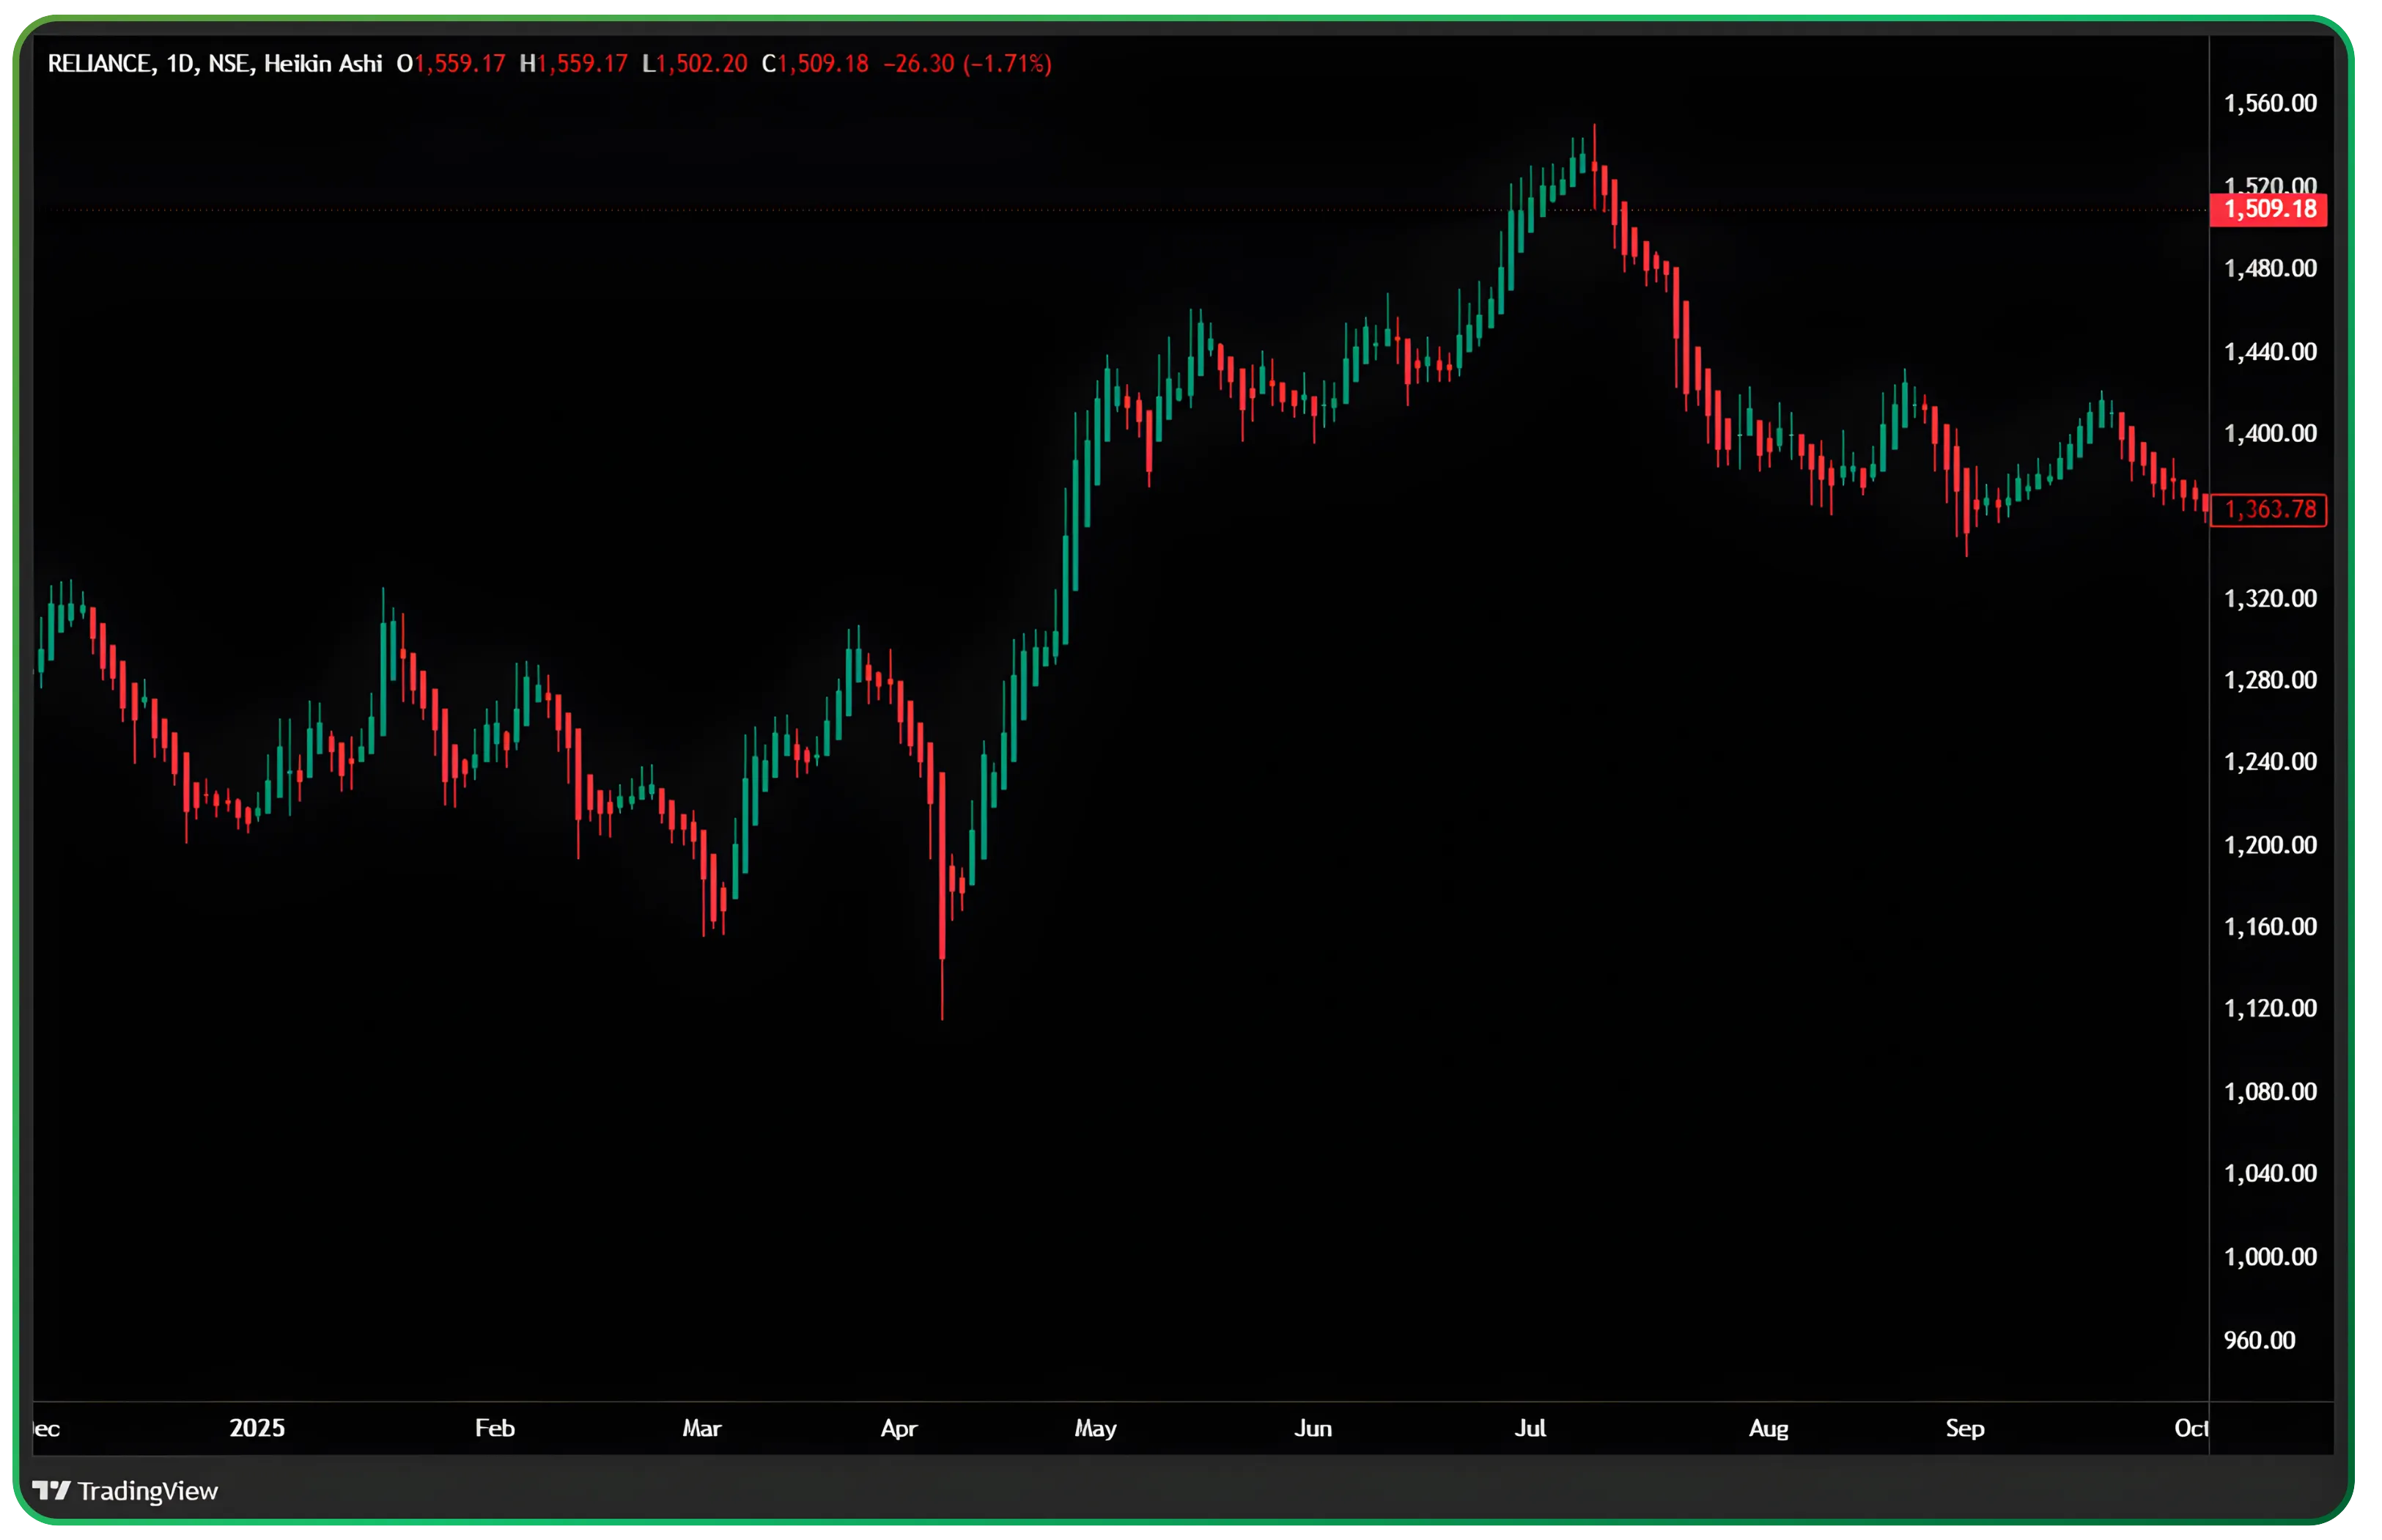
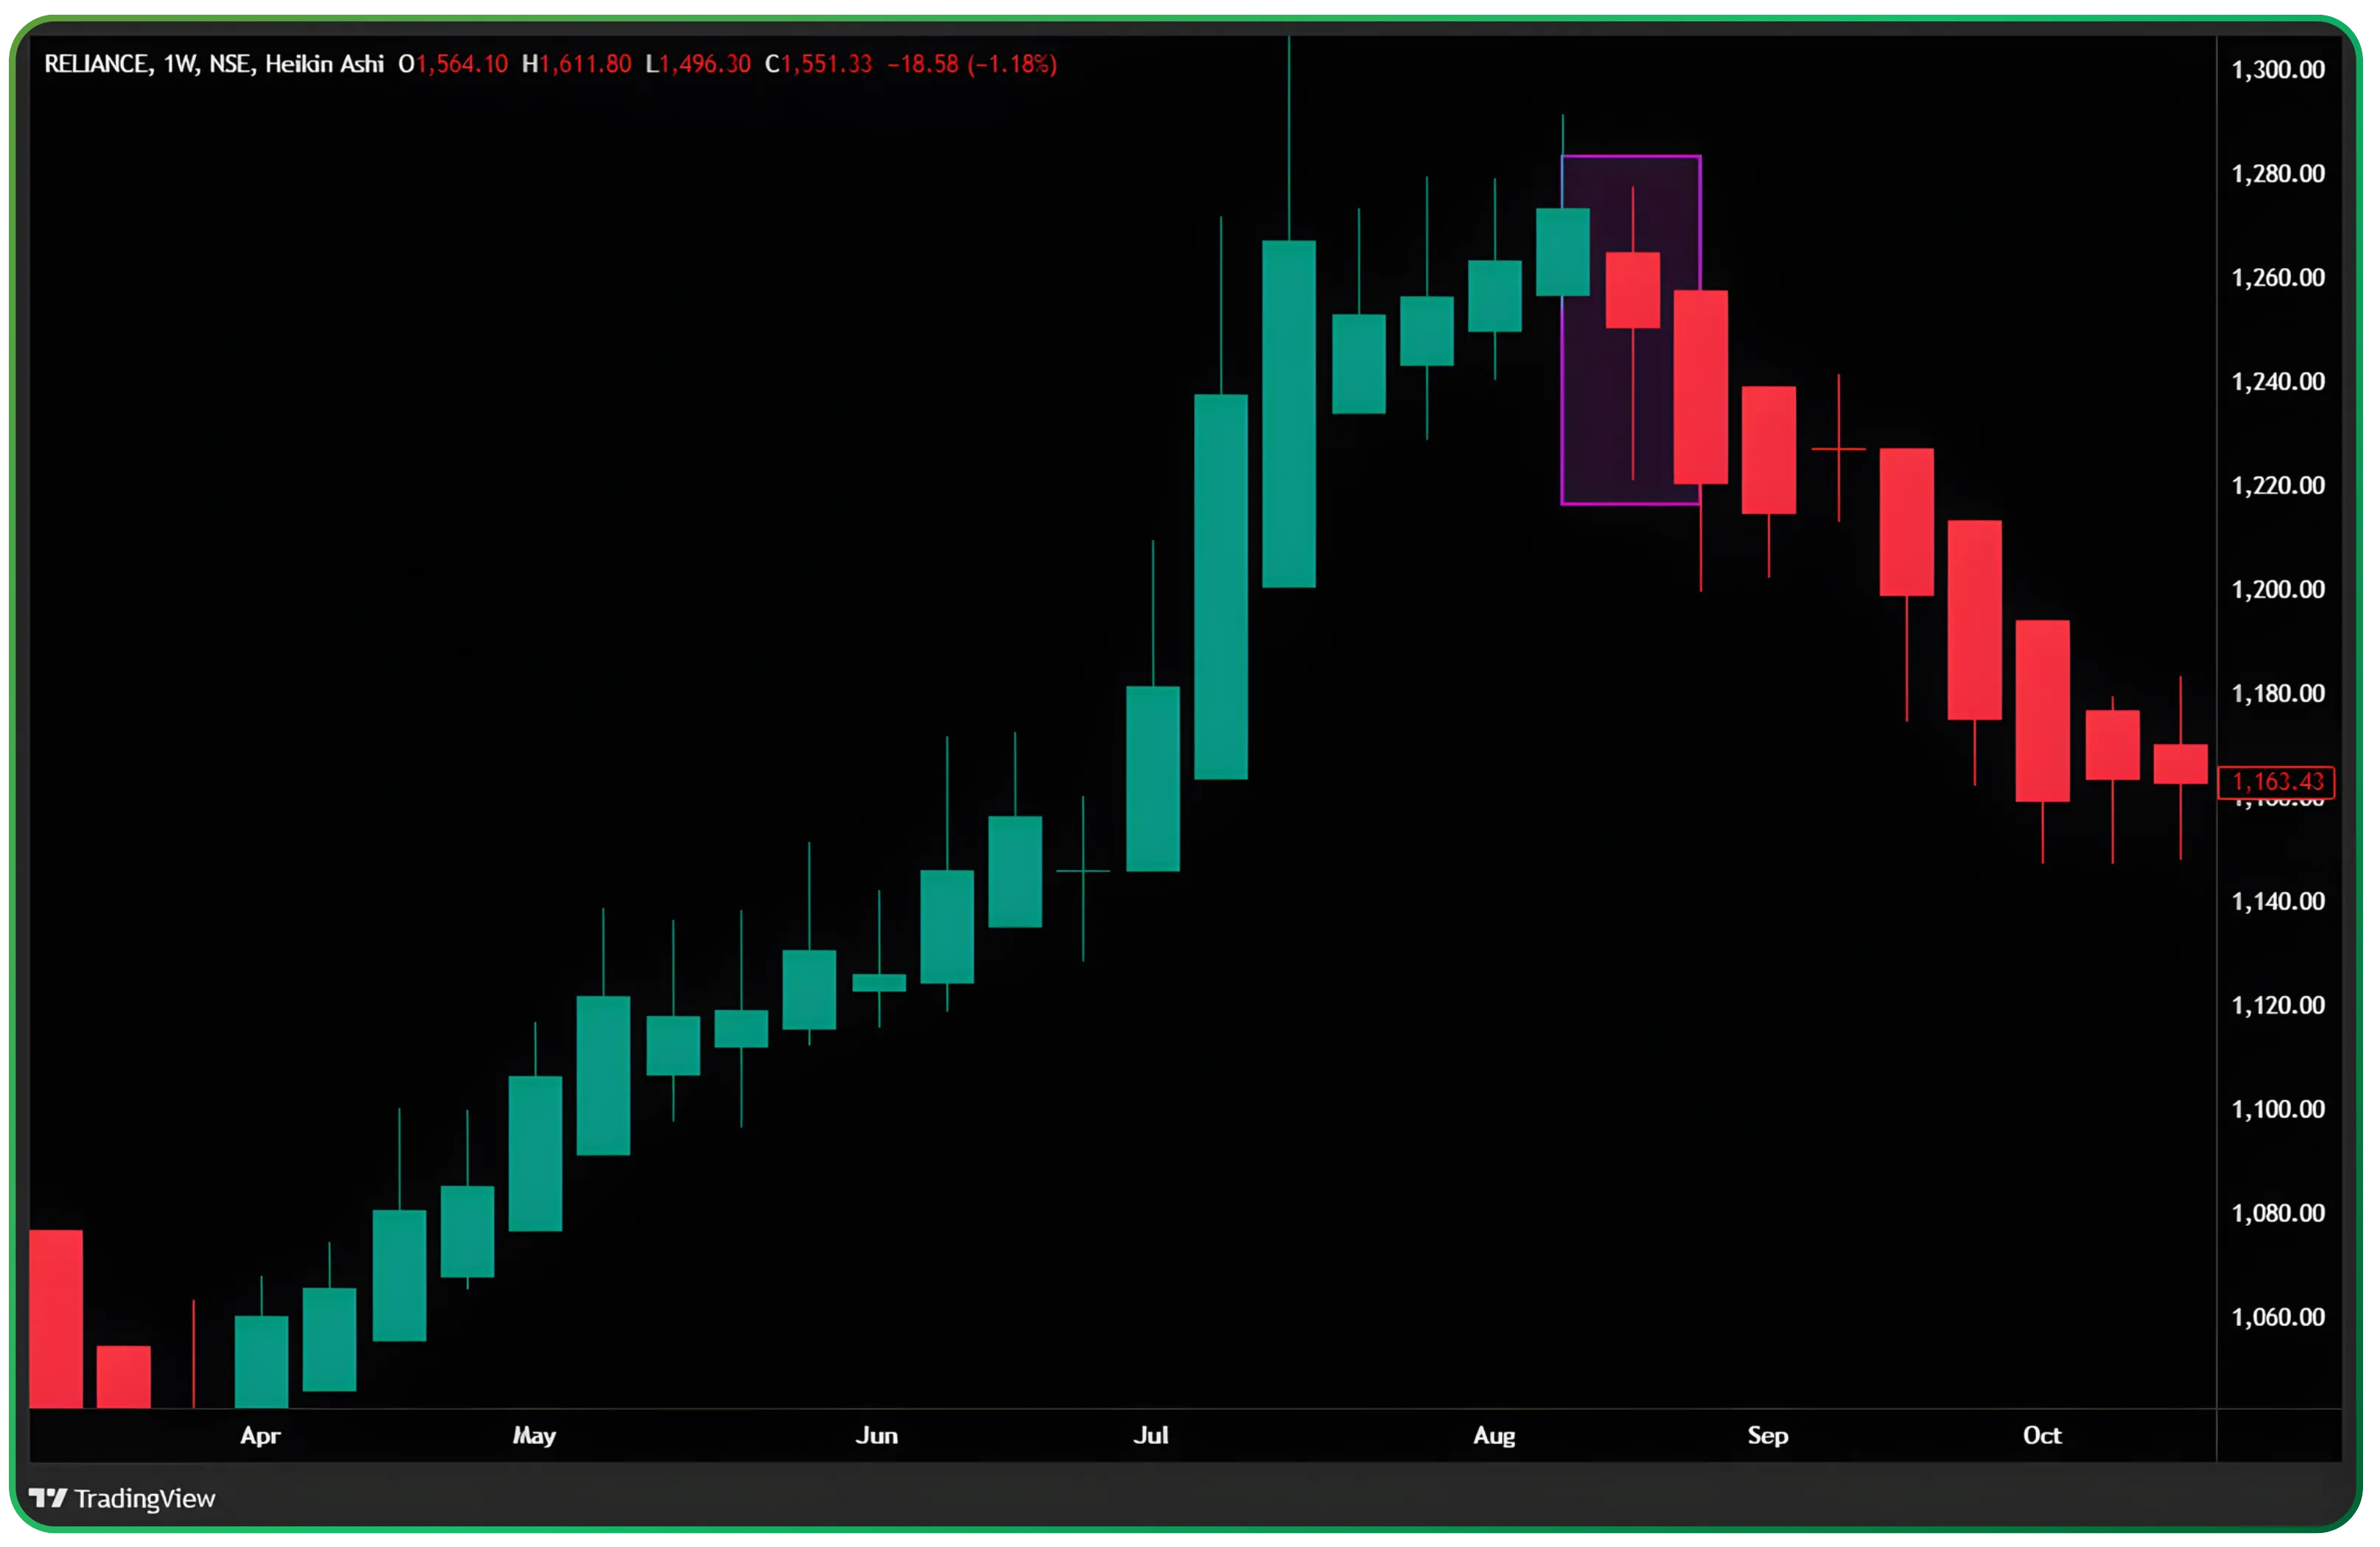
This is the same stock, same timeframe, same period. Only the candle construction has changed.
Heikin Ashi recalculates each candle using an average price derived from actual price data, rather than relying solely on the current bar’s open and close. As a result, short-term volatility is absorbed into the structure of the candle itself.
The immediate effect is visual calm. Candle colours persist longer. Pullbacks look proportionate rather than threatening. The chart stops reacting to every minor fluctuation and starts expressing direction more clearly.
Prices have not changed. Interpretation has.
How Heikin Ashi candles are constructed
Why they behave differently from traditional candles
A traditional candlestick is a record. A Heikin Ashi candle is a filter.
In Heikin Ashi:
- The open is derived from the previous candle, not the current session.
- The close is an average of the current session’s open, high, low and close.
- Highs and lows are adjusted to reflect smoothed extremes.
Because of this, Heikin Ashi candles:
- Lag price slightly
- Suppress sudden spikes
- Emphasise continuity over immediacy
This lag is intentional, allowing direction to emerge without the distraction of noise.
If execution discipline matters as much as analysis, understanding how to use bracket orders effectively on CubePlus can help structure trades with predefined entry, target, and stop-loss in a single setup.
The Heikin Ashi formula
The Heikin Ashi formula is based on the previous candle and the current session’s stock data, rather than a single real price print. This is what creates their smoothing effect.
The calculations are as follows:
    Heikin Ashi Close = (Open + High + Low + Close) / 4

    Heikin Ashi Open  = (Previous Heikin Ashi Open + Previous Heikin Ashi Close) / 2

    Heikin Ashi High  = max(High, Heikin Ashi Open, Heikin Ashi Close)

    Heikin Ashi Low   = min(Low, Heikin Ashi Open, Heikin Ashi Close)
What this really means is simple. Each candle borrows stability from the one before it and balances it with the current session’s price range. Sudden spikes are softened. Directional movement is emphasised. Noise is absorbed rather than displayed.
This is why Heikin Ashi reacts slower than traditional candles.
How to read Heikin Ashi candles
Interpreting trend behaviour, not signals
Heikin Ashi is not read candle by candle in the way traditional charts often are. It is read in sequences.
Here is how experienced traders interpret them:
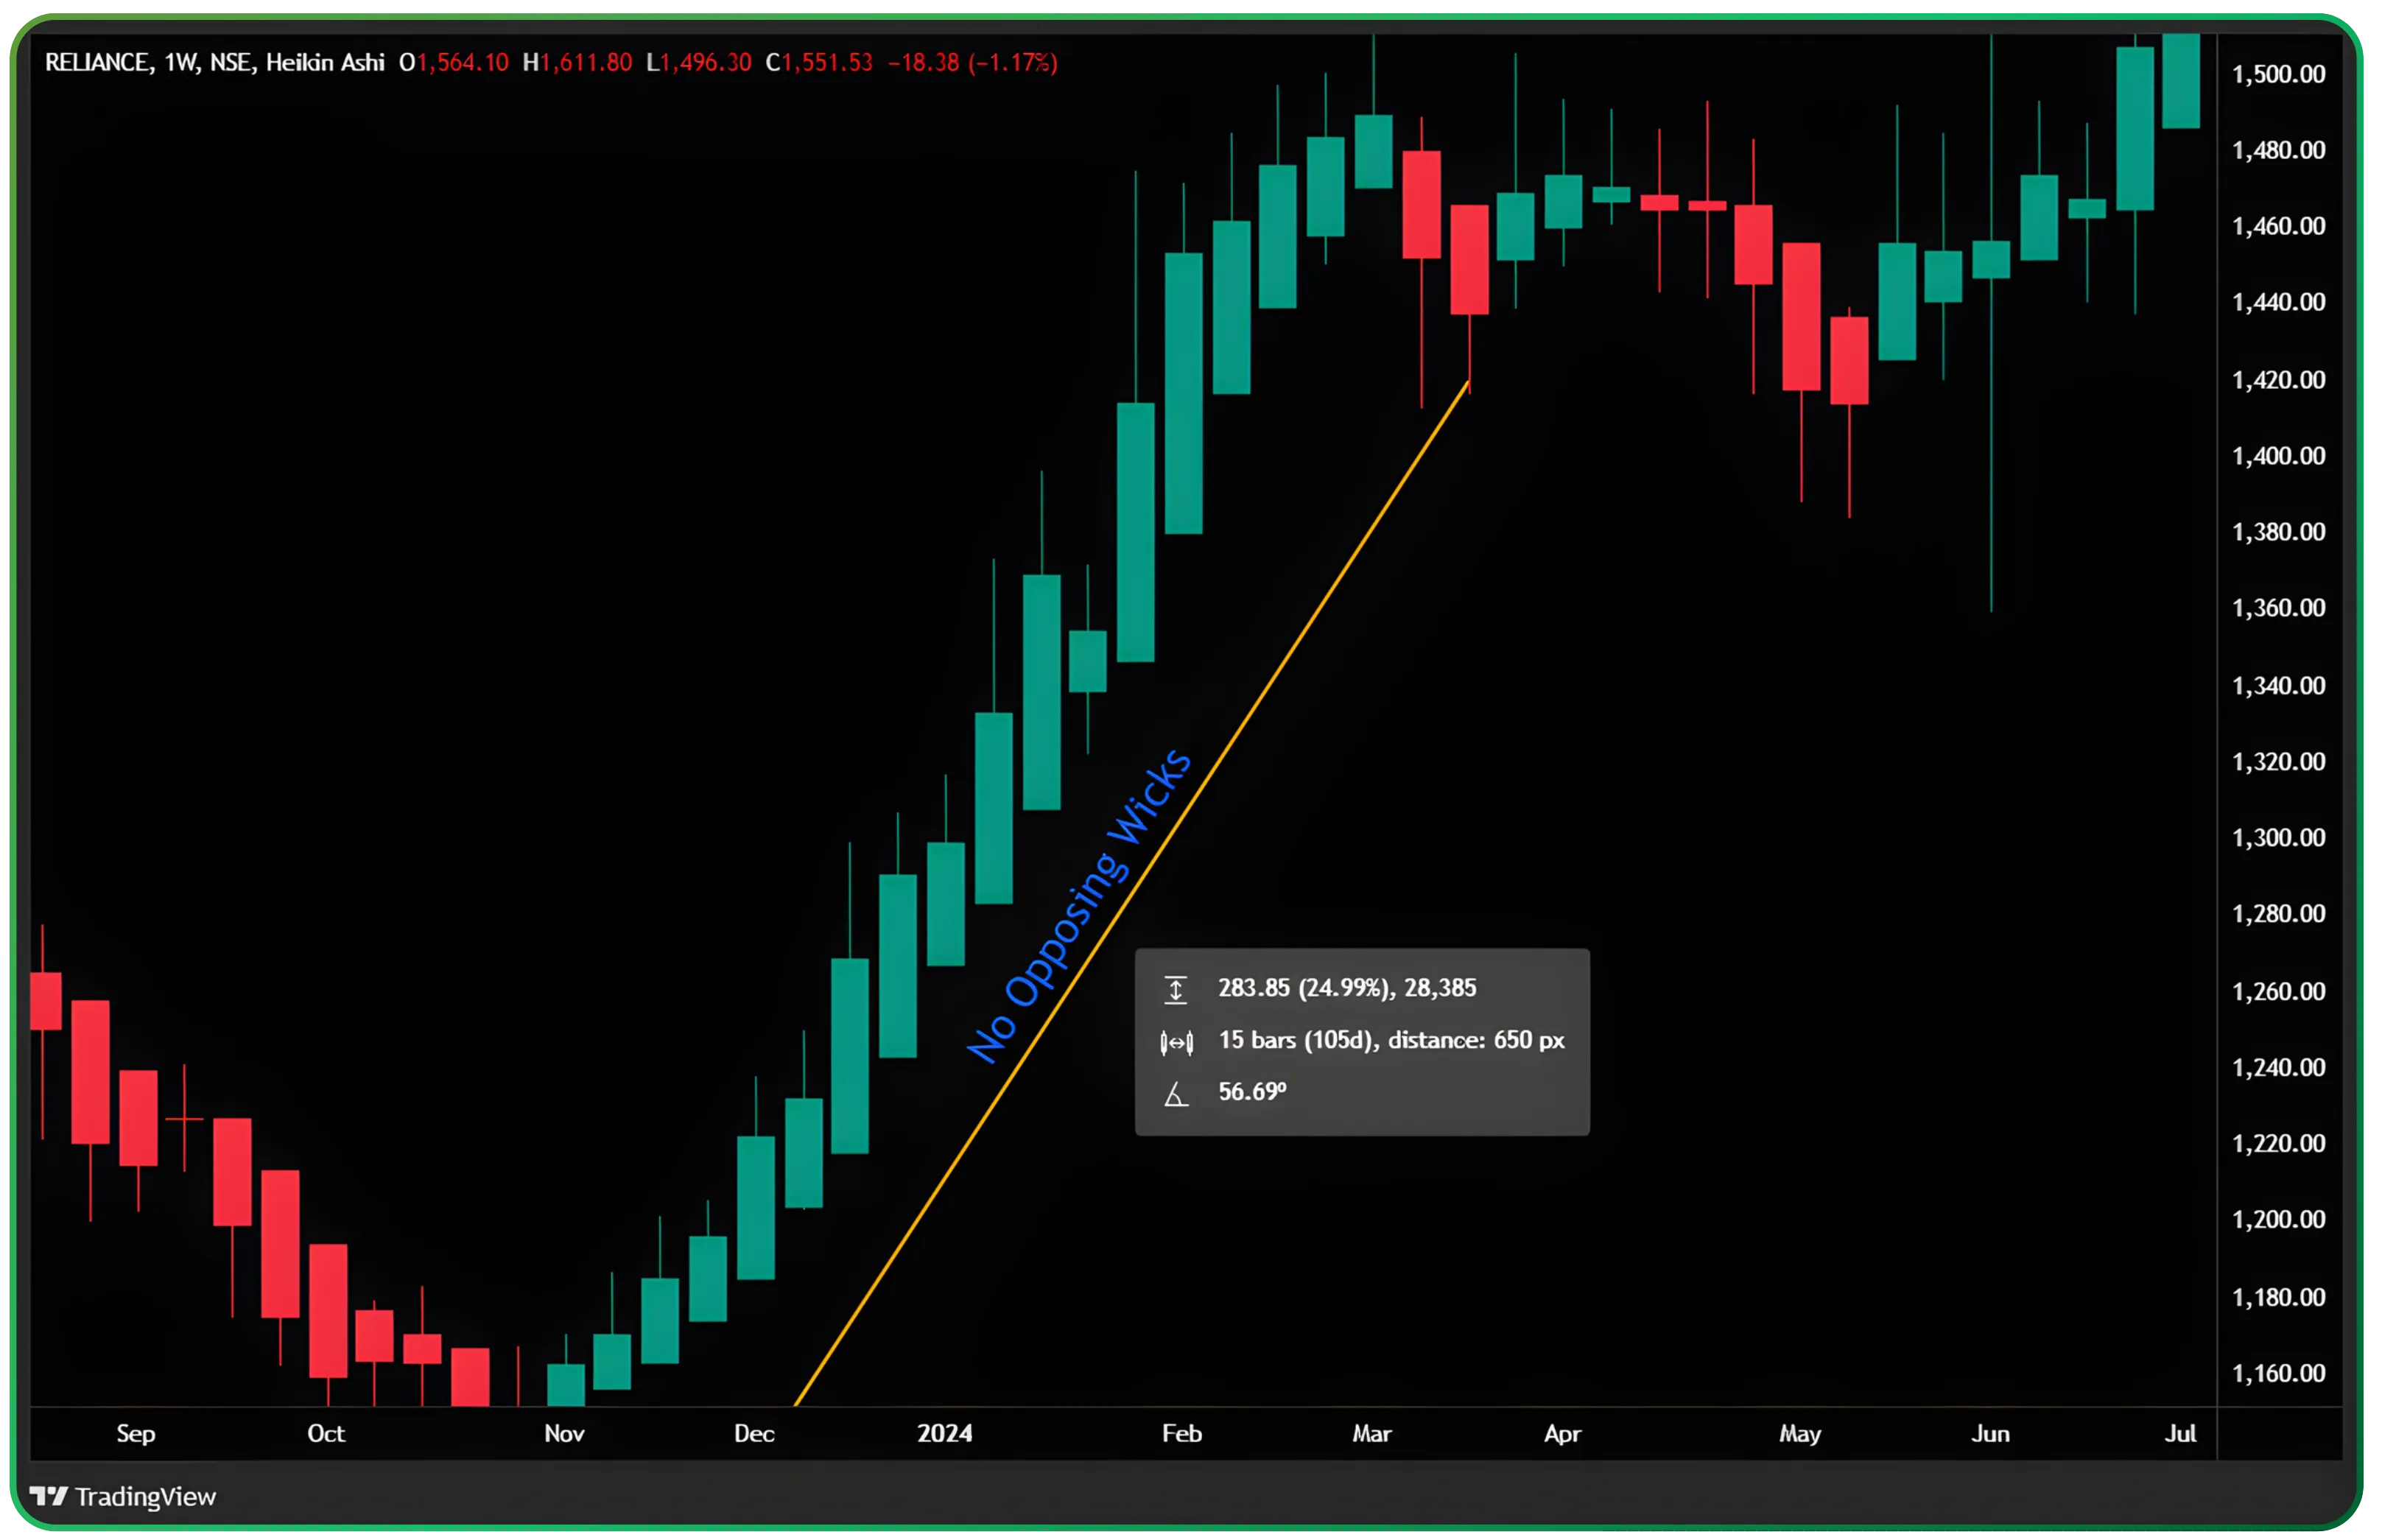
Long same-colour candles with little or no opposing wick
These reflect strong directional control. The trend is healthy and uninterrupted.
Shrinking candle bodies
Momentum is slowing. The trend may still be intact, but participation is thinning.
Wicks on both sides of the candle
This signals balance and hesitation. It often appears during consolidation or transition phases.
First opposite-colour candle after a long run
This is information, not an exit trigger. It marks a loss of dominance, not necessarily a reversal.
Unlike traditional candlesticks, individual Heikin Ashi candles are rarely acted upon in isolation. Meaning emerges from repetition.
Staying with the move
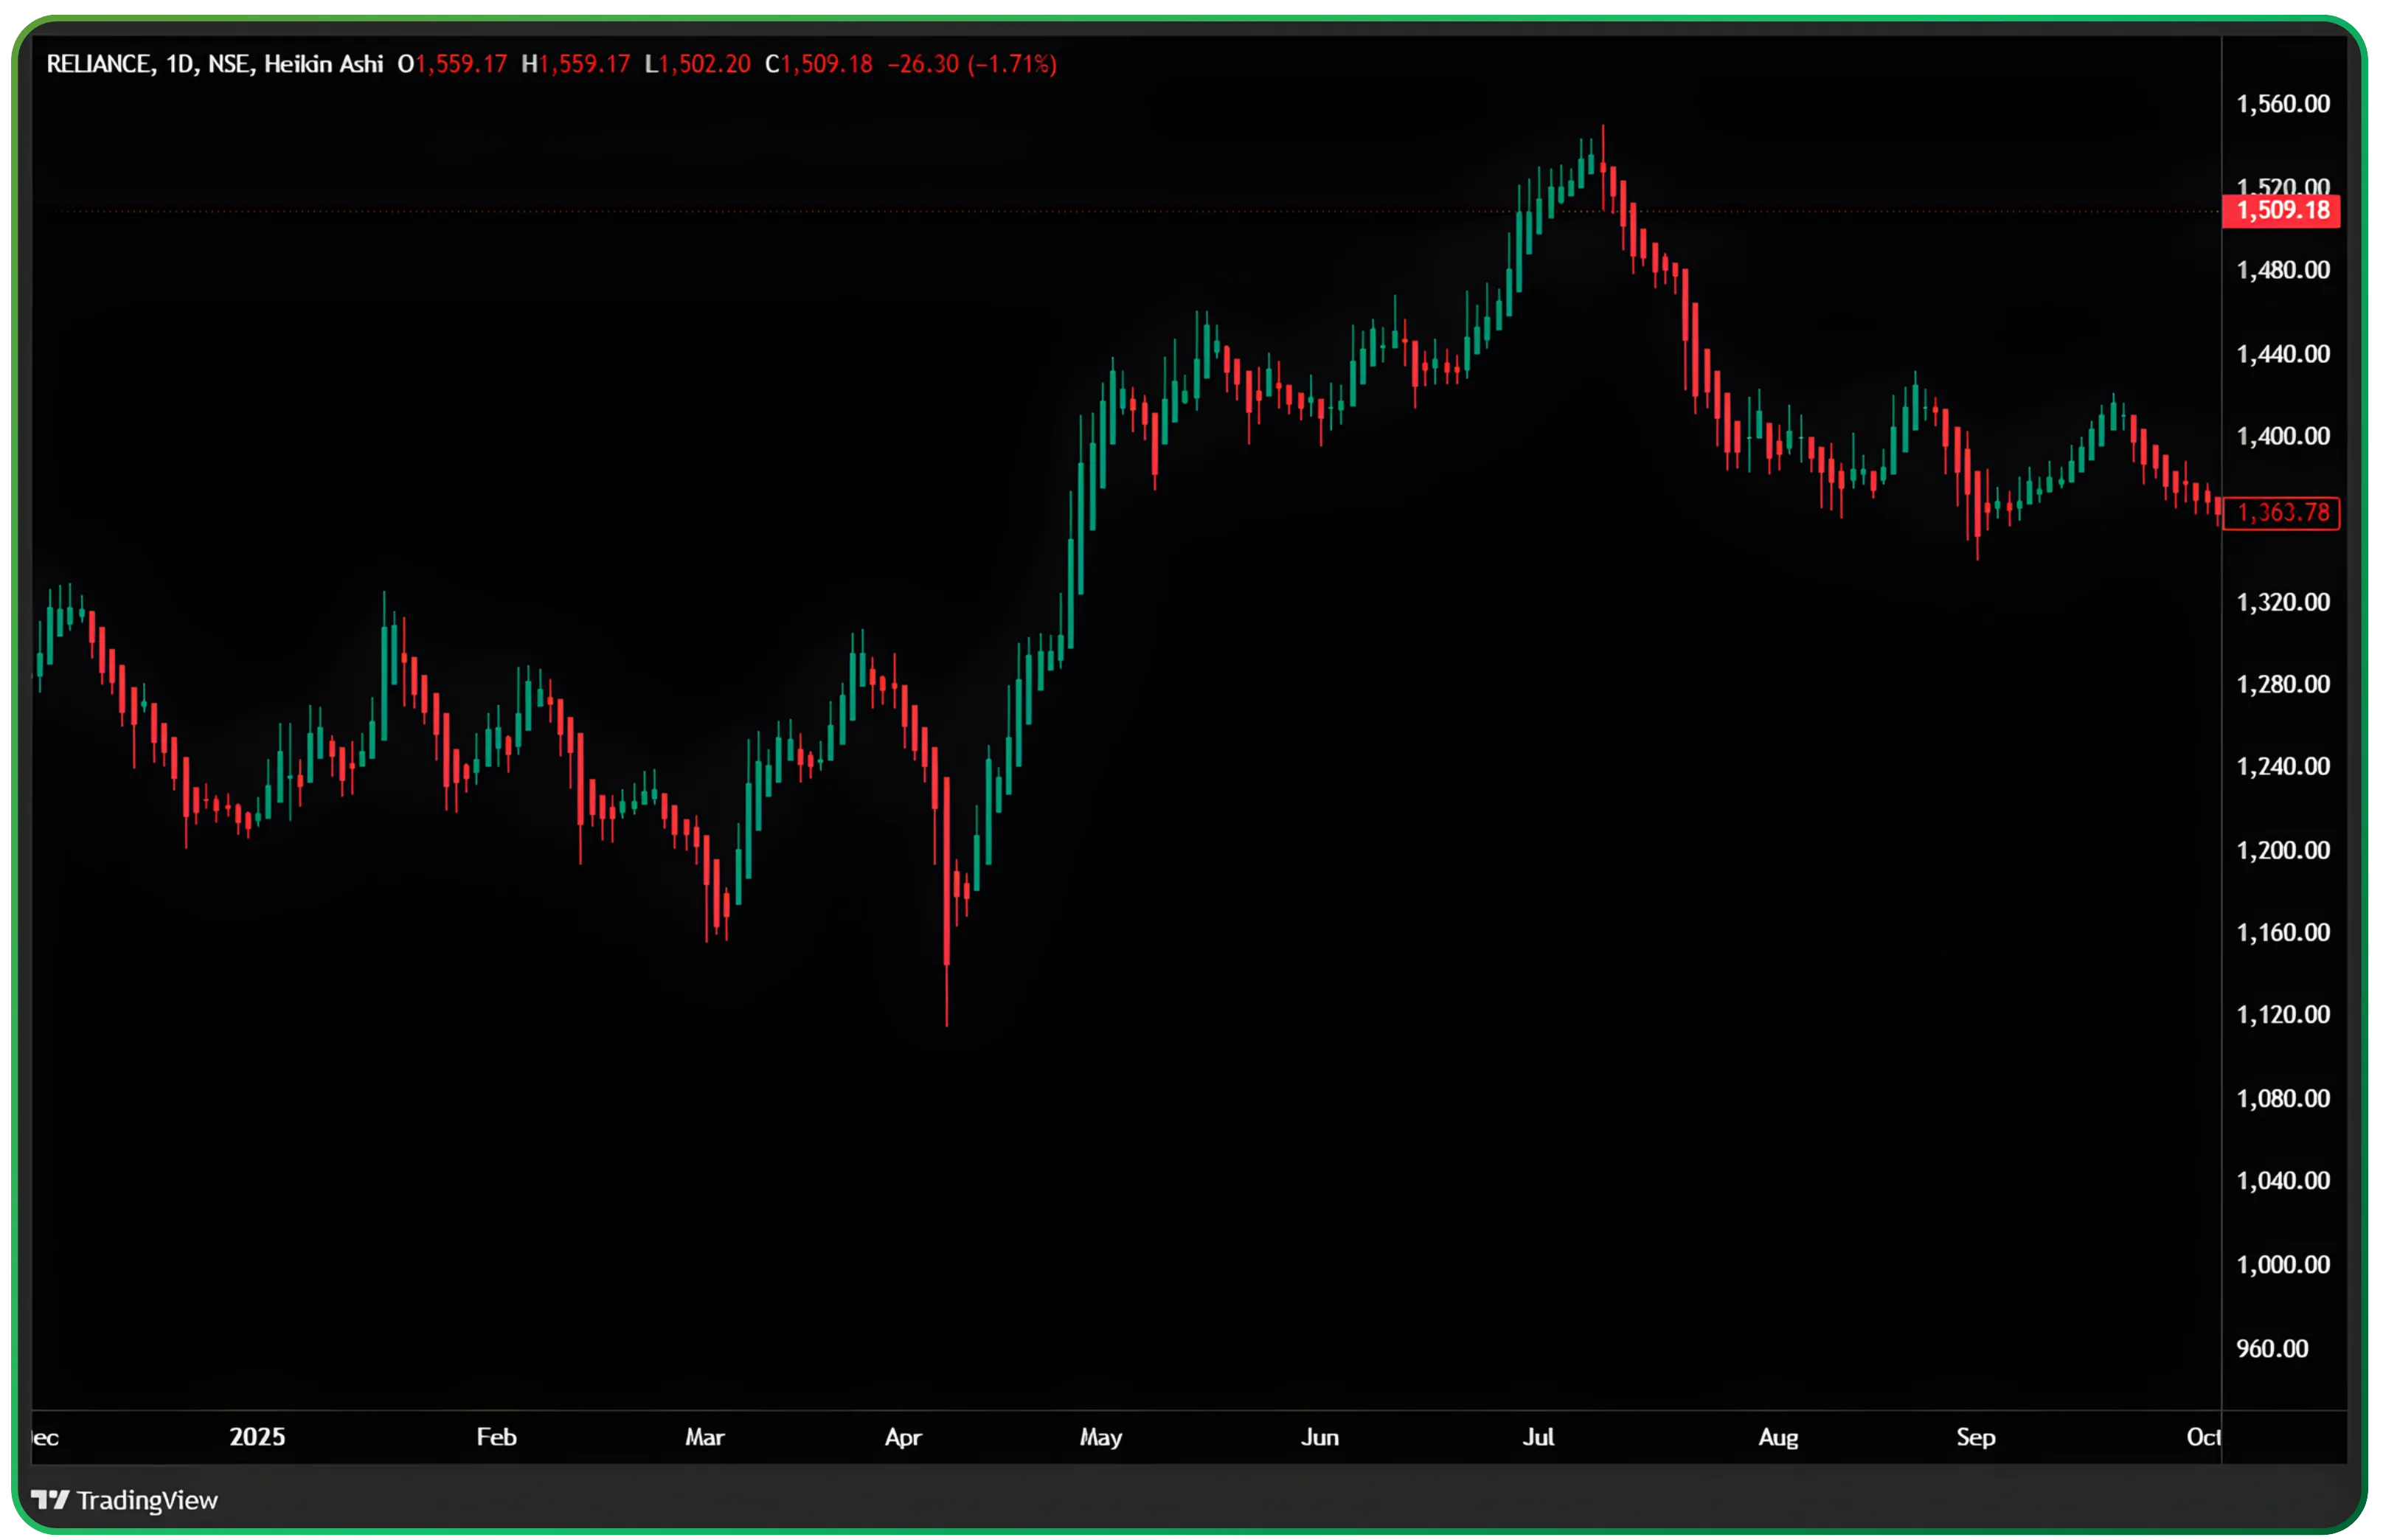
In this section of the Reliance chart, the value of Heikin Ashi becomes obvious.
The trend persists through minor pullbacks that would otherwise look alarming on a normal candlestick chart. Candle colour remains consistent. Lower wicks are shallow. Momentum fades gradually rather than abruptly.
This is where Heikin Ashi helps most. It does not improve entries. It improves patience.
Before acting on price moves, see how “Active by Volume” and “Active by Value” data can help confirm conviction behind trades.
What happens when the market refuses to trend
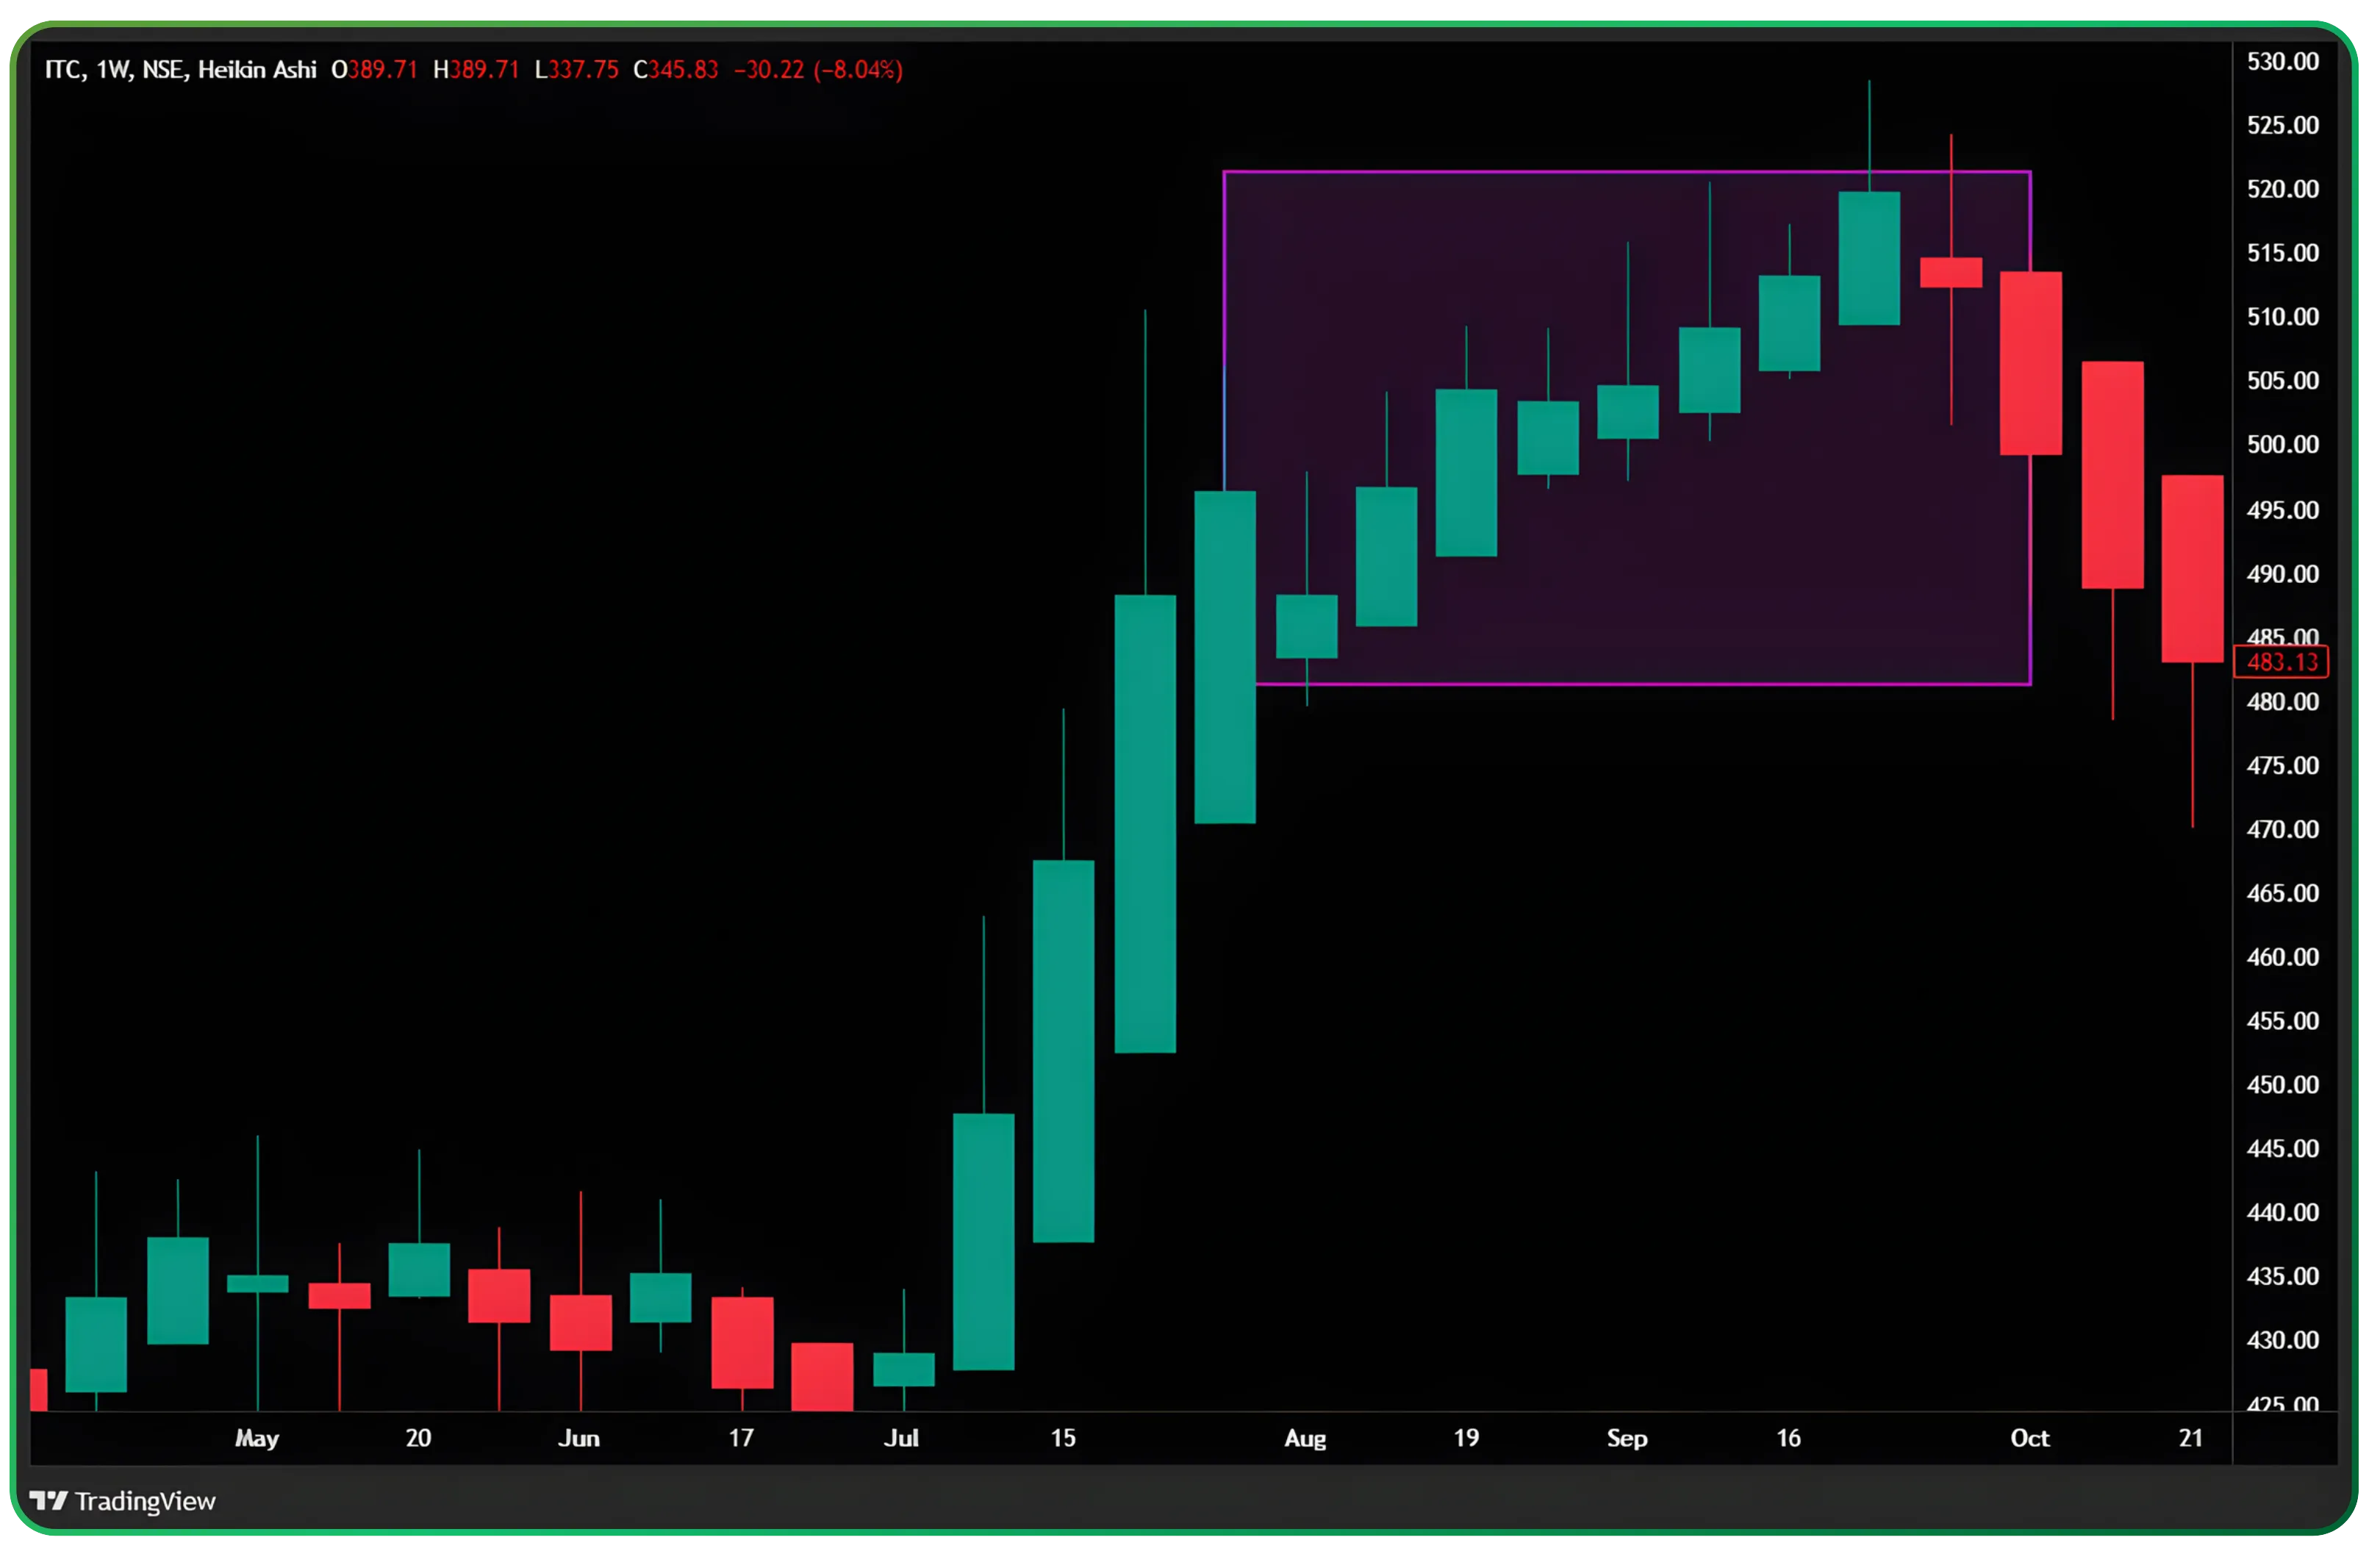
To understand the limits of Heikin Ashi, it helps to examine a different structure.
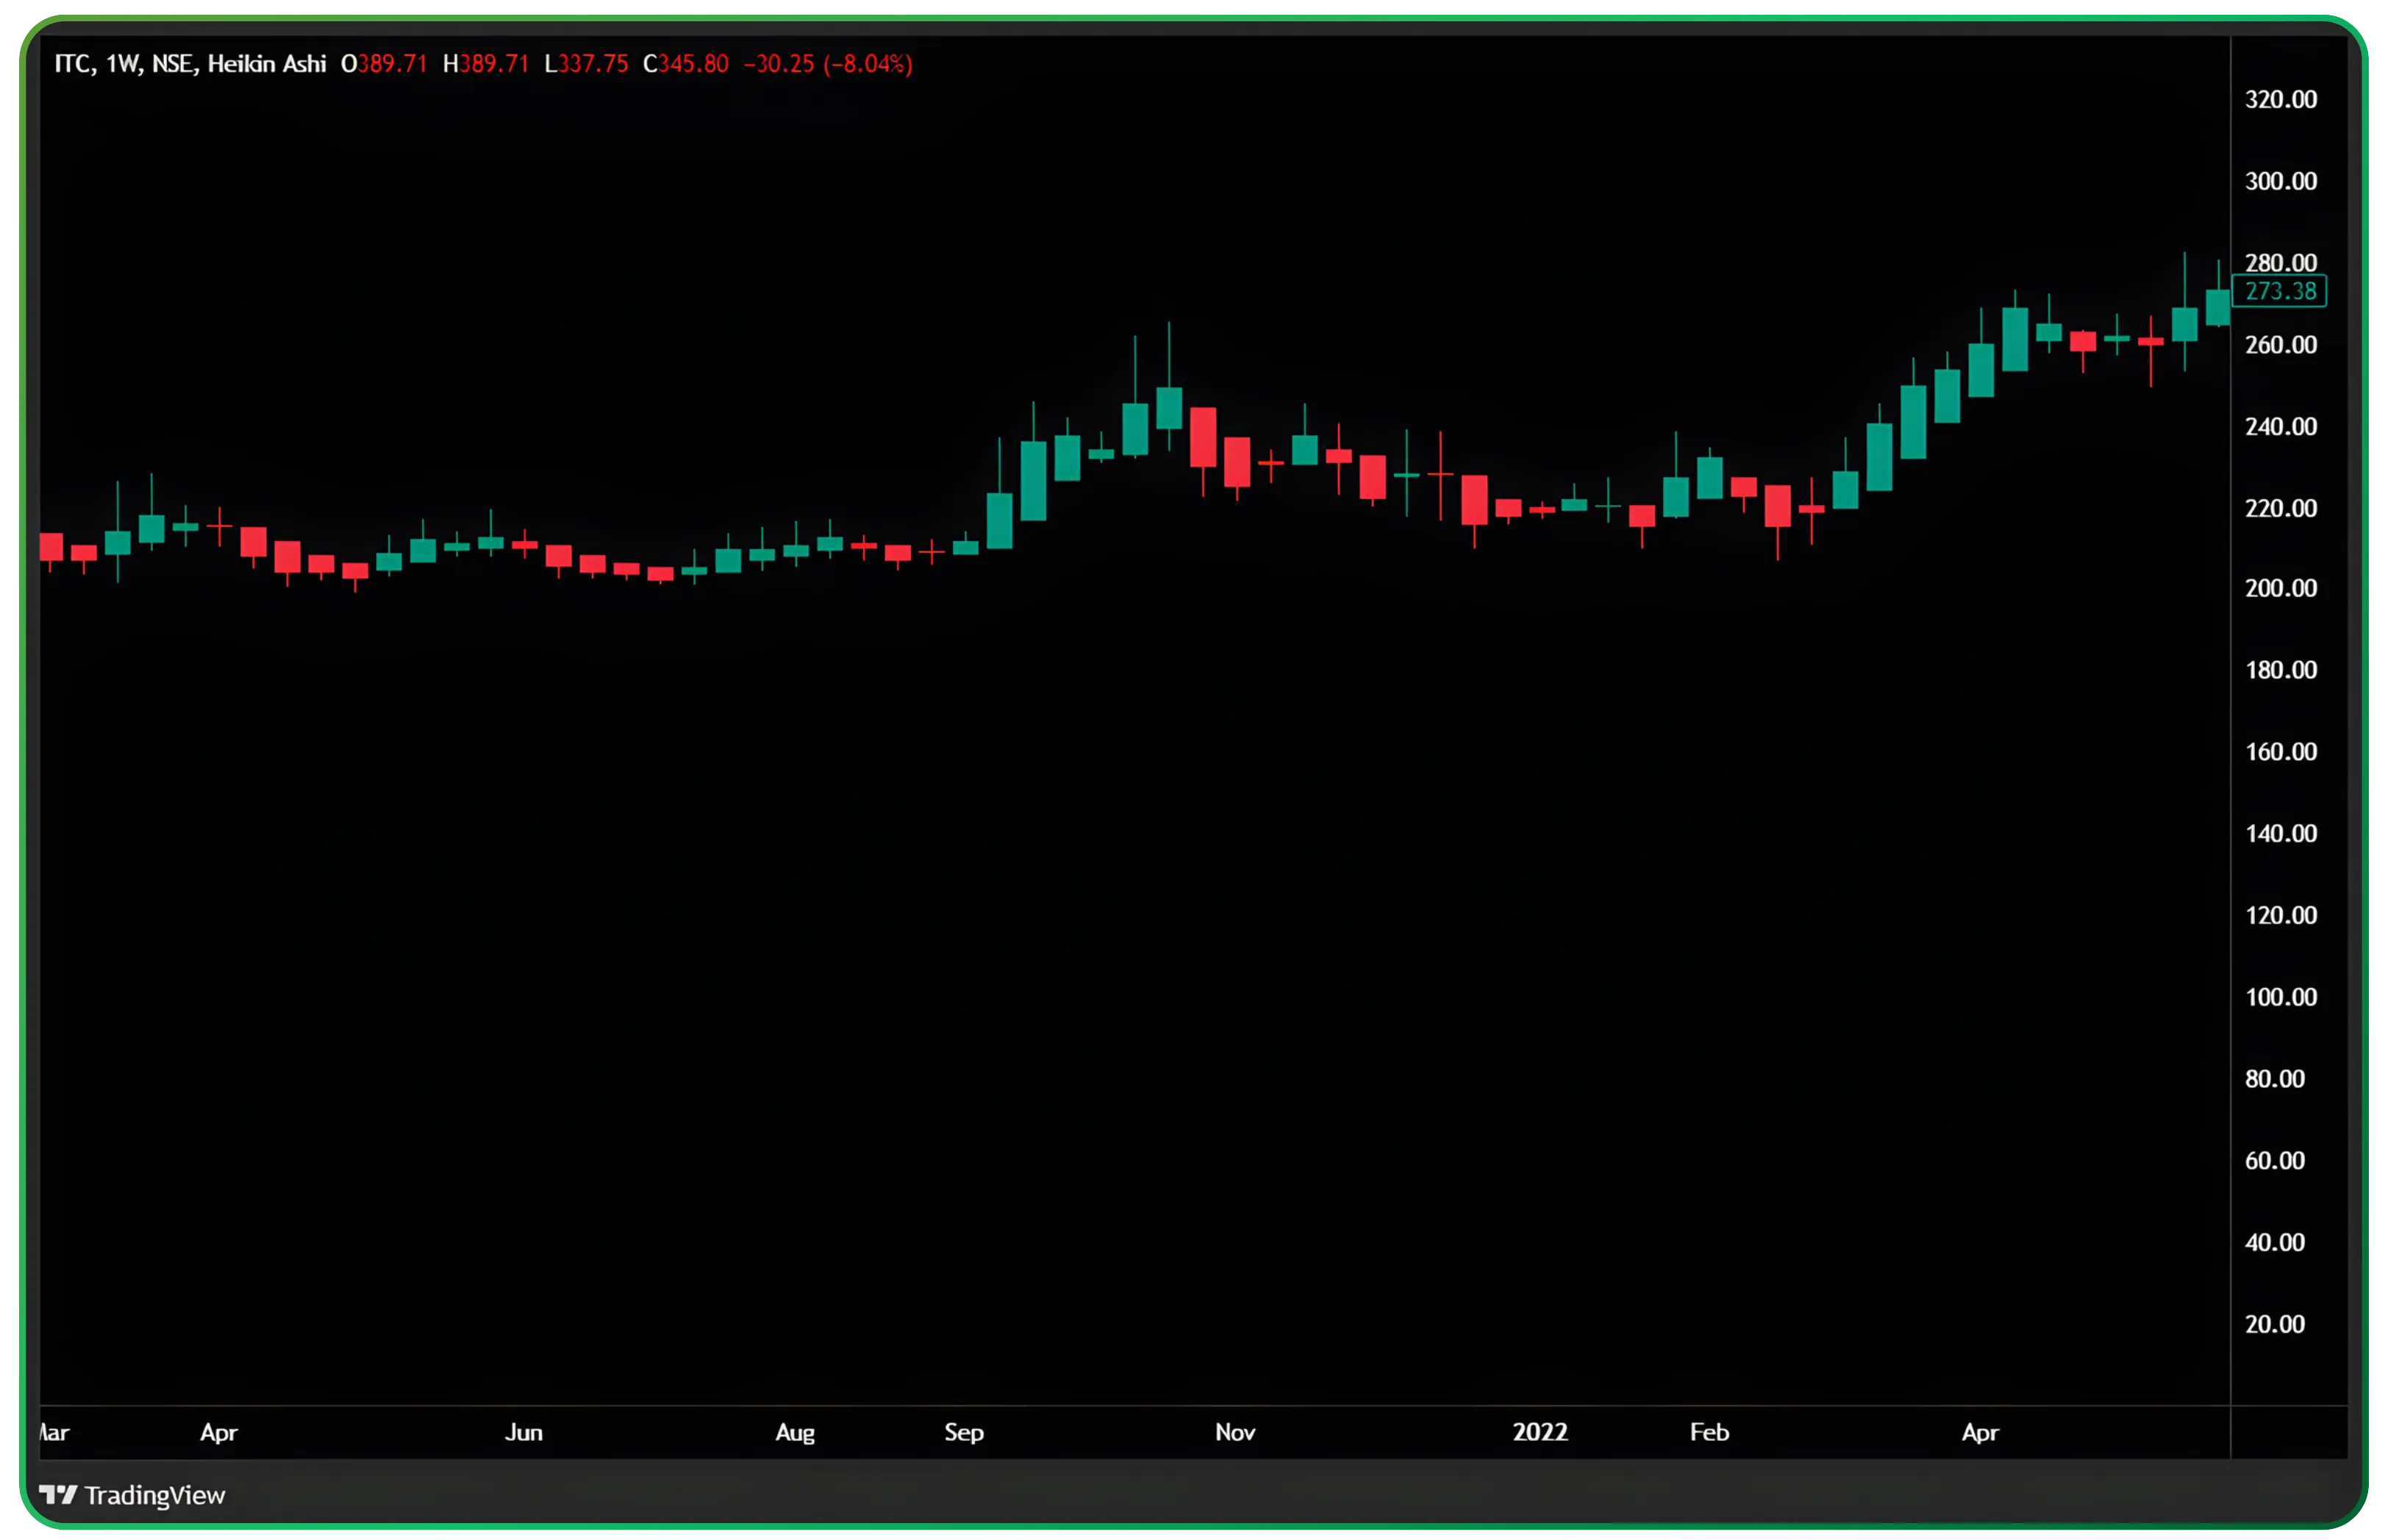
This weekly chart of ITC shows a market that lacks sustained direction even over longer timeframes. Despite the smoothing effect, candle colours alternate frequently. Bodies remain modest. Wicks appear on both sides.
Heikin Ashi does not manufacture clarity where structure is absent. It reflects the market honestly, even when the message is indecision.
Confirmation, not contradiction
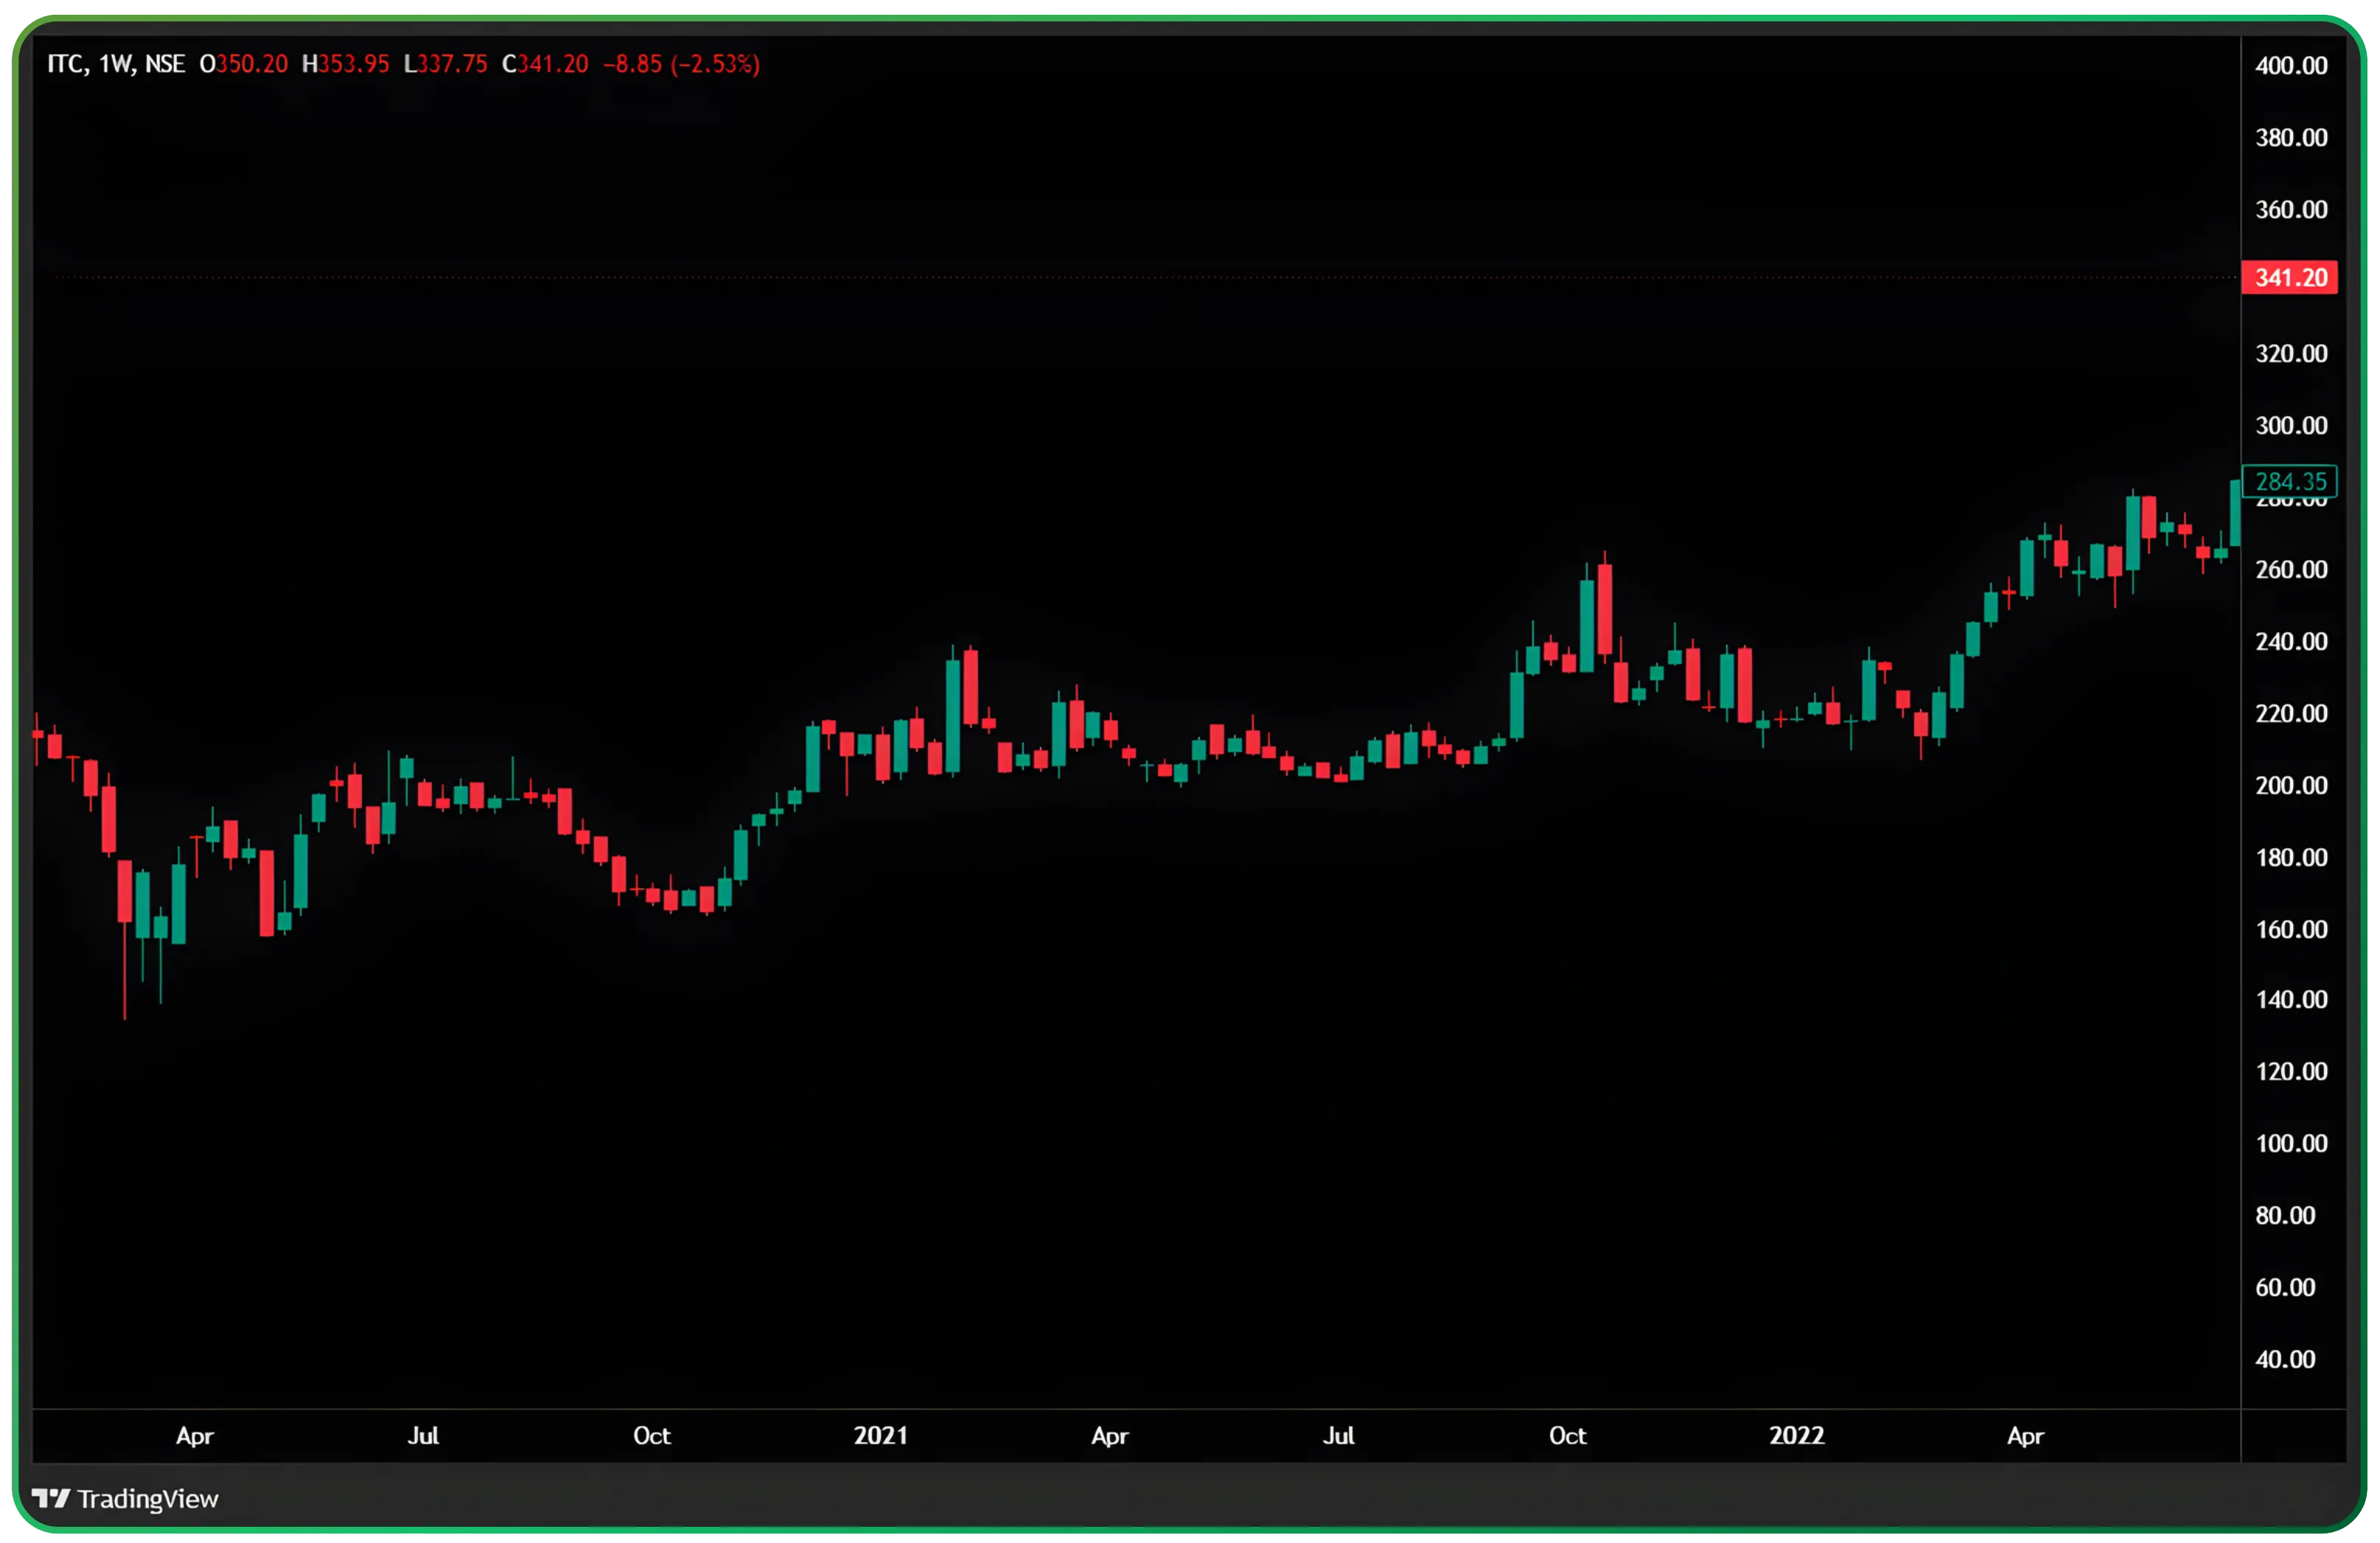
Switching back to traditional candlesticks confirms the same reality. The stock is range-bound. Price moves, but progress is limited.
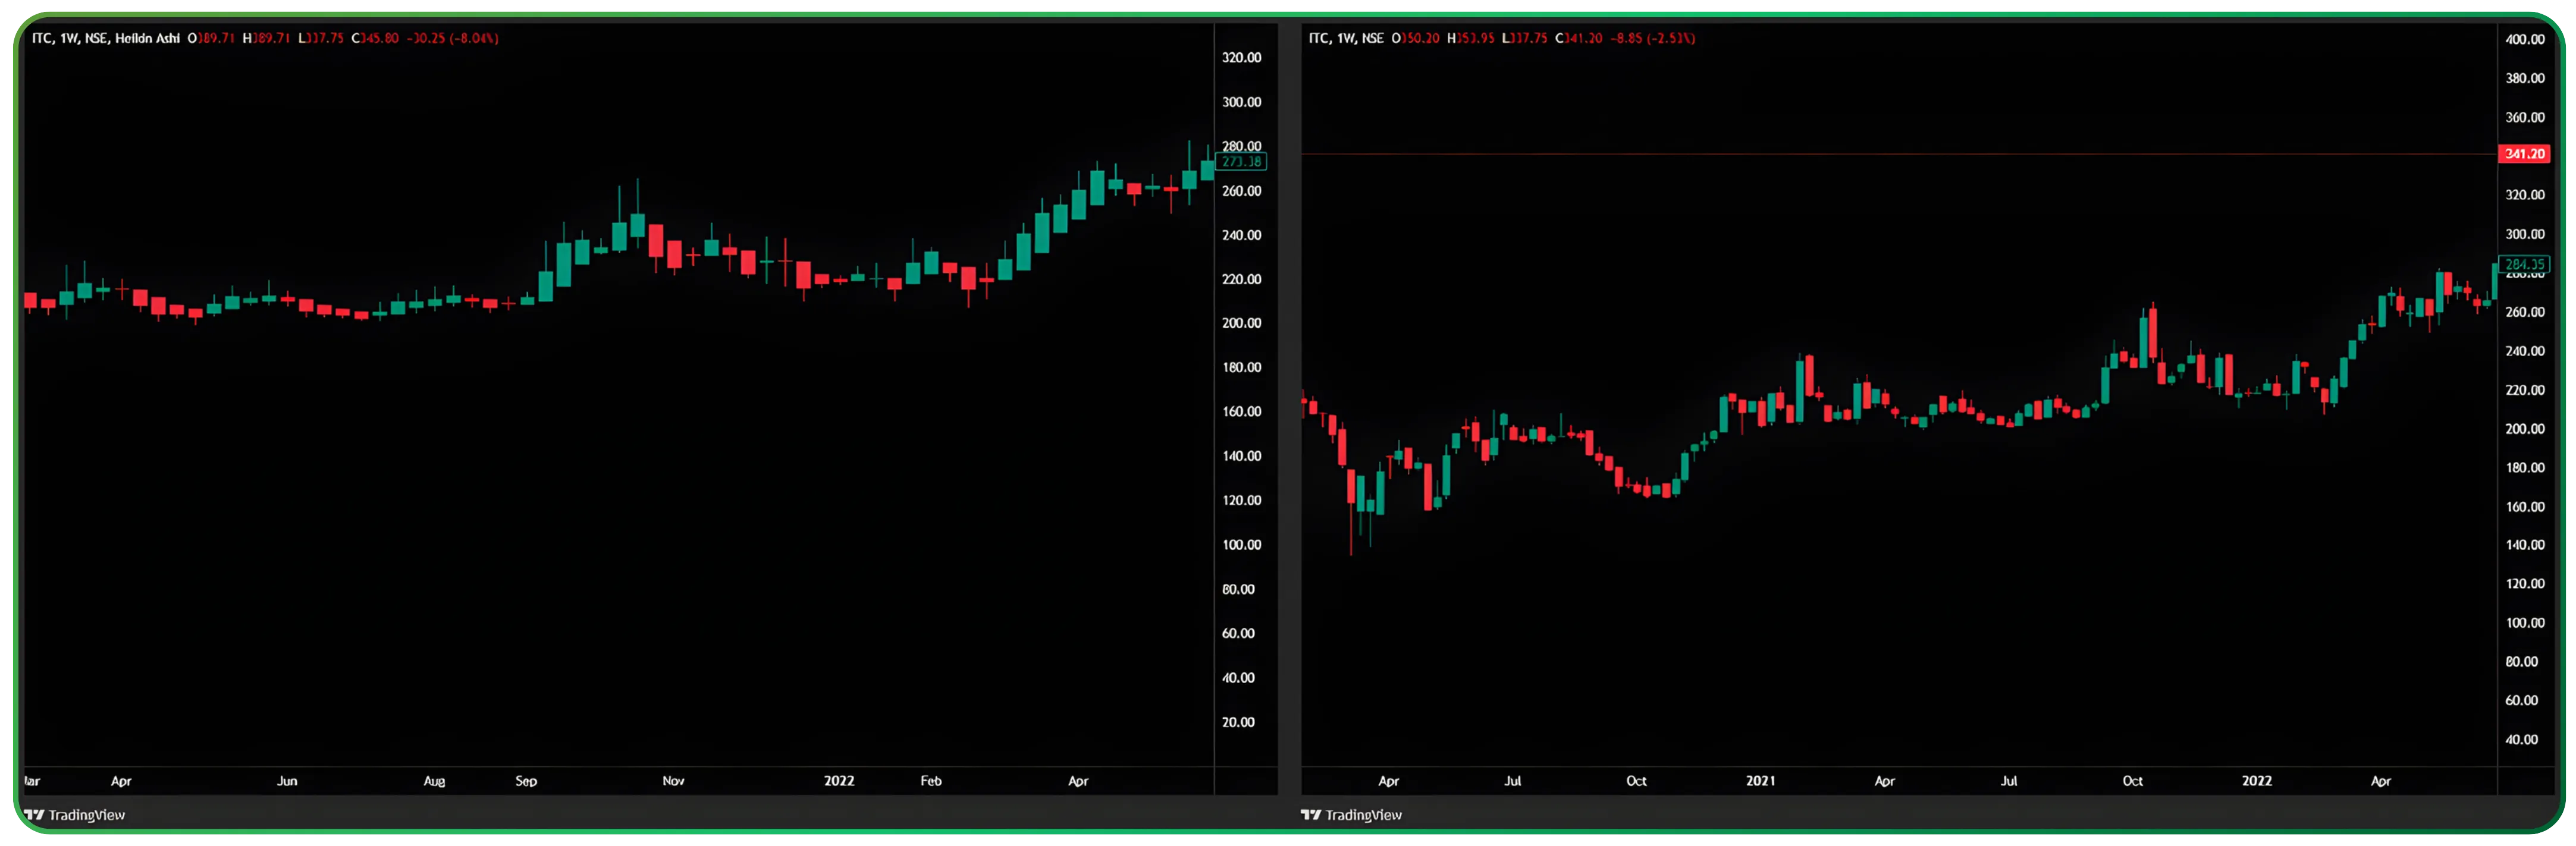
Seen together, the two ITC charts reinforce an important principle: Heikin Ashi simplifies price action, but it does not distort it.
A note on timeframes
Daily charts are ideal for observing swing-level trends. Weekly charts remove even more noise and expose structural direction, or the lack of it.
Using Reliance on a daily timeframe and ITC on a weekly timeframe is deliberate. One demonstrates how Heikin Ashi behaves in a trending environment. The other stress-tests it where trends fail to emerge even at higher resolutions.
Where Heikin Ashi fits in real trading
Heikin Ashi is not designed for scalping. It is not suited for precision entries or tight stop placement. It works best as a trend clarity tool, often alongside traditional candlesticks or basic structure analysis.
Its real value is behavioural. It reduces overreaction. It encourages consistency. It helps traders stay with trends longer than their instincts would normally allow.
Heikin Ashi does not tell you when to trade. It tells you when the trend is still worth respecting.
That difference is subtle. And for trend traders, it is everything.
When trends are clear, discipline matters. Start trading on CubePlus by Tradejini.
Disclaimer: The information provided in our blogs is for informational purposes only and should not be construed as financial, investment, or trading advice. Trading and investing in the securities market carries risk. Always conduct your own research and consult with a qualified financial advisor before making any investment decisions. Past performance is not indicative of future results. Copyrighted and original content for your trading and investing needs.
© 2026 — Tradejini. All Rights Reserved.


