


Open Interest on a price chart is one of those features that can look complicated at first glance. But once you understand what it’s actually showing, it becomes one of the simplest ways to read where the market is positioned. Open interest profile trading is built on a simple idea: instead of switching between charts and option chains, you can see where participants are concentrated directly on the price itself. This guide breaks down what OI Profile is, how to read it on NxtOption, and how traders use it in real market conditions, not just in theory.
What is OI Profile in Options Trading
Open Interest (OI) is simply the number of active, outstanding contracts in the options market at any given strike. Every options contract has two sides (a call option and a put option) and market participants build positions in both depending on their view. OI Profile takes this data and plots it directly on your price chart as horizontal bars at each strike level, giving you a visual picture of where significant option positions are concentrated.
The idea is straightforward: strikes where a large number of participants have written options tend to act as reference points. Option writers, who are typically larger, better-capitalised participants, generally try to defend their positions. This defence can show up as price friction, which is why high-OI strikes often correspond to areas where price slows down, reverses, or consolidates.
On the NxtOption platform, options open interest analysis is built directly into the charting terminal, so you can overlay it on any timeframe and configure it by expiry. So you are always looking at OI that is relevant to the contract period you are trading.
How to Read OI Profile Bars on a Chart
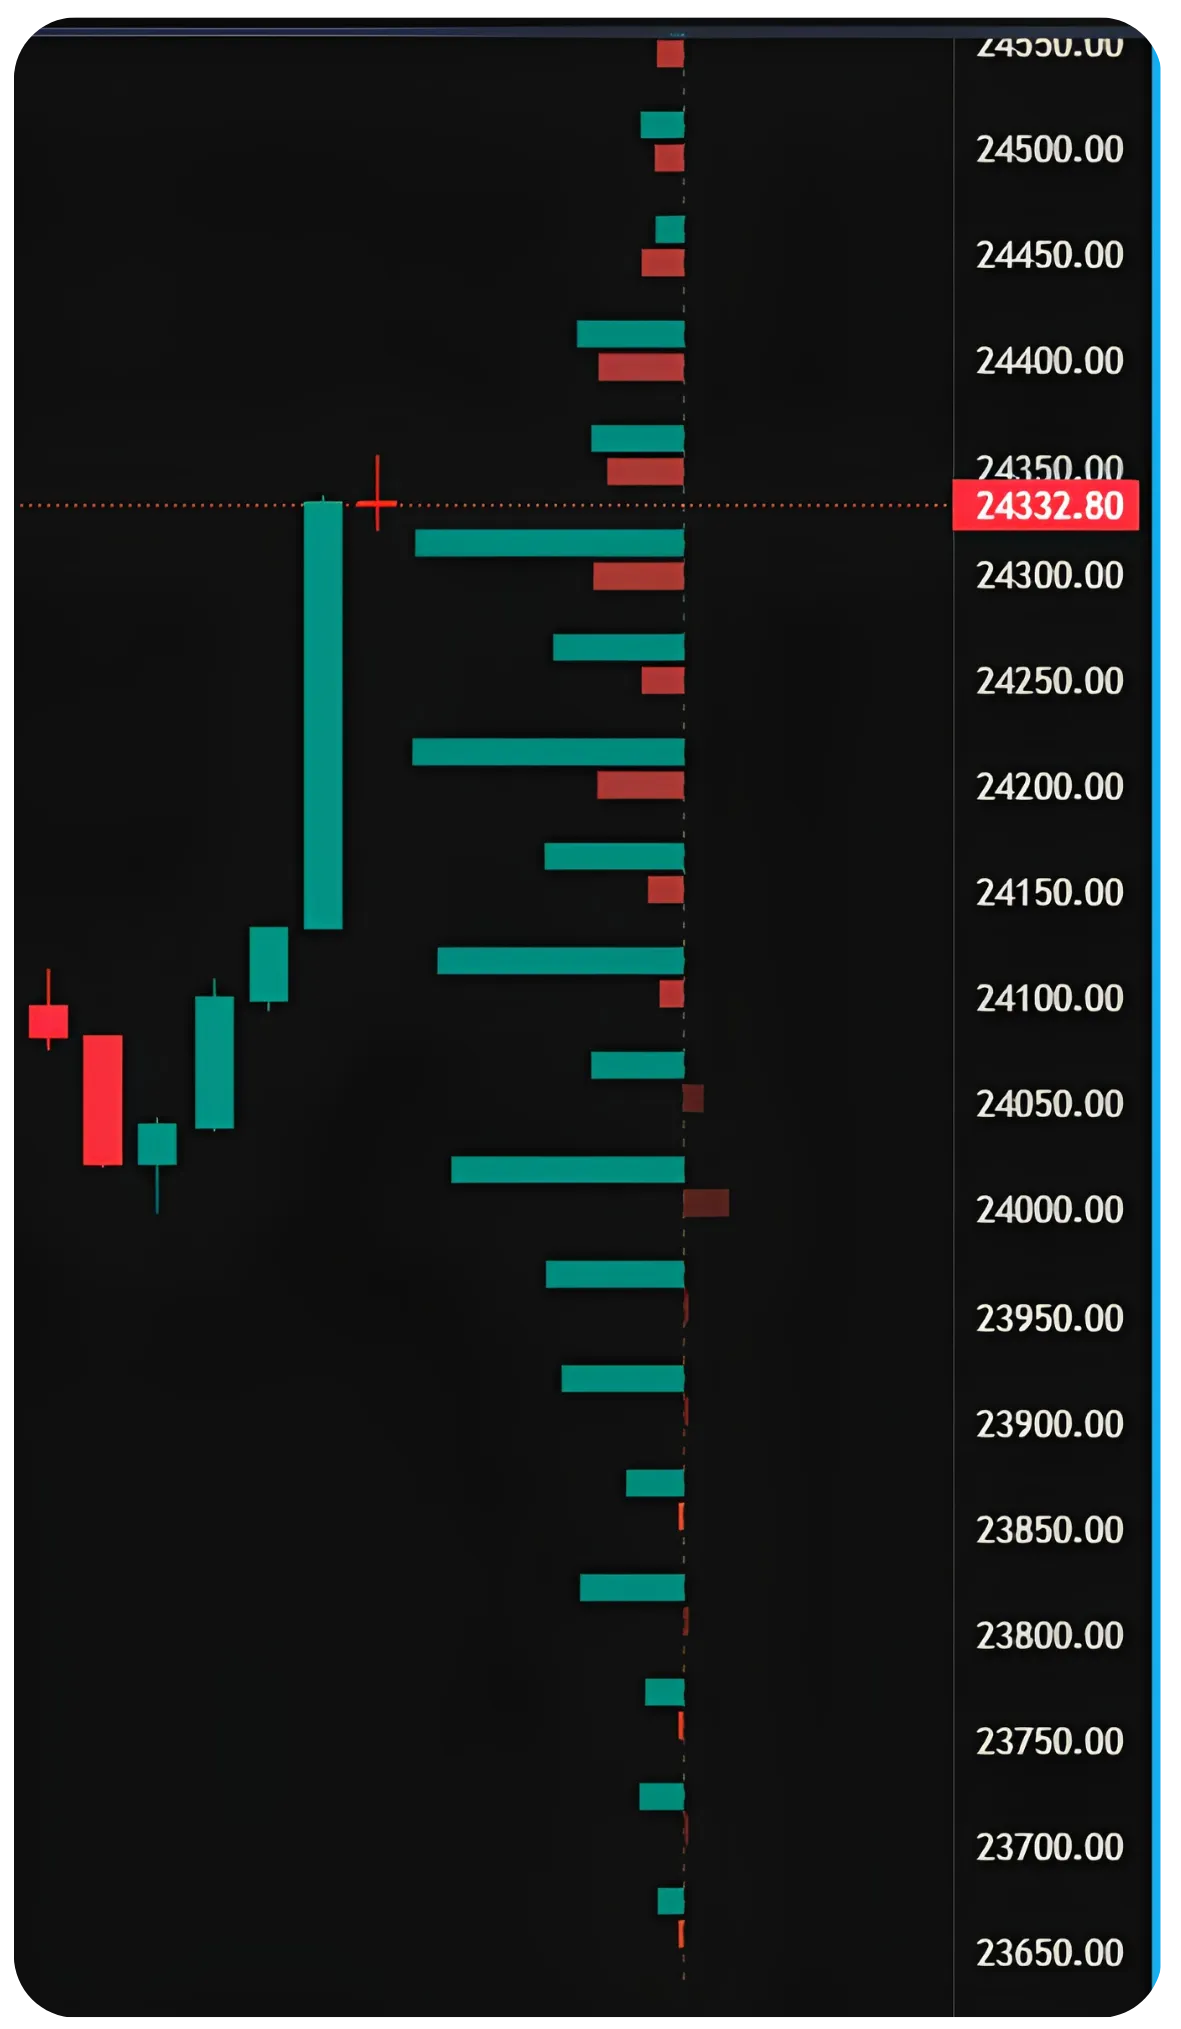
When you enable OI Profile, you'll see two sets of horizontal bars extending from the right edge of the chart at each strike level. On the call OI put OI chart, the red bars represent call positions and the green bars represent put positions, with bar length indicating the size of open interest at each strike.
The bars are anchored at their respective strike prices, so as price moves up and down on the chart, you can see exactly which strikes it is approaching or has recently passed through. This visual alignment is the main advantage over looking at a separate option chain; you can watch price interact with OI levels in real time without switching screens.
Sensex 3-min chart with OI Profile active. Strike 76800 shows Call OI: 27,11,940 and Put OI: 1,32,46,200; a significant put-heavy imbalance acting as a floor during the afternoon session.
Looking at the Sensex chart above, the tooltip shows Strike 76800 with dramatically higher Put OI (1,32,46,200) compared to Call OI (27,11,940). A large concentration of put writers at 76800 suggests that a meaningful set of participants have sold puts there, effectively taking on the obligation to buy the index if it falls to 76800. Their incentive is to keep price above that level until expiry, which can translate into buying pressure when price dips close to it.
Also read: Trading Volatility Across Time with Calendar Spreads Part 2/2
OI as Support and Resistance
This is where intraday OI analysis in India becomes most practically useful, especially for traders who are making entry and exit decisions within a single session. The basic read is straightforward: strikes with large Call OI above the current price tend to act as resistance, and strikes with large Put OI below the current price tend to act as support. The logic comes from the behaviour of option writers who are short those contracts.
Large Call OI above current price → Potential resistance
When there is heavy open interest in call options at a strike above where the index or stock is trading, the writers of those calls have a financial incentive to see price stay below that strike. If price rallies toward that level, they may sell futures or the underlying to hedge their delta, creating selling pressure. The result is that price often stalls or reverses near strikes with very large call OI. Traders sometimes refer to this as a 'call wall.'
Large Put OI below current price → Potential support
The mirror logic applies on the downside. Large put OI at a strike below current price means many participants have written puts at that level. To manage their exposure, put writers may buy futures or the underlying as price falls toward their strike, cushioning the decline. Heavy put concentration at a level often shows up as a floor where selling slows or bounces occur.
Reading options positioning in India requires understanding that the market is structured around a relatively small set of heavily traded weekly and monthly expiries, which concentrates OI at predictable strike clusters.
| OI Condition | Implication | How to Use It |
|---|---|---|
| Heavy Call OI above price | Potential resistance / call wall | Be cautious on longs approaching that strike; watch for reversals |
| Heavy Put OI below price | Potential support / put wall | Dips toward that level may see buying; useful for support trades |
| Call OI falling rapidly | Unwinding resistance may be weakening | Breakouts above that strike become more plausible |
| Put OI building at new lower strike | Support floor shifting lower | Market participants repositioning; sentiment may be turning cautious |
| Call and Put OI roughly balanced | Two-sided tussle | Price may oscillate; trade the edges rather than the midpoint |
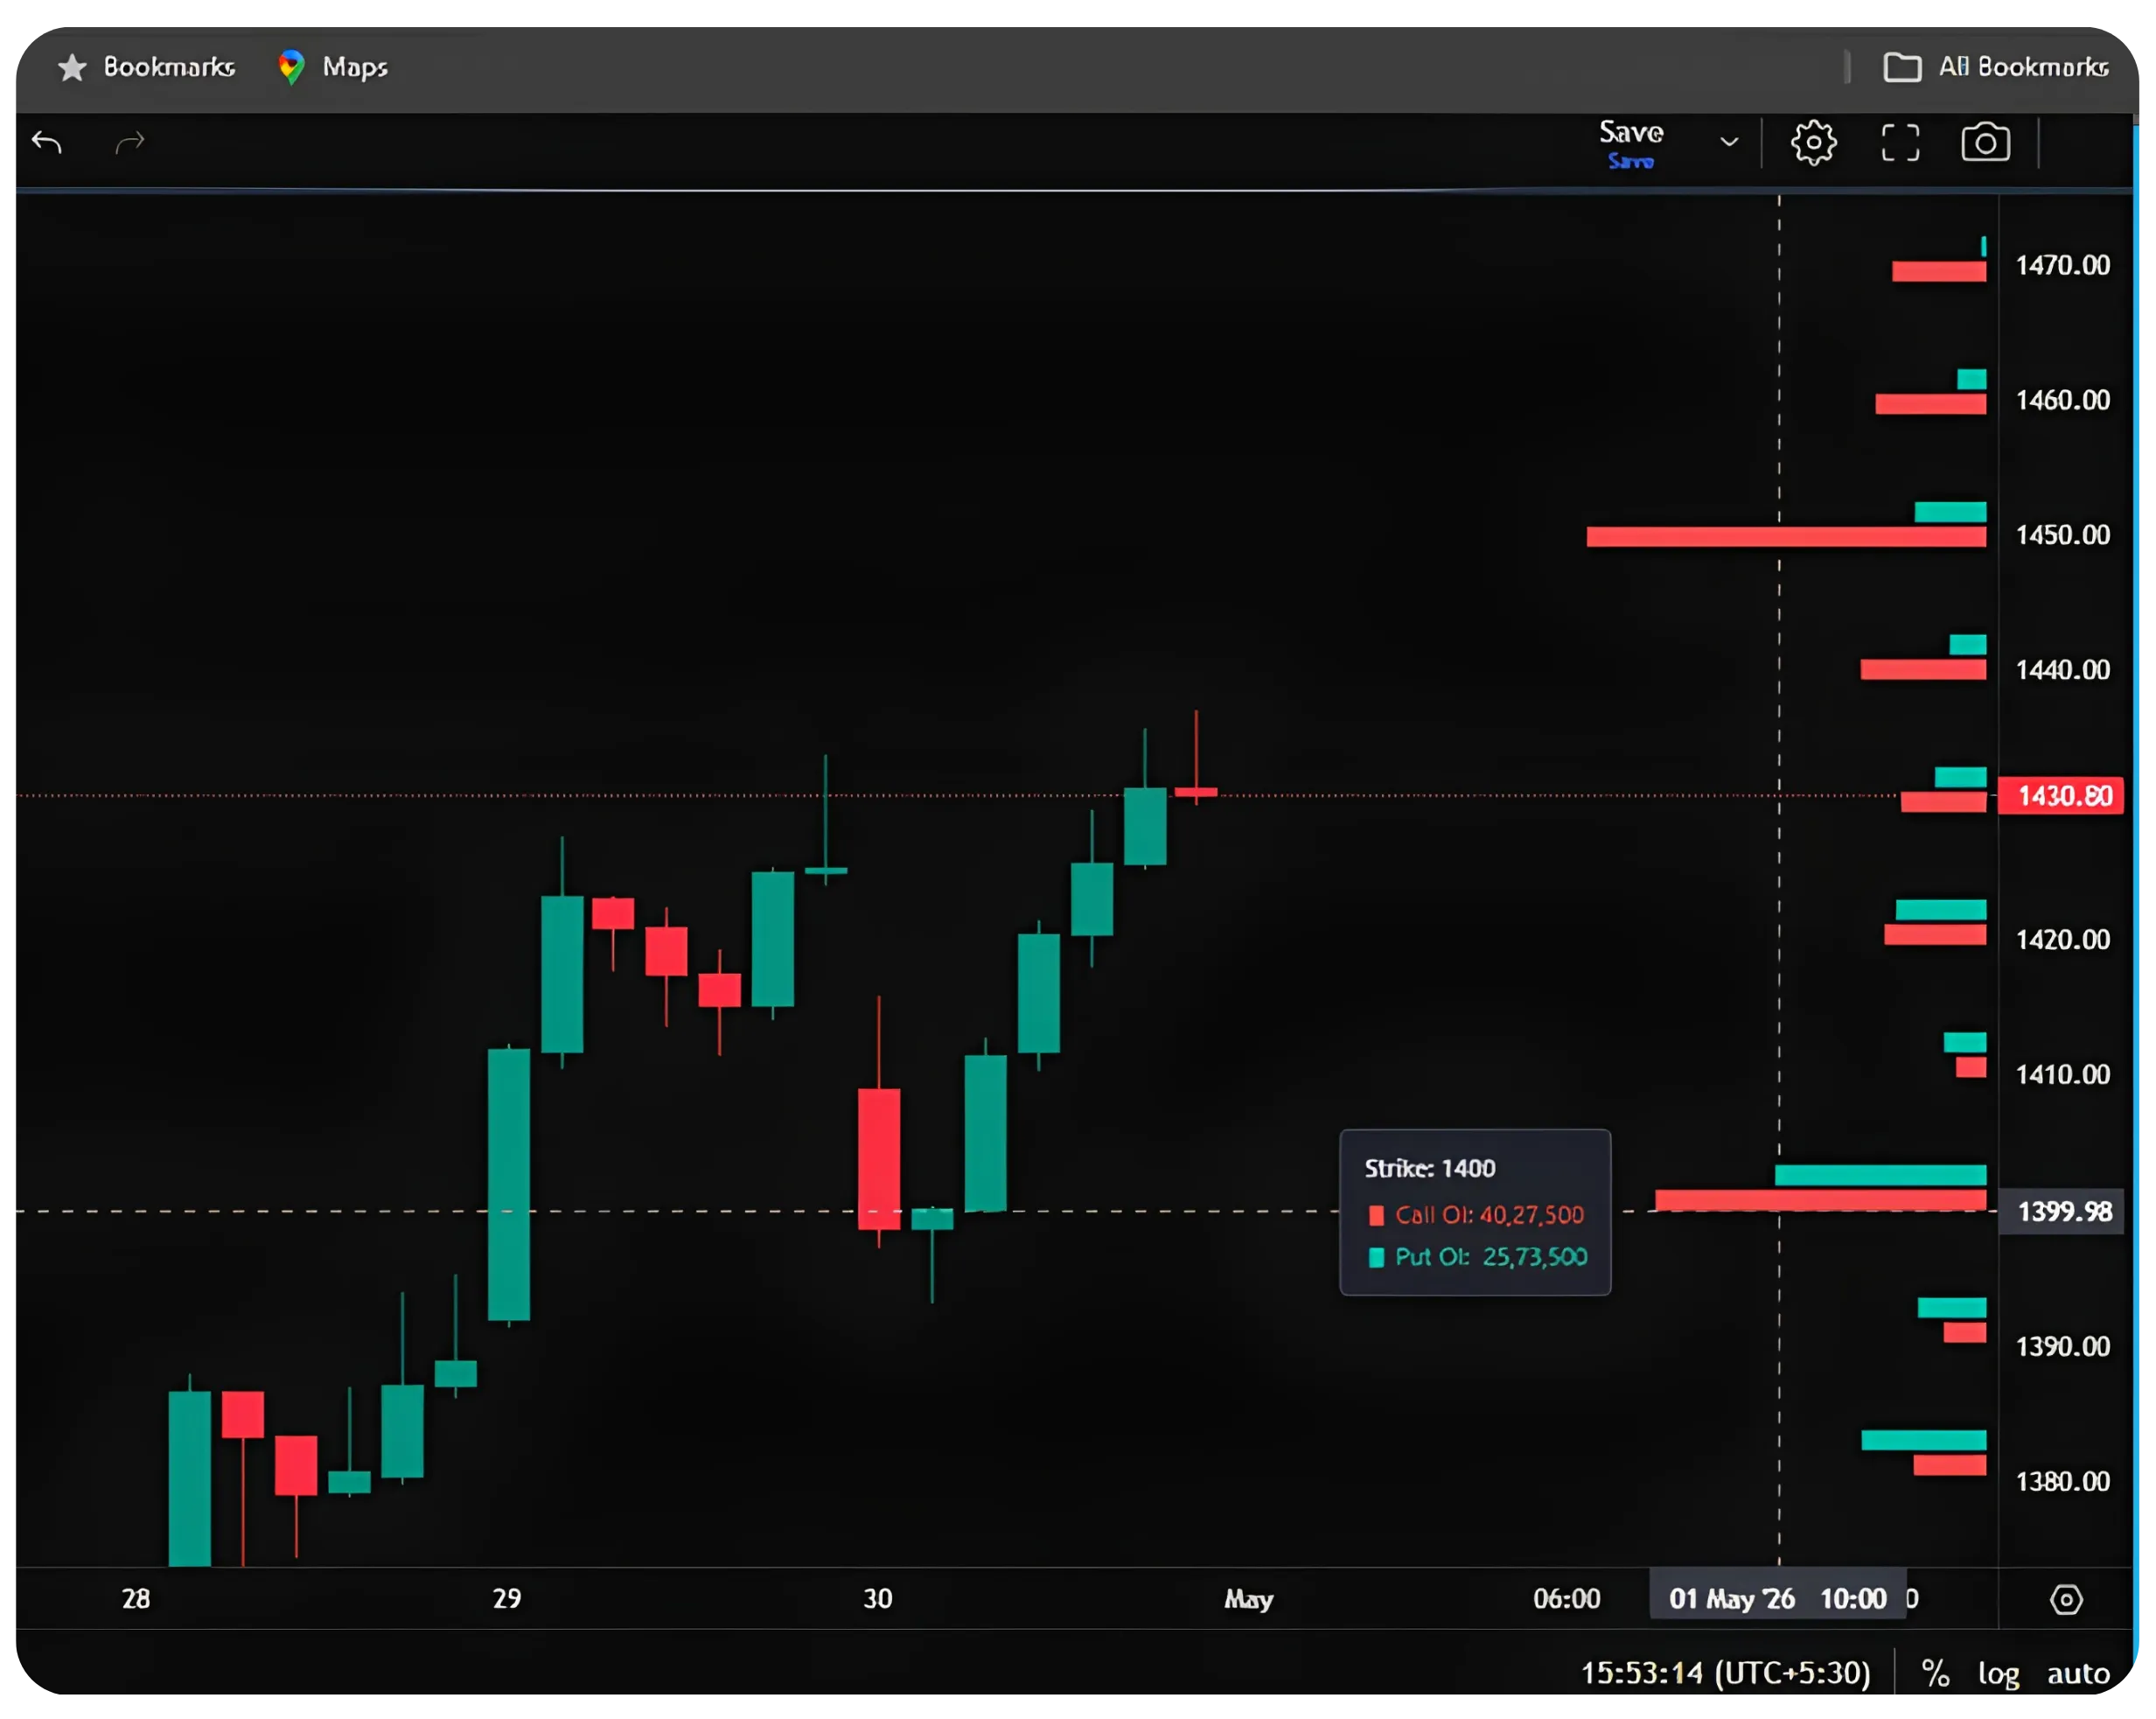
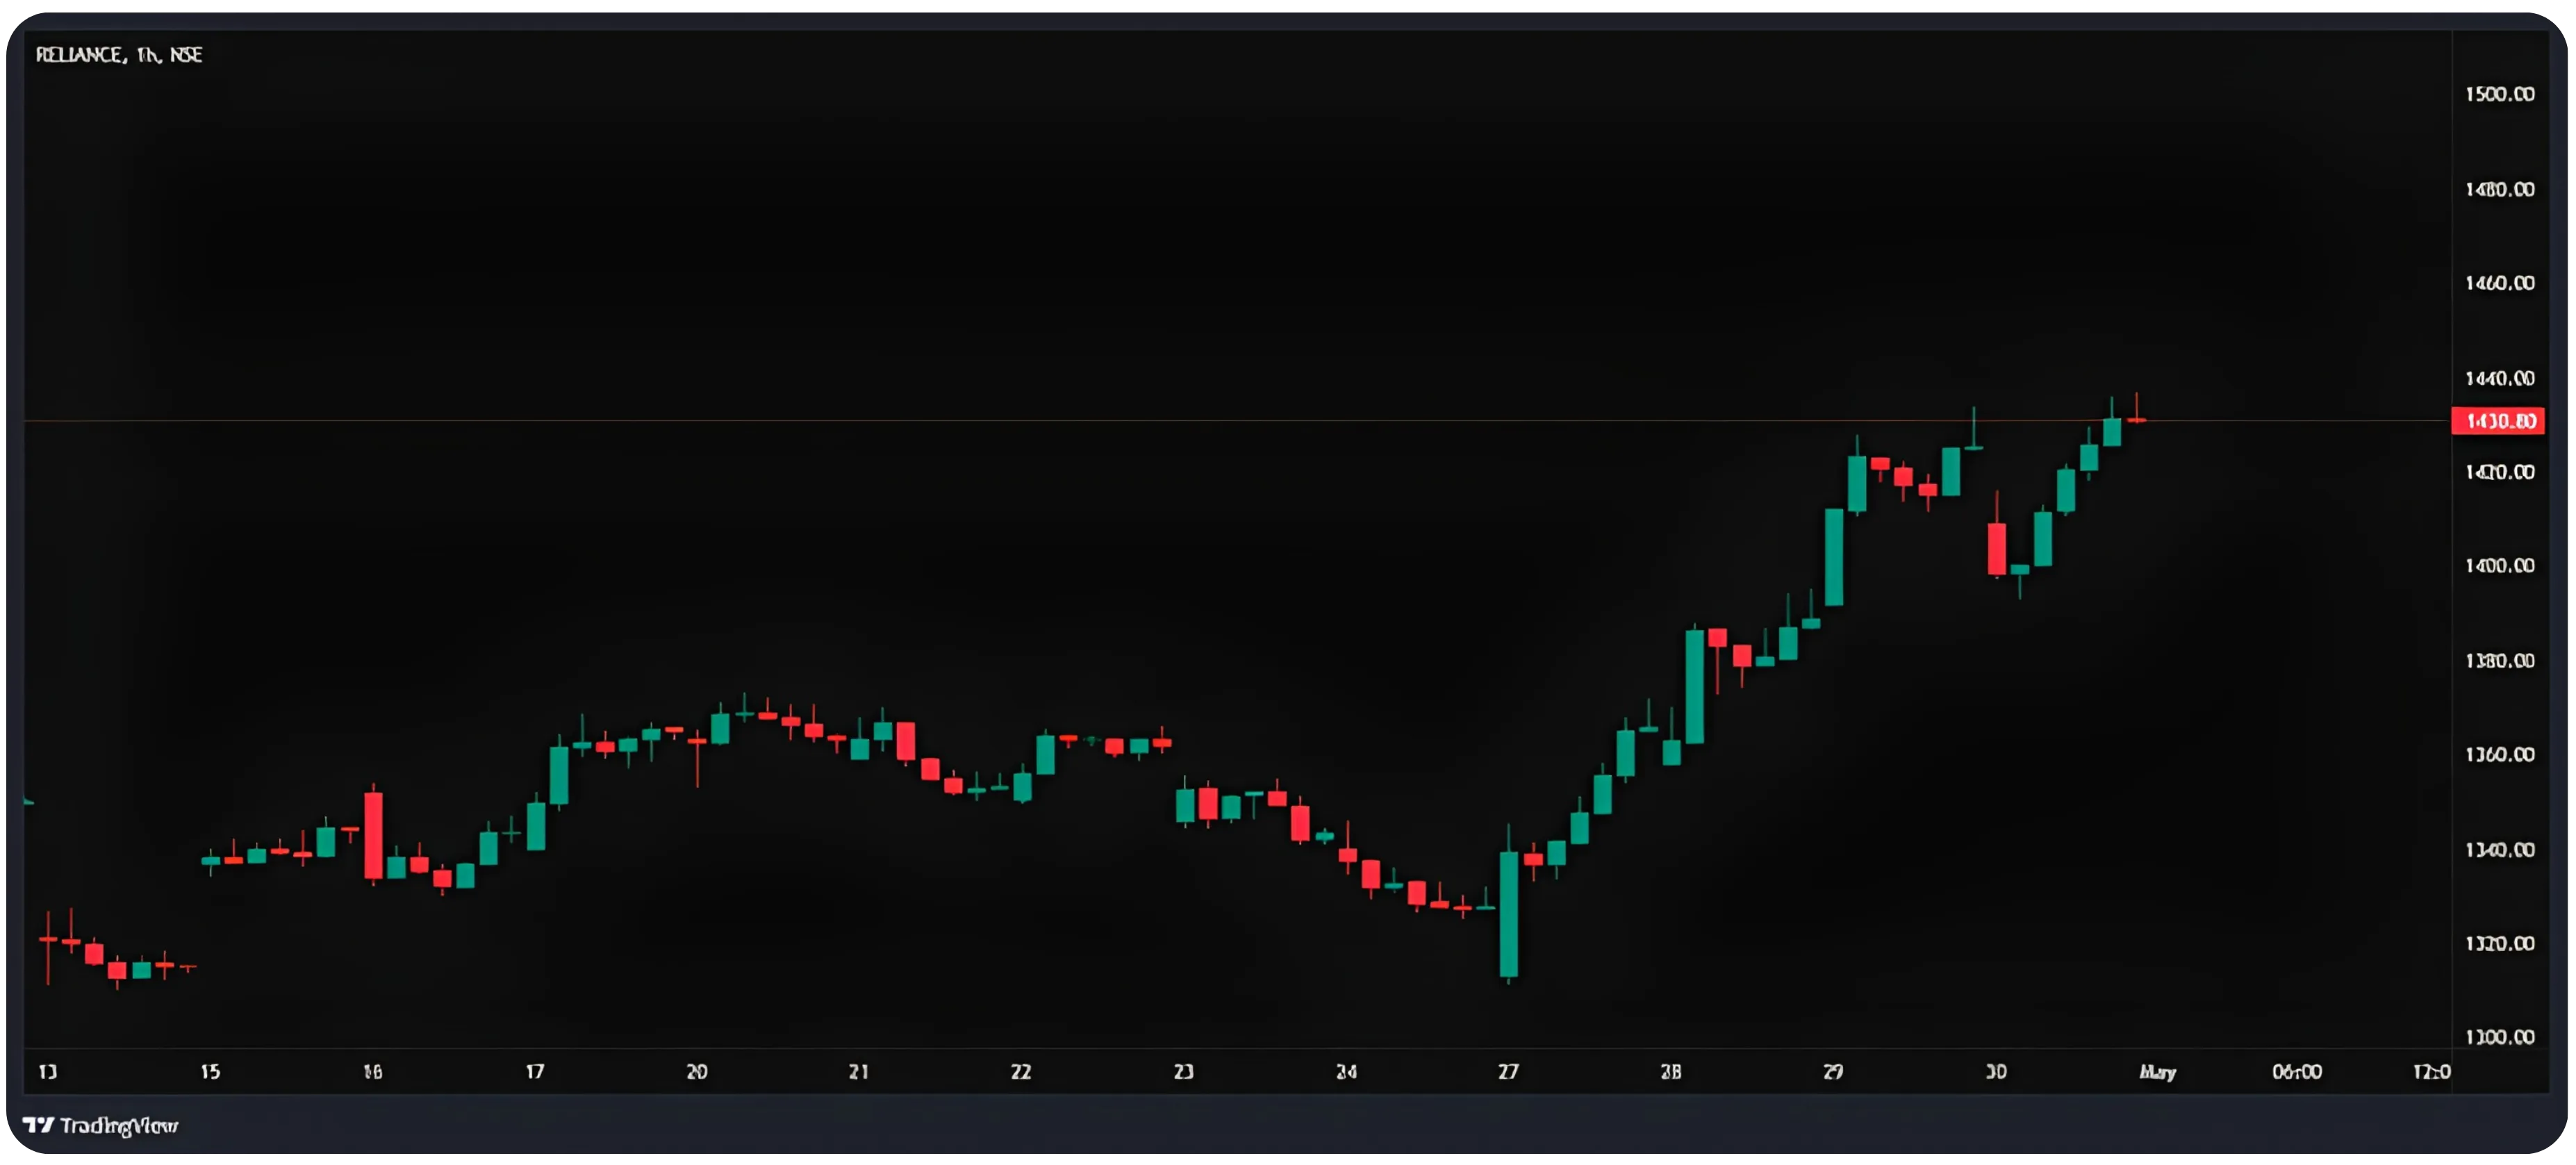
Reliance daily chart with OI Profile. At Strike 1400, Call OI (40,27,500) exceeds Put OI (25,73,500); a call-heavy picture acting as a ceiling. Price has been struggling to sustain above the 1400–1430 zone.
In the Reliance chart, Strike 1400 shows Call OI of 40,27,500 against Put OI of 25,73,500, call-heavy, which has been acting as a ceiling. Notice how price has been struggling to sustain above 1430 as well, where OI at the higher strikes continues to lean toward call dominance.
How to Set Up OI Profile on NxtOption
The OI Profile feature is available directly on the charts on NxtOption. Here is how to get it running:
Open any chart on the NxtOption terminal, index (Sensex, Nifty) or individual stock. Make sure you're on the chart view within NxtOption.
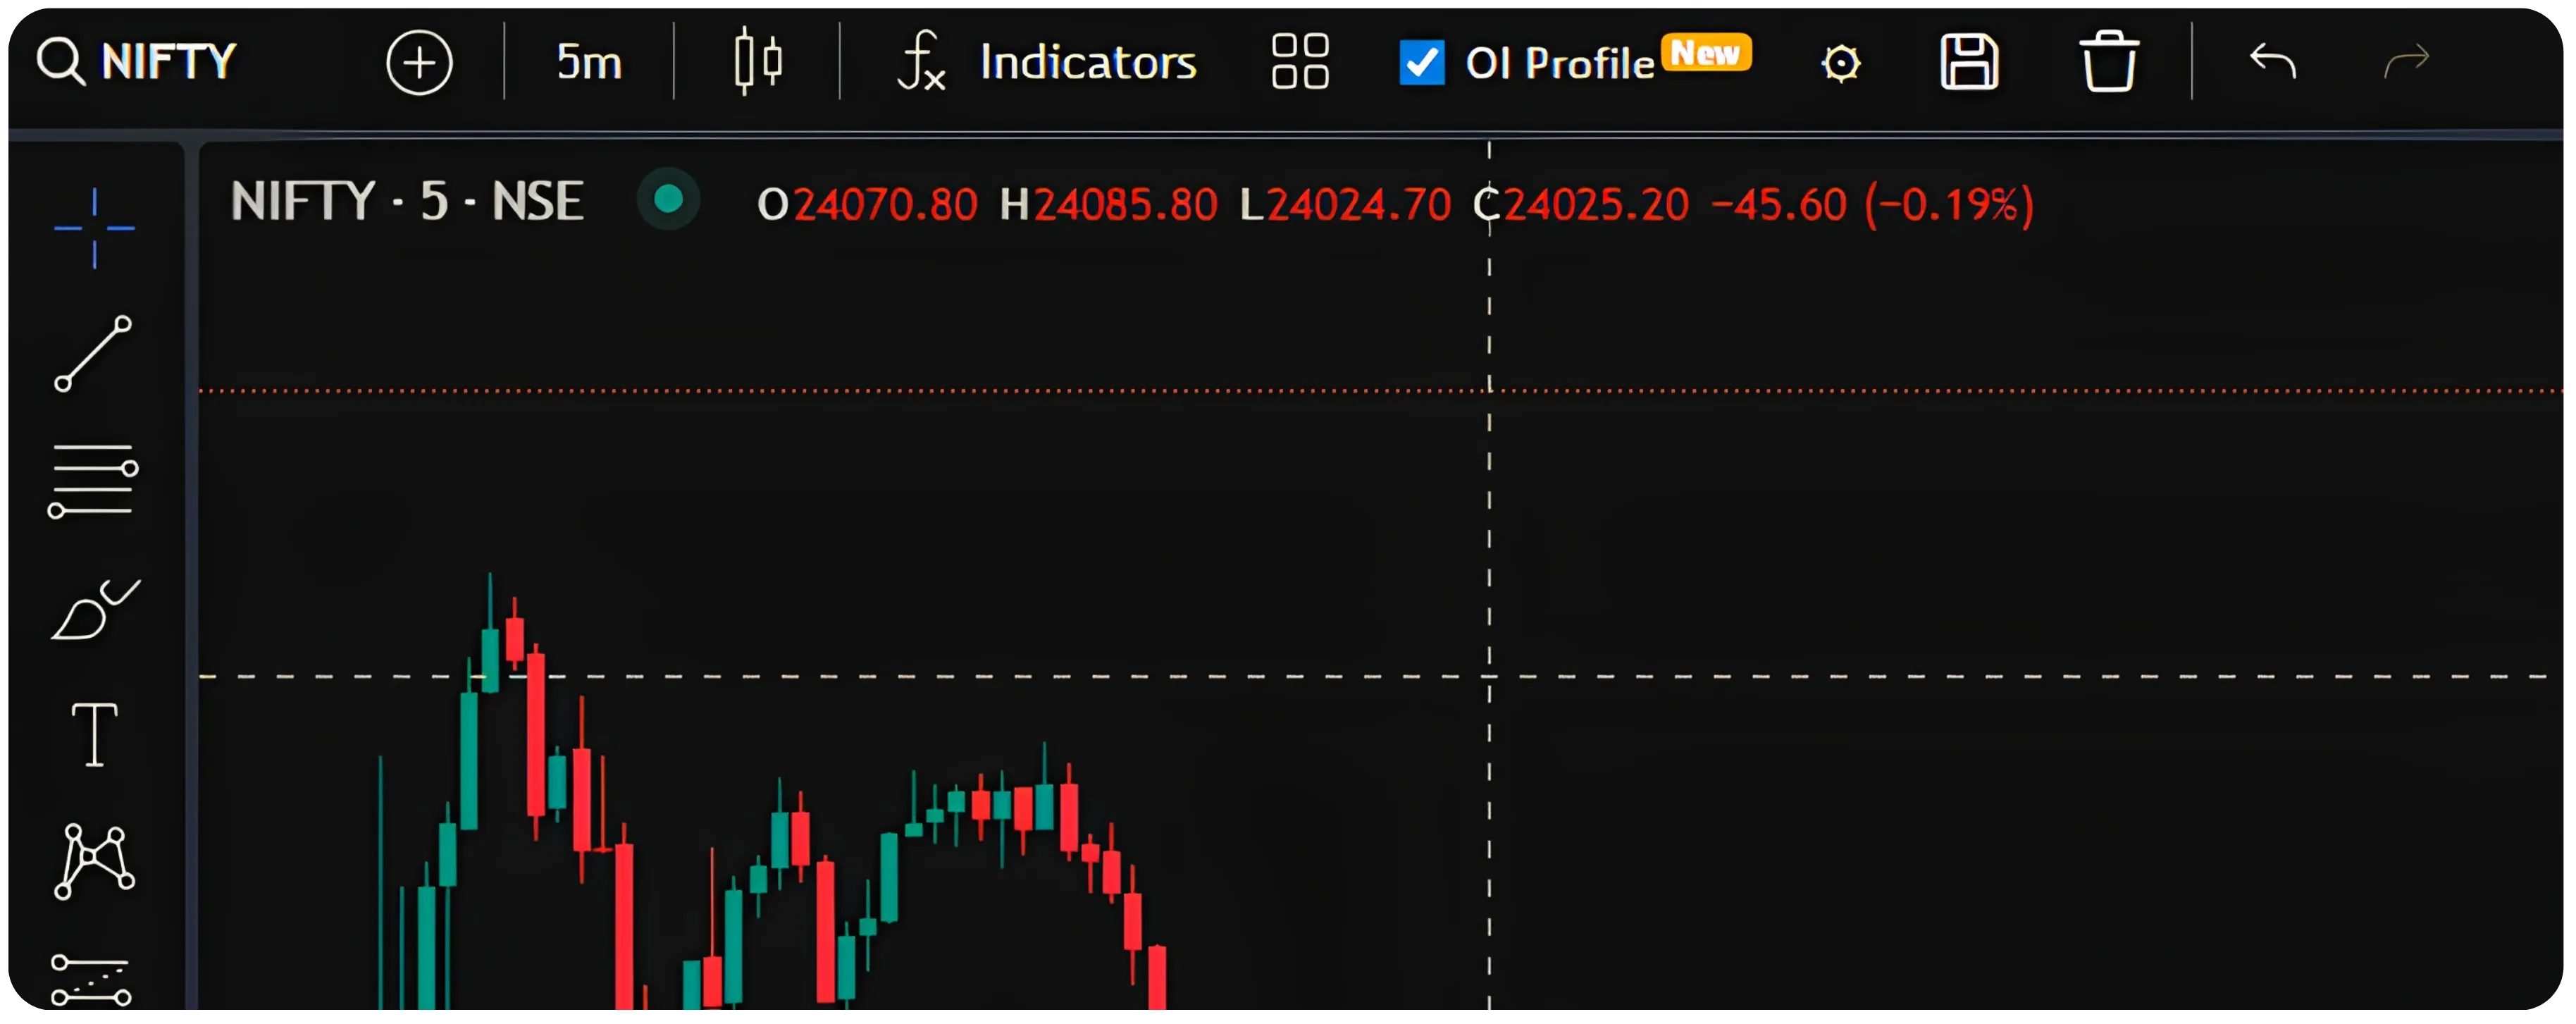
Enable OI Profile by clicking the OI Profile checkbox in the top toolbar. It may show a 'NEW' badge if you haven't used it before.
Click the settings gear icon next to the OI Profile toggle to open the configuration panel.
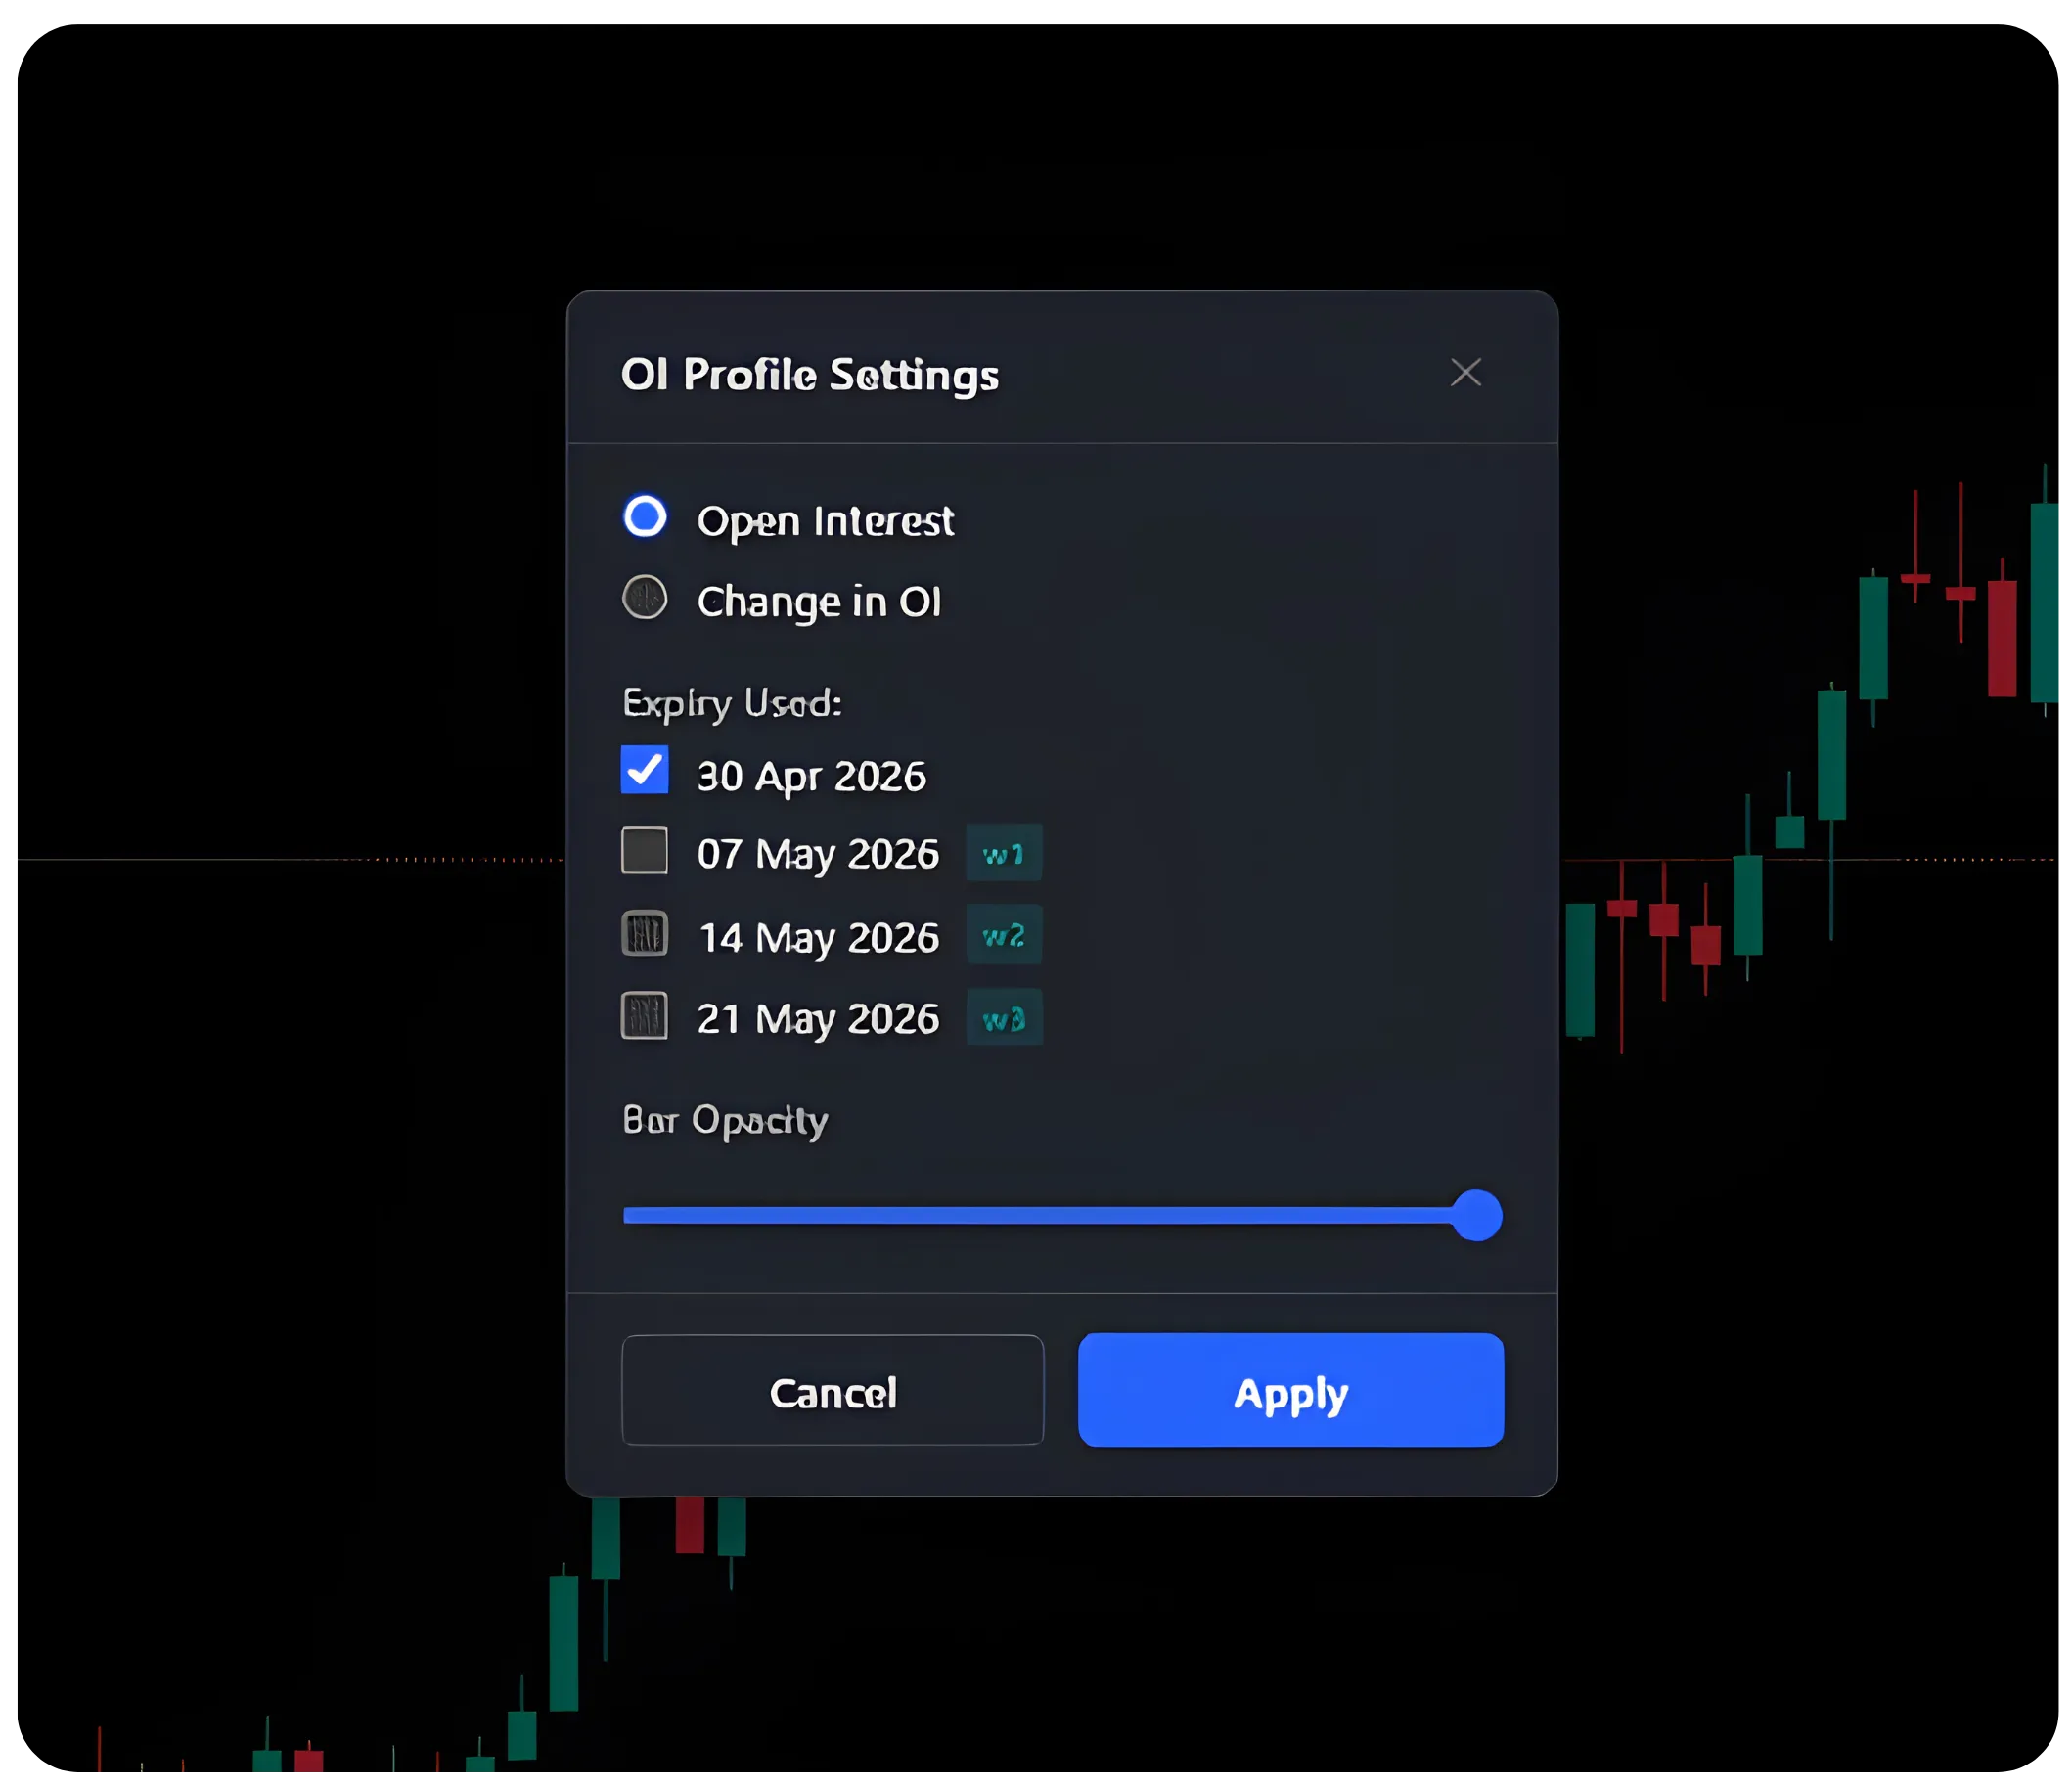
Choose between Open Interest and Change in OI. For most intraday reads, Open Interest gives a more stable picture. Change in OI is useful when you want to see where fresh money is flowing in real time during the session.
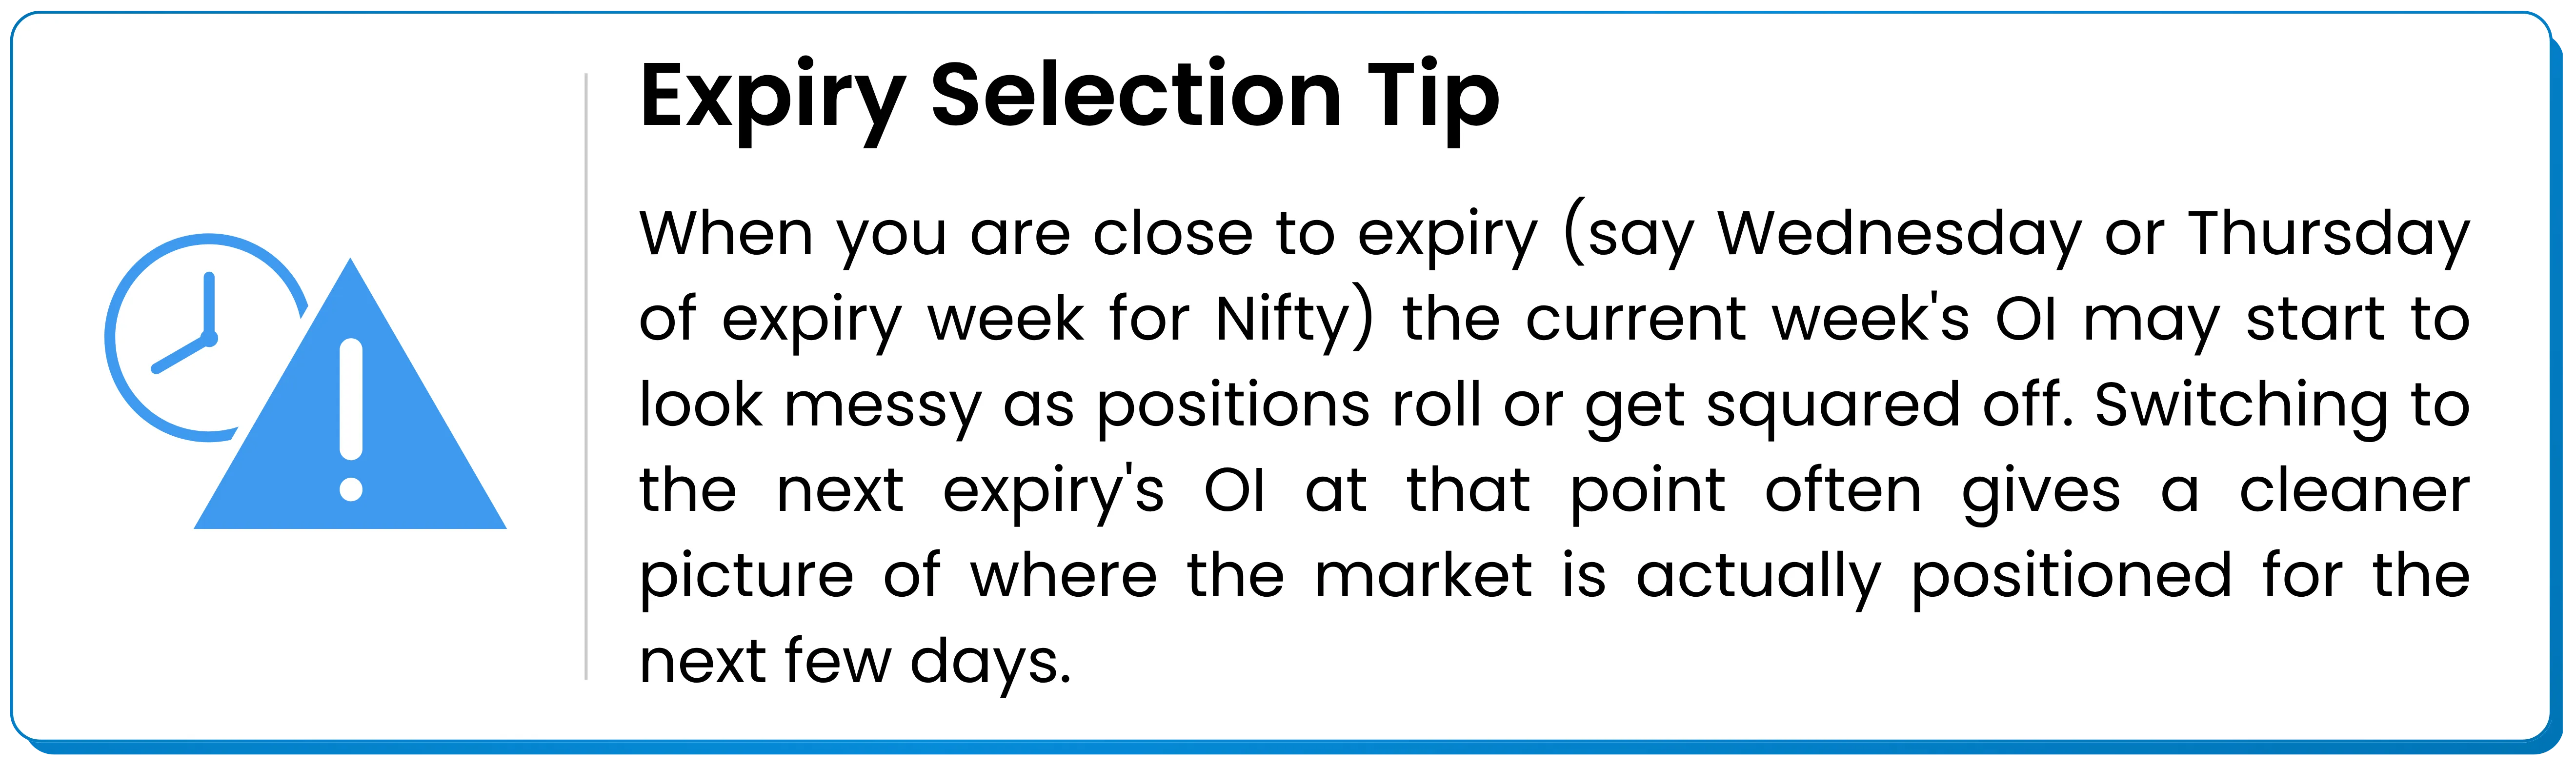
Under Expiry Used, select the expiry relevant to your trade. For intraday and short-term trades, the OI profile weekly expiry view is the most relevant. For calendar spreads or monthly strategies, toggle to the appropriate monthly expiry.
Adjust Bar Opacity so the OI bars are visible but don't obscure your candlesticks. A mid-to-high opacity works well on dark-theme charts.
Click Apply. The bars will appear on the right side of your chart at each active strike. Hover over any bar to see the exact Call OI and Put OI figures for that strike in a tooltip.
Practical Example
Looking at the Reliance hourly chart below, price had been in a clear downtrend from mid-April, reaching a low around 1310–1320. From April 27, it began recovering sharply. As the stock rallied, the OI Profile showed that the heaviest call concentration was sitting at 1450 and above, visible as the dominant red bars at those levels.
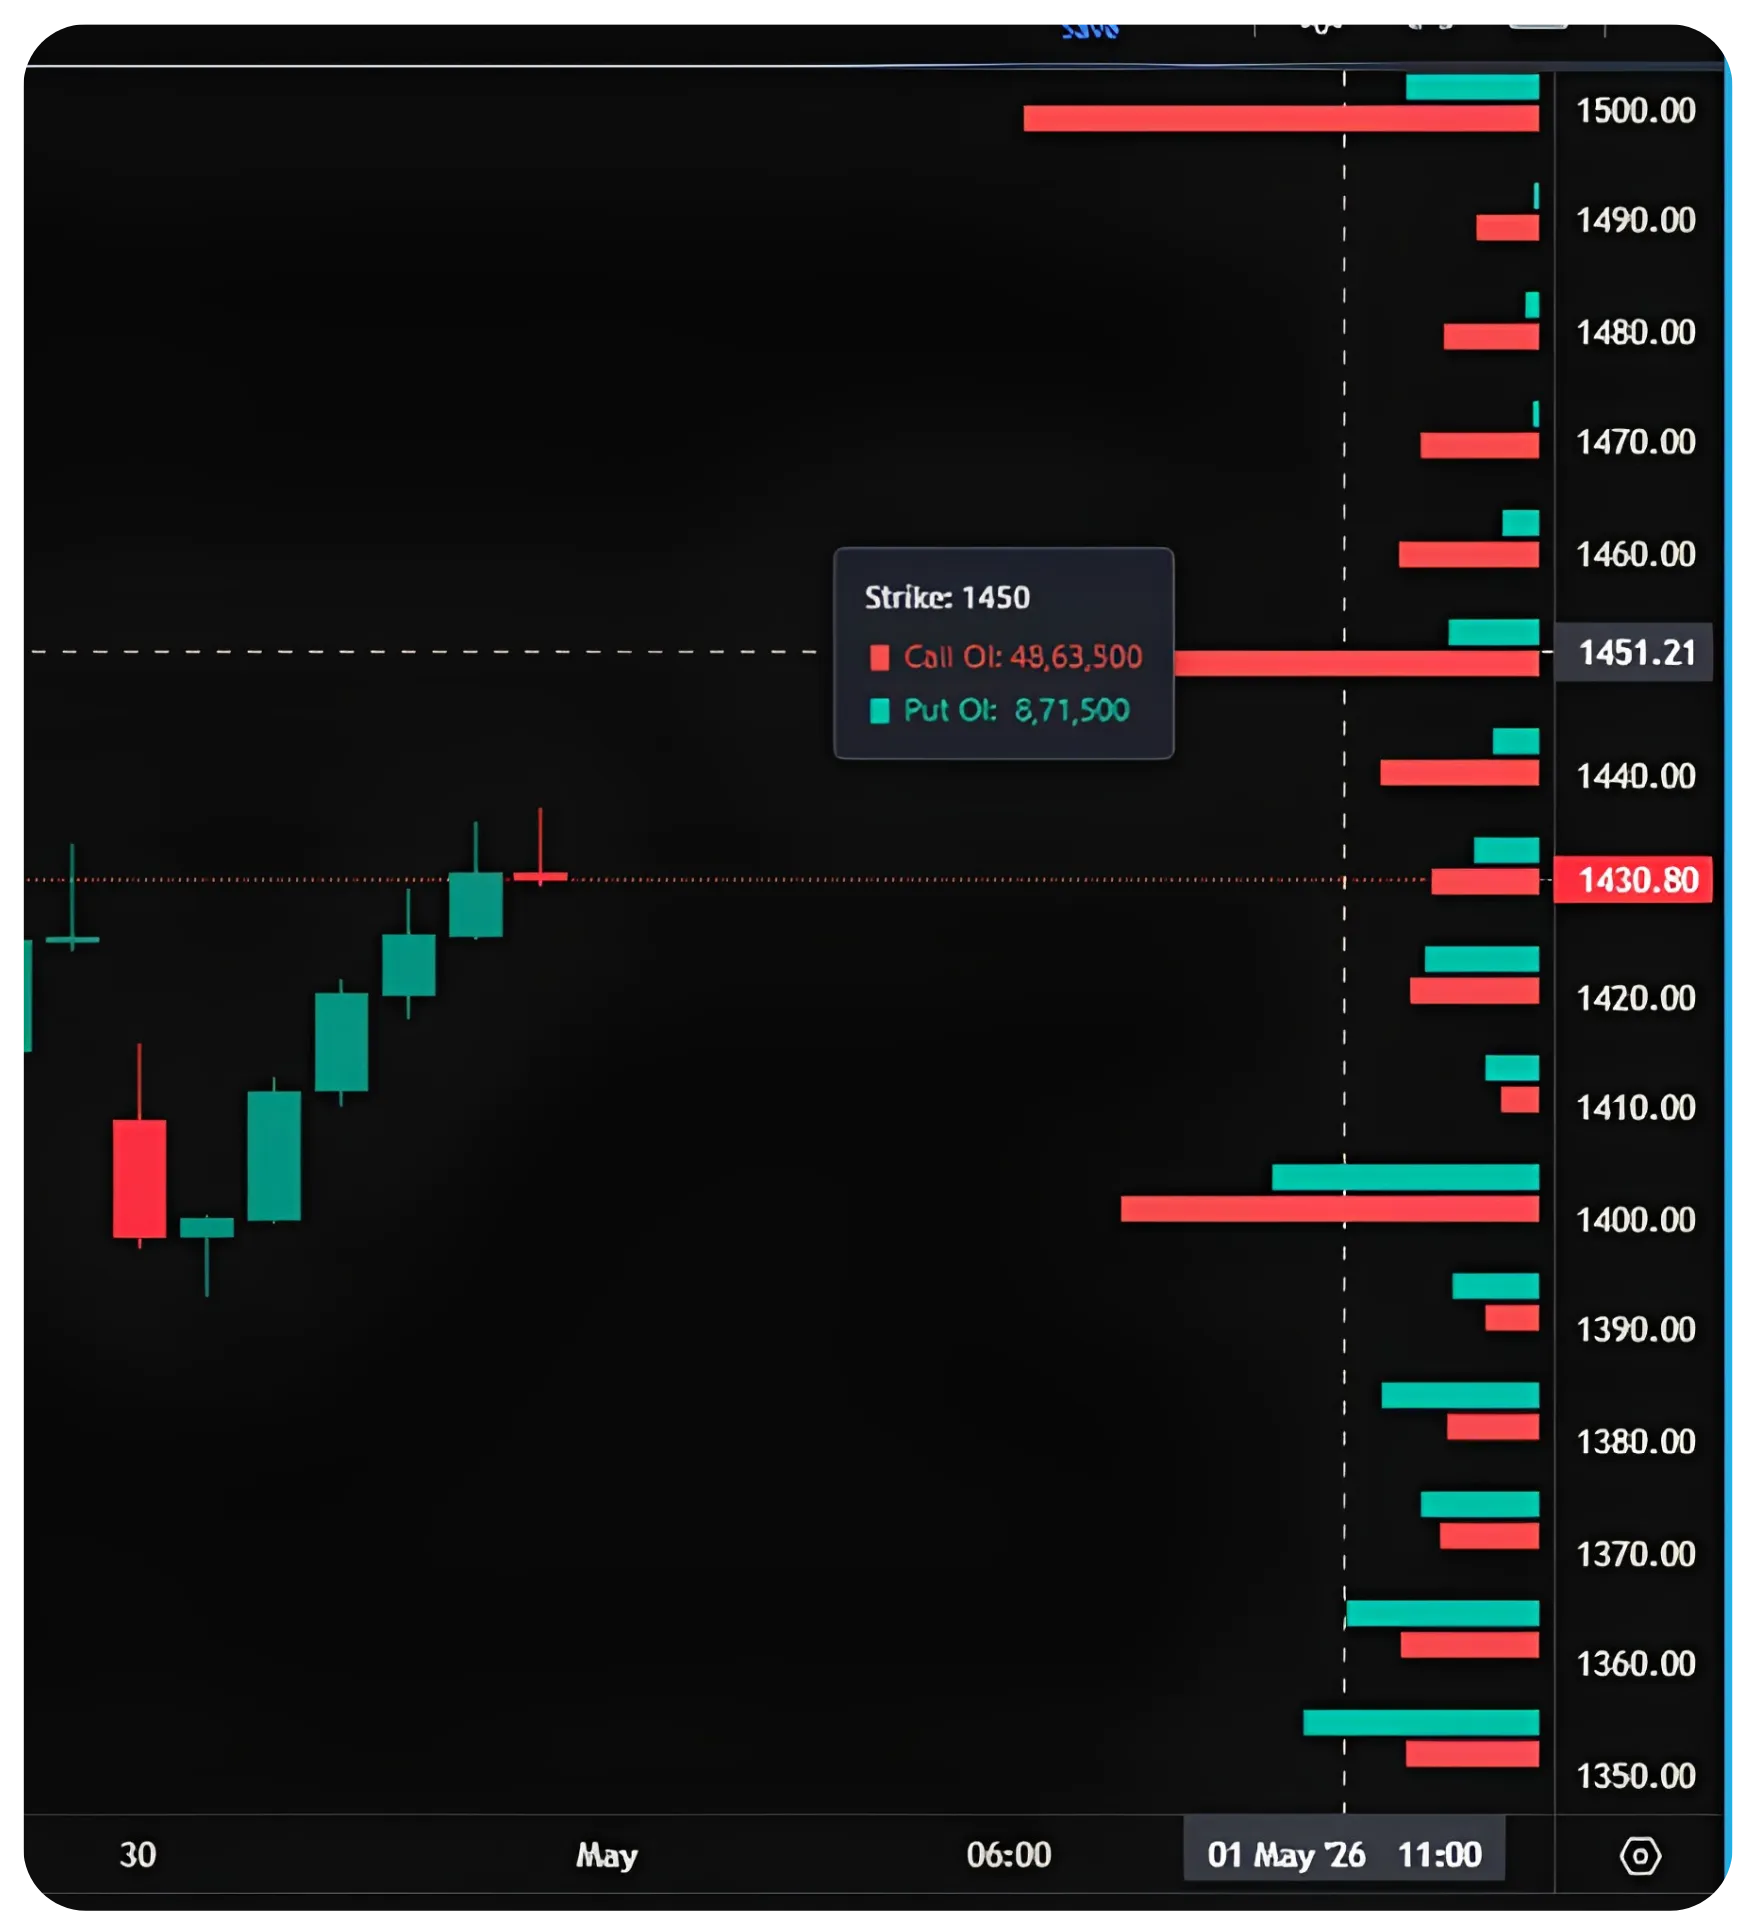
Reliance 1h chart showing recovery from 1310. OI Profile shows call concentration at 1450 (Call OI 48,63,500 vs Put OI 8,71,500), a meaningful resistance zone. Current price at 1430 is pressing into that area.
At Strike 1450, the Call OI reads 48,63,500 versus Put OI of just 8,71,500, a heavily lopsided picture. Price at 1430 is close to that zone. A trader reading this would note that while the recovery is genuine and well-structured, the stock is now entering an area with significant call-side resistance. Trying to chase longs aggressively right below 1450 without a clear breakout confirmation carries more risk than it might appear from the candles alone.
The OI picture doesn't say the stock can't break 1450. It says that if it does, something meaningful needs to happen on the OI side; either the call OI unwinds as writers cover, or fresh put OI builds above 1450 to signal that larger players are positioning for a sustained move higher. Until either of those happen, 1450 remains a level to respect rather than blindly trade through.
Reliance daily view with full OI Profile overlay. The 1400 strike and 1430 zone show meaningful two-sided OI, while 1450 and above is clearly call-dominant. Current price at 1430.80 sits in a transitional zone between the 1400 put wall and the 1450 call wall.
Reading the OI profile on Sensex during the afternoon session, a similar dynamic was playing ou. The 76800 strike had enormous Put OI relative to Call OI. Price was oscillating in the 76800–77000 range, repeatedly finding buyers near 76800 as expected. The OI at that strike gave traders a framework (not a guarantee, but a probabilistic read) that 76800 would likely hold unless there was a macro shock or a significant unwinding of put positions.
OI Profile doesn't predict where the price will go. It shows you where significant participants have committed capital, and that information changes how you should manage your entry timing, stop placement, and target selection.
Also read: Trading Volatility Across Time with Calendar Spreads Part 1/2
Pitfalls of Trading Purely on OI Profile
OI data is genuinely useful, but it gets misused. Here are the most common ways traders get into trouble when they rely on OI Profile without the right context.
Treating OI levels as hard stops that price cannot breach. High Call OI at a strike means resistance is likely, it does not mean price cannot cross that level. On event days (RBI policy, earnings, global macro), OI walls can crumble quickly as writers cover in panic. Price action always supersedes OI in terms of what you should actually act on.
Ignoring that OI can be stale or built for reasons you don't know. A large position at a strike might be a hedge for an institutional position in the underlying, not a directional bet. You're reading the footprint of trades without knowing the full intent behind them. What looks like a put wall may disappear suddenly if the underlying institutional trade is unwound.
Using the wrong expiry for your trade horizon. If you're doing an intraday scalp on Nifty but you're looking at monthly expiry OI, the data is not well-matched to your trade. The current weekly expiry OI is what matters for a trade you intend to close today. Looking at monthly OI for an intraday decision introduces noise.
Not accounting for OI that shifts intraday. OI is a snapshot. During a trending session, OI at key strikes can build or unwind rapidly. A put wall that was solid at 9:30 AM might look very different at 2:00 PM if the market has been grinding down. Using Change in OI during the session helps here, but it requires active monitoring.
Entering positions without confirmation from price action. OI tells you about positioning. It doesn't tell you about momentum, trend, or timing. Trading purely because 'big put OI is at 76800 so I'll buy there' without confirming that price is actually showing buying signals at that level is a common mistake. OI should tilt your read, not replace your entry logic.
Putting It Together
The OI Profile feature on NxtOption / Tradejini is a clean implementation of a genuinely useful concept. Getting it set up takes about 30 seconds once you know where to look, and the visual overlay on the chart makes it easier to integrate into your reading of price than switching between the chart and a separate option chain view.
The practical workflow is simple. Before the session or at key decision points during the day, glance at the OI bars to identify the main call wall above and the main put wall below current price. Note any significant asymmetry at those levels. Then use that information to shape how you size positions near those levels, where you place your stops, and how you think about targets relative to the next OI cluster.
When price approaches a high-OI strike and the candles are showing hesitation or reversal signals, that confluence is worth more than either signal in isolation. When price breaks cleanly through a high-OI strike on volume, that too is worth noting, it often signals that something has shifted in the underlying OI picture and the move has more room to run.
Like most tools, it works best when used in combination with what you already know about price structure, trend, and volume. On its own, it gives you a useful map of where the market's participants have committed capital. Combined with your technical read of the chart, it can meaningfully improve the quality of your decision-making around entries and exits.
Disclaimer: The information provided in our blogs is for informational purposes only and should not be construed as financial, investment, or trading advice. Trading and investing in the securities market carries risk. Always conduct your own research and consult with a qualified financial advisor before making any investment decisions. Past performance is not indicative of future results. Copyrighted and original content for your trading and investing needs.
© 2026 — Tradejini. All Rights Reserved.


