


In Part 1, we built the foundation. We looked at what a calendar spread really is, how the two legs interact, and why the separation across time creates opportunity. Through the NIFTY example, we saw how a simple structure can capture a sharp mispricing when near-term fear runs far ahead of long-term expectations. More importantly, we broke down forward volatility and the forward factor; the two concepts that turn this from a theoretical idea into a measurable edge. Finally, we examined how the Greeks behave, and why a calendar spread is driven less by direction and more by time decay and volatility normalisation.
Now we move from understanding to application. In this section, the focus shifts to how you actually deploy the strategy in real markets: when to use call versus put calendars, how to structure trades in different conditions, how to roll positions, manage risk, and execute with discipline.
Welcome to Calendar Spread Part 2, where we delve into advanced concepts and practical applications. If you have been following along, this segment serves as your definitive guide to mastering calendar spread options, setting the stage for more complex maneuvers.
Call Calendar vs Put Calendar — When to Use Which
Both call and put calendar spreads follow identical structural logic: sell near-term, buy far-term, same strike. The choice between calls and puts is driven primarily by your directional view, the location of the strike relative to spot, and the specific volatility dynamics of each side of the chain.
For traders frequently asking when should I use call calendar vs put calendar spread, the answer lies in understanding market sentiment. Differentiating between a call calendar spread and a put calendar spread requires a keen eye on whether the broader environment favors a bullish setup or defensive posturing.
When to Deploy a Call Calendar Spread
Use a call calendar spread when you are neutral to mildly bullish on the underlying. Call calendars are most effective when the strike is at or slightly above the current market price. The ideal scenario is a market that has sold off sharply, pushing call implied volatility lower on the near-term side, and you expect a recovery or consolidation over the coming days.
Call calendars also shine in low-volatility environments where you expect a gradual drift higher. Because call options tend to have lower implied volatility than puts at the same distance from spot (the equity vol skew favours puts), call calendars often require a cleaner directional signal to generate an adequate forward factor.
By strategically deploying options call calendar bullish setups, traders can capitalize on a slow upward grind while managing theta decay. When employing a calendar spread weekly monthly strategy, the options short leg expiry generates income while the options long leg anchor provides structural stability.
Call Calendar Setup Checklist
View: Neutral to mildly bullish on Nifty
Strike: At the money or slightly above current spot
Forward factor: Above 20% minimum (above 40% preferred)
Ideal: Market has stabilised after a pullback, near-term call IV is elevated
Avoid: Earnings or major events falling inside the short-leg expiry window
When to Deploy a Put Calendar Spread
Use a put calendar spread when you are neutral to mildly bearish, or specifically when near-term put implied volatility has spiked dramatically due to fear. Put calendars are the more common structure in Indian index options because equity markets generate far more put-side panic than call-side complacency.
When there is a shock (a geopolitical event, global tariff announcement, or a central bank surprise) the put IV on near-term expiries explodes while the long-dated put IV barely moves. This creates exactly the wide forward factor that makes put calendars highly profitable. You sell the overpriced panic and buy the calm.
Put calendars also have a natural bullish edge. When the market recovers after a panic, both the near-term put (short leg) and the far-term put (long leg) lose value, but the near-term put loses value much faster due to its high gamma and accelerating time decay. This double-barrelled compression (IV collapse plus time decay) is what generated the 42% single-session return in the NIFTY April 2026 example.
Put Calendar Setup Checklist
View: Neutral to mildly bearish, or high panic IV environment
Strike: At the money or slightly below current spot (for OTM puts)
Strike: Above current spot for deep-ITM put calendar (credit structure)
Forward factor: Above 40% strongly preferred; 100%+ is exceptional
Ideal: Panic spike in near-term IV, market likely to stabilise or recover
Avoid: Continuing trend lower with no sign of stabilisation
Also read: Trading Volatility Across Time with Calendar Spreads Part 1/2
Deep ITM Put Calendars — A Special Case
When a market crash pushes the underlying well below a put strike, that put becomes deep in-the-money. Here, the calendar spread can generate a net credit rather than a net debit, because the near-term option carries extreme IV and therefore commands a higher premium than the long-dated option at the same strike.
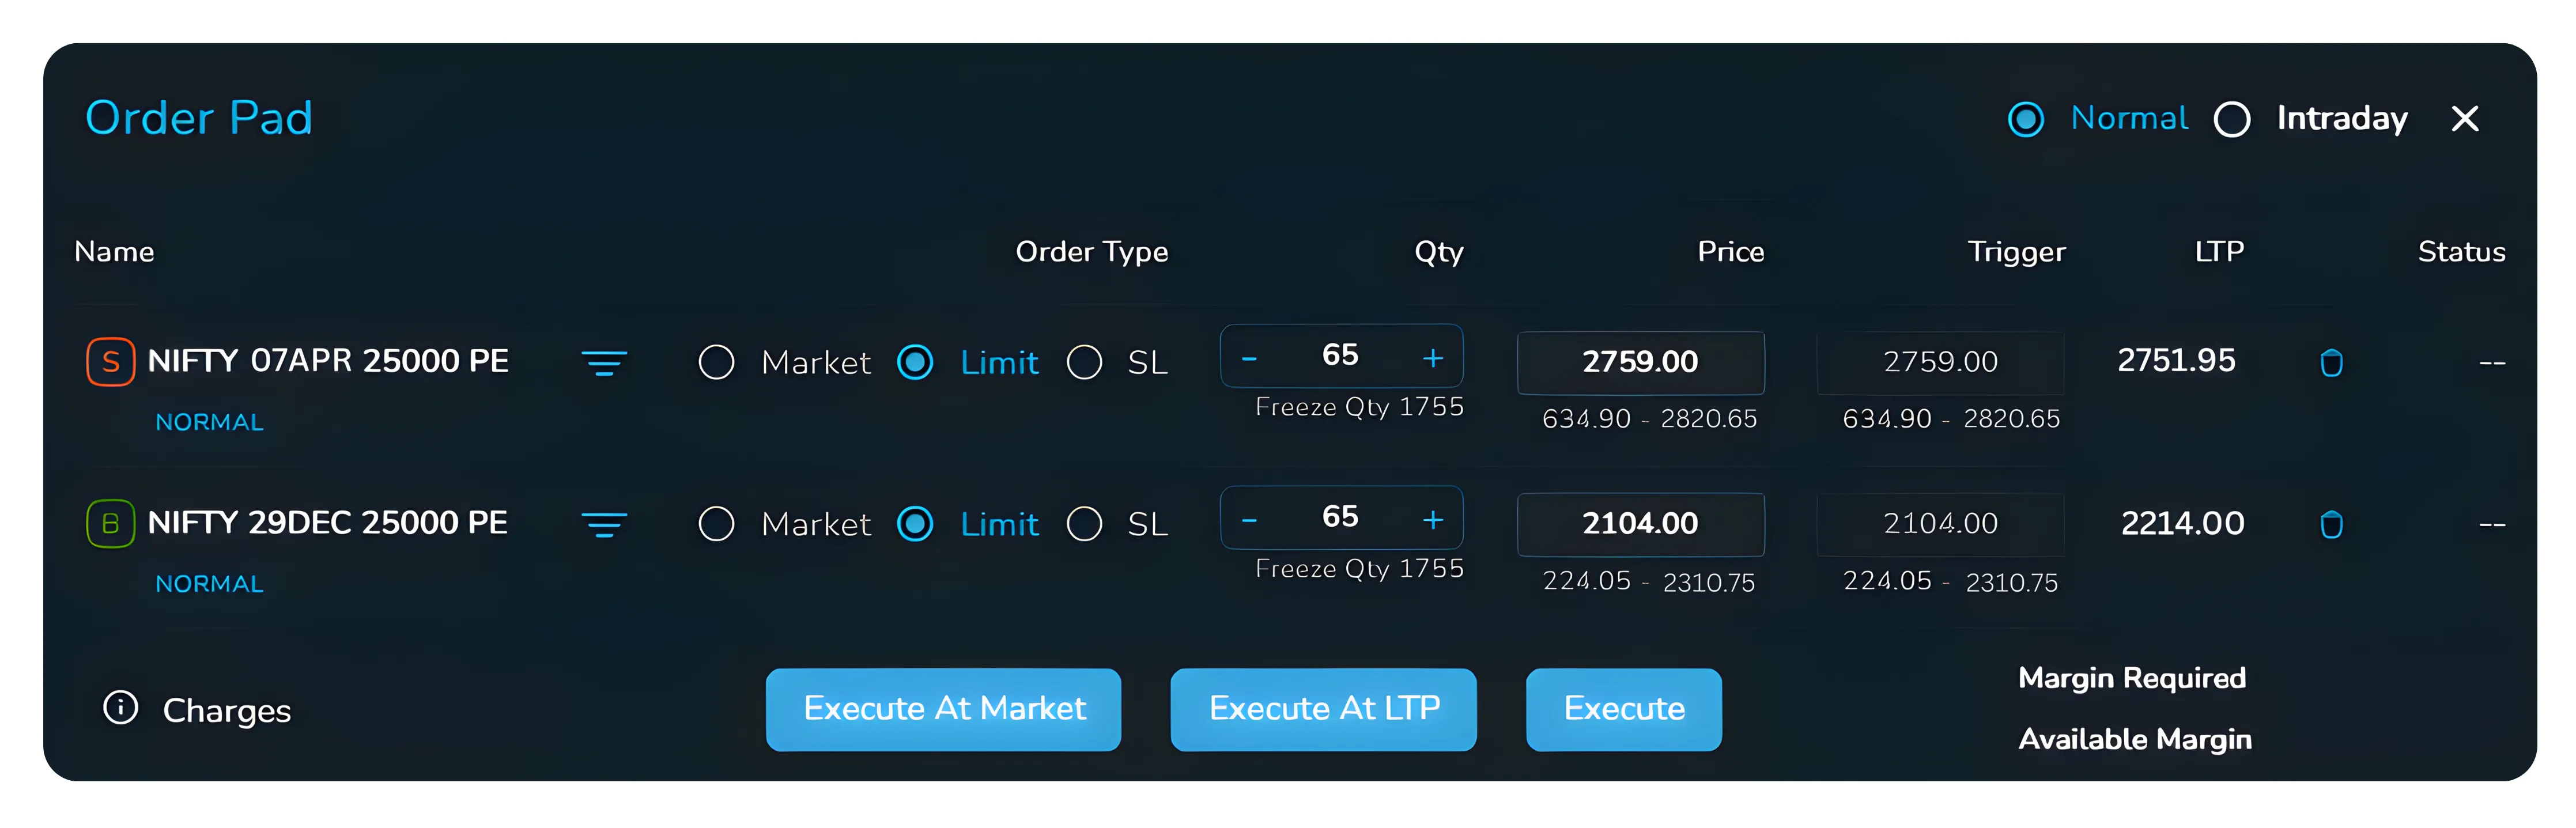
In the NIFTY 25000 PE example from April 2026, with Nifty trading at 22,225 and the 25000 strike sitting 12.5% above spot, selling the April 7 put at Rs. 2,759 (IV 54.6%) and buying the December put at Rs. 2,104 (IV 14.4%) generated an upfront credit of Rs. 655 per unit. The forward factor was 277% (exceptional) and the position made Rs. 8,983 in a single day when Nifty recovered.
The deep-ITM calendar is inherently more directional than an at-the-money calendar. Since both legs have a delta close to minus one, the position has a meaningful net delta and behaves somewhat like a long call via put-call parity. It rewards a market recovery but suffers if the underlying continues to fall. Use this structure only when you have a strong conviction that the panic is overdone and the market will stabilise or recover.
Executing an options deep ITM put trade effectively creates an options credit spread, rewarding traders who can accurately time market stabilization.
Rolling the Short Leg — Extending the Trade
One of the most powerful features of the calendar spread is that it does not end when the short leg expires. The long-dated option continues to live as your anchor position, ready for another short leg to be sold against it. This process (selling a new near-term option after the previous one expires or is closed) is called rolling.
If you ever wondered how rolling works in an options calendar spread or sought to explain calendar spread rolling in simple terms, it essentially involves maintaining your distant leg while actively managing the near-dated exposure. An effective options rolling strategy is central to maintaining your edge in the market.
How to Roll
On the day the short leg expires (or a day before if you want to avoid expiry-day volatility), you simply sell the next available short-dated option at the same strike. Your long-dated option remains untouched in your account. Each new short leg collects fresh premium, which compounds your income over time.
On NxtOption, rolling is straightforward. Close the expiring short leg and simultaneously open the new short leg. Use limit orders on both legs, checking the bid-ask spread before entry. Deep-ITM options can have wider spreads, so be patient and target the mid-price rather than the ask.
Choosing the Strike for Each Roll
The most important principle when rolling is to re-evaluate the forward factor at the time of rollover, not simply to repeat the same strike mechanically. If the market has moved significantly since entry, the optimal strike for the next short leg may have changed.
As a rule of thumb, try to maintain approximately the same percentage ITM or OTM relationship that you started with. If your original short leg was 7% in the money when you entered, look for a new short leg that is also roughly 7% in the money at the new spot price. This keeps the gamma and theta profile of the calendar consistent across rolls.
Rolling Sequence — NIFTY 25000 PE Calendar (April 2026)
Entry: Sell Apr 7 25000 PE @ Rs. 2,741 (IV 54.6%)
Roll 1: Apr 7 expires. Sell Apr 13 25000 PE @ Rs. 2,327 (IV 33.9%, FF 161%)
Roll 2: Apr 13 expires. Sell Apr 28 25000 PE or May (FF 40-56%)
Exit rule: Close all legs when FF drops below 20% or Nifty recovers above 24,000
Dec 29 25000 PE (long anchor) held throughout all rolls.
Using Futures as a Temporary Hedge
Occasionally, when a short leg expires and the next expiry has insufficient liquidity for a clean rollover, you may be left with an unhedged long-dated put. In this situation, rather than exiting the long-dated option at a poor price, you can temporarily hedge it using Nifty Futures.
The long-dated put has a negative delta, typically around minus 0.5 to minus 0.7. Buying one lot of Nifty Futures (delta plus one) partially offsets this. The combined position has a near-zero or mildly positive delta, protecting you from further losses if the market rallies while you wait for the next expiry to open up with better liquidity.
There is an elegant mathematical bonus here. A long put plus a long futures contract is equivalent to a synthetic long call at the same strike. If the market rallies strongly above 25,000, this synthetic call position has theoretically unlimited upside, a pleasant outcome for what began as a defensive hedge.
Once liquidity (typically within one to two trading sessions as the new weekly contract gains) close the futures position and sell the next short-leg option. Your long-dated anchor remains undisturbed throughout.
Also read: A walkthrough of the NxtOption Simulator
Risks to Understand Before Trading
No strategy is without risk, and the calendar spread is no exception. Understanding the risks clearly (not just in theory but in the specific market context of Indian index options) is essential before committing capital.
Risk 1: The Underlying Moves Too Far
The most fundamental risk in a calendar spread is a large move in the underlying within the life of the short leg. If Nifty moves more than four to five percent sharply and rapidly, the short near-term option's gamma causes it to gain value faster than the long-dated option can offset. The position can move from a profit to a significant loss in a single session.
Mitigation: Define a hard stop-loss level before entry. In most calendar spread setups, this is expressed as a Nifty level rather than a P&L amount. For example, if your calendar is centred at 23,000 and you entered with Nifty at 22,700, a stop at Nifty 22,000 gives you roughly three percent of buffer. If that level is breached decisively, exit both legs simultaneously.
Risk 2: Volatility Collapses Without a Market Move
This is the subtler risk that surprises traders unfamiliar with volatility dynamics. If implied volatility collapses across the entire term structure (meaning both the near-term and far-term IV drop sharply together) the calendar spread can lose value even if the underlying barely moves.
This scenario is more common in call calendars in a strongly rallying market, where the overall VIX-equivalent drops sharply. In put calendars during a panic, this is less likely because the near-term IV tends to be stickier during ongoing stress.
Mitigation: Enter put calendars only when the near-term IV is significantly above the forward vol (forward factor above 40%), giving you a buffer for partial IV normalisation. Do not enter when near-term IV is already low, there is no premium left to sell.
Awareness of the options IV collapse risk is essential for anyone diving into options volatility trading. To safely gauge what is the forward factor threshold for entering calendar spread, ensuring your calendar spread forward factor sits comfortably above the required baseline is crucial.
Risk 3: Liquidity in the Long-Dated Option
Long-dated index options in India (particularly December or beyond) tend to have much lower open interest than weekly or monthly near-term options. Bid-ask spreads can be wide, especially for deep in-the-money strikes. This means your entry and exit costs on the long leg are higher than they appear at the mid-price.
Mitigation: Always check the open interest and bid-ask spread of the far-month option before entry. On NxtOption, the live market depth shows you exactly how many lots are available at each price level. For NIFTY December options, strikes like 23,000 typically have adequate liquidity (over 10 lakh in open interest), while less common strikes may be thin. Use limit orders and allow a few minutes for fills rather than hitting the market order.
Assessing calendar spread liquidity means knowing exactly how to check liquidity for long dated options before taking a position. Keep an eye on calendar spread open interest to guarantee you can eventually exit the far-dated leg at a fair price.
Risk 4: Transaction Costs Add Up
Every rollover cycle incurs brokerage, STT, exchange charges, and GST. For a position that is rolled weekly over two months, this can amount to Rs. 7,000 to Rs. 10,000 per lot in cumulative charges a significant drag against the premium collected.
Mitigation: Factor transaction costs into your profit target before entry. On Tradejini, use the charges calculator available within NxtOption to estimate the all-in cost of each leg. A good calendar spread setup should generate enough premium that even after all charges, the risk-reward remains at least 2:1.
Risk 5: Event Risk in the Short Leg Window
If a major event (RBI policy announcement, Union Budget, US Federal Reserve meeting, or election results) falls within the life of your short leg, the near-term IV can spike further rather than normalising. Your short leg becomes more expensive to buy back, increasing your loss if you need to exit early.
Mitigation: Always check the economic calendar before entering. If a known high-impact event falls within the short leg's expiry window, either choose a different expiry that brackets the event cleanly or reduce position size to account for additional uncertainty.
To answer what event risk is in calendar spread trading, it simply refers to holding a calendar spread event risk exposure during scheduled announcements. Major catalysts like RBI policy meetings or the Union Budget Day can inject unpredictable spikes into the near-term options event risk.
| Risk | When It Occurs | Mitigation |
|---|---|---|
| Large underlying move | Sudden Nifty move > 4–5% in short leg window | Define stop-loss level before entry (e.g., Nifty 22,000) |
| Full vol collapse | VIX drops sharply on market rally | Enter only with FF > 40%; avoid low-IV environments |
| Poor far-month liquidity | Thin open interest in Dec/Mar expiry | Check OI and bid-ask depth before entry; use limit orders |
| Transaction cost drag | Multiple rollover cycles | Include charges in profit target; aim for 2:1 risk-reward |
| Event risk | RBI/Fed/Budget inside short leg window | Check economic calendar; avoid or size down around events |
Profit Targets and Exit Discipline
One of the most common mistakes traders make with calendar spreads is holding too long in pursuit of maximum profit. A disciplined exit at a reasonable profit target is almost always superior to holding through the final days of the short leg.
A practical profit target for most calendar setups is six to eight percent of the net premium deployed. For a calendar entered at a debit of Rs. 21,000 per lot, this means closing the entire spread when the position shows a profit of Rs. 1,260 to Rs. 1,680. If the forward factor was unusually high at entry (above 100%), targets of fifteen to twenty percent are achievable and appropriate.
Set a clear stop-loss in Nifty terms, not in rupee P&L terms. Market P&L can fluctuate due to IV changes even when Nifty is unchanged. Anchoring your stop to a specific index level (for example, 'exit if Nifty closes below 22,000') gives you a cleaner decision rule that is immune to intraday volatility noise.
A well-defined calendar spread exit strategy dictates that you secure gains rather than holding for maximum mathematical payout. By clarifying what the profit target is for a calendar spread and mapping out how to exit it, you cement your profit target securely.
The cardinal rule of calendar spread management: take profits when they appear. The short leg's time value burns away in the final days, but so does your margin for error. A small profit locked in beats a theoretical maximum profit that evaporates on a gap opening.
Putting It All Together
The calendar spread is one of the few options strategies that does not require you to predict the market's direction. It asks only one question: is the market pricing in more fear for the next two weeks than it is for the next six months? When the answer is clearly yes (and the forward factor confirms it) the trade has a genuine statistical edge.
The strategy works because human psychology creates systematic mispricings. When Nifty falls five percent in three days, traders rush to buy near-term puts for protection. This crushes the near-term implied volatility upward to levels that are objectively excessive relative to what the next several months can reasonably deliver. The calendar spread trader sells this excess and patiently waits for normalcy to return.
Through the examples in this guide (drawn from real NIFTY trades executed on April 2 and 7, 2026) you have seen how this plays out in practice. A 54.6% short-term IV with a 14.4% long-term IV and a forward factor of 277% is not a nuanced signal. It is the market screaming that near-term fear is wildly overdone. Acting on that signal, with discipline and defined risk, is what professional volatility trading looks like.
Three Questions Before Every Trade
Before entering any calendar spread on NxtOption, answer these three questions. If all three have clear, favourable answers, the trade is worth taking.
First: Is the forward factor above 40%? Anything below this means the IV difference is not wide enough to justify the transaction costs and the risk of a bad move.
Second: Is there a known event risk inside the short leg's expiry window? If yes, either skip the trade or choose an expiry that brackets the event cleanly.
Third: Does the long-dated option have sufficient liquidity? Check the open interest and bid-ask spread. If the spread on the long leg is more than Rs. 15 wide on a NIFTY option, the slippage cost may erode your edge before the trade even begins.
Answer all three favourably, size appropriately (no more than five percent of trading capital in any single calendar position) and execute with limit orders. The rest is patience.
Disclaimer: The information provided in our blogs is for informational purposes only and should not be construed as financial, investment, or trading advice. Trading and investing in the securities market carries risk. Always conduct your own research and consult with a qualified financial advisor before making any investment decisions. Past performance is not indicative of future results. Copyrighted and original content for your trading and investing needs.
© 2026 — Tradejini. All Rights Reserved.