Most traders open their trading screen and look at two numbers first: Nifty 50 and Sensex. But on most days, the real story is underneath. One sector may be rallying 3% while another is quietly falling, and the broad index barely moves. If you only look at the headline index, you miss where the money is actually flowing.
Index Scan on CubePlus solves this by putting every major NSE and BSE index on a single screen, with price data, technical indicators, multi-period returns and pivot levels all available in four tabs. Instead of opening a dozen charts, you can scan the whole market in a few seconds and decide which index or sector deserves a closer look. The sections below walk through each tab, every field on it, and how traders can use it.
Where to Find Index Scan on CubePlus
Index Scan sits inside the Market Scan section of CubePlus. Click Market Scan in the top menu (or in the bottom bar on smaller screens) and you will see a row of tools: Advance/Decline, Index Scan, Seasonalitics, Results Calendar, Corporate Actions, Equity, Options, Futures, Commodity, ETFs and the F&O Ban List. Click Index Scan to open it.

Market Scan menu with the Index Scan tab
Inside Index Scan there are four tabs: Overview, Technicals, Performance and Pivot Level. On the right side of the screen you will also find the NSE / BSE toggle, a period or timeframe selector, and a column settings icon. Each of these is covered below.
Overview Tab: The Market at a Glance
The Overview tab is the default view. It lists more than 35 NSE indices, from the broad-market benchmarks such as NIFTY 50, NIFTY 100, NIFTY 200 and NIFTY 500 to market-cap indices (NIFTY NEXT 50, MIDCPNIFTY 100, SMLCPNIFTY 100), sectoral indices (Auto, IT, PSU Bank, Pharma, FMCG, Metal, Energy, Realty and more), thematic indices (India Defence, India Manufacturing, Housing, Capital Market, MNC, CPSE) and INDIA VIX.
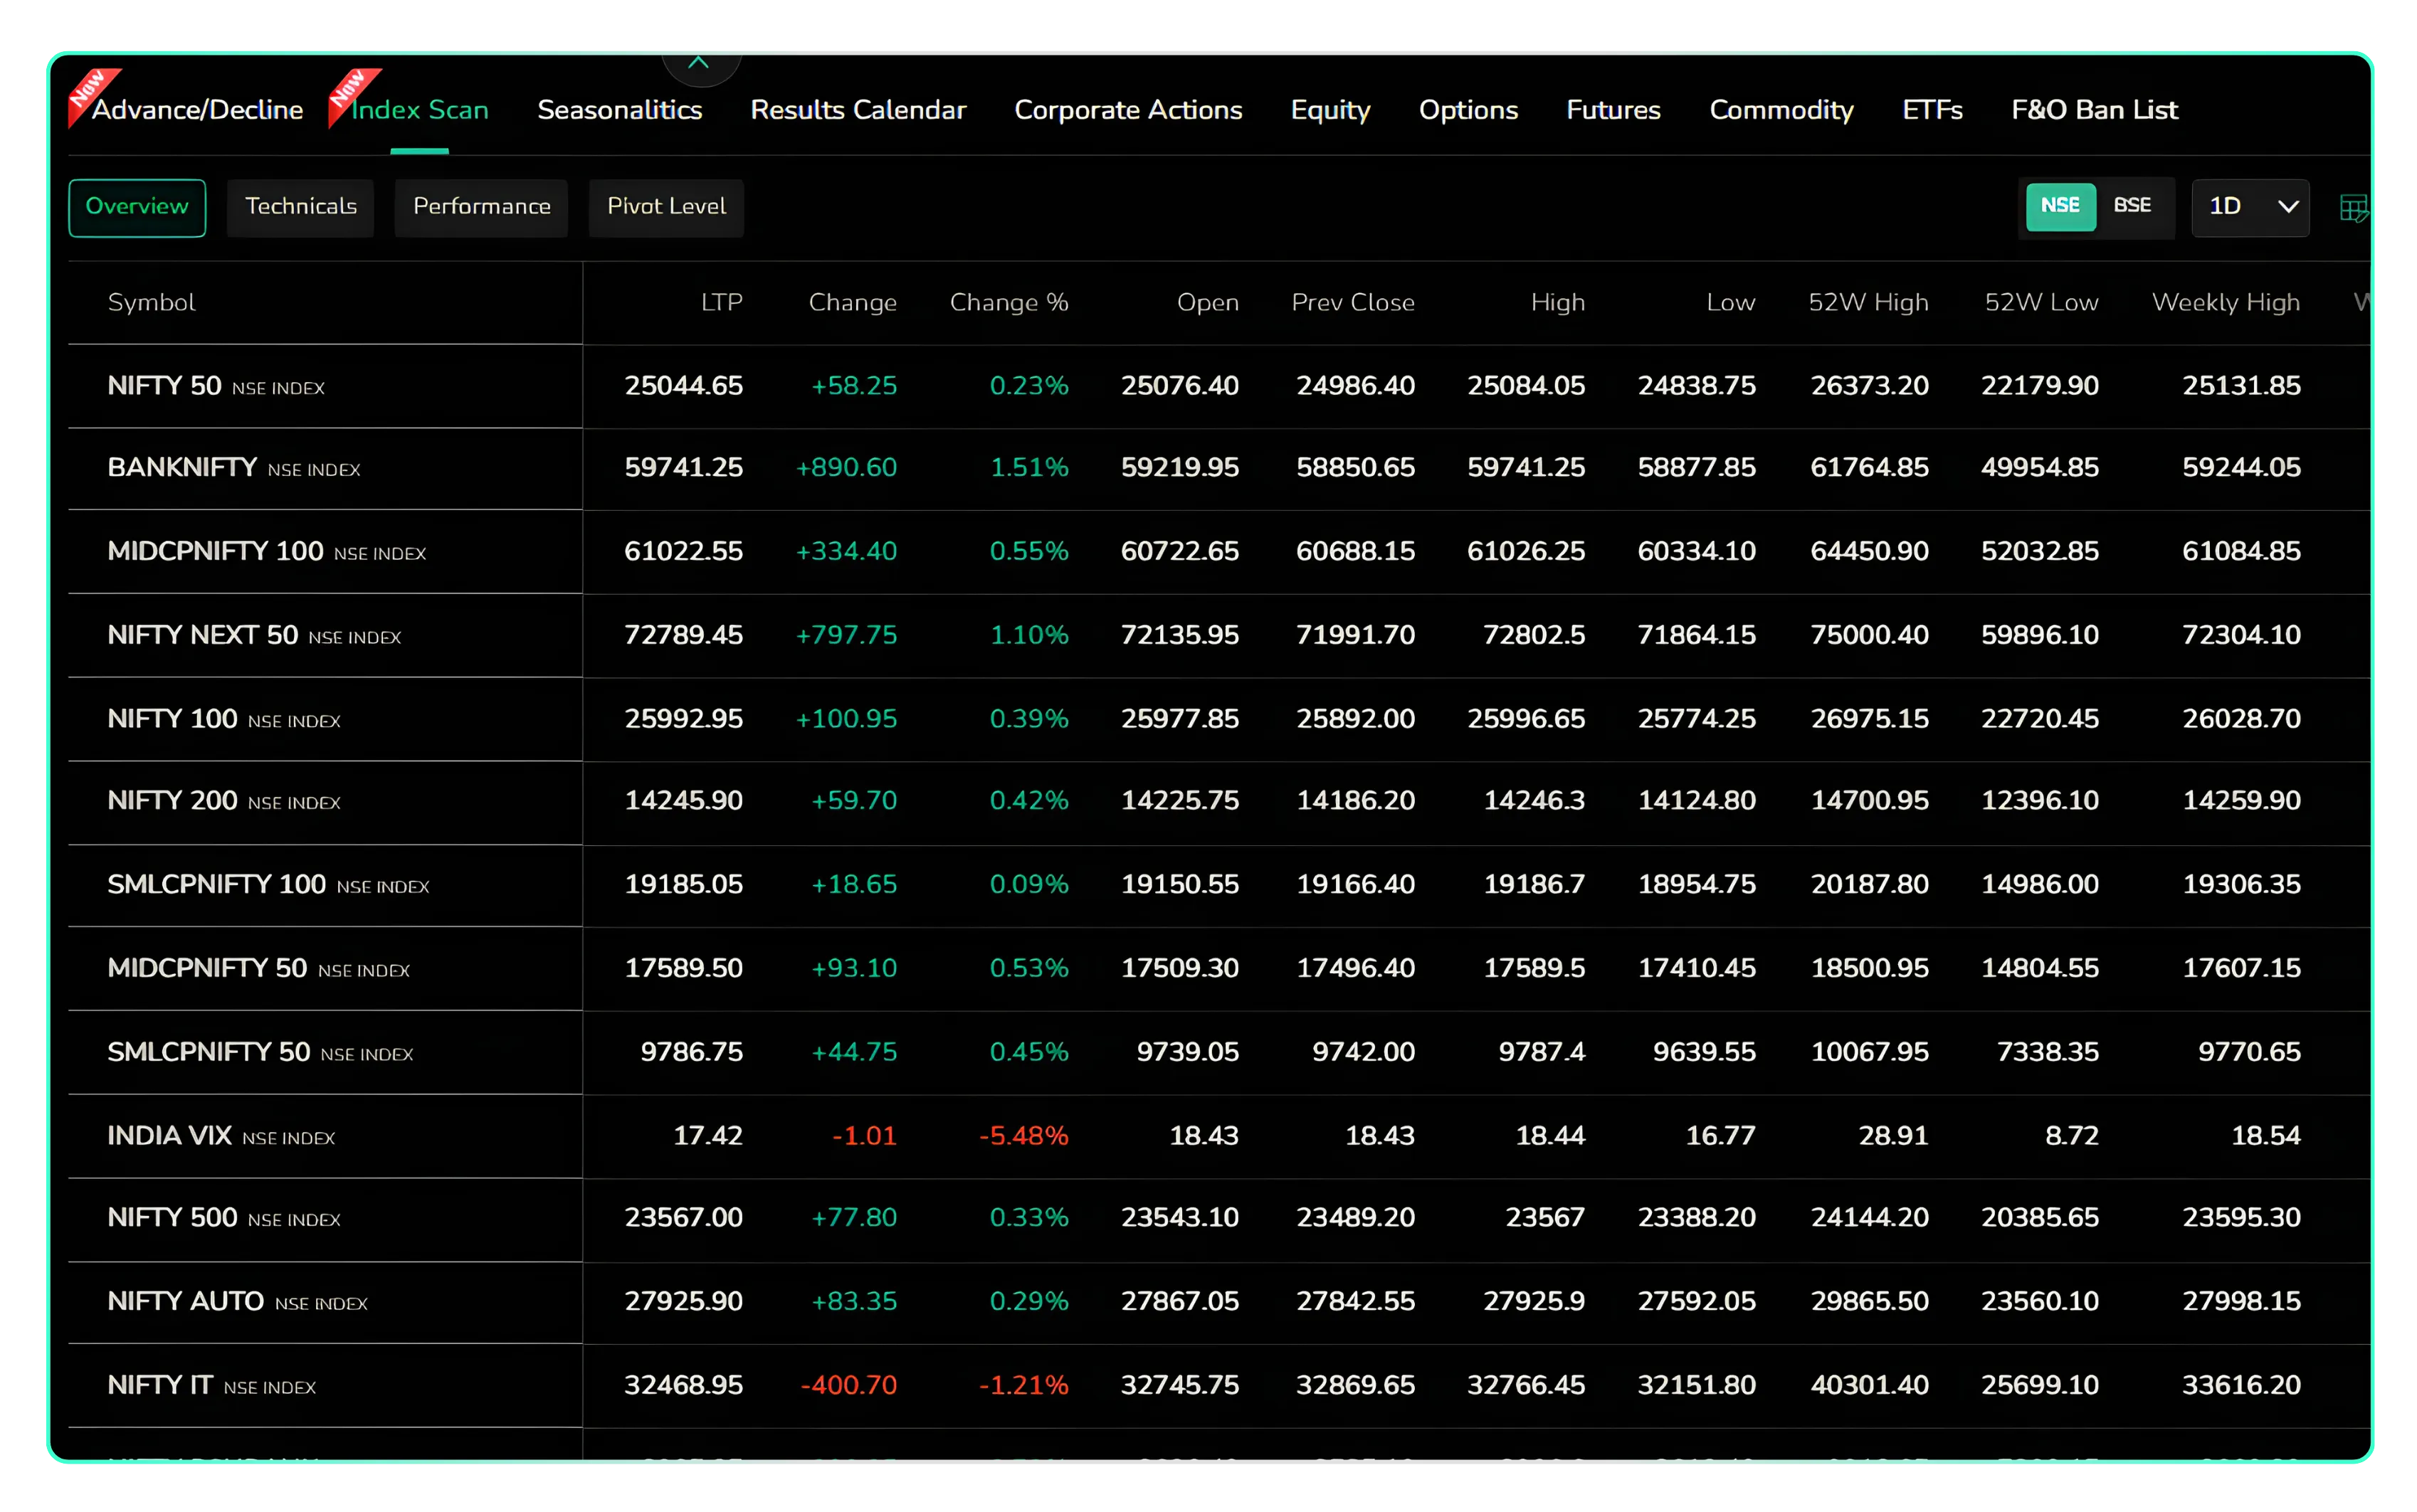 Index Scan Overview tab showing NSE indices
The Overview tab displays key information for each index, including its name and exchange, last traded value (LTP), and changes in points and percentage compared with the previous close. You can also track the day's opening value, previous closing value, intraday high and low, 52-week high and low, and the current week's high and low. This gives you a quick view of how different indices are performing across the market.
How traders can use the Overview tab
- Spot sector rotation instantly. In the example shown, NIFTY PSUBANK is up 3.73% and NIFTY PHARMA is up 1.64%, while NIFTY IT is down 1.21% and NIFTY CEMENT is down 1.42%, all on a day when NIFTY 50 moved only 0.23%. That gap is exactly what a sector trader is looking for.
- Check how close an index is to its extremes. Comparing LTP with the 52W High and 52W Low columns shows whether an index is near a breakout zone or near multi-month support.
- Read the opening action. Comparing Open with Prev Close shows whether an index gapped up or down, and comparing LTP with Open shows whether that gap is holding.
- Watch volatility. INDIA VIX is listed alongside the indices. A falling VIX (down 5.48% in the example) usually points to calmer conditions, which matters if you trade options.
Quick Actions on Every Row
Hover over any index row and three icons appear next to the name: Market Depth, Chart and Add to Marketwatch. This means you can go from spotting a strong sector to opening its chart, or pinning it to your watchlist, without leaving Index Scan.
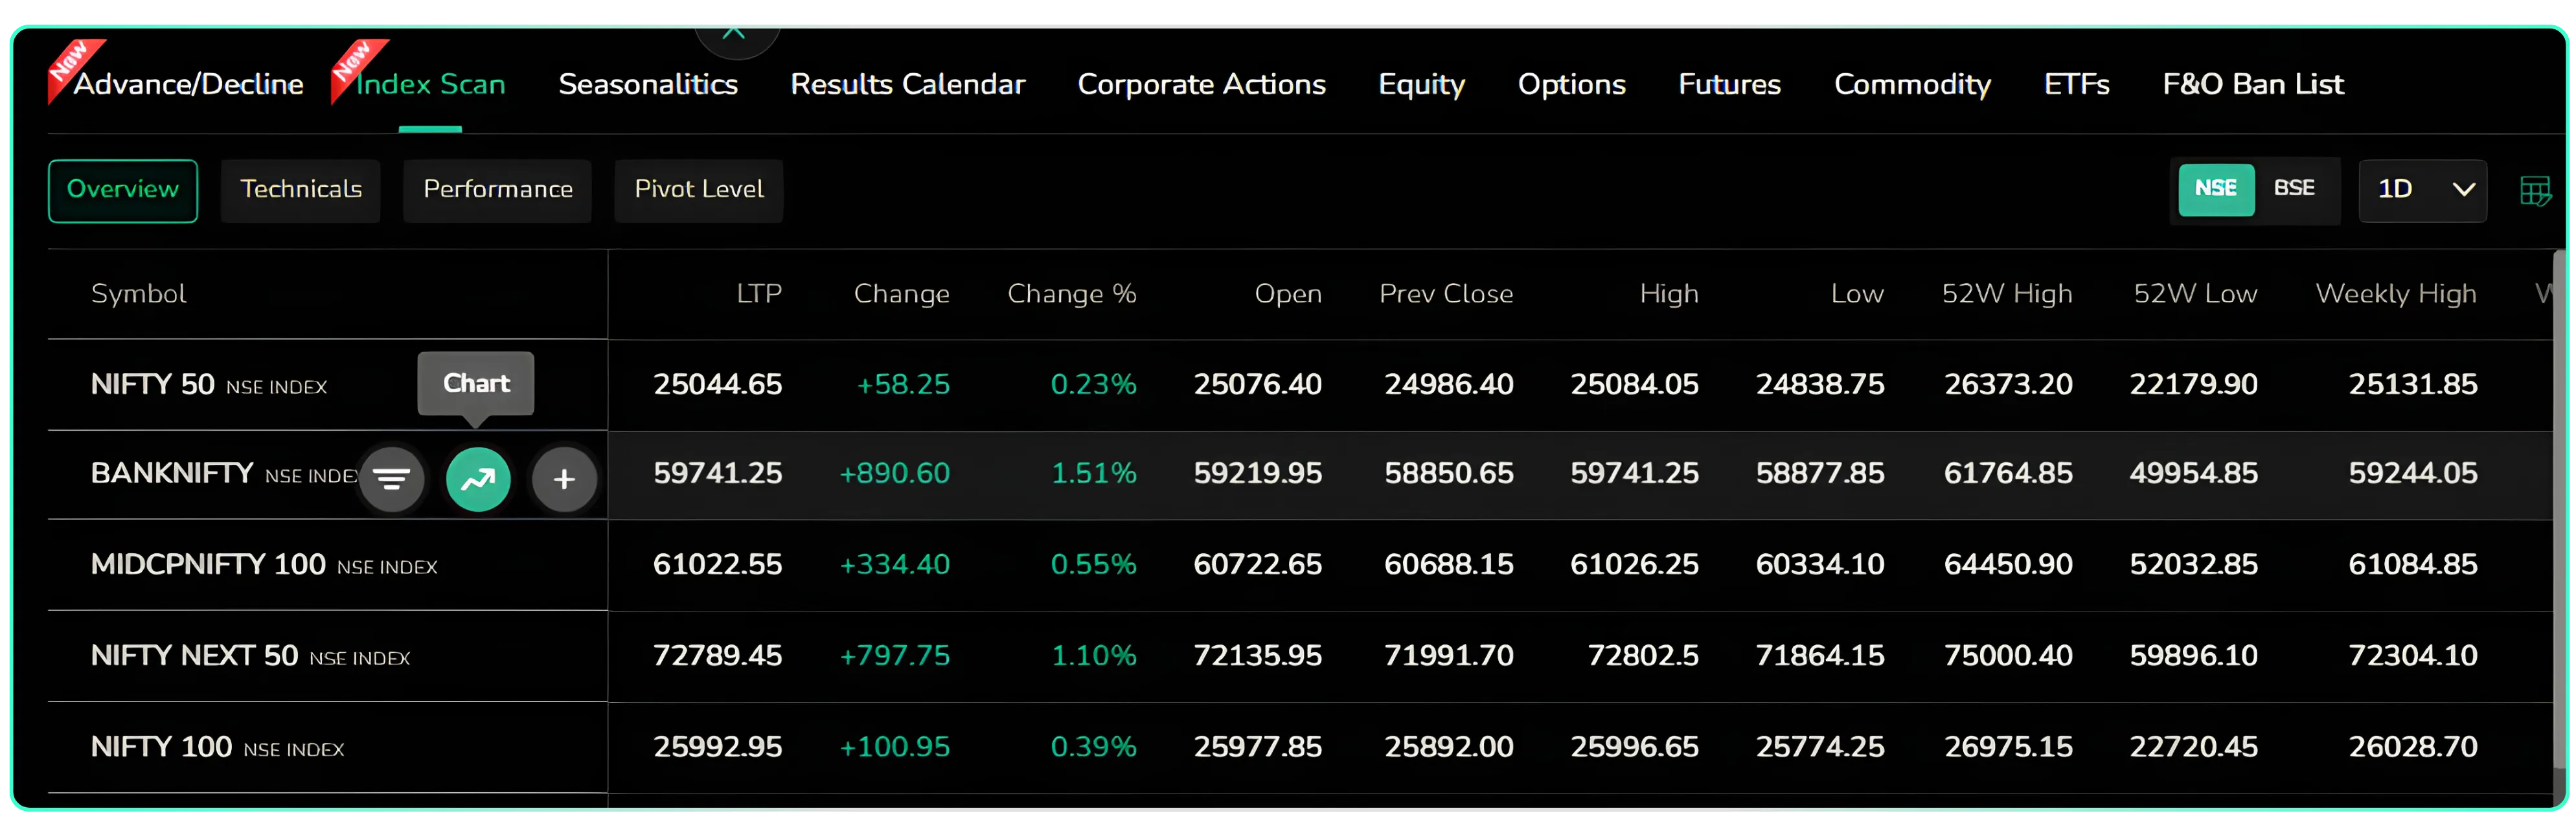 Hovering over a row shows Market Depth, Chart and Add to Marketwatch
Switching Between NSE and BSE Indices
The NSE / BSE toggle at the top right switches the whole table. On BSE you get SENSEX, BSE 100, BSE 200, BANKEX and BSE sectoral indices such as BSE IT, BSE Telecom, BSE Auto, BSE FMCG, BSE Metal, BSE Oil & Gas, BSE Power, BSE Finance, BSE Healthcare, BSE PSU and BSE IPO. This is useful for Sensex and Bankex options traders and for anyone who wants a sector view that the NSE list does not cover, such as Telecom or IPO stocks.
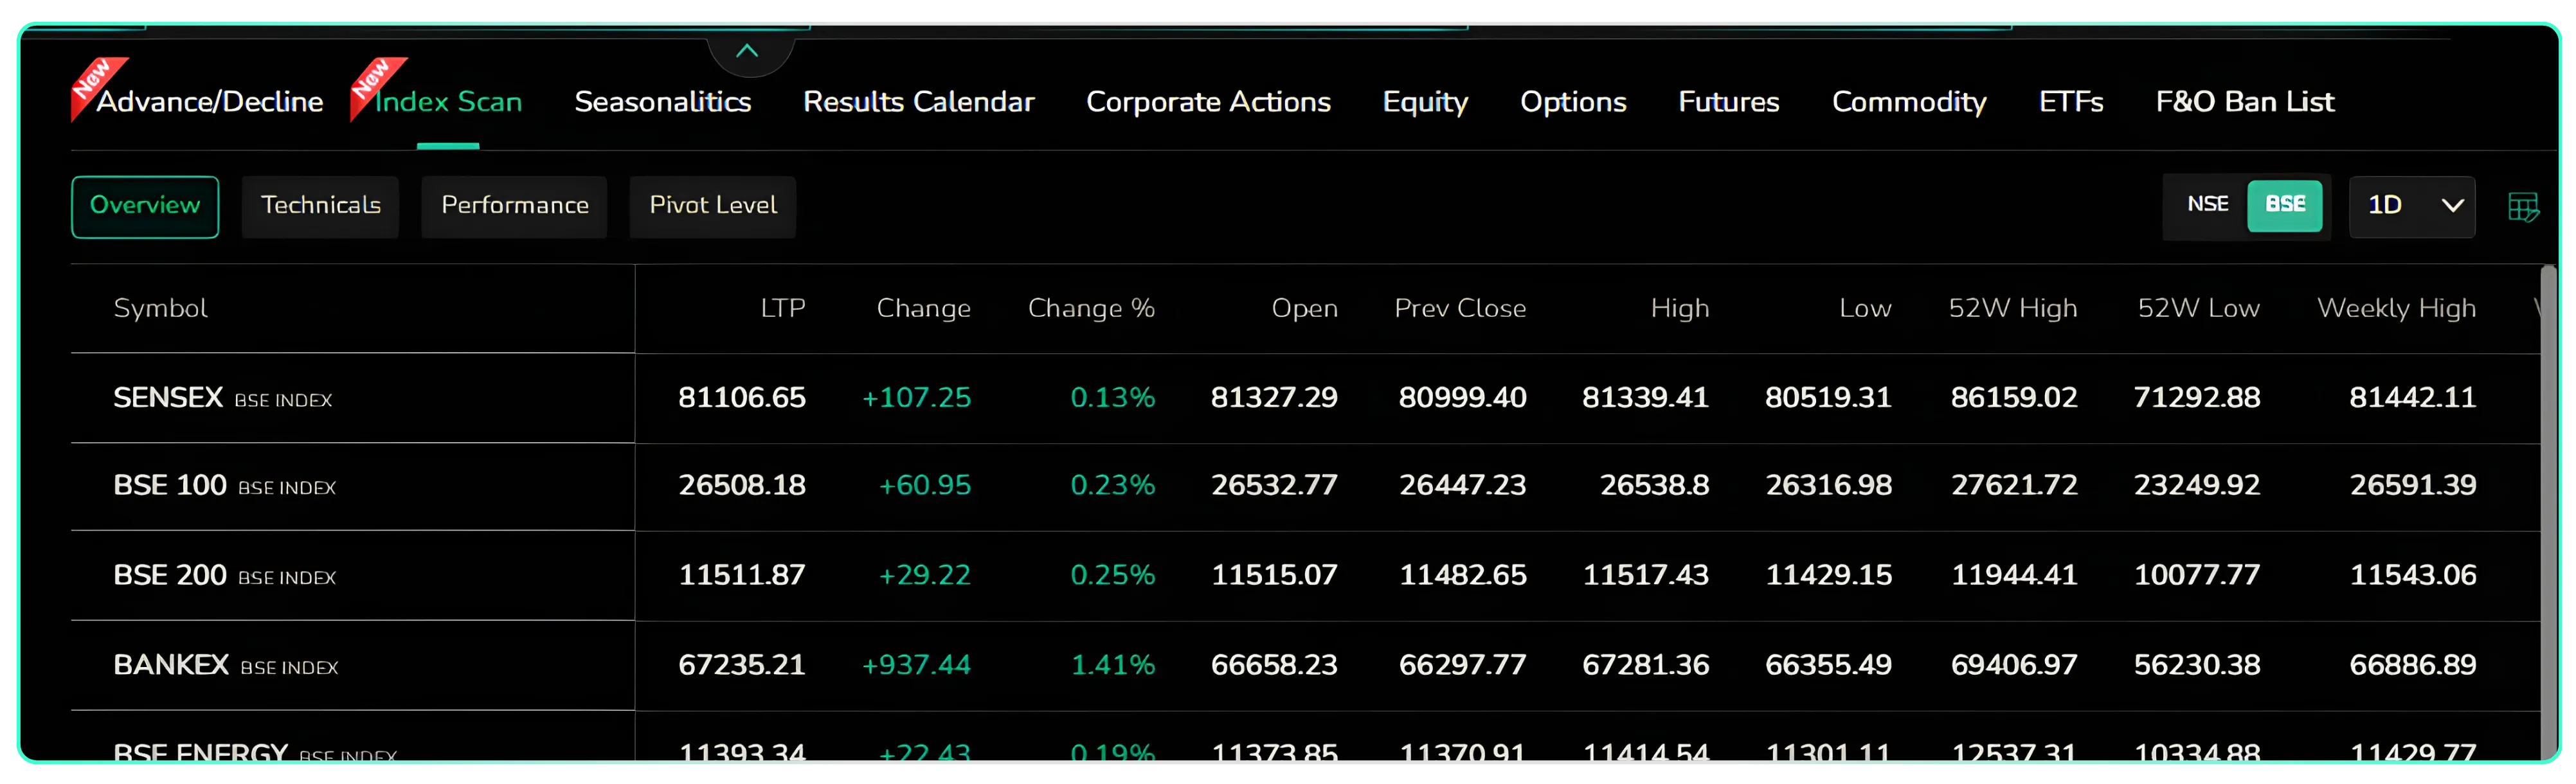 Overview tab with the BSE toggle selected
Technicals Tab: Indicators for Every Index Without Opening a Chart
The Technicals tab replaces the price columns with a full set of technical indicators. You choose the timeframe using the buttons at the top: 1 Min, 30 Min, Hour, Day, Weekly or Monthly. All indicator values in the table recalculate for the selected timeframe.
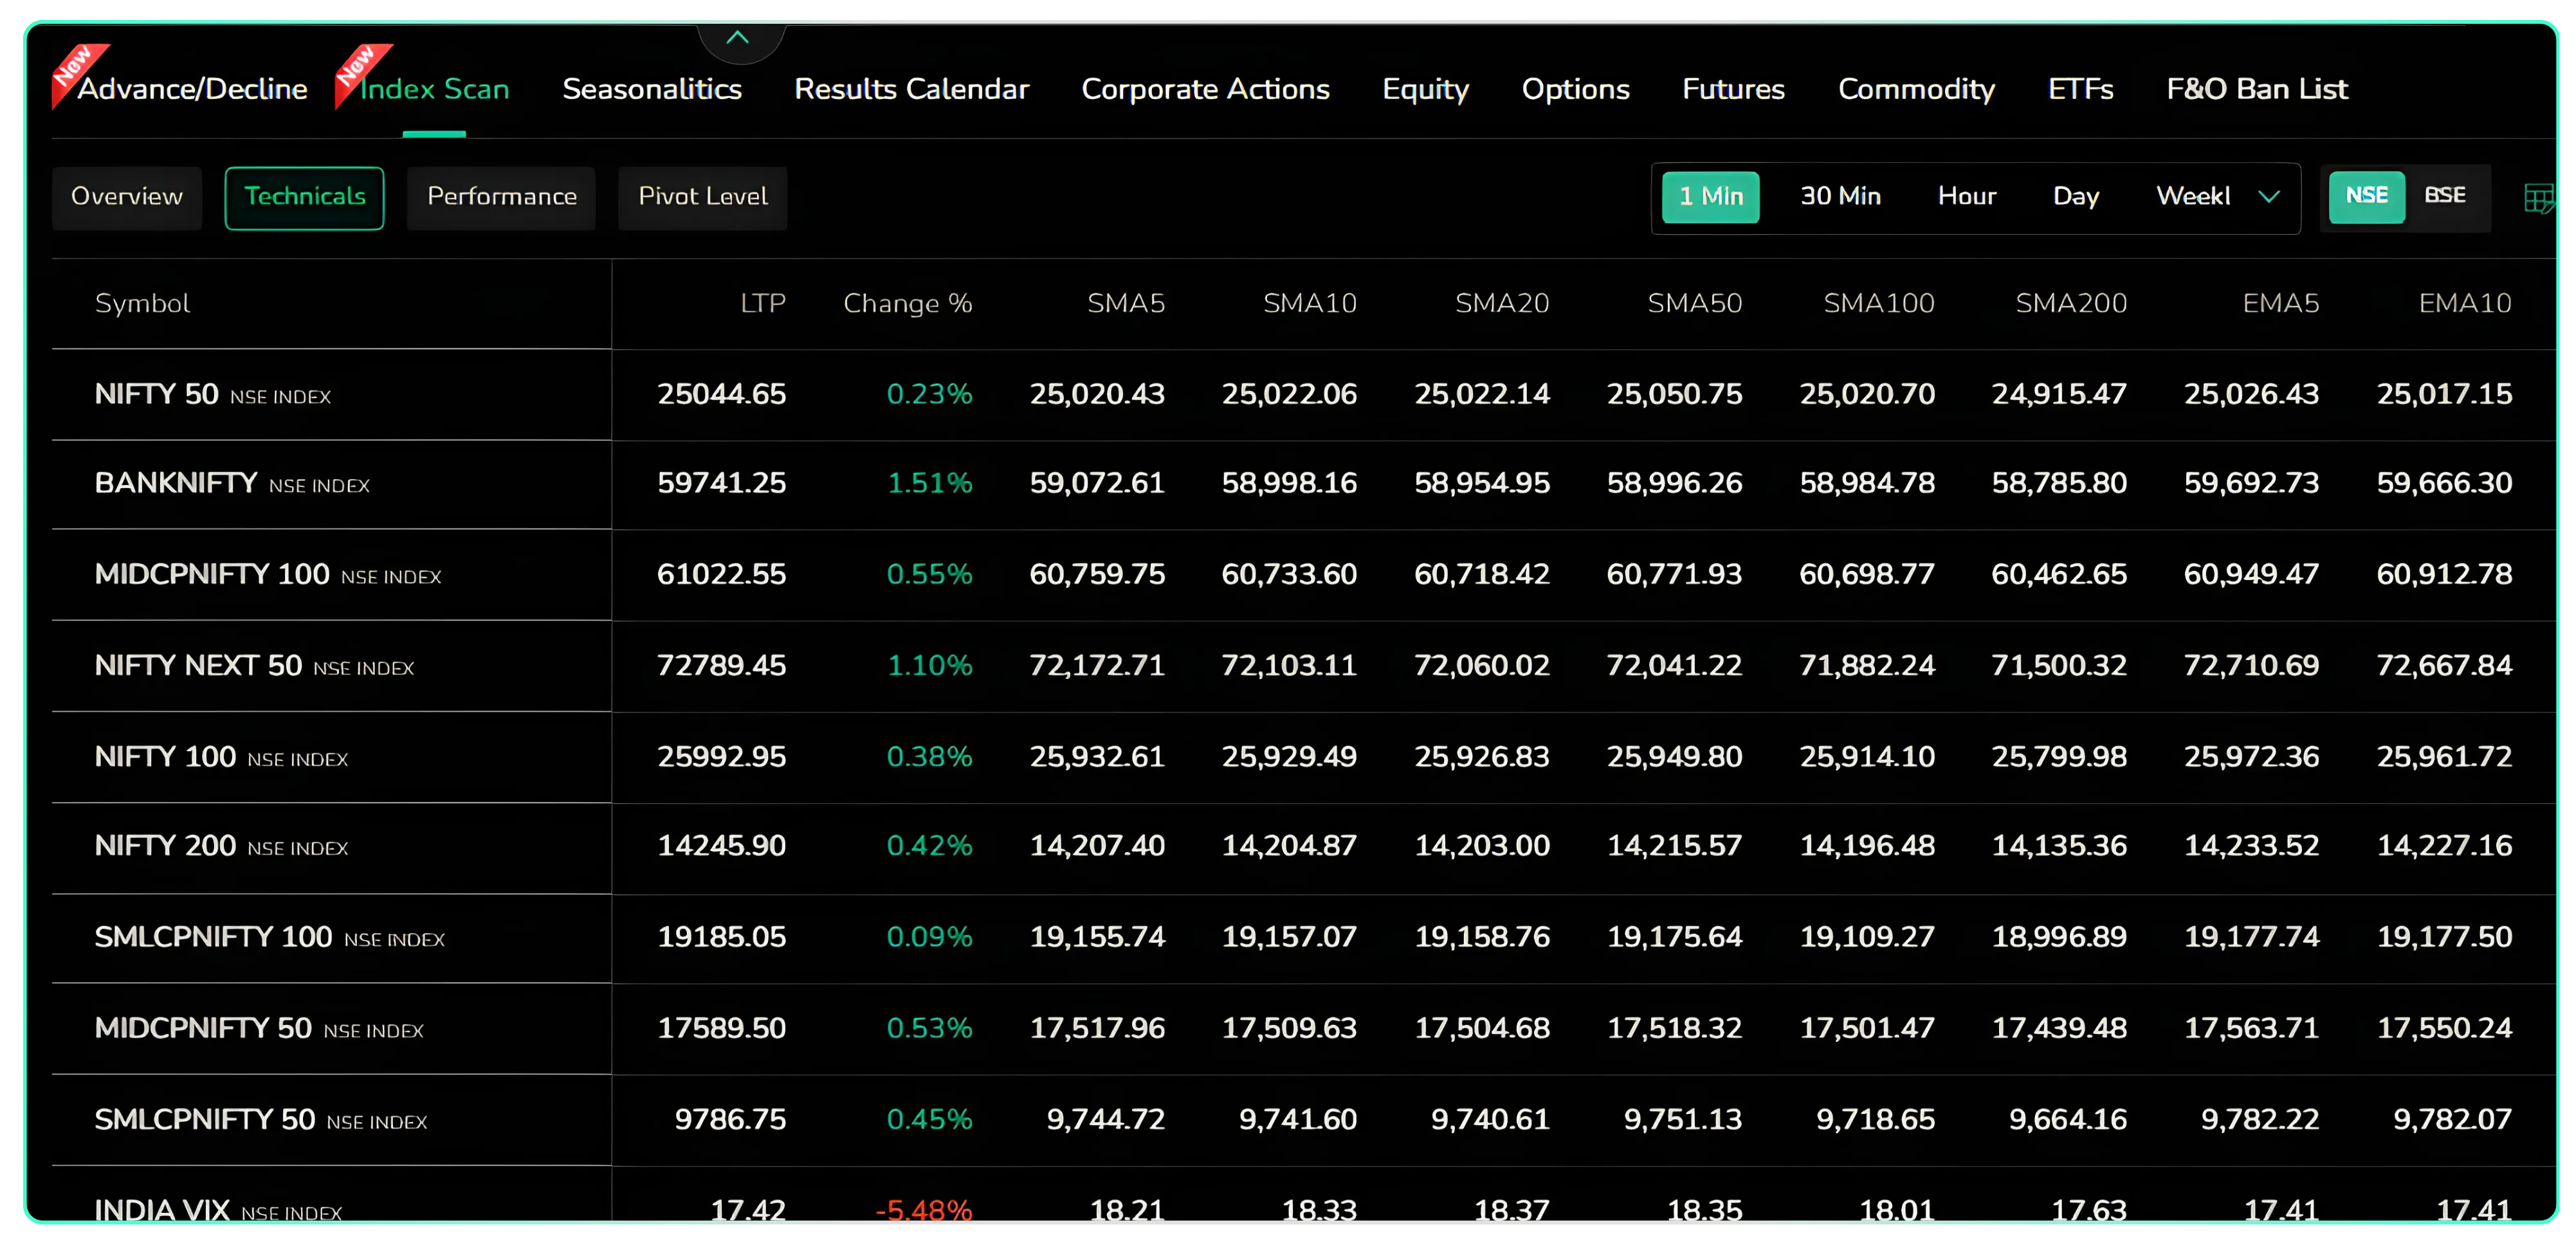
Technicals tab on the 1 Min timeframe
The indicators available are:
| Indicator | What it measures |
|---|---|
| SMA5, SMA10, SMA20, SMA50, SMA100, SMA200 | Simple moving averages over 5 to 200 periods |
| EMA5, EMA10, EMA20, EMA50, EMA100, EMA200 | Exponential moving averages, which react faster to recent prices |
| CCI(20) | Commodity Channel Index, shows how far price has stretched from its average |
| MACD(12,26,9) | Momentum and trend direction from two EMAs |
| Hull Moving Average (MA90) | A smoother, low-lag moving average |
| ROC(20) | Rate of change over 20 periods |
| Williams %R(14) | Where the close sits within the recent high-low range (0 to -100) |
| RSI(14) | Relative Strength Index, overbought above 70 and oversold below 30 |
| Bollinger Band | Volatility band value around the moving average |
Scroll the table to the right to see the oscillators: CCI, MACD, Hull MA, ROC, Williams %R, RSI and Bollinger Band.
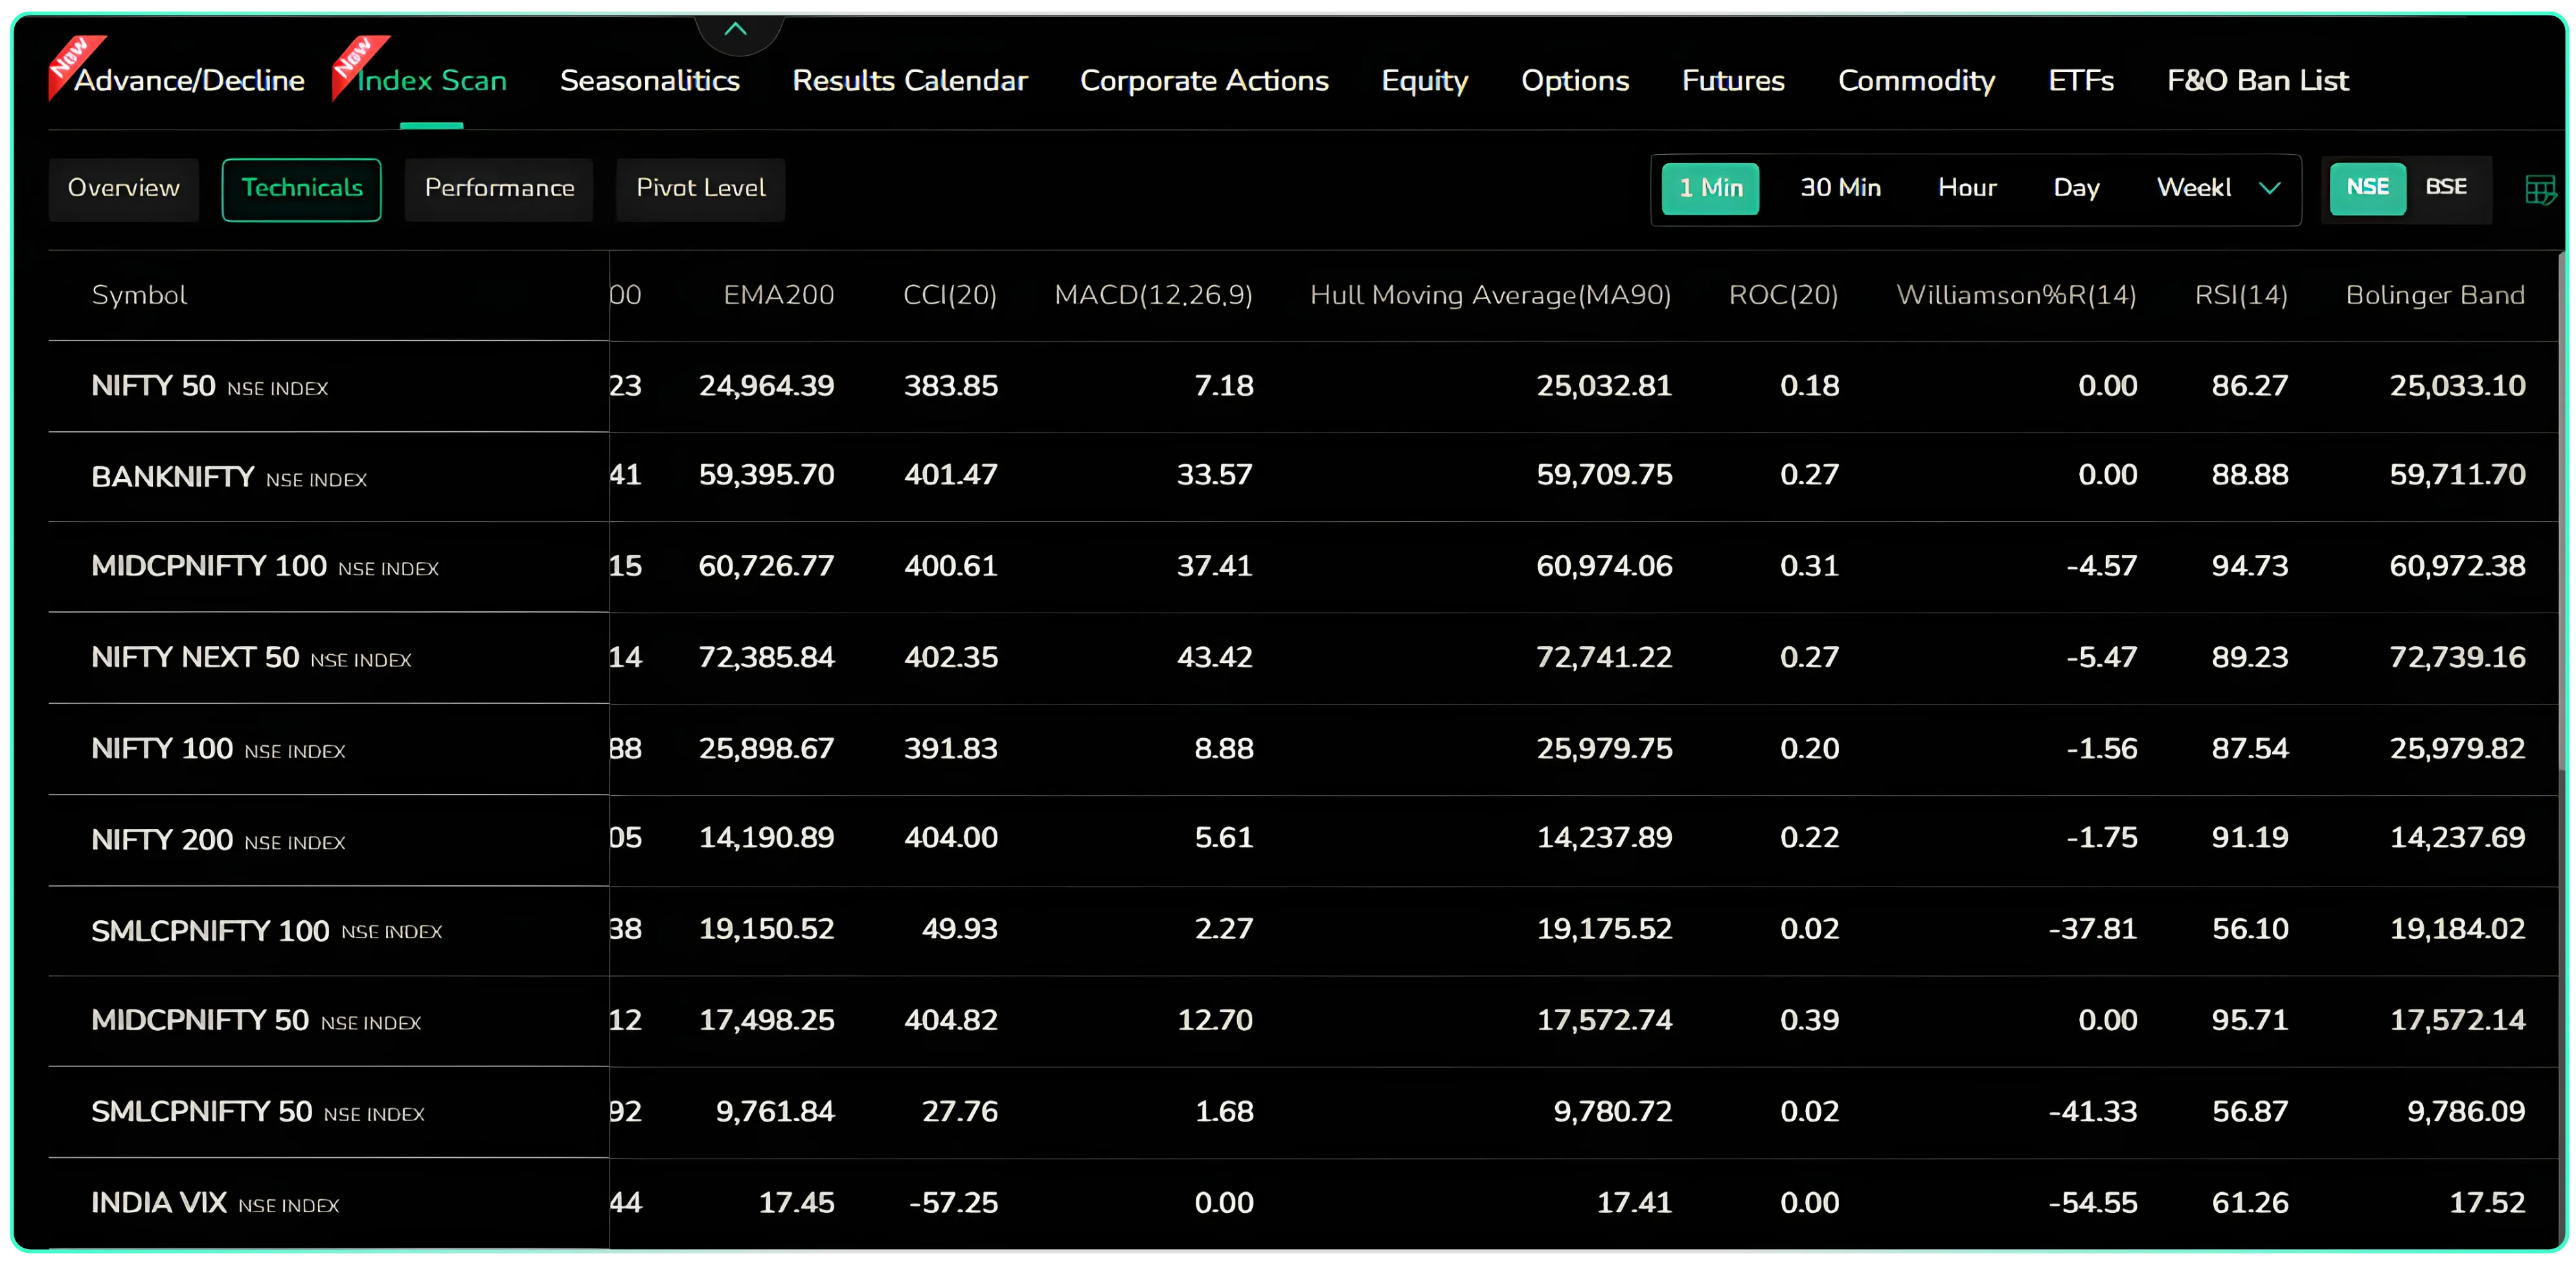
Oscillator columns on the right side of the Technicals tab
How traders can use the Technicals tab
- Trend check in one look. If an index's LTP is above its SMA20, SMA50 and SMA200 on the Day timeframe, the trend is up on every horizon. If it is below all of them, the trend is down.
- Find overbought or oversold indices. On the 1 Min timeframe in the example, MIDCPNIFTY 100 shows an RSI of 94.73 and MIDCPNIFTY 50 shows 95.71, both deep in overbought territory for the short term. Intraday traders may wait for a pullback before entering rather than chasing.
- Match the timeframe to your style. Scalpers can use 1 Min or 30 Min, swing traders Day, and positional traders Weekly or Monthly.
- Compare momentum across sectors. Sorting mentally by MACD or ROC shows which sectors have the strongest momentum right now.
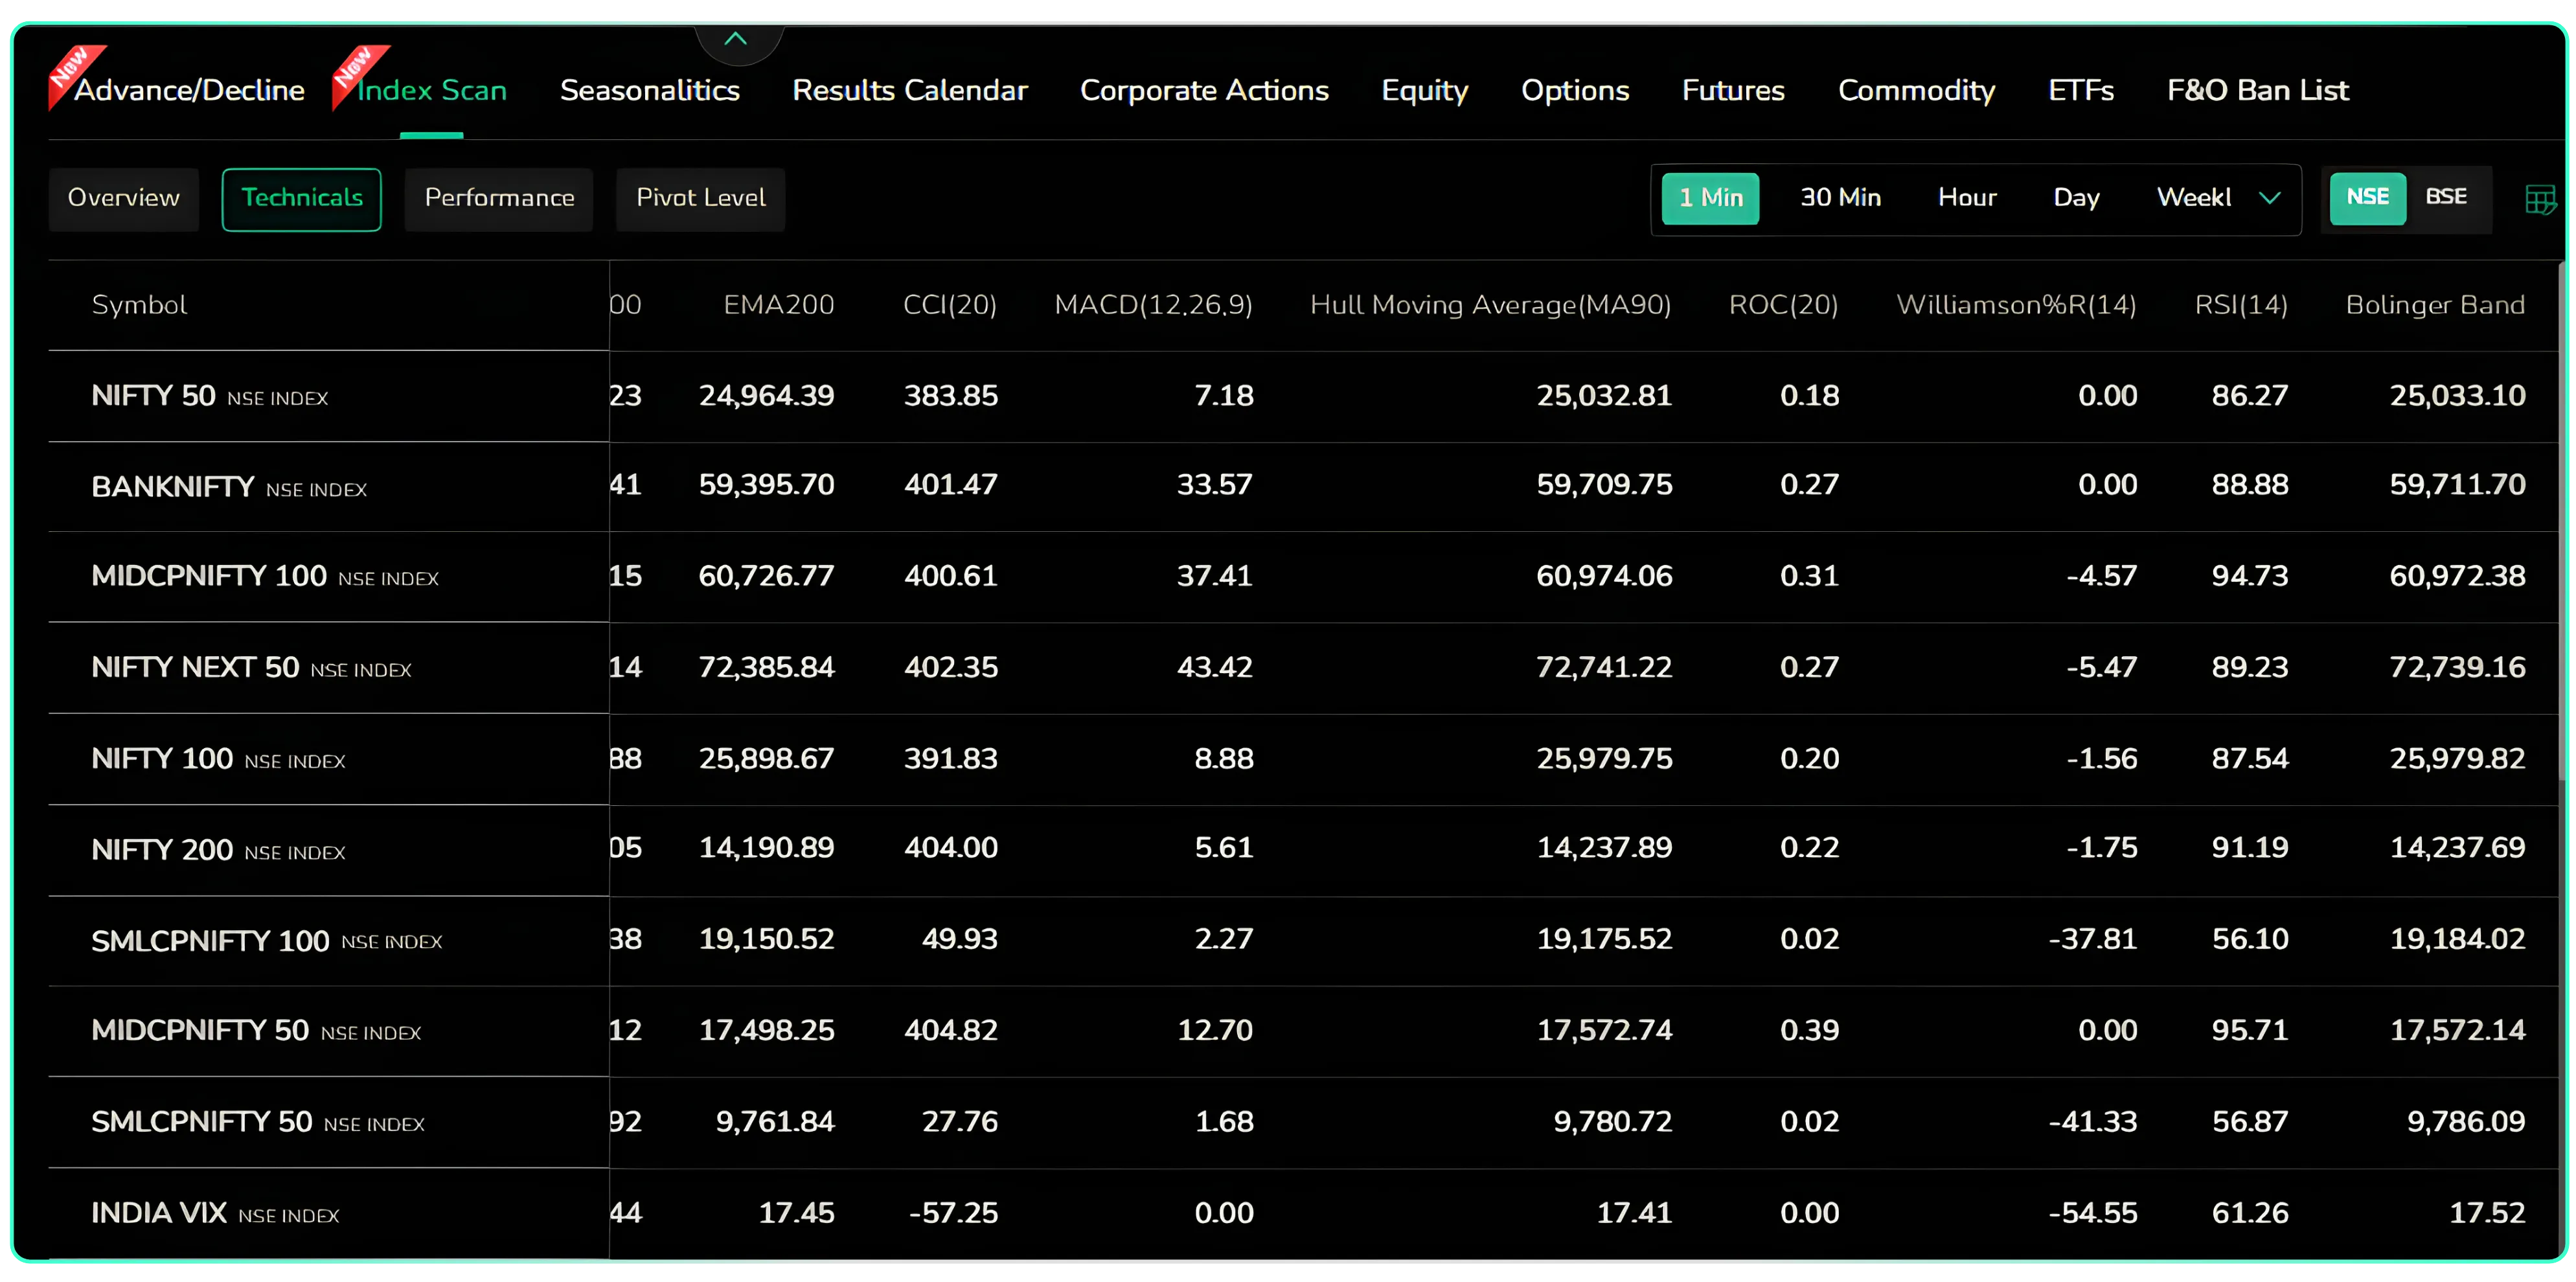
Technicals tab on the Day timeframe
Performance Tab: Returns Across Every Time Period
The Performance tab shows how each index has performed over multiple periods: 1W, 2W, 1M, 3M, 6M, YTD, 1Y, 3Y and 5Y, along with LTP and today's Change. Green values are gains and red values are losses.
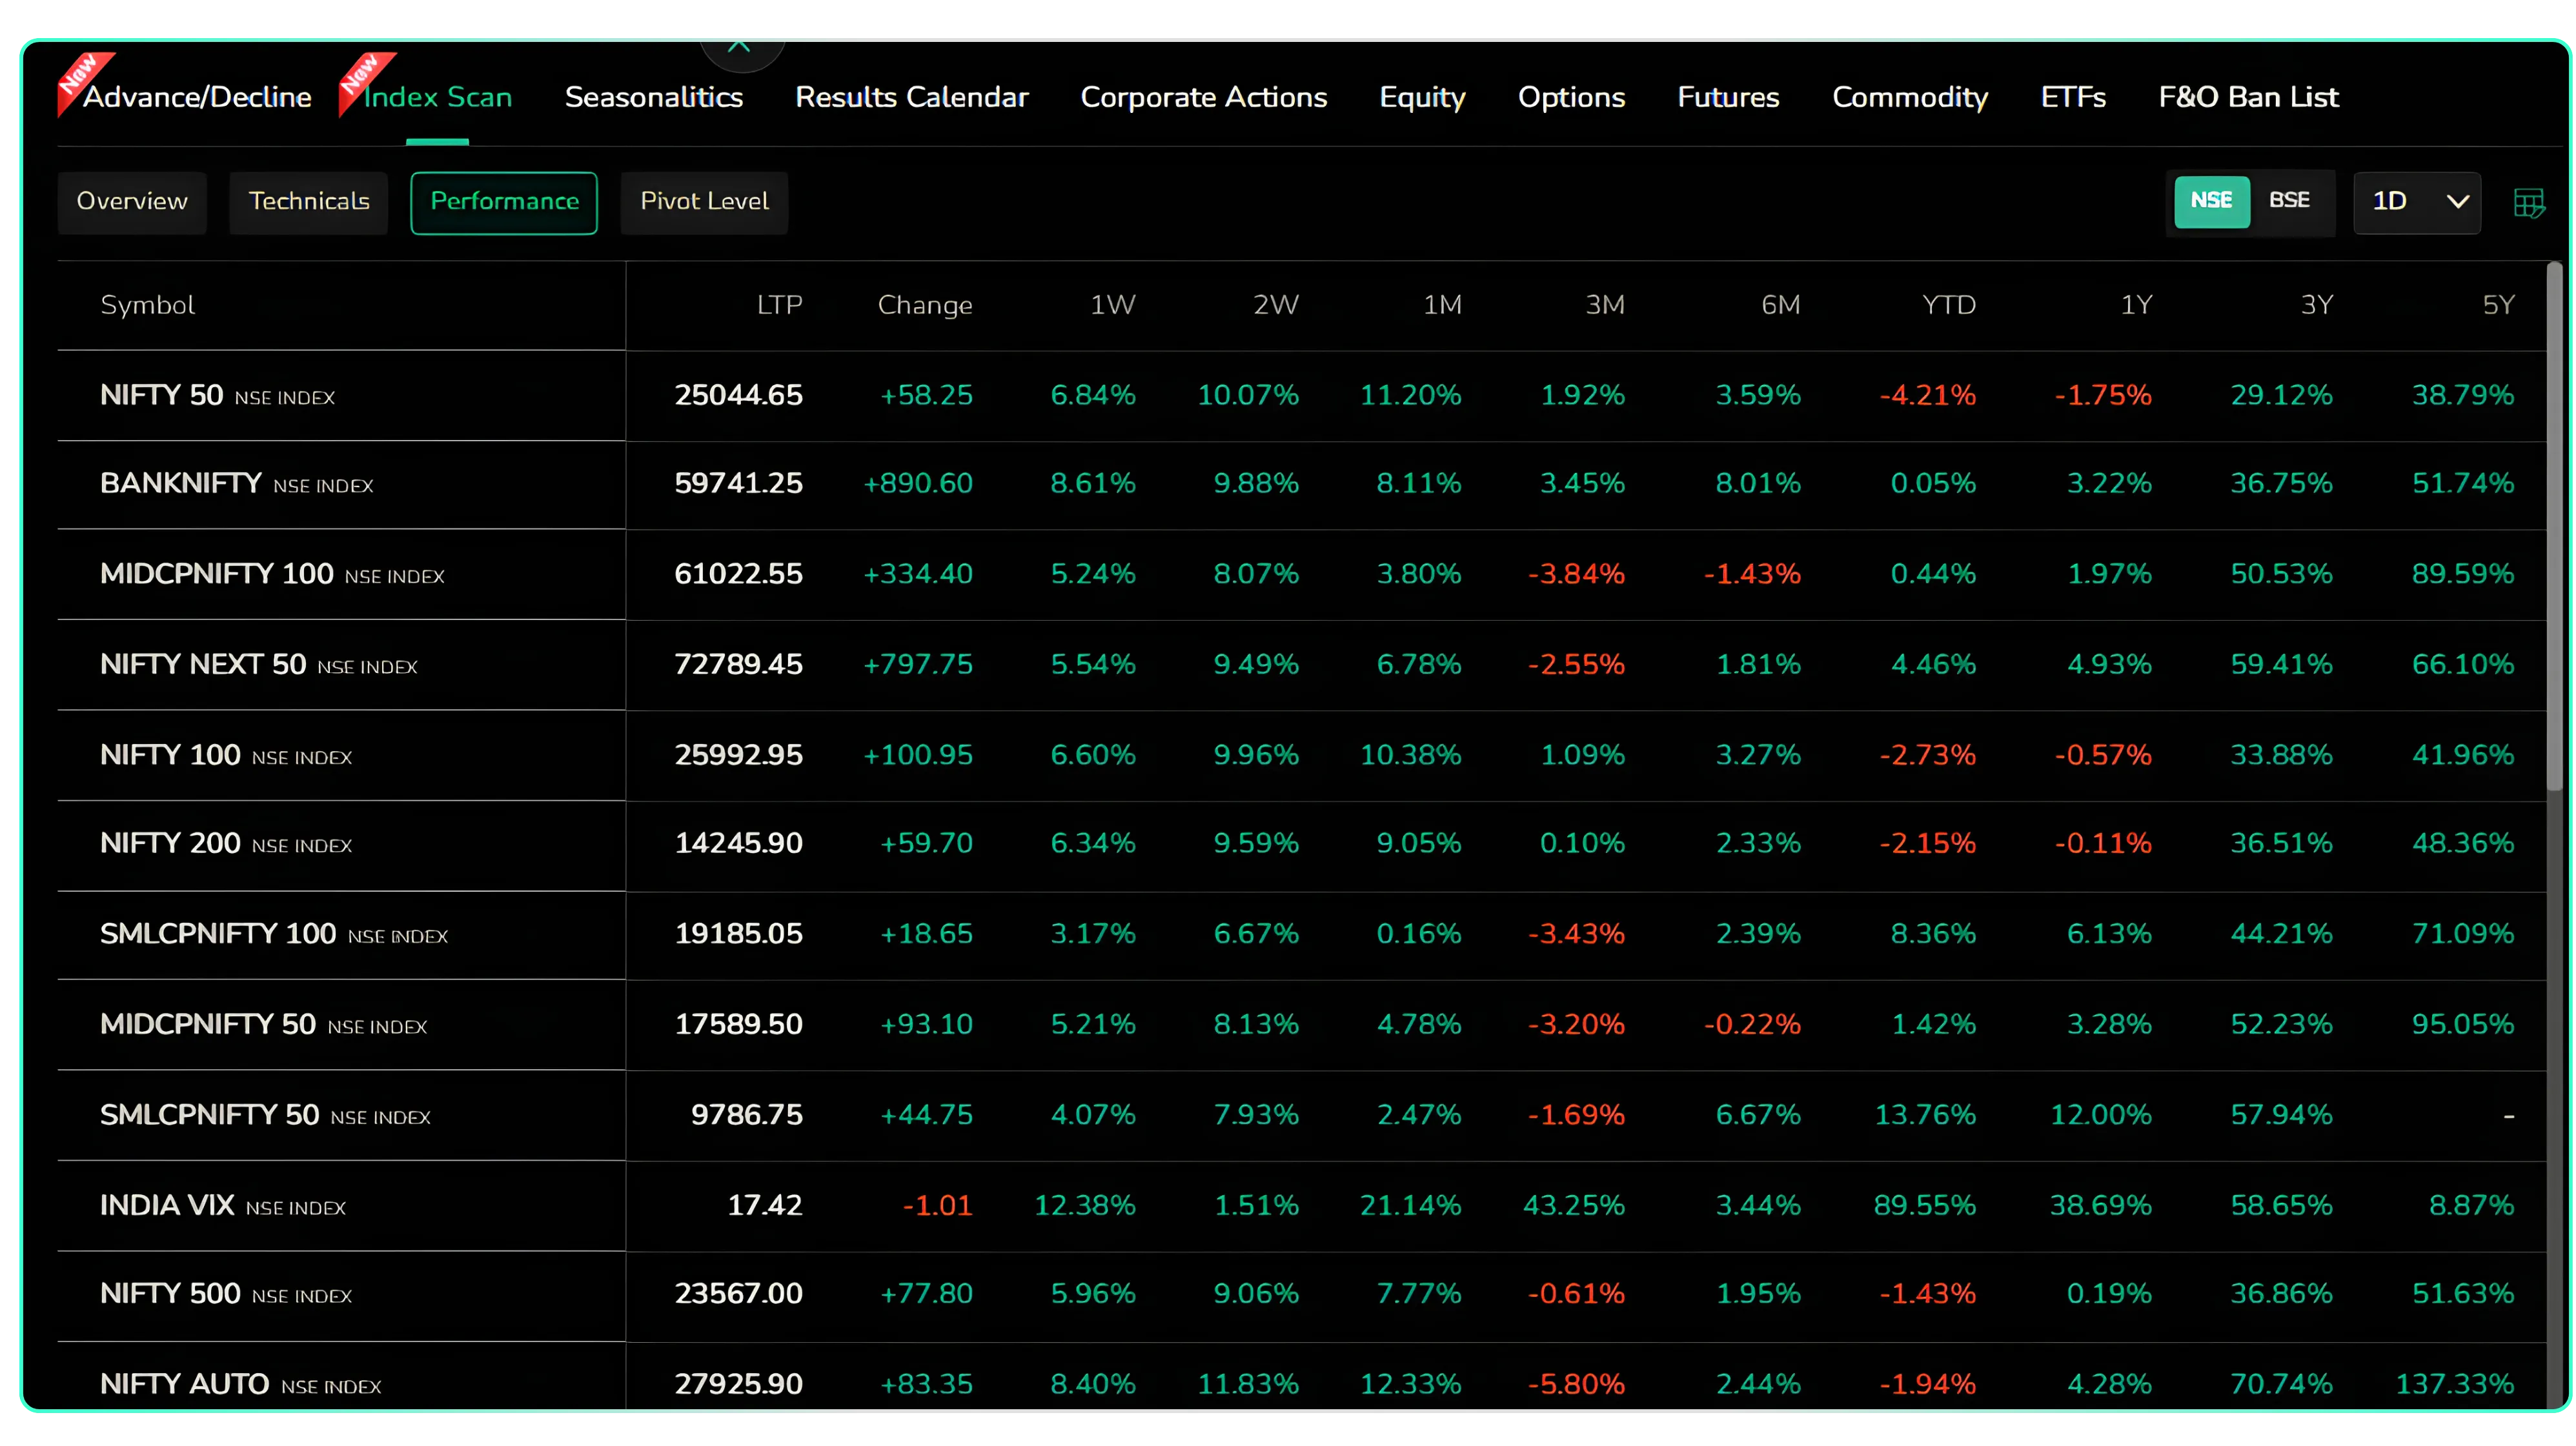 Performance tab with returns from 1 week to 5 years
How traders can use the Performance tab
- Separate short-term bounces from long-term trends. In the example, NIFTY 50 is up 6.84% over 1 week and 11.20% over 1 month, but still down 4.21% YTD. A recent rally inside a weaker year is a different setup from a steady uptrend.
- Find sector leaders and laggards. NIFTY PHARMA shows 27.67% YTD while NIFTY IT shows -14.93% YTD. Traders who prefer to trade with strength can focus on leading sectors, while contrarians can watch laggards for reversals.
- Plan longer-term allocation. The 3Y and 5Y columns help investors see which segments have compounded the most, which is useful when choosing index funds or ETFs.
Pivot Level Tab: Support and Resistance for Every Index
The Pivot Level tab calculates pivot points with three resistance levels (R1, R2, R3) and three support levels (S1, S2, S3) for every index. You can choose between three calculation methods using the buttons at the top: Standard, Fibonacci and Camarilla.
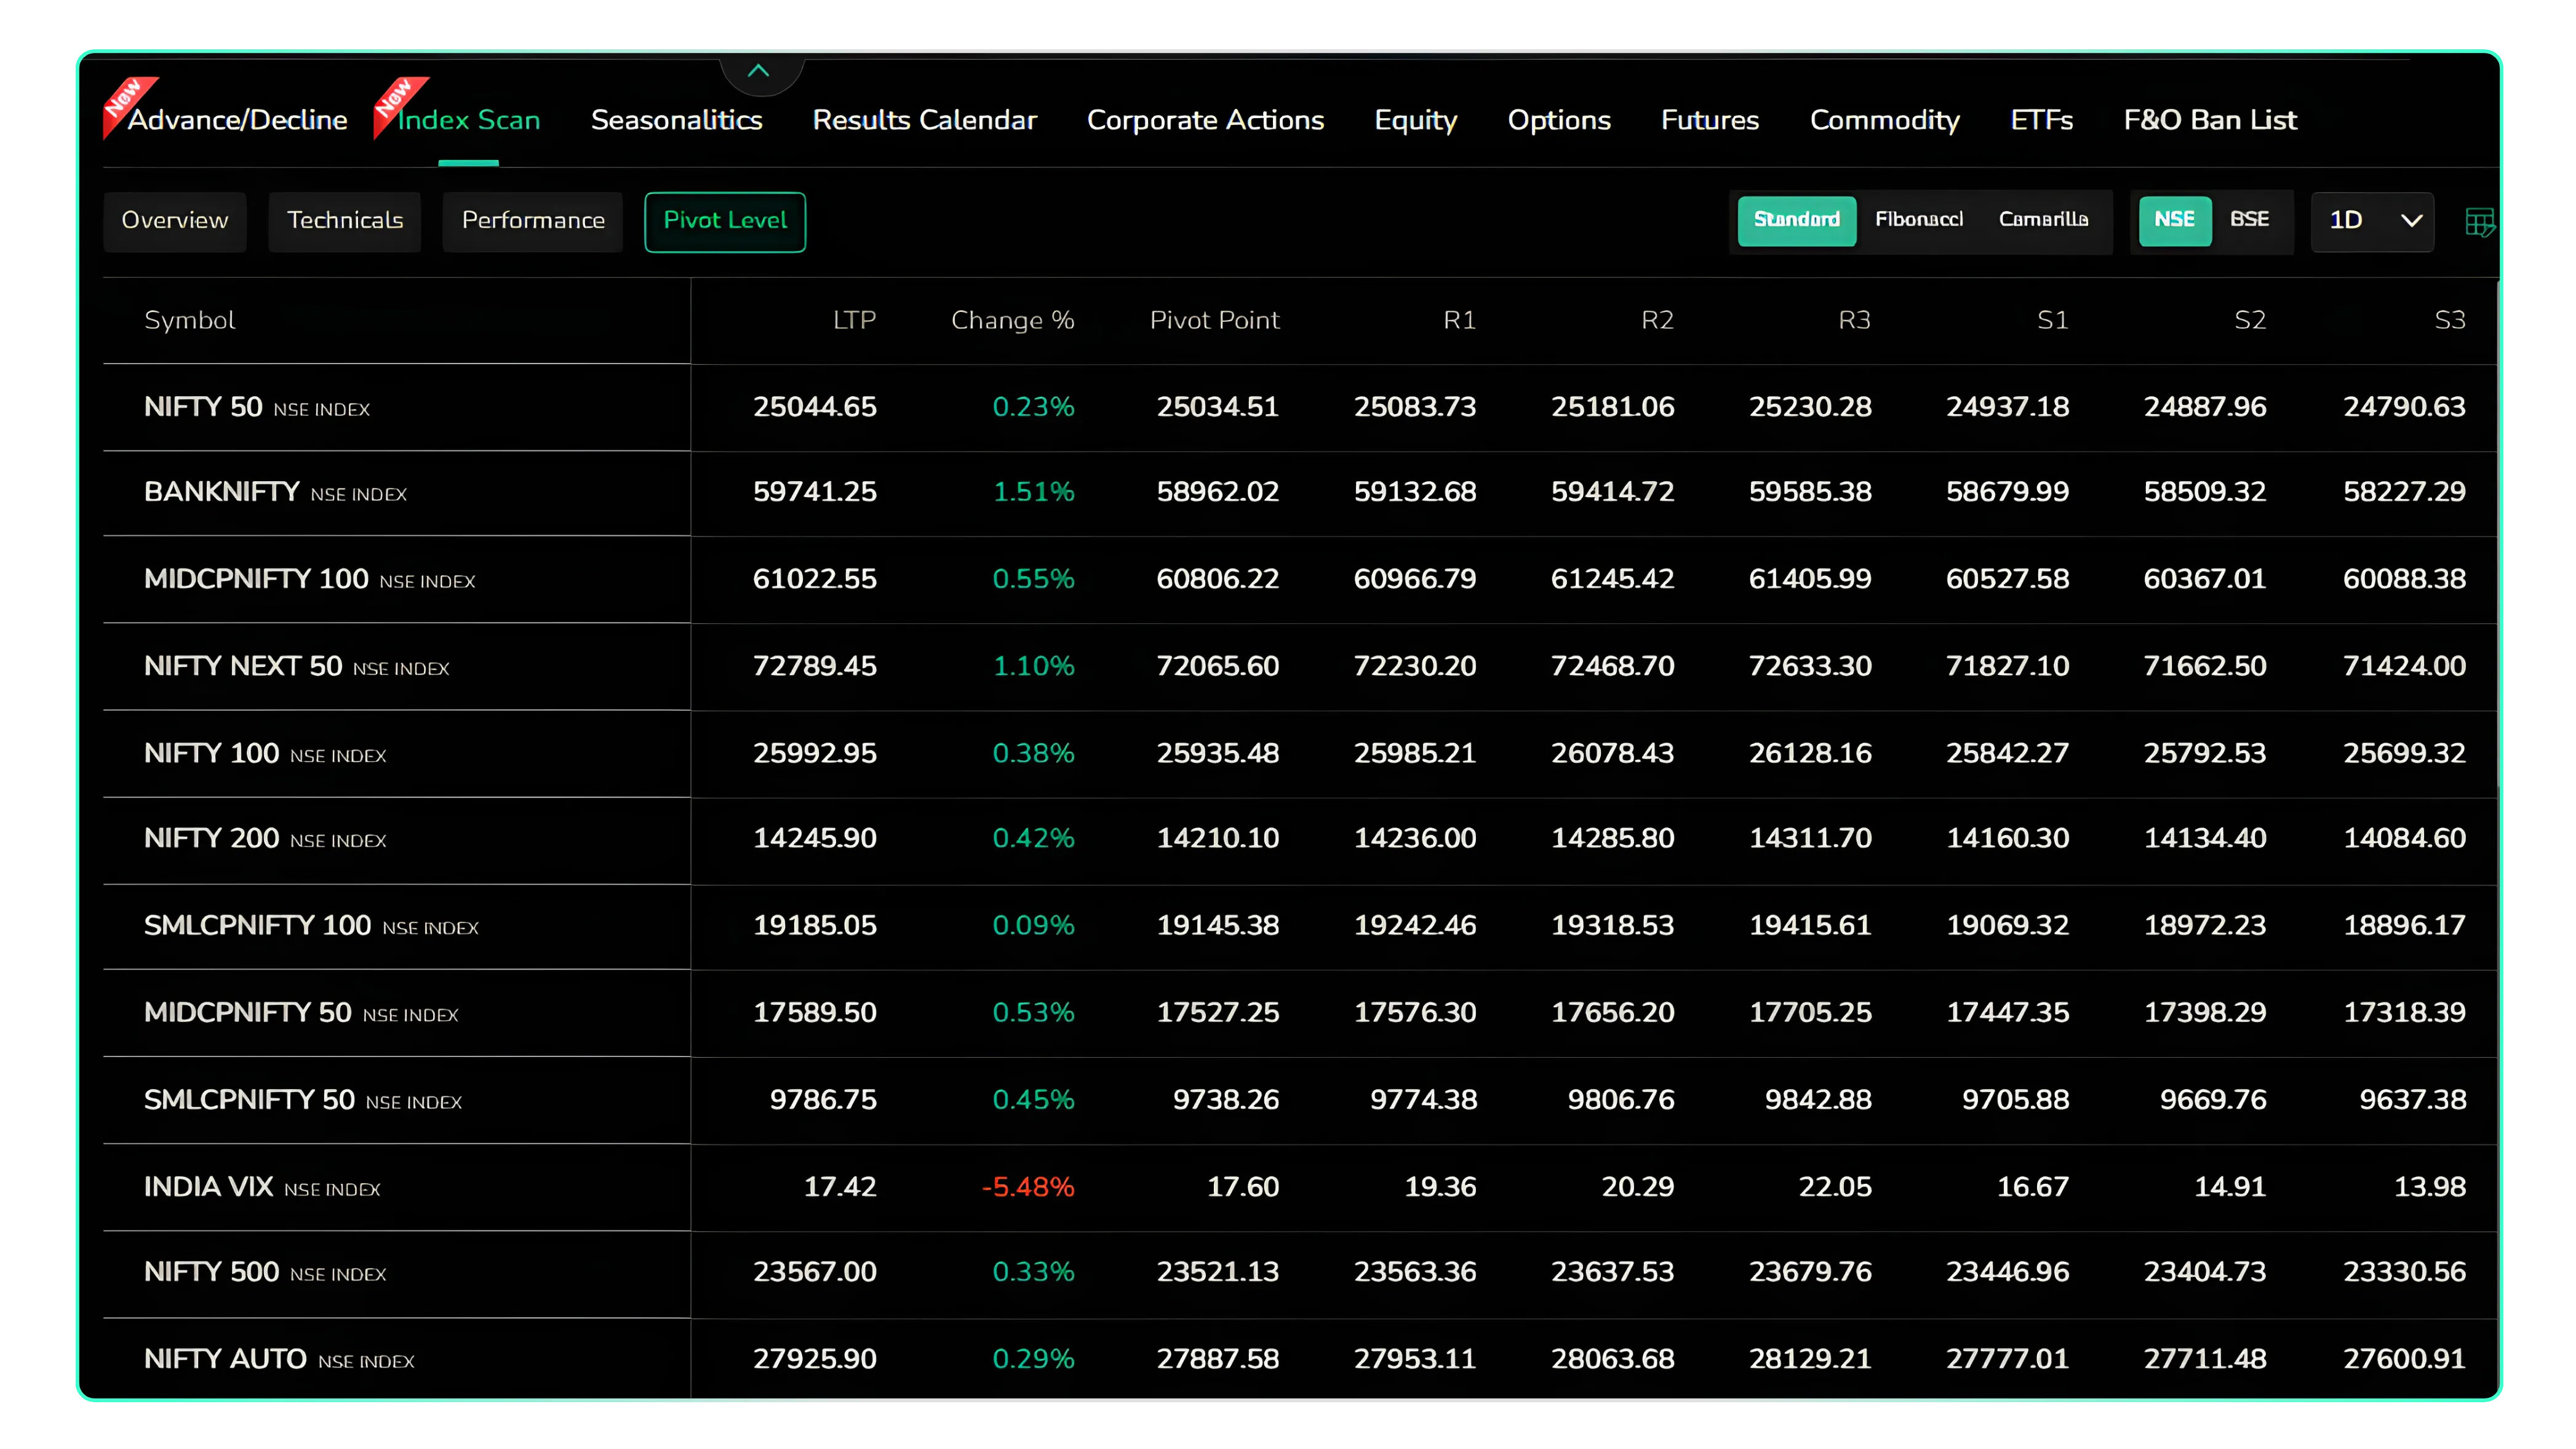
Pivot Level tab using the Standard method
| Field | Meaning |
|---|---|
| Pivot Point | The central reference level, based on the previous period's high, low and close |
| R1, R2, R3 | Resistance levels above the pivot, where selling pressure may appear |
| S1, S2, S3 | Support levels below the pivot, where buying interest may appear |
In the example, NIFTY 50 has a pivot of 25,034.51 with R1 at 25,083.73 and S1 at 24,937.18. With the LTP at 25,044.65, the index is trading just above its pivot, a mildly bullish position with R1 as the next level to watch.
Choosing the method and the period
Standard: the classic pivot calculation, widely used and a good default. Fibonacci: places support and resistance at Fibonacci ratios of the previous range. Camarilla: produces tighter levels close to the current price, popular with intraday traders looking for quick reversal or breakout zones.
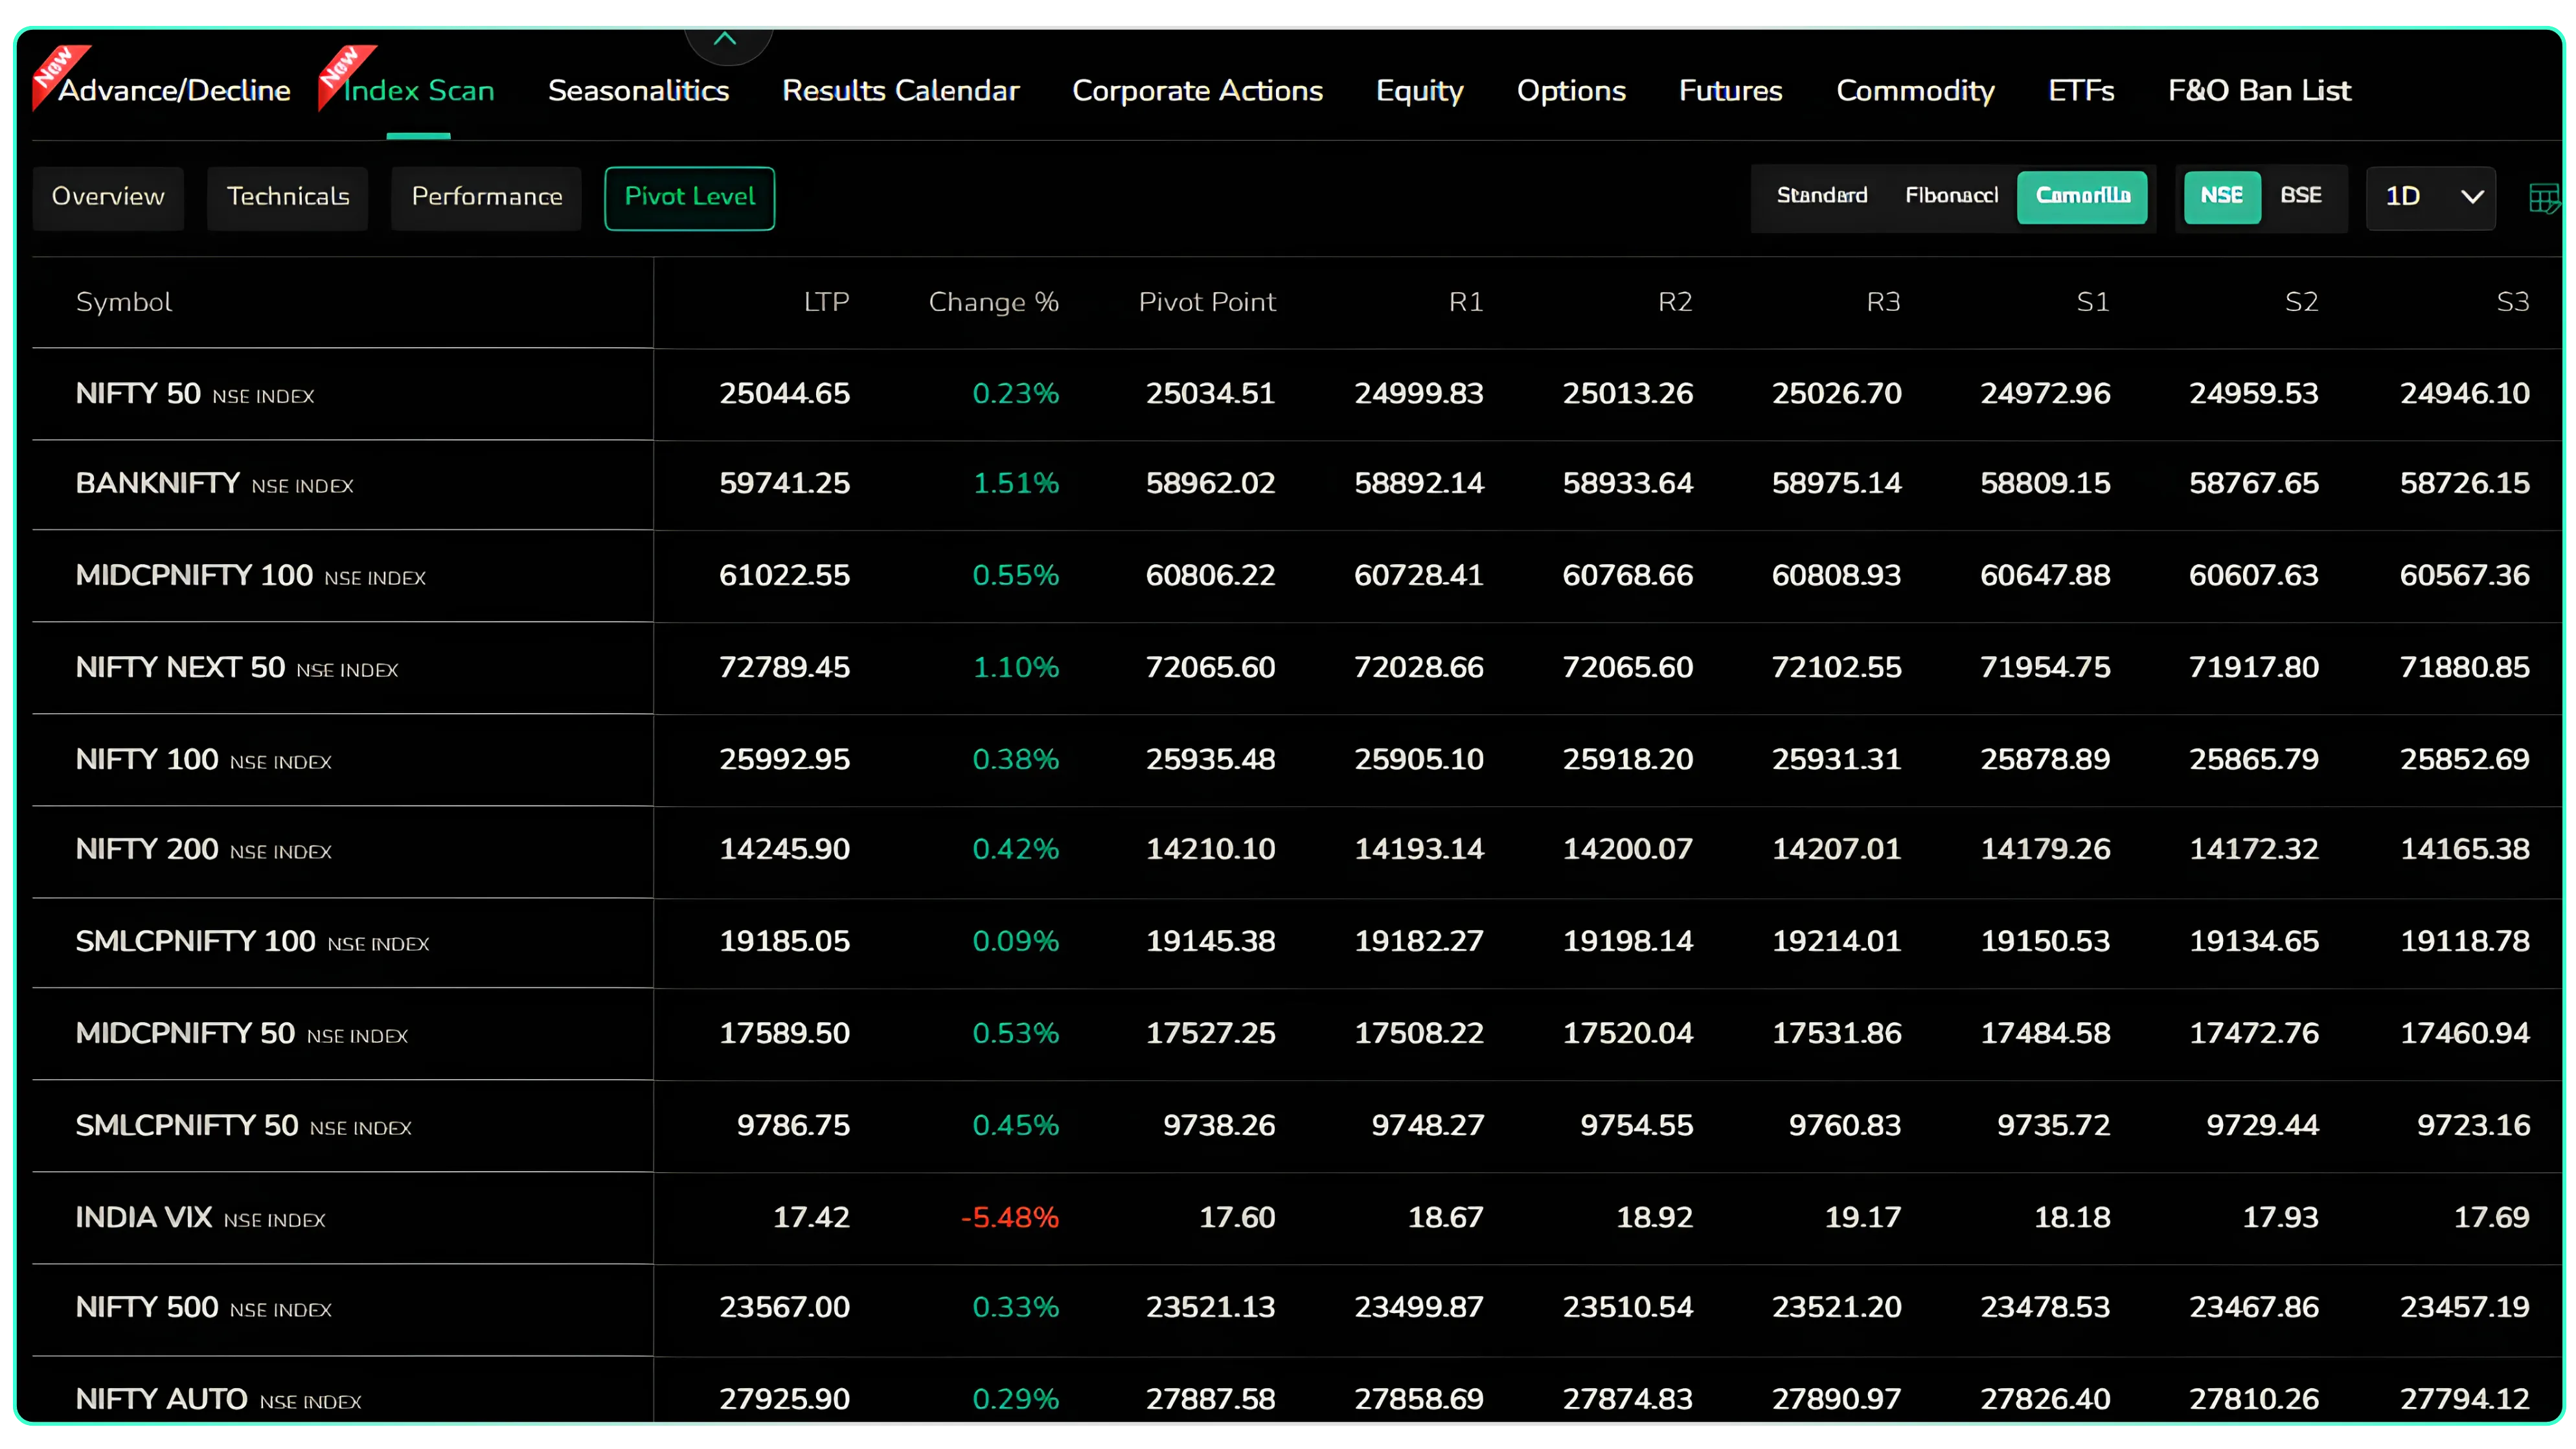
Pivot Level tab using the Camarilla method
The period dropdown lets you base the pivots on 1D, 1W, 2W, 1M, 3M, 6M, YTD, 1Y, 3Y or 5Y data. Daily pivots suit intraday traders, weekly and monthly pivots suit swing traders, and the longer periods give positional traders major support and resistance zones.
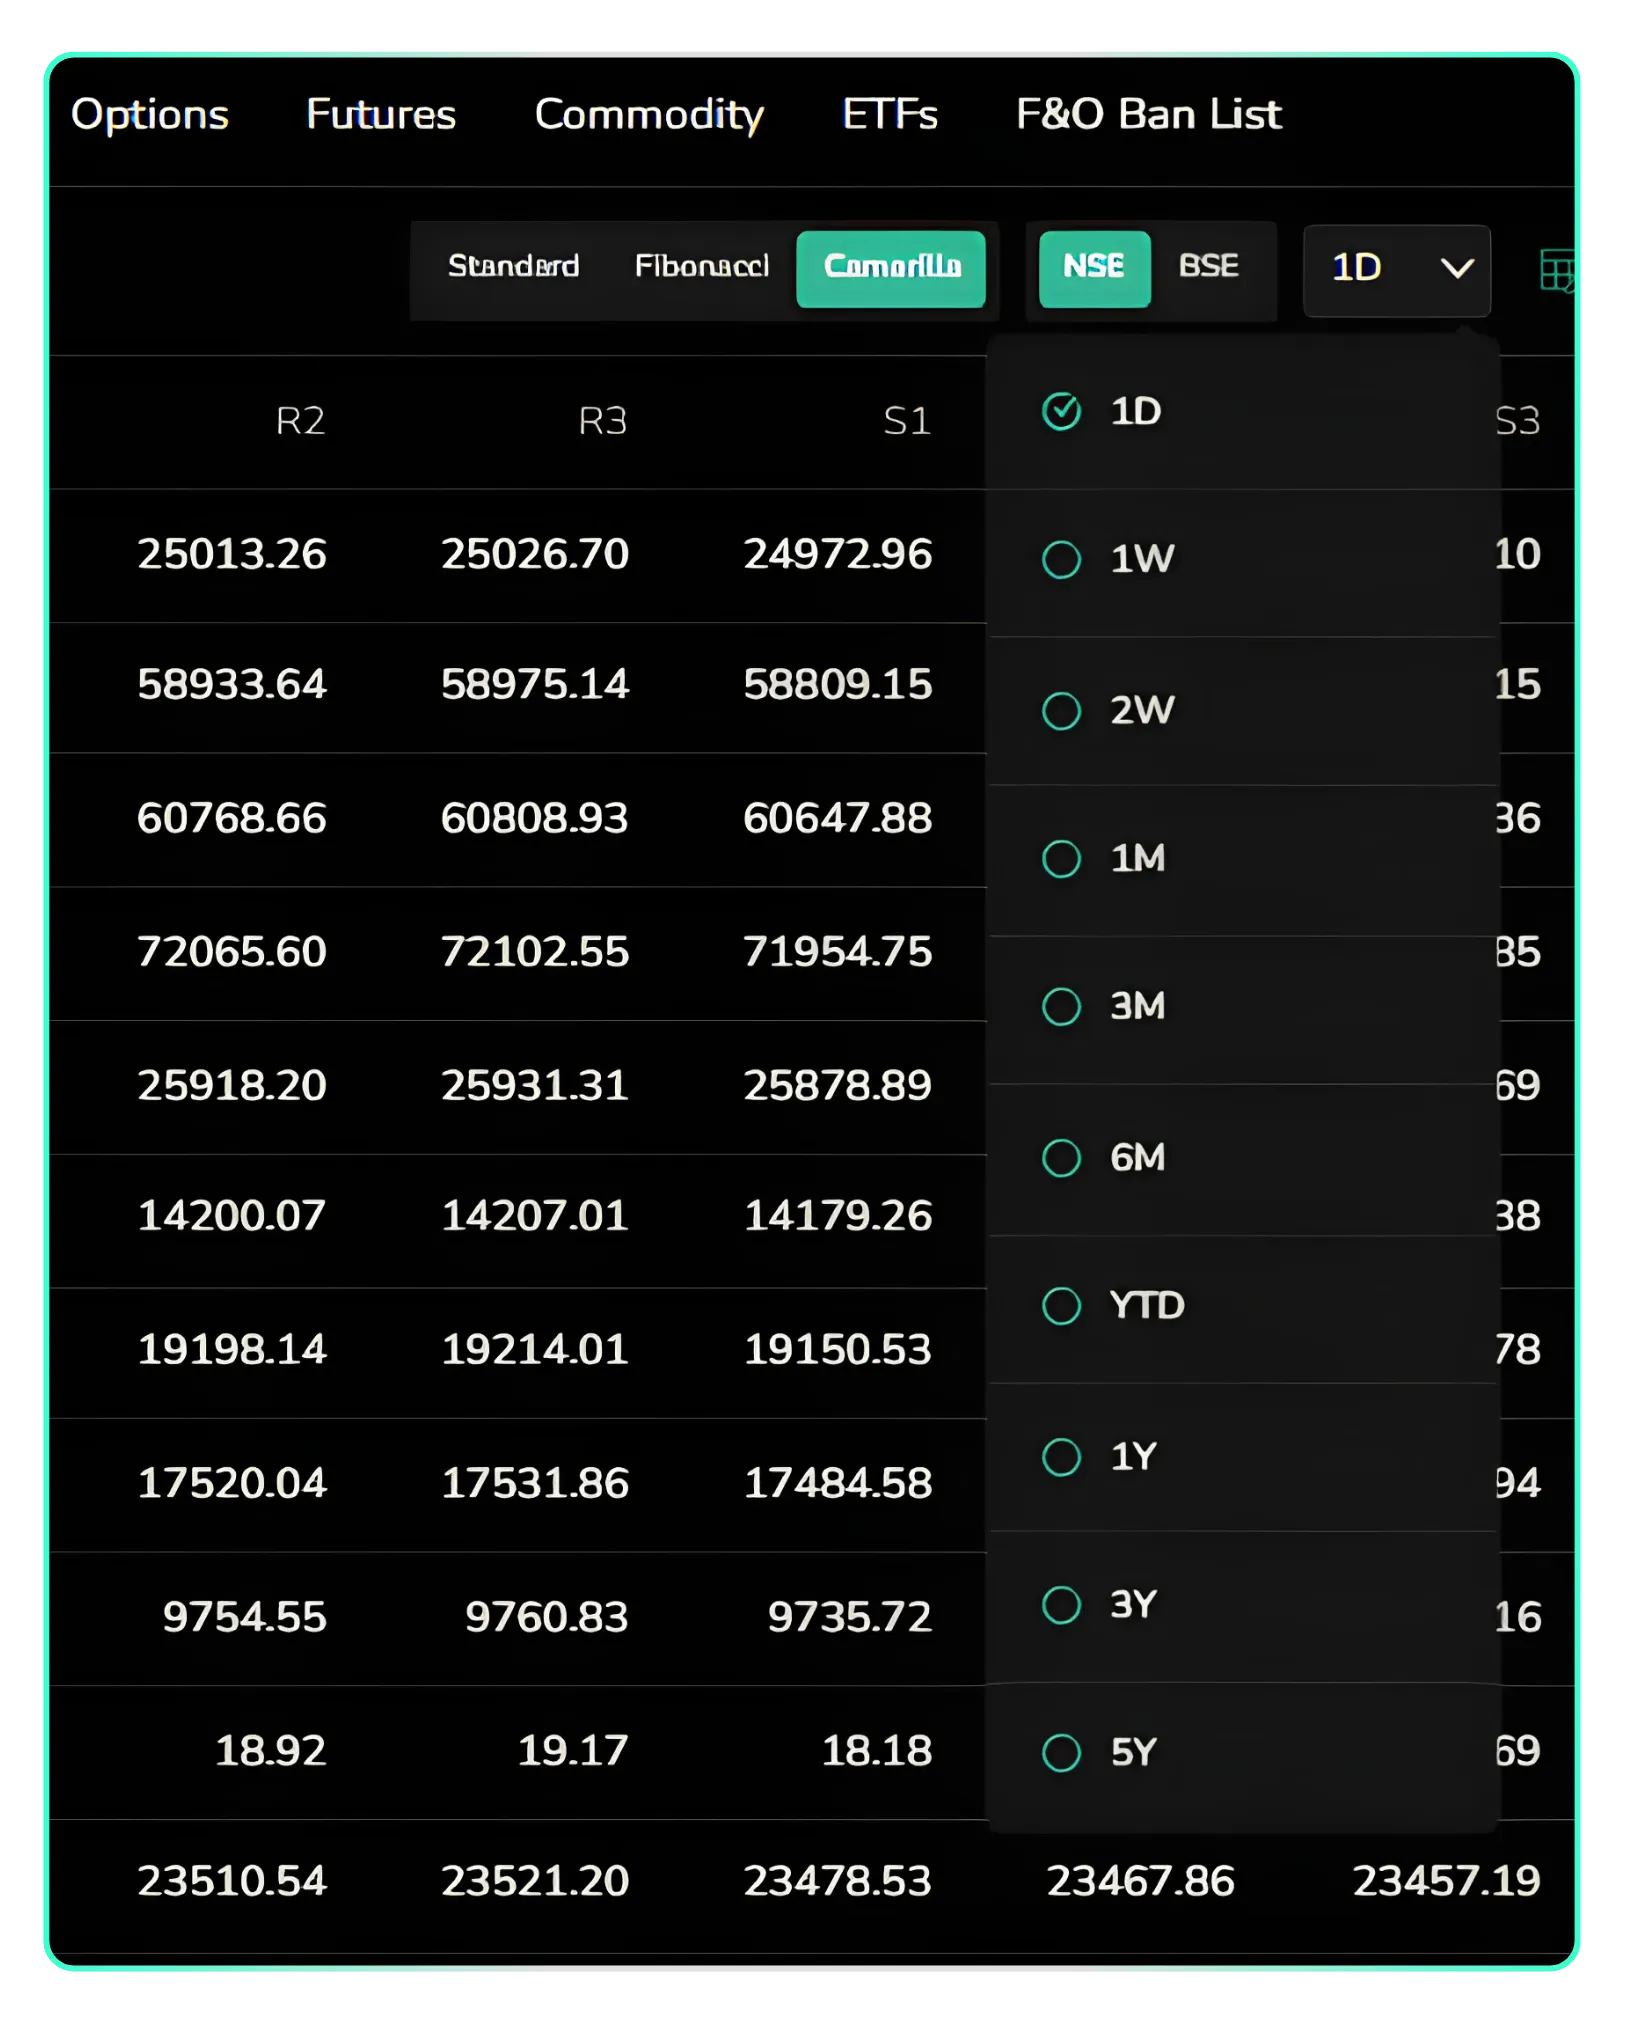
Period selector with options from 1D to 5Y
How traders can use the Pivot Level tab
- Set entry, stop loss and target levels before the market opens. For example, a long trade near S1 can use S2 as a stop loss and the pivot or R1 as a target.
- Confirm breakouts. A sustained move above R1 or R2 with sector strength from the Overview tab is a stronger signal than a breakout on its own.
- Trade index options with context. Pivot levels on NIFTY 50, BANKNIFTY, FINNIFTY and MIDCPNIFTY can help you pick strikes near key support or resistance.
Customising Columns
Every tab has a column settings icon at the top right. Clicking it opens Customize your columns, where you can tick or untick each field and drag them into the order you prefer. Click Apply to save, or Reset to default to go back to the original layout. This is handy if, for example, you only want RSI, MACD and SMA200 on the Technicals tab, or only R1 and S1 on the Pivot Level tab.
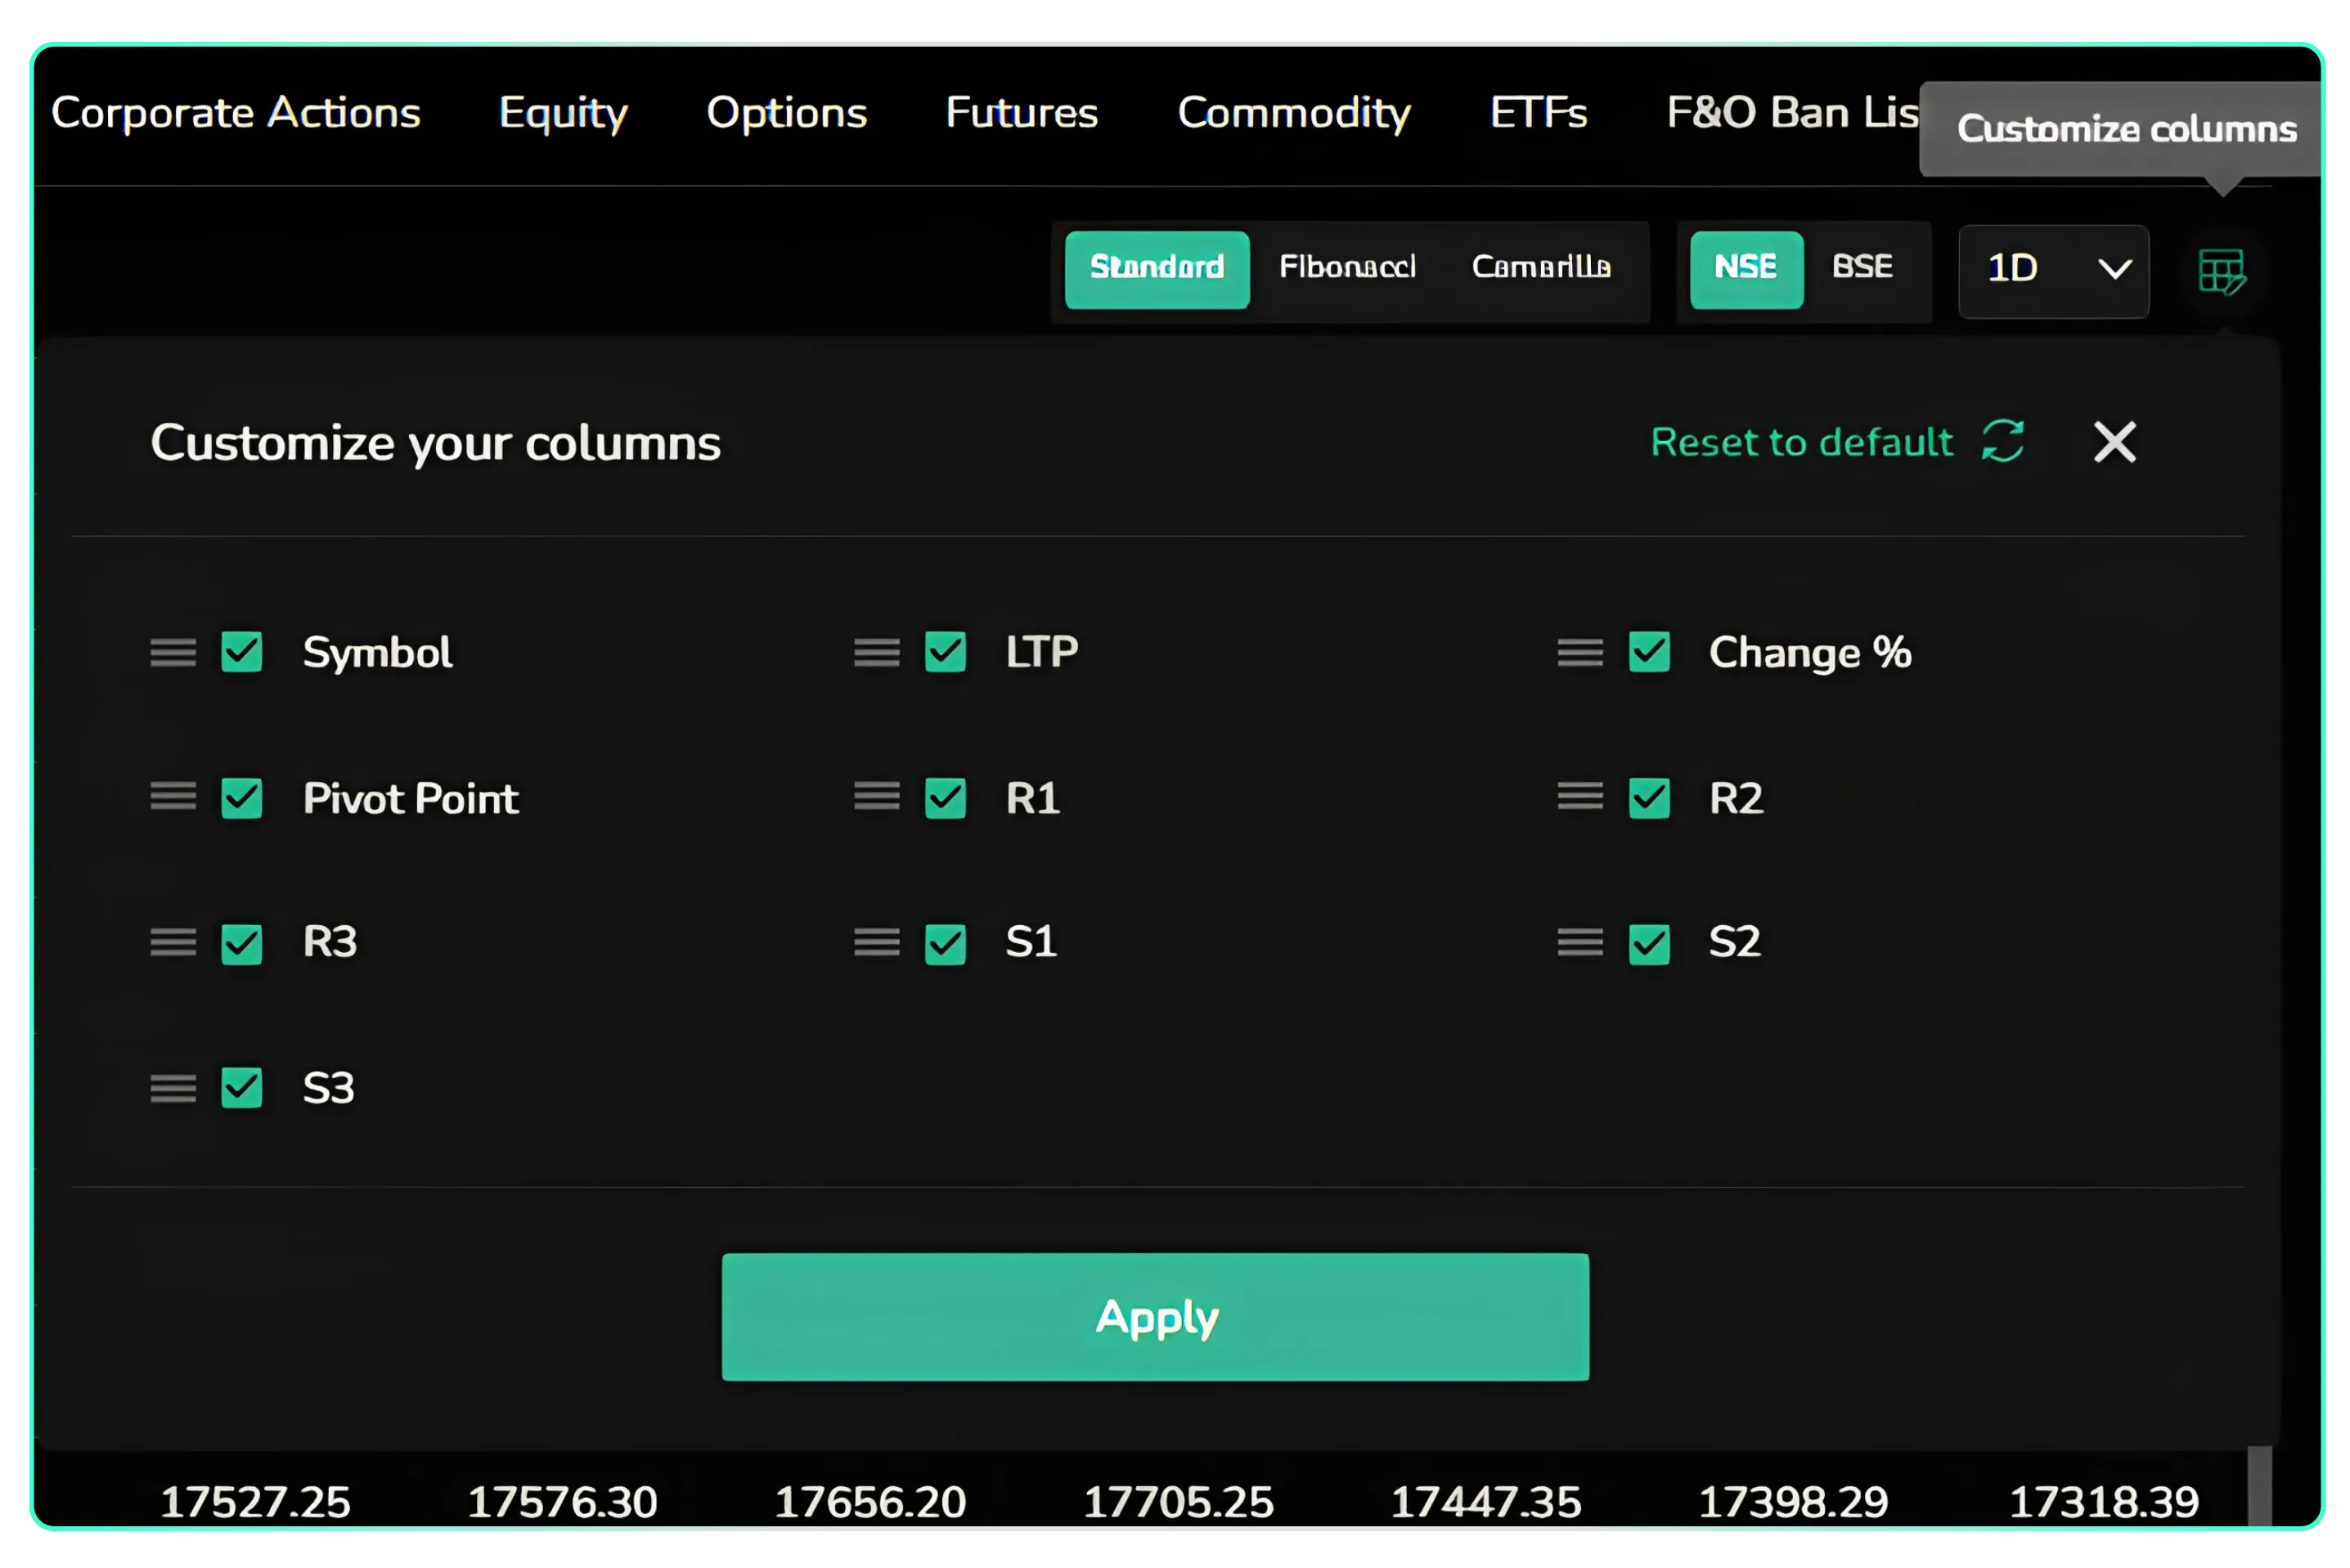
Customize your columns panel
A Simple Index Scan Routine for Traders
- Before the open: check the Pivot Level tab on 1D to note the pivot, R1 and S1 for the indices you trade.
- In the first 15 minutes: use the Overview tab to see which sectors are leading and lagging, and check INDIA VIX.
- During the session: switch to Technicals on 30 Min or Hour to confirm whether the move has trend and momentum behind it.
- End of day or weekend: use the Performance tab to review which sectors are gaining strength over 1W and 1M.
- From any row: open the Chart or add the index to your Marketwatch to keep tracking it.
One Screen, the Whole Market
Index Scan turns what used to be a dozen separate charts into one sortable table. The Overview tab tells you what is moving, the Technicals tab tells you whether the move has strength, the Performance tab puts it in context across time, and the Pivot Level tab gives you the levels to plan your trade around. Used together, they help you trade with the market's direction instead of guessing it.
Disclaimer: The information provided in our blogs is for informational purposes only and should not be construed as financial, investment, or trading advice. Trading and investing in the securities market carries risk. Always conduct your own research and consult with a qualified financial advisor before making any investment decisions. Past performance is not indicative of future results. Copyrighted and original content for your trading and investing needs.
© 2026 — Tradejini. All Rights Reserved.