Options traders often track Open Interest (OI), Put-Call Ratio (PCR), Max Pain and OI Walls to understand market positioning. Another useful metric is Gamma Exposure (GEX).
Gamma Exposure helps traders understand how option positions are distributed across different strike prices and how these positions may influence market movements.
Tradejini NxtOption provides a dedicated Gamma Exposure chart under its Analyze section. Traders can use this chart to identify important price levels, understand potential support and resistance zones, and monitor the Gamma Flip level.
Let's understand how to use this feature.
1. What is Gamma Exposure?
Before understanding Gamma Exposure, it is useful to know what Gamma means.
Gamma measures how much an option's Delta changes when the underlying asset moves by one point.
For example, if an option has a Delta of 0.40 and its Gamma is 0.05, a one-point increase in the underlying price may increase its Delta to approximately 0.45, assuming other factors remain unchanged.
Gamma Exposure (GEX) aggregates the estimated gamma sensitivity of option positions across different strike prices.It helps traders understand where significant gamma concentrations exist and how changes in the underlying price could affect hedging activity.
One important point: GEX is an estimate based on option positions and assumptions about market participants' positioning. It does not directly reveal the actual positions of individual market makers.
2. Understanding the Gamma Exposure Chart
The Gamma Exposure chart in Tradejini NxtOption displays gamma exposure across different strike prices.
The chart generally contains two important elements:
- Bars: Represent the estimated Gamma Exposure at different strike prices.
- Blue Line: Represents the distribution of gamma exposure across strike prices.
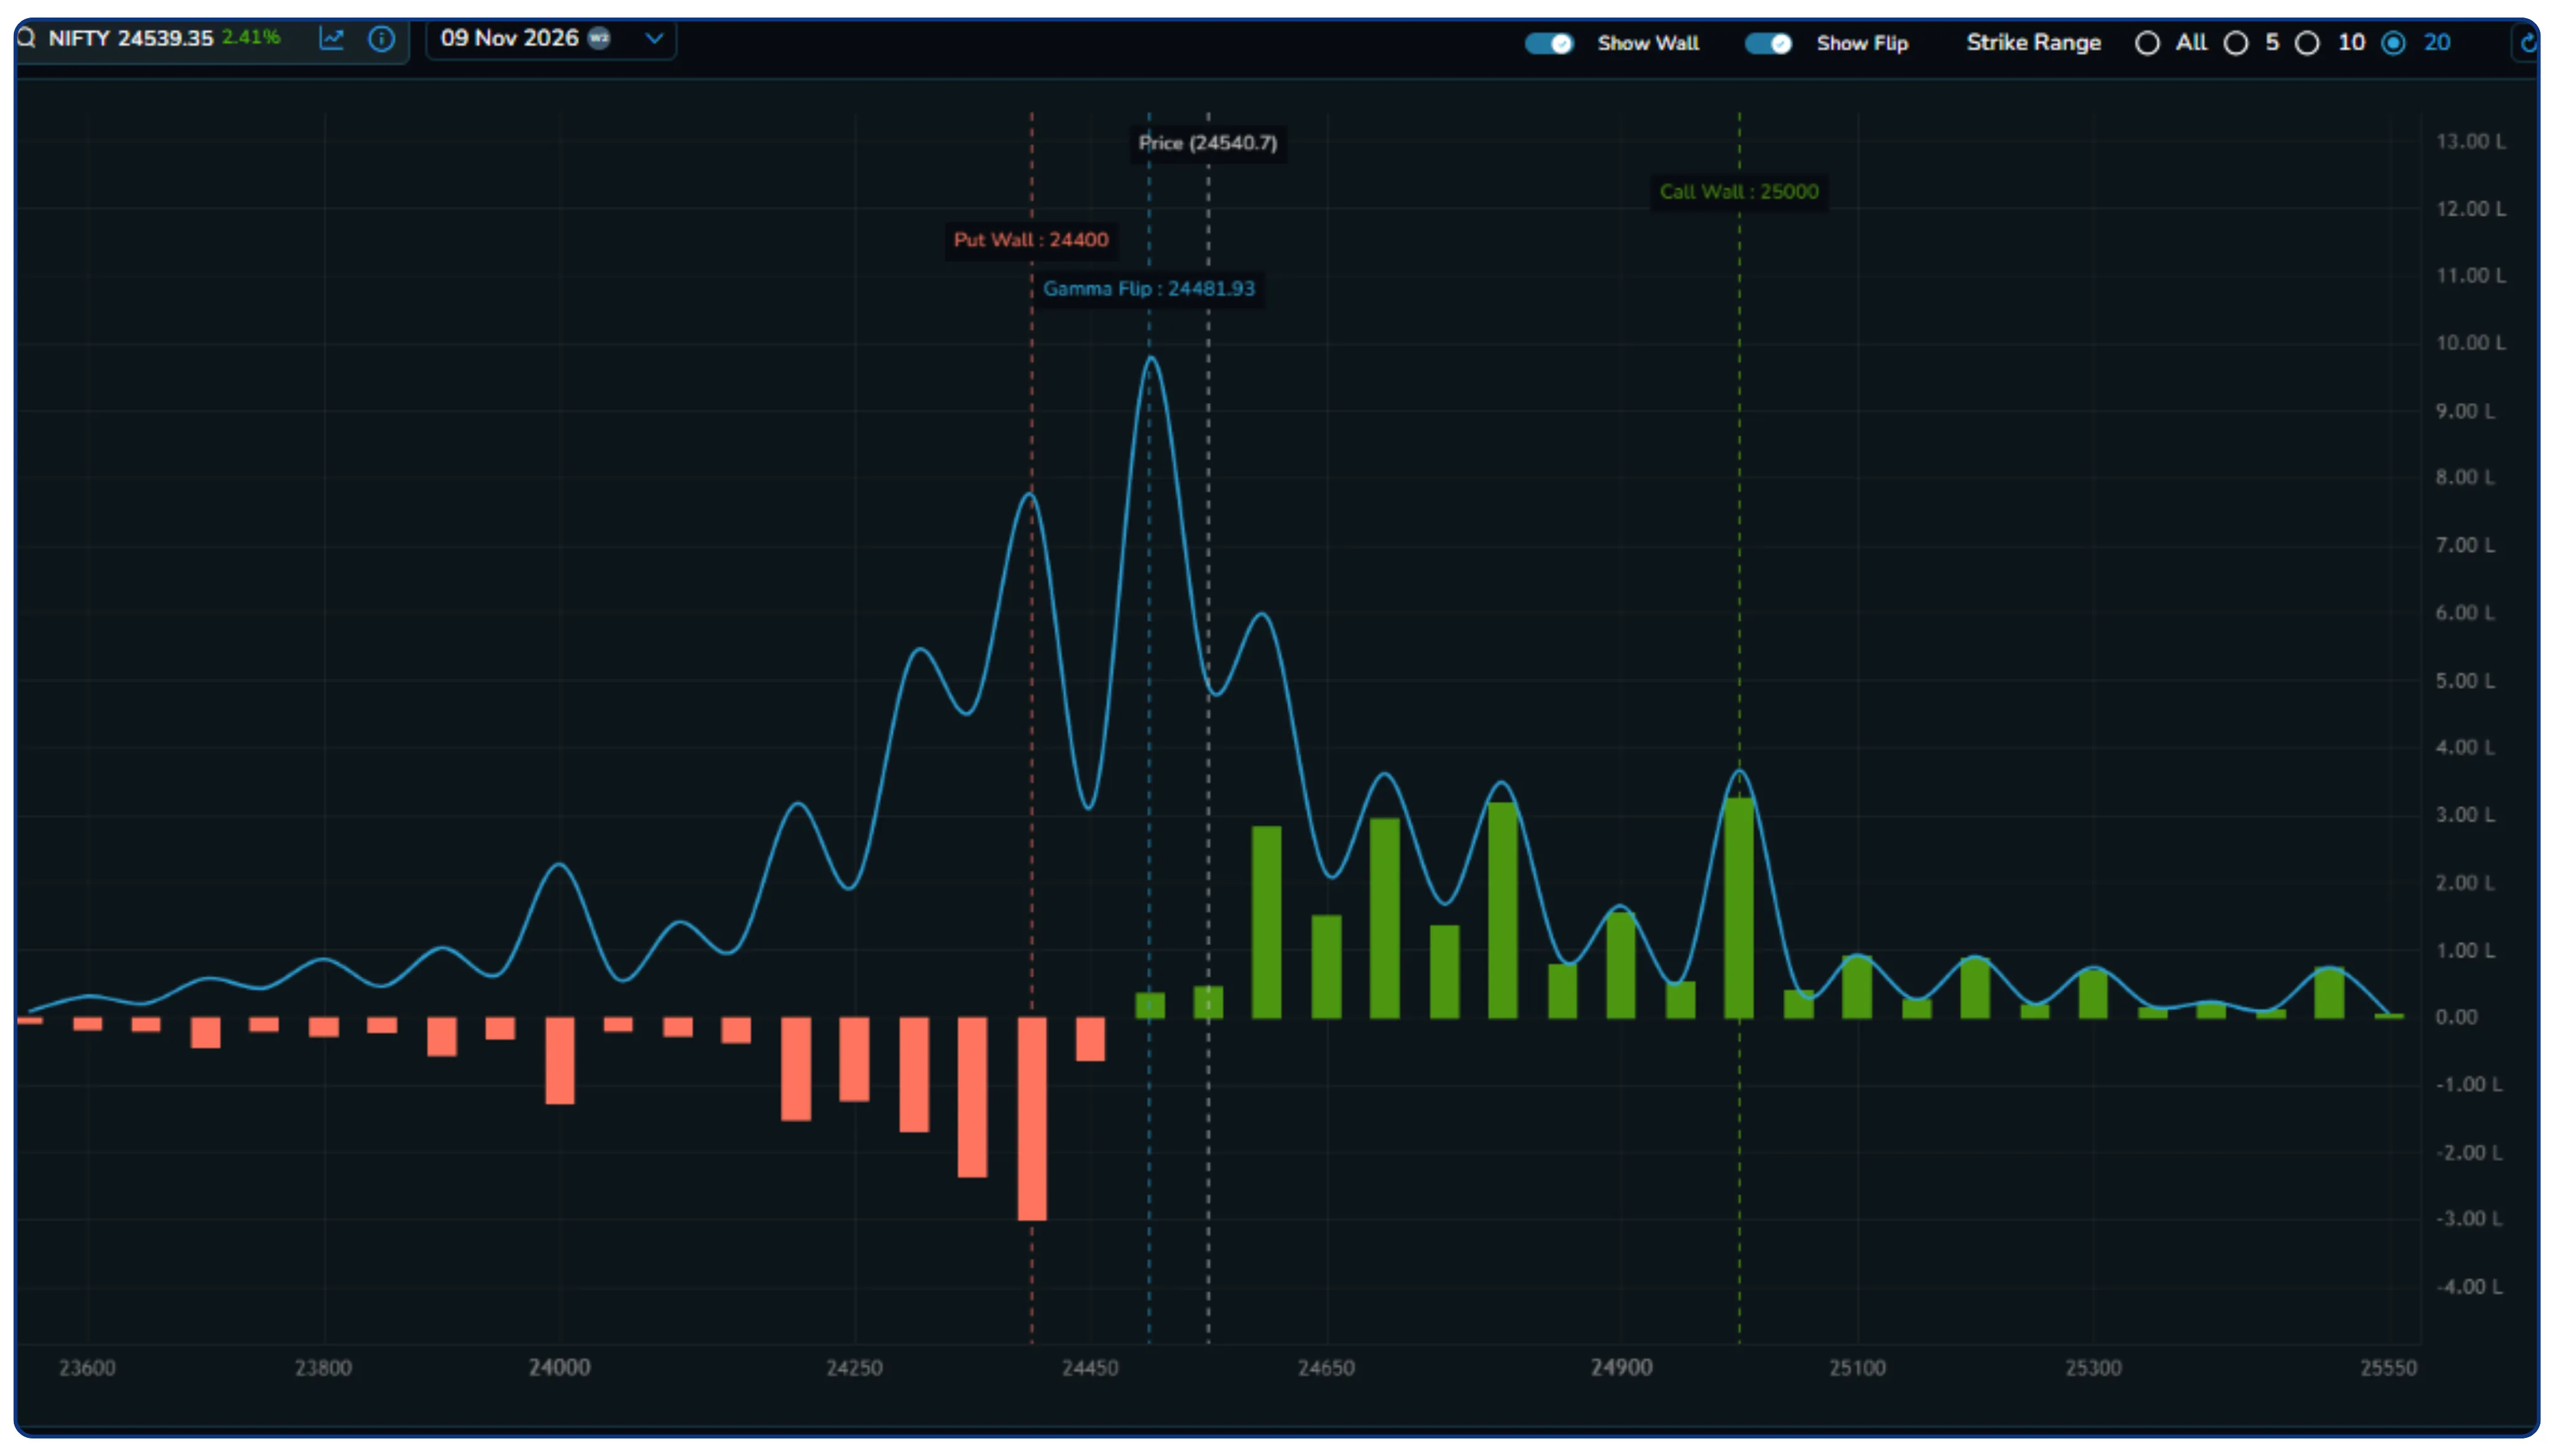
The bars are displayed in two colours:
- Green bars: Positive Gamma Exposure.
- Red bars: Negative Gamma Exposure.
The chart also identifies important levels such as Put Wall, Call Wall and Gamma Flip.
Understanding these levels can help traders build a broader view of the market.
3. How to Interpret Positive and Negative Gamma Exposure
Positive Gamma Exposure
When market positioning indicates positive gamma, dealer hedging activity may help reduce price fluctuations.
For example, if the market moves higher, dealers may need to sell the underlying asset to maintain their hedge. If the market moves lower, they may need to buy.
This activity can potentially reduce market volatility and encourage price movements to remain within a range.
Negative Gamma Exposure
In a negative gamma environment, dealer hedging can potentially amplify price movements.
For example, when the market moves higher, dealers may need to buy more of the underlying asset. When the market falls, they may need to sell.
This can add to the existing price movement and increase volatility.These are general dealer-hedging mechanisms. Actual behaviour depends on the positioning, hedging practices and methodology used to calculate GEX.
4. What is Gamma Flip?
Gamma Flip is an important reference level on the Gamma Exposure chart.
It represents the estimated price at which aggregate Gamma Exposure changes from negative to positive, or vice versa.
Traders use this level to understand the prevailing gamma environment.
- Above Gamma Flip: The market may be in a positive gamma environment, potentially supporting more range-bound price behaviour.
- Below Gamma Flip: The market may be in a negative gamma environment, potentially allowing larger price movements.
The interpretation depends on the sign convention and calculation methodology used by the platform.
Gamma Flip should not be treated as a guaranteed support or resistance level. It is better used as a reference point alongside price action.
5. What are Put Wall and Call Wall?
Two other important reference levels are Put Wall and Call Wall.
Put Wall
Put Wall represents a strike with a significant concentration of put-related positioning or gamma exposure, depending on the platform's calculation.Traders often monitor this level as a potential support zone.If the market approaches the Put Wall, observe whether buyers are entering and whether the price is holding around that zone.
Call Wall
Call Wall represents a strike with a significant concentration of call-related positioning or gamma exposure.It is often monitored as a potential resistance zone.If the market approaches the Call Wall, traders can observe whether selling pressure emerges or whether the market manages to move above it.
Neither level guarantees that the market will reverse. A strong directional move can take the market beyond these levels.
6. Analysing the Gamma Exposure Chart in Tradejini NxtOption
Let's look at an example from the Tradejini NxtOption platform.
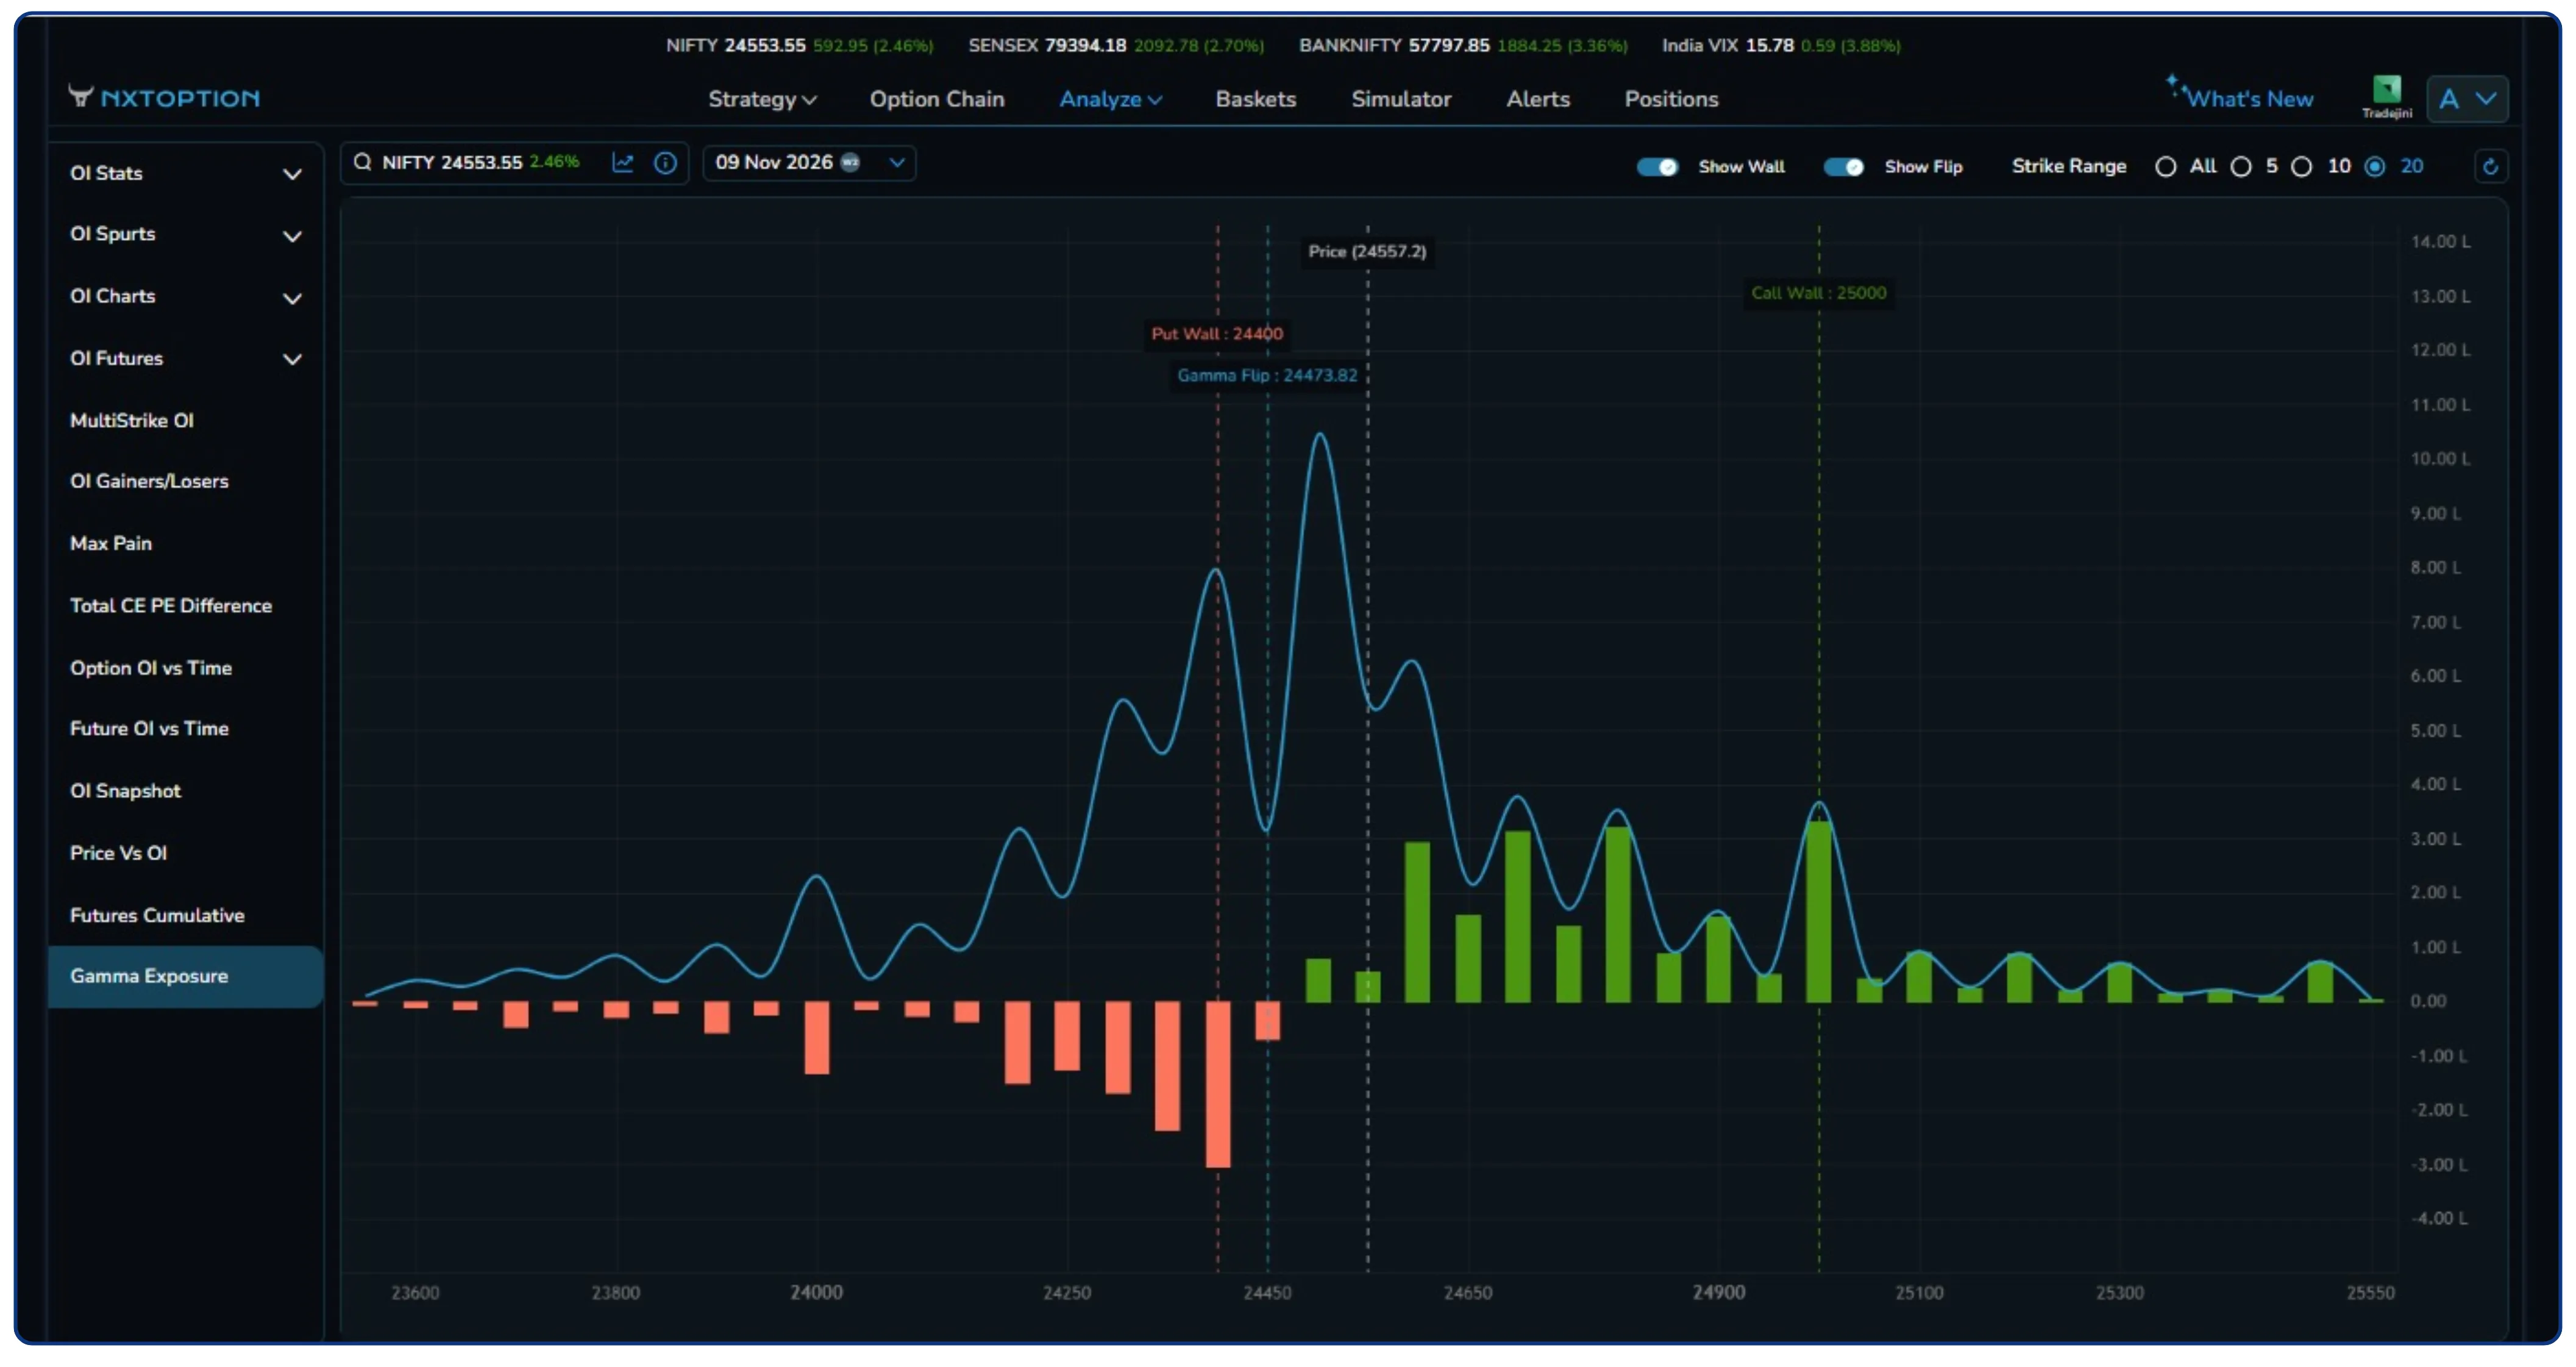
The following screenshot shows the NIFTY Gamma Exposure chart.
Key observations from the displayed chart:
| Parameter | Displayed Value |
|---|---|
| NIFTY Spot Price | 24,553.55 |
| Gamma Flip | 24,473.82 |
| Put Wall | 24,400 |
| Call Wall | 25,000 |
The spot price is trading above the Gamma Flip level of 24,473.82.
The Put Wall is located at 24,400, while the Call Wall is at 25,000.
This gives traders three important reference points:
- 24,473.82 – Gamma Flip: A reference level for monitoring changes in the gamma environment.
- 24,400 – Put Wall: A level to monitor for potential support.
- 25,000 – Call Wall: A level to monitor for potential resistance.
The chart also shows negative gamma exposure around several lower strikes and positive gamma exposure across several higher strikes.
Based on this snapshot, traders can monitor whether NIFTY sustains above the Gamma Flip and how price behaves near the Call Wall.
It is important to remember that this is only a snapshot. Gamma Exposure changes as option prices, underlying prices, volatility and open interest change.
7. How to Access Gamma Exposure in Tradejini NxtOption
You can access this feature directly from the NxtOption platform.
Follow these steps:
- Log in to Tradejini NxtOption.
- Navigate to the Analyze section in the top navigation menu.
- Select Gamma Exposure from the left-side menu.
- Select the underlying instrument, such as NIFTY or BANKNIFTY.
- Choose the required expiry date.
- Select the strike range. You can view all strikes or narrow the chart to 5, 10 or 20 strikes.
- Enable Show Wall to display Put Wall and Call Wall.
- Enable Show Flip to display the Gamma Flip level.
The chart will display the estimated gamma exposure across the selected strike range.
You can change the expiry and strike range to study how gamma exposure is distributed across different option contracts.
8. How Traders Can Incorporate Gamma Exposure into Their Trading
Gamma Exposure is more useful when combined with other market indicators rather than used independently.
Here are three practical ways traders can incorporate it into their analysis.
A. Identifying Potential Range-Bound Markets
When the market is above Gamma Flip and positive gamma exposure is dominant, traders can monitor whether price movements remain within a range.
This information can be useful for traders evaluating strategies such as Iron Condors, Short Strangles and other range-bound strategies.
However, these strategies still carry significant risk, particularly during sudden market movements.
B. Monitoring Potential Breakout Zones
If NIFTY approaches the Call Wall or Put Wall, traders can observe how price reacts around those levels.
A breakout beyond a significant gamma concentration may indicate a change in market positioning.
Confirm the move using price action, volume and changes in Open Interest before considering a directional trade.
C. Understanding Changes in Market Volatility
A negative gamma environment may increase the possibility of larger price movements because dealer hedging can reinforce the underlying move.
Traders can use this information when deciding whether a range-bound strategy or a directional strategy is more appropriate.
9. Gamma Exposure Should Not Be Used in Isolation
Gamma Exposure provides another perspective on the options market, but it is not a standalone trading signal.
Before taking a position, traders should also consider:
- Price action around important support and resistance levels.
- Changes in Call and Put Open Interest.
- India VIX and implied volatility.
- Volume and market breadth.
- Expiry and time remaining until expiry.
For example, a trader may observe that NIFTY is above Gamma Flip but is approaching the Call Wall. Instead of immediately selling calls, the trader can wait to see whether price faces resistance or breaks above the level with strong momentum.
This approach combines options positioning with actual market behaviour.
Conclusion
Gamma Exposure is a useful addition to the toolkit of options traders. It provides an estimate of how gamma is distributed across strike prices and helps identify important reference levels such as Gamma Flip, Put Wall and Call Wall.
Tradejini NxtOption makes this information accessible through its Analyze section.
Whether you are an option buyer, option writer or an intraday trader, understanding Gamma Exposure can help you develop a better perspective on market positioning and potential price behaviour.
The objective is not to predict the market using one indicator, but to combine Gamma Exposure with price action, Open Interest and volatility analysis before making a trading decision.
Disclaimer: The information provided in our blogs is for informational purposes only and should not be construed as financial, investment, or trading advice. Trading and investing in the securities market carries risk. Always conduct your own research and consult with a qualified financial advisor before making any investment decisions. Past performance is not indicative of future results. Copyrighted and original content for your trading and investing needs.
© 2026 — Tradejini. All Rights Reserved.