


Most traders stop at engulfing patterns, hammers, and morning stars; that's surface-level analysis. The real edge lies in lesser-known candlestick patterns that most retail participants never study: hidden candlestick formations that reveal smart money positioning before the obvious move begins.The real edge shows up in structures that signal exhaustion, absorption, and institutional positioning before the crowd even notices.
Here’s the thing, markets don’t turn or accelerate randomly. They leave footprints. The patterns below are not common textbook favorites. They’re subtle formations that reveal when sellers are truly done, when smart money is defending a zone, or when a quiet pause is about to turn into a violent expansion.
Study these properly, and you stop reacting to price. You start anticipating it.
REVERSAL PATTERNS (Bottom/Top Detection)
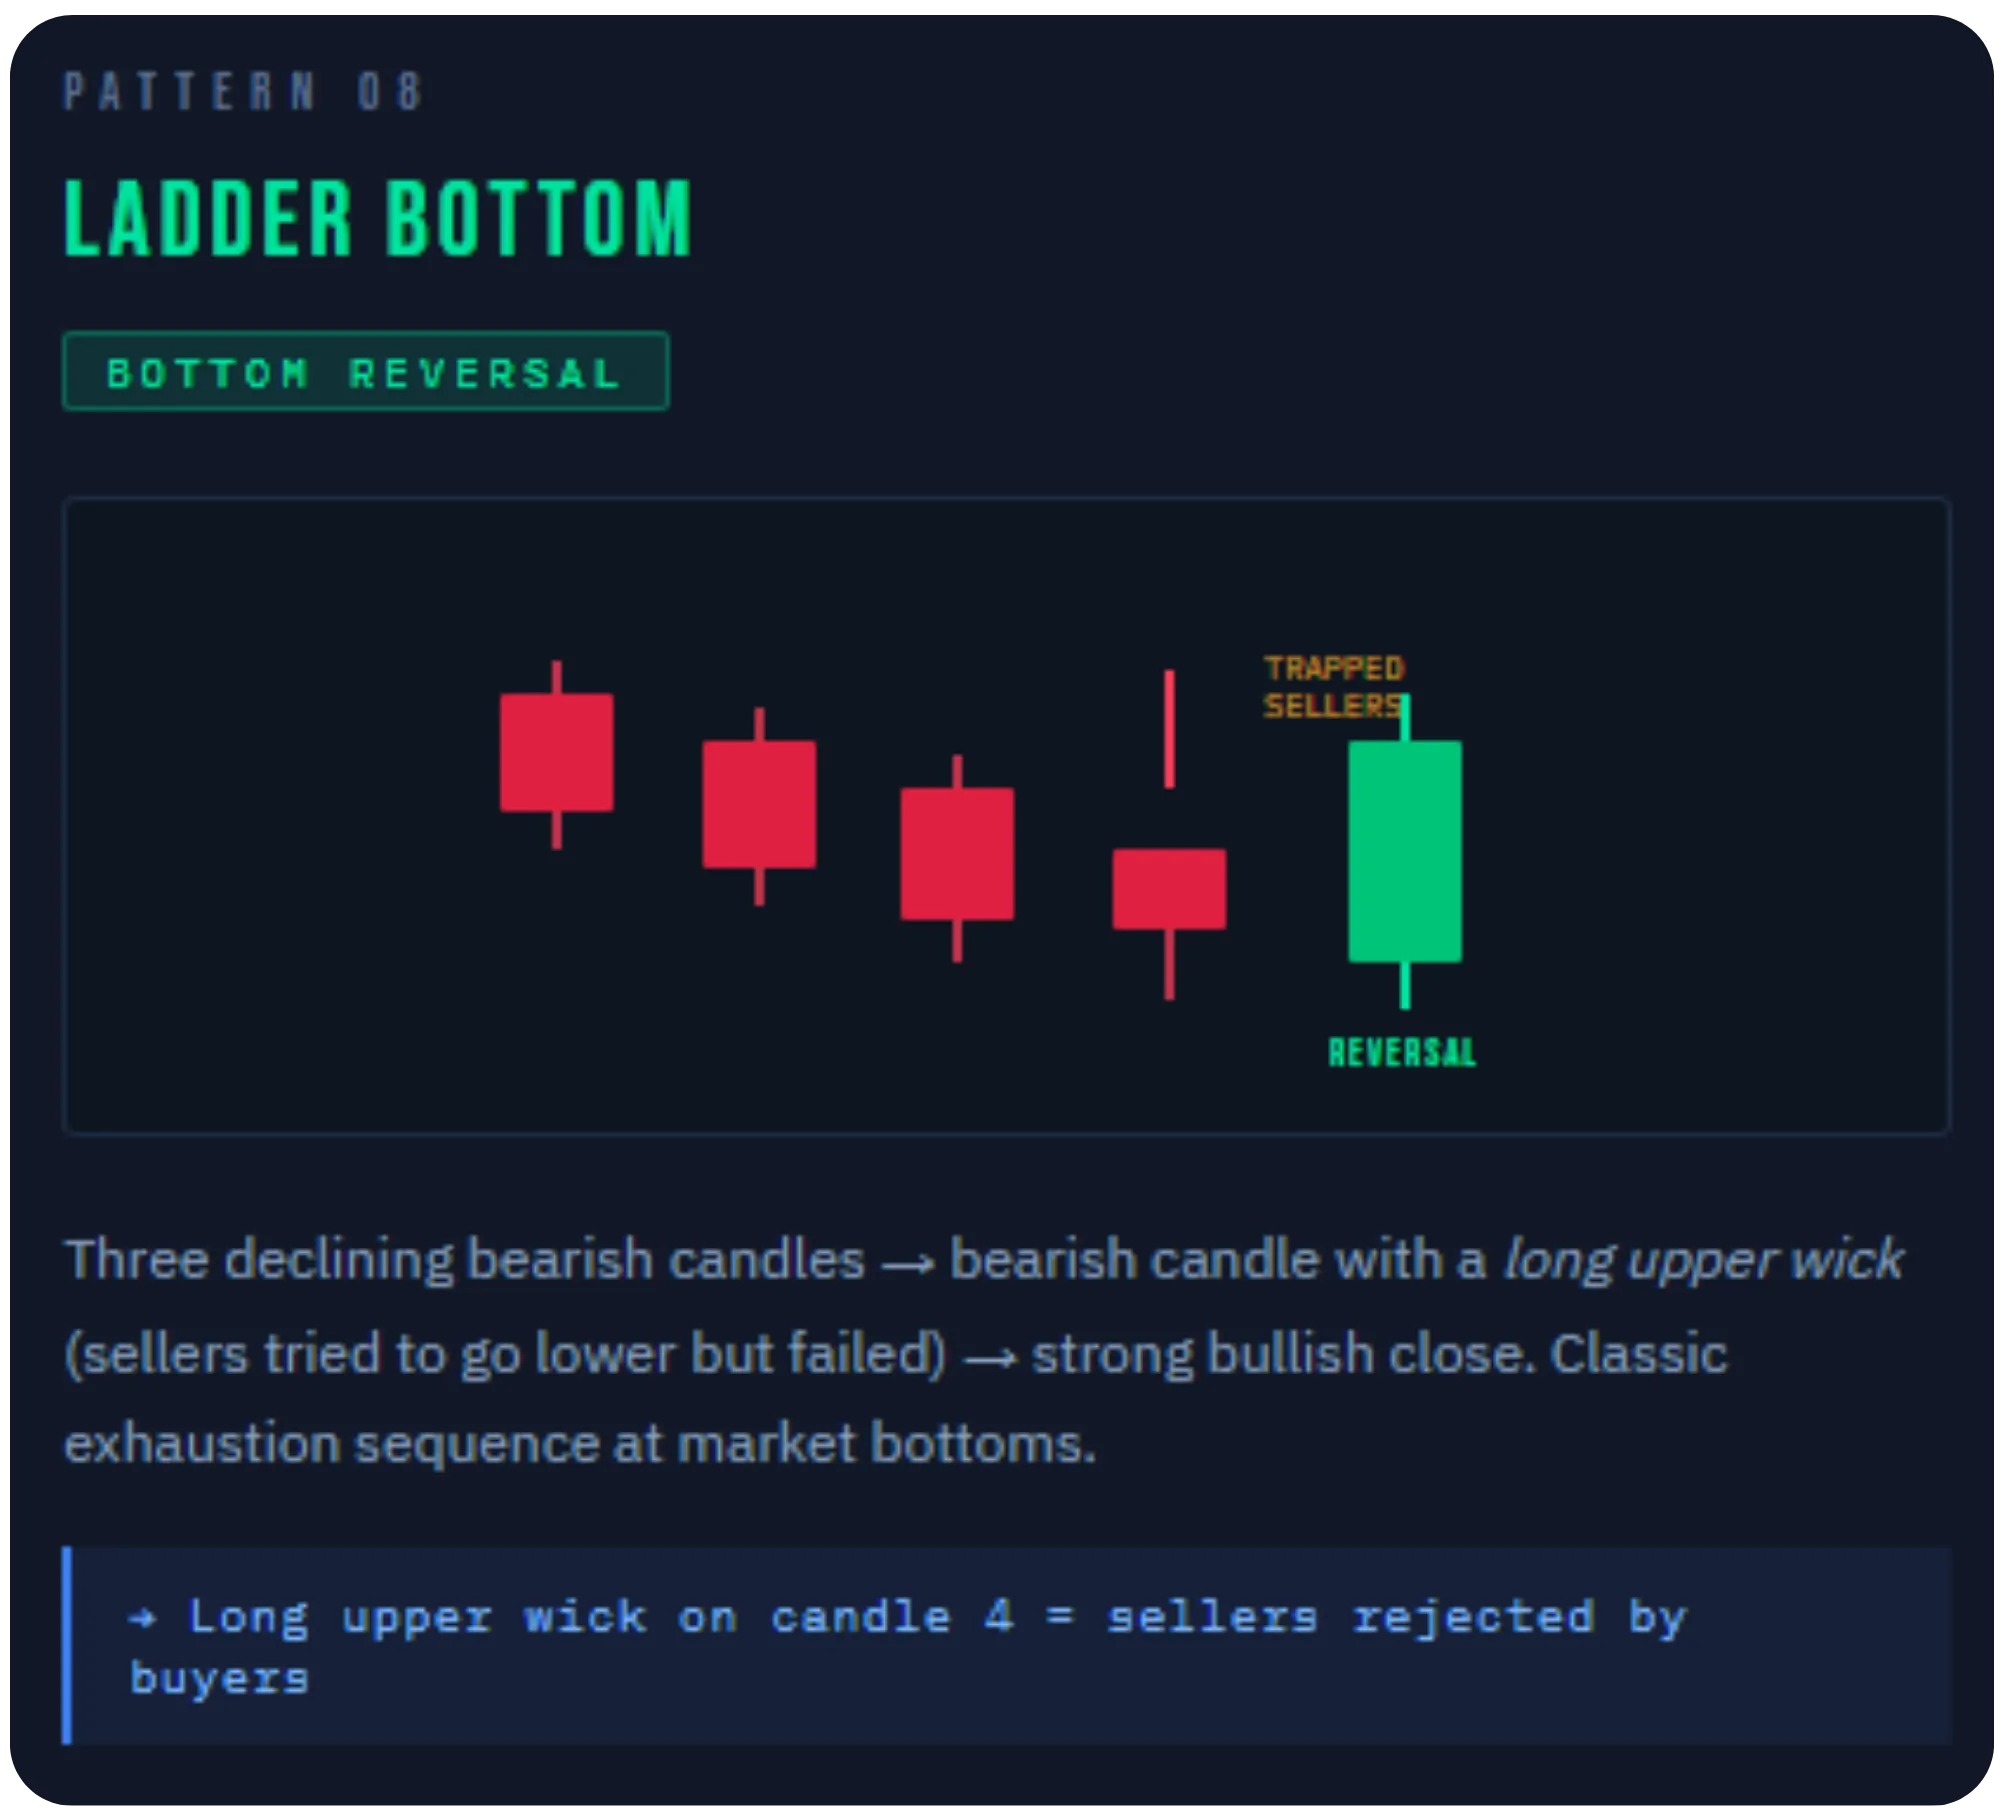
Ladder bottom is a five-candle bullish reversal pattern consisting of three long bearish candles, followed by a small-bodied candle with an upper shadow indicating selling exhaustion, and finally a strong bullish candle confirming the reversal. It is one of the cleaner candlestick pattern exhaustion signals in the reversal playbook.". Nestle's 1,050–1,080 zone in late 2024 closely resembles this formation.
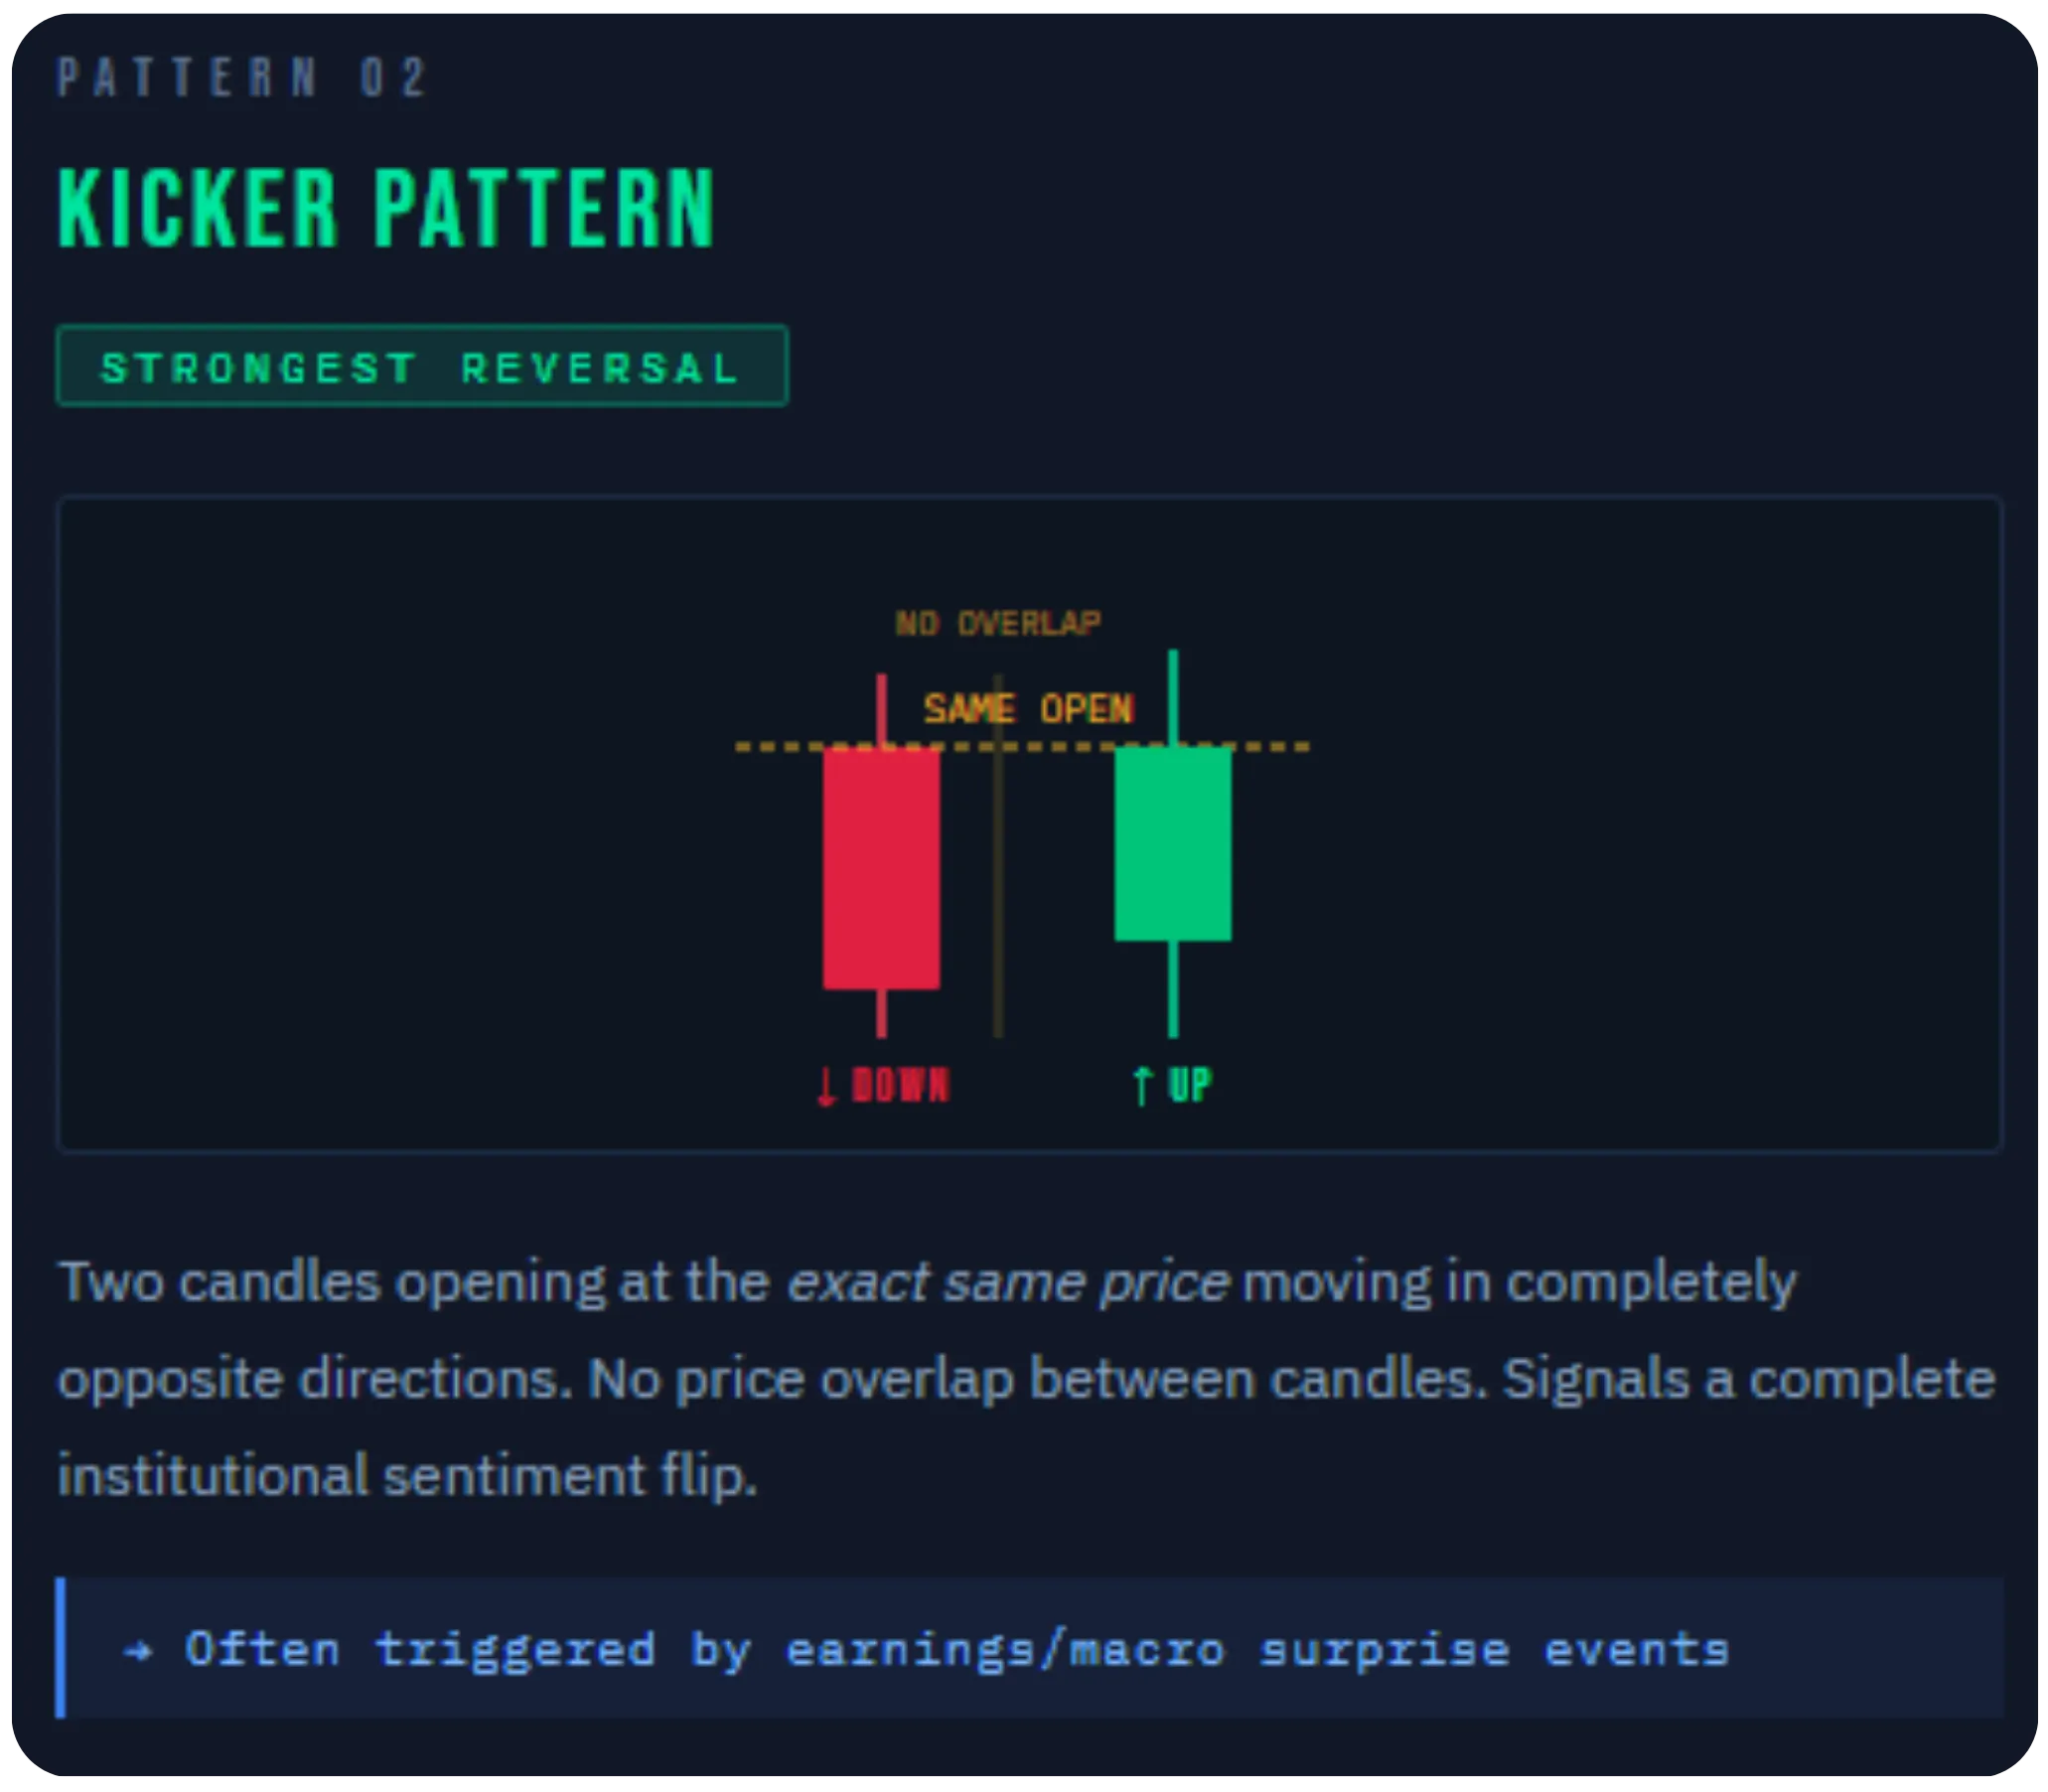
A kicker pattern occurs when the second candle opens with a sharp gap in the opposite direction of the previous candle, signalling a sudden shift in market sentiment. No overlap whatsoever. One of the most powerful reversal signals, typically driven by institutional repositioning or surprise news. Very rare on weekly charts, extremely reliable when it appears.
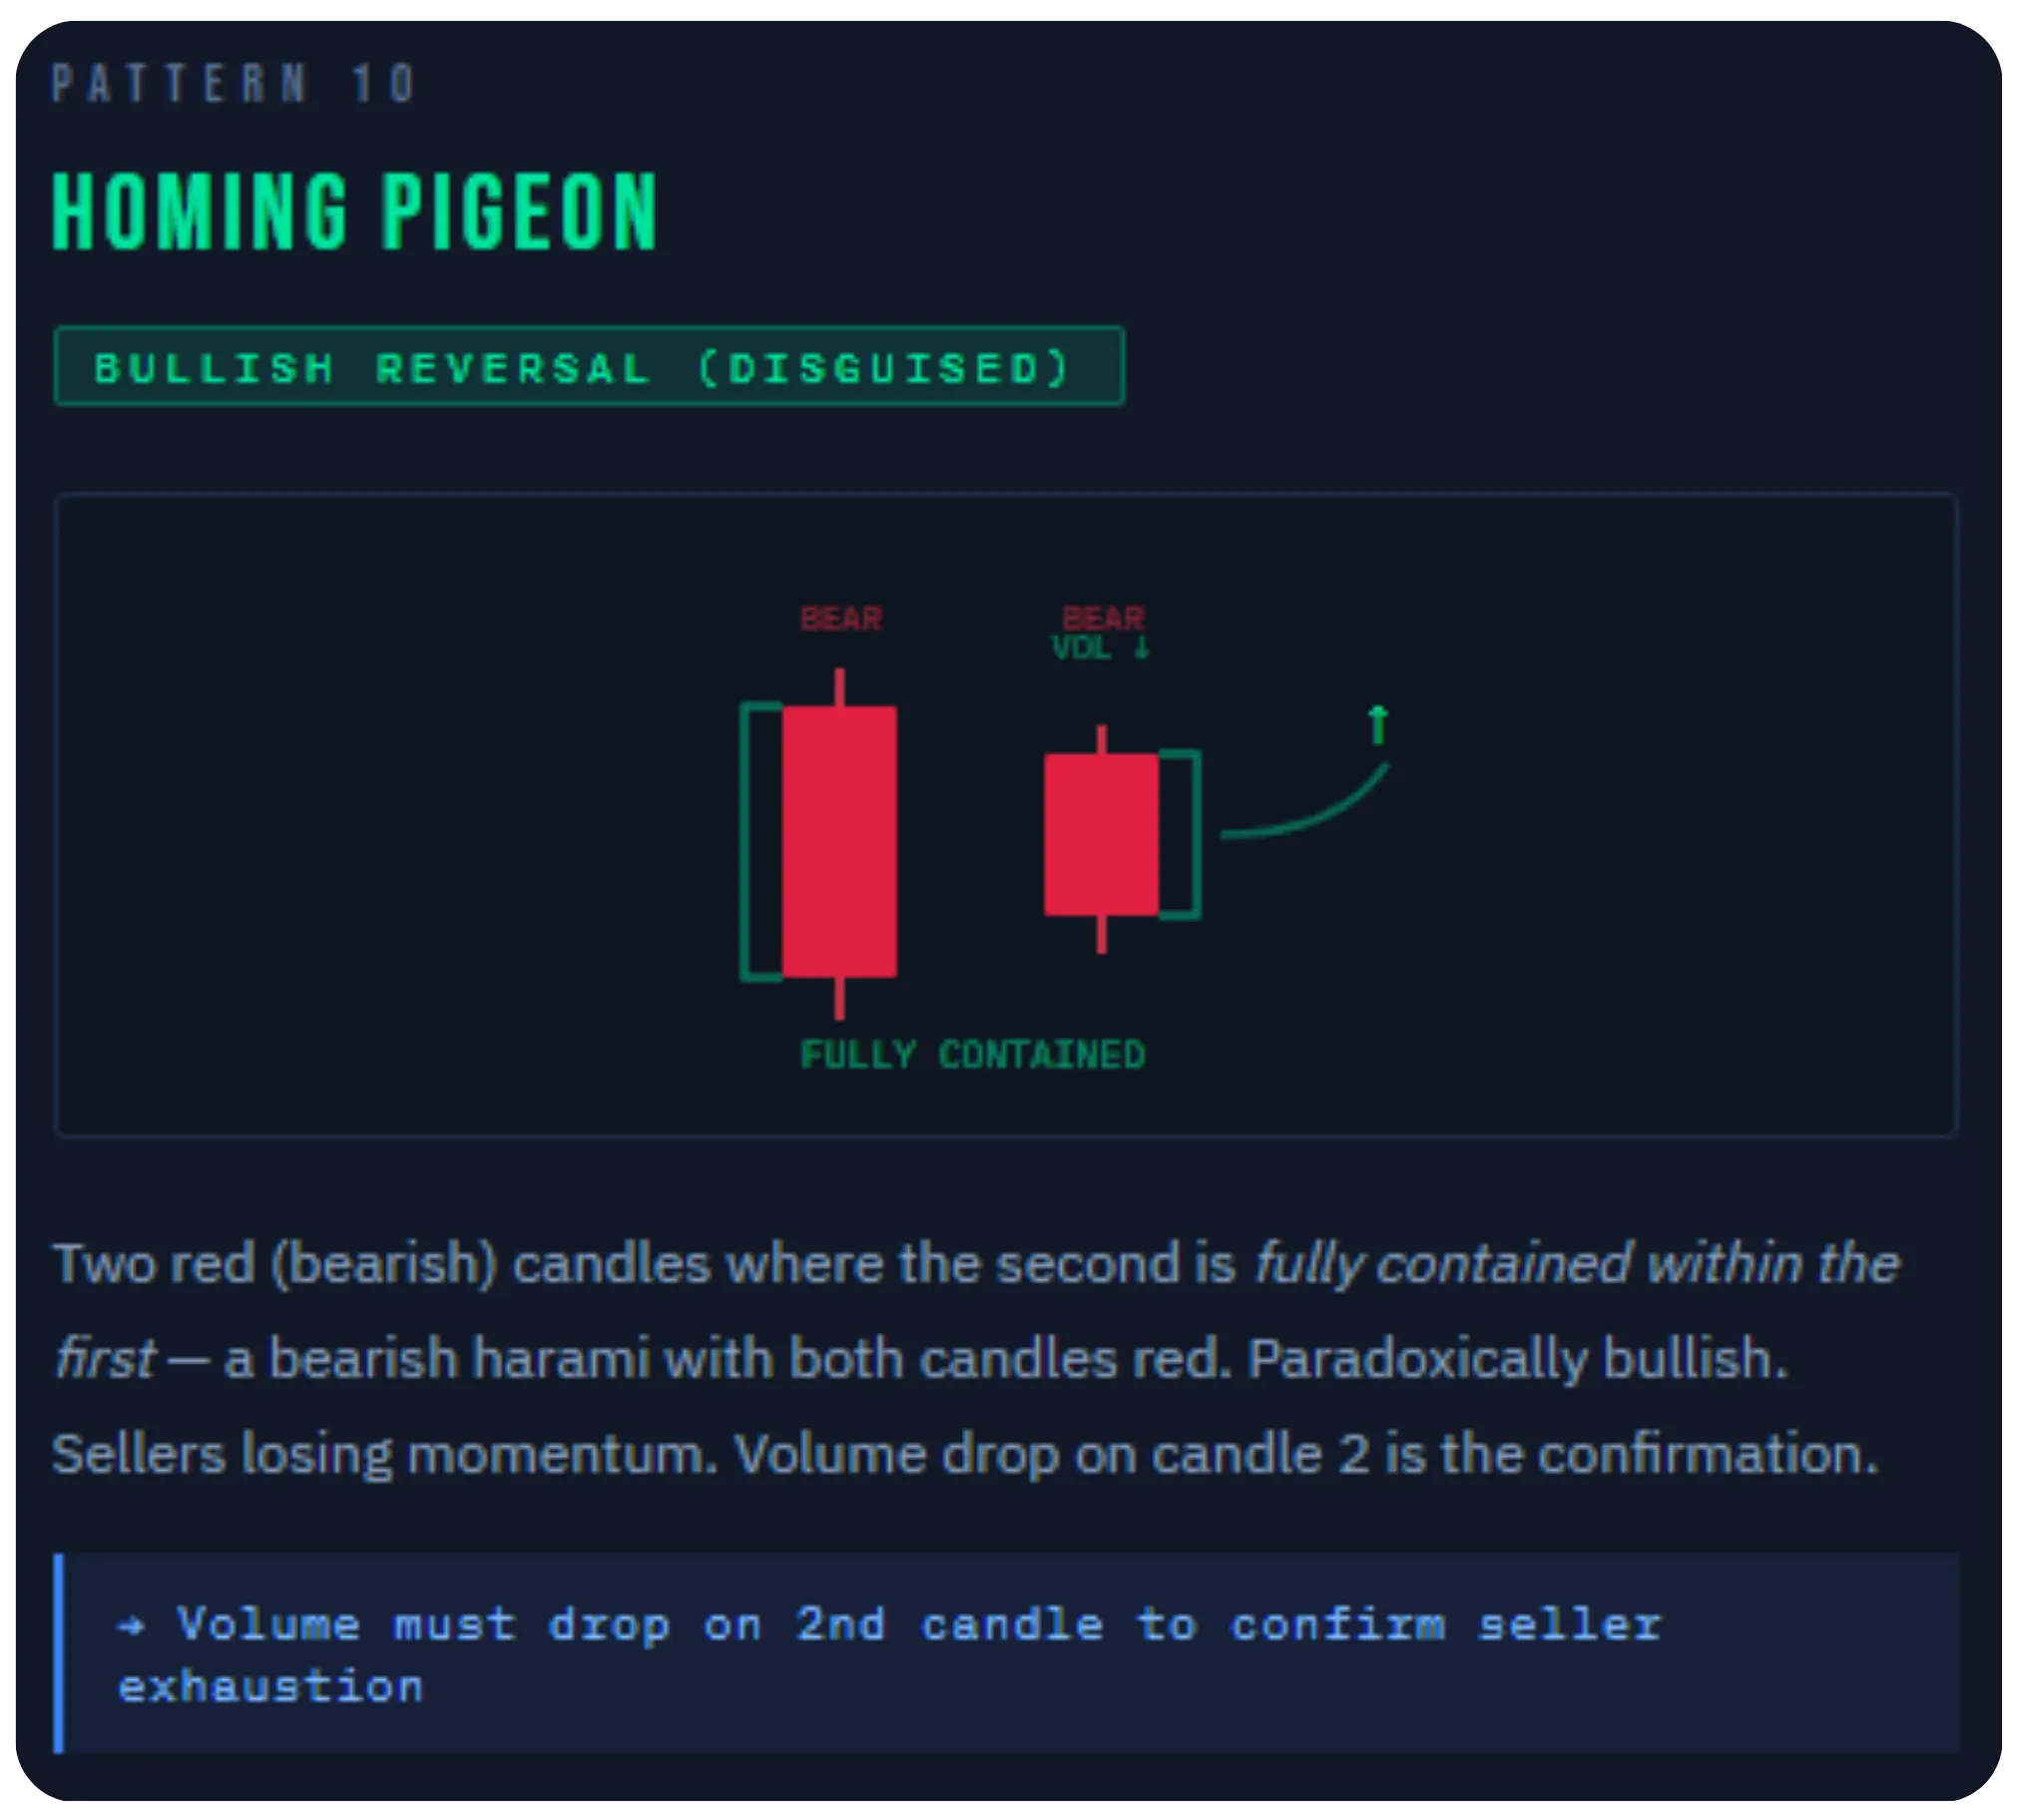
Homing Pigeon Two red candles where the second is fully contained inside the first, both bearish, yet paradoxically bullish. Sellers are losing momentum even while price dips. Volume contraction may support the interpretation, though it is not part of the traditional pattern definition. A declining volume on the second candle is what separates a genuine Homing Pigeon candlestick reversal pattern from a random two-bar sequence. Without that volume contraction, the setup lacks conviction.
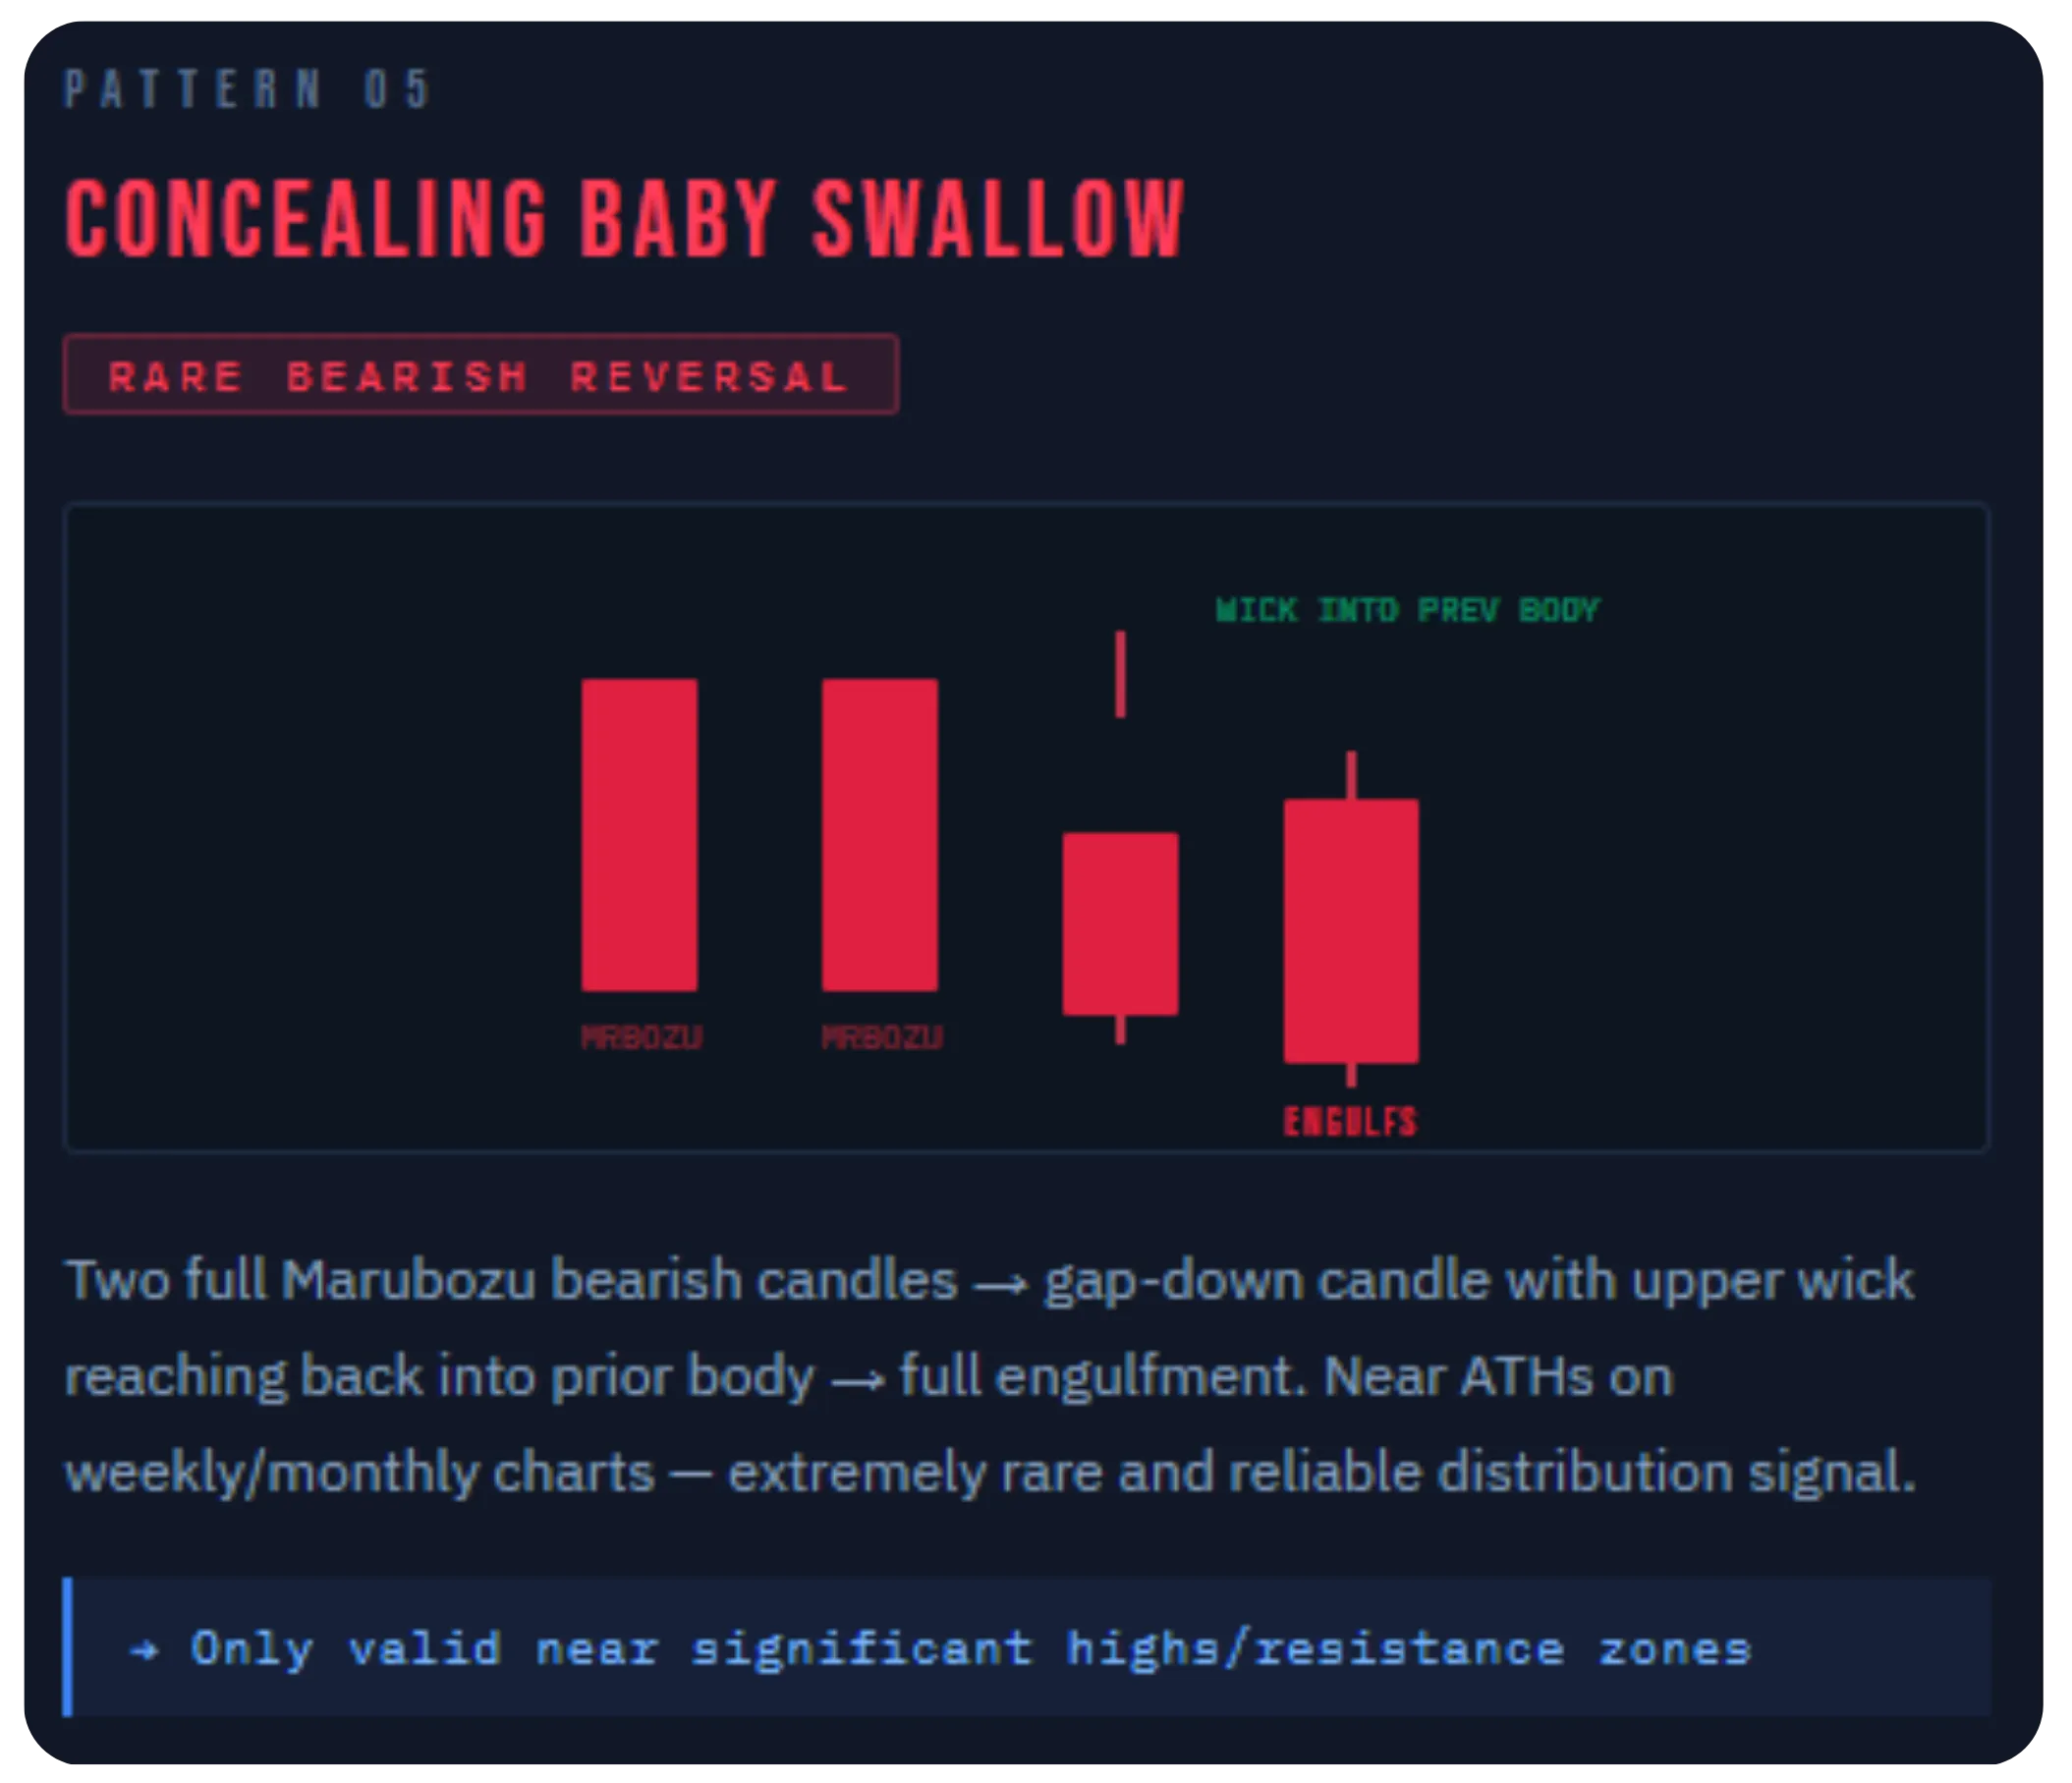
Concealing baby swallow four bearish candles near the top. Rare but devastating when spotted. Two full-body Marubozu candlestick patterns open the sequence; high conviction, no-wick selling. What follows is institutional absorption trading in reverse: the gap-down with an upper wick and final engulfment is smart money quietly offloading before the real drop.
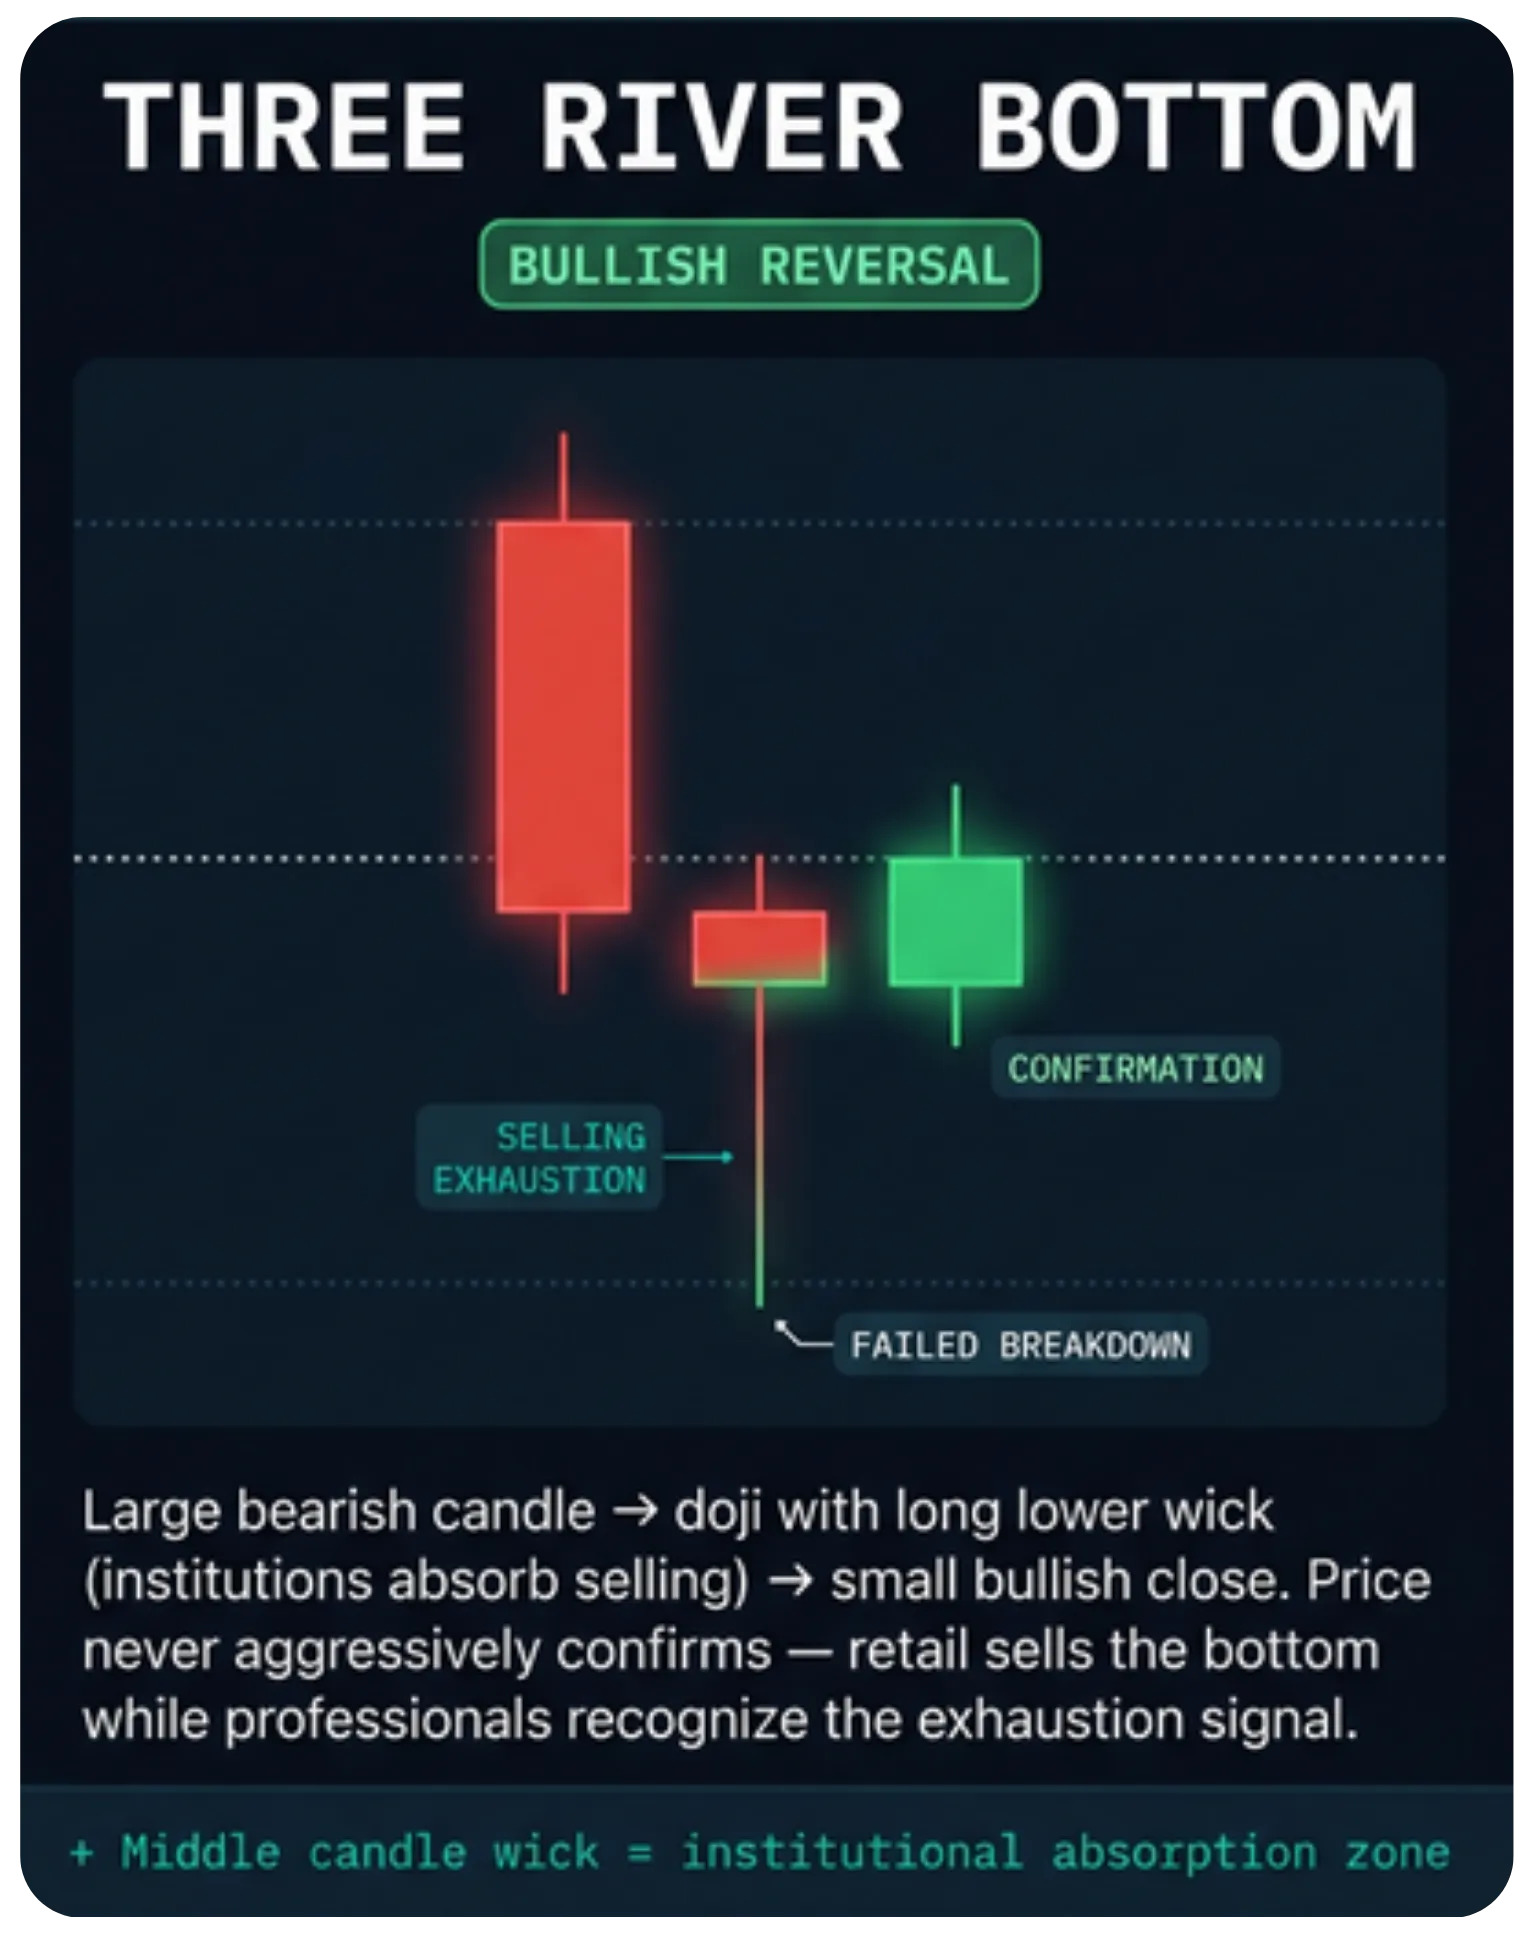
Unique three river bottom three candles — large bearish, small bearish doji-like with long lower wick, small bullish close. Price never confirms aggressively which is why most traders ignore it and miss the bottom. Professionals recognise the exhaustion in the middle candle.
If you want to go deeper on rare candlestick formations, this one's worth studying closely: The Rain Drop Candlestick Pattern
CONTINUATION PATTERNS (Trend Acceleration)
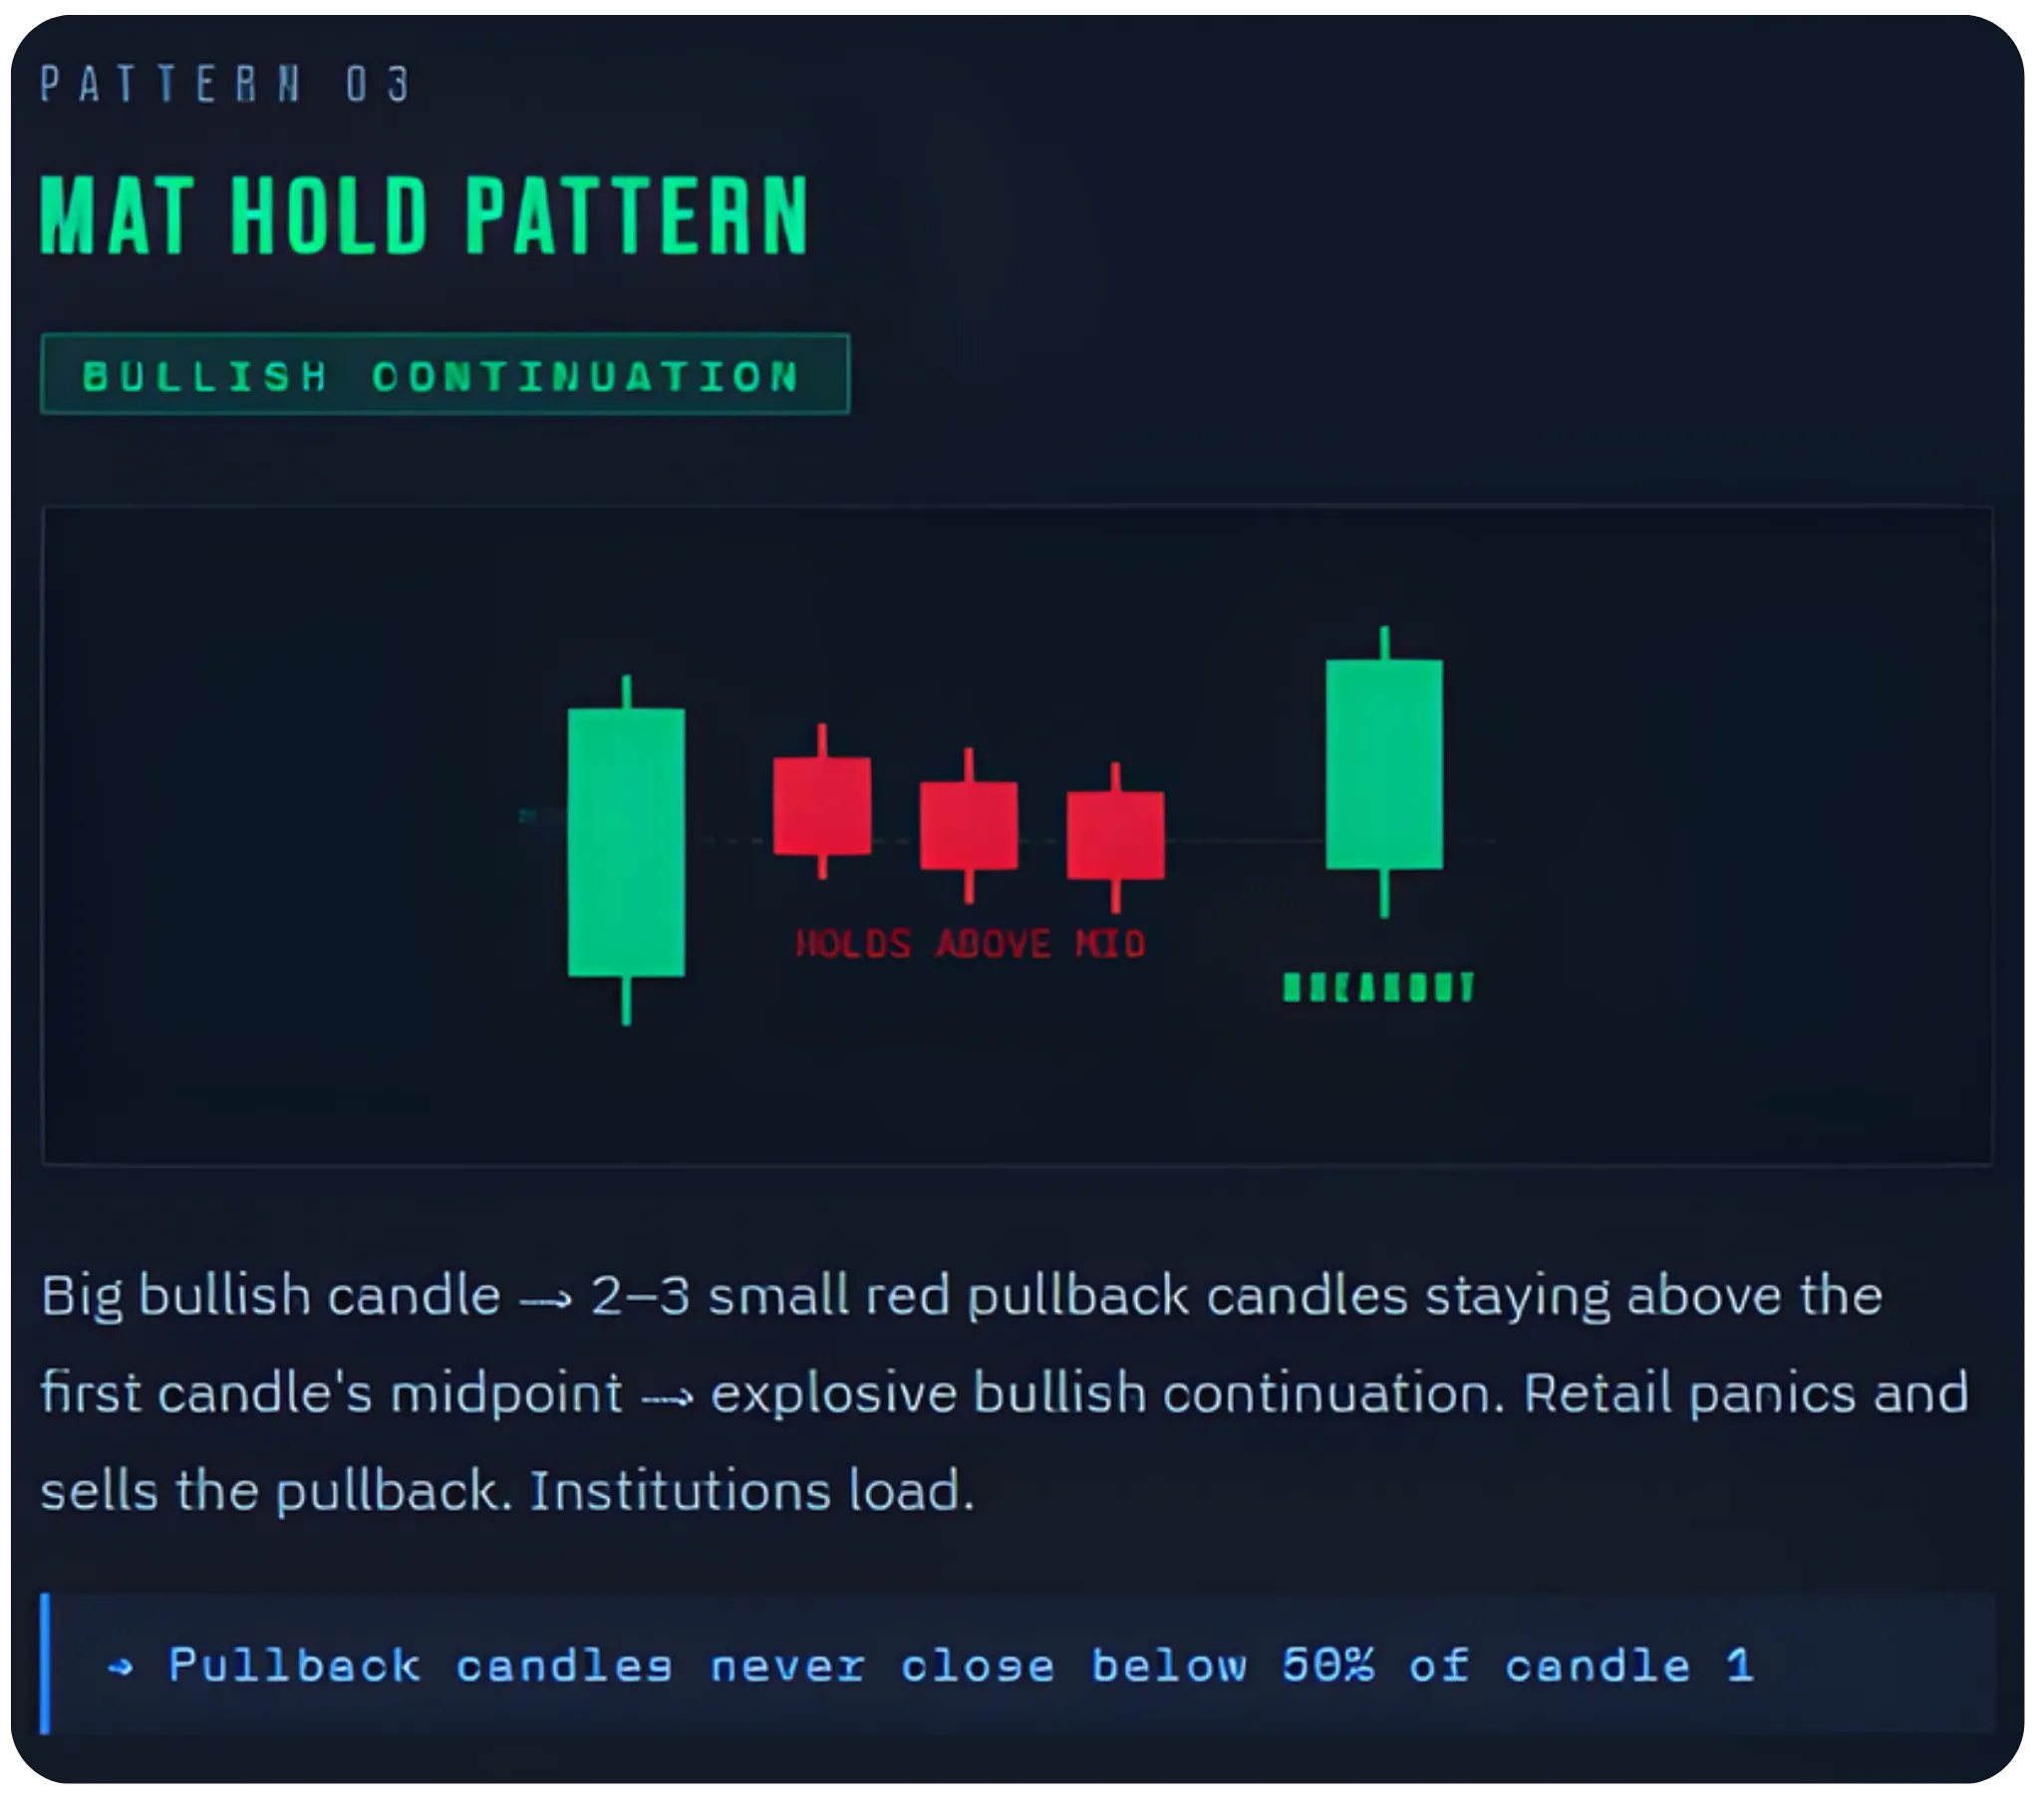
Mat hold Looks like a reversal but isn't. Big bullish candle → 2–3 small pullback candles → strong bullish close above everything. Retail traders panic-sell the pullback. Institutions are absorbing.
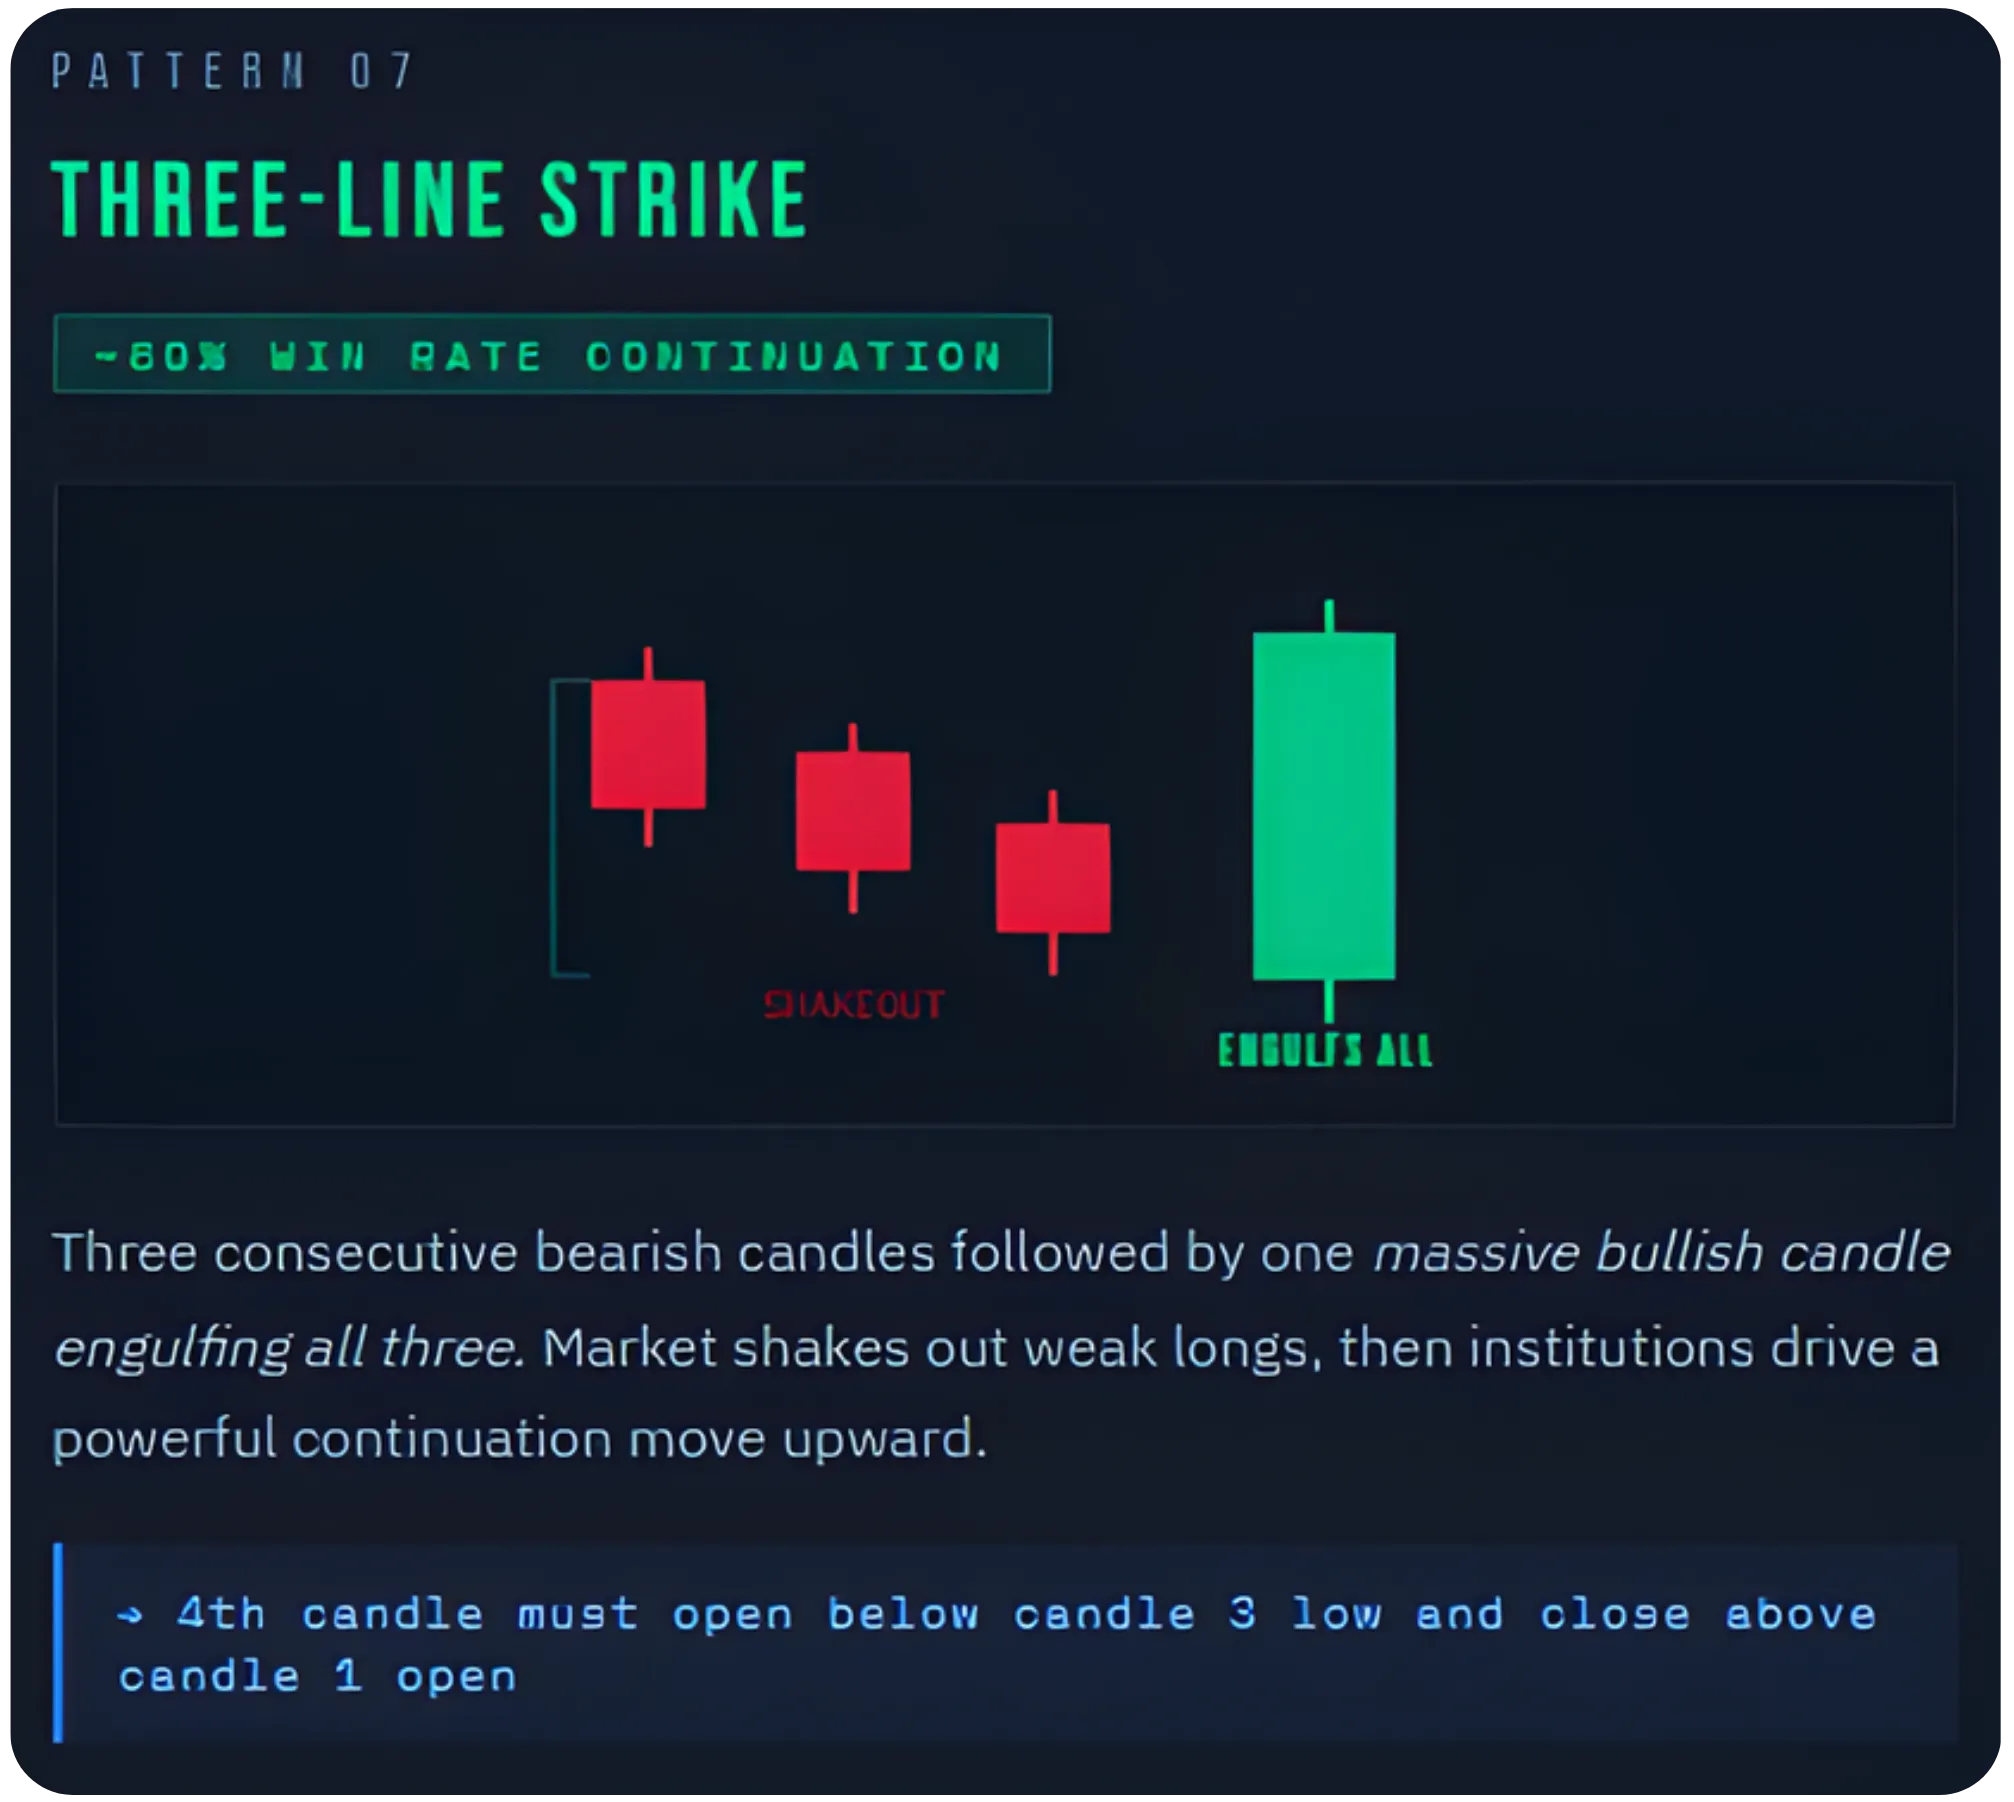
Three-line strike (Bullish) Three bearish candles followed by one massive bullish candle engulfing all three. "Candlestick pattern backtesting across multiple asset classes consistently puts the Three-Line Strike among the highest candlestick pattern win rates. The three bearish candles before it are a deliberate candlestick shakeout pattern, engineered to look like a false breakout candlestick before the real continuation fires.
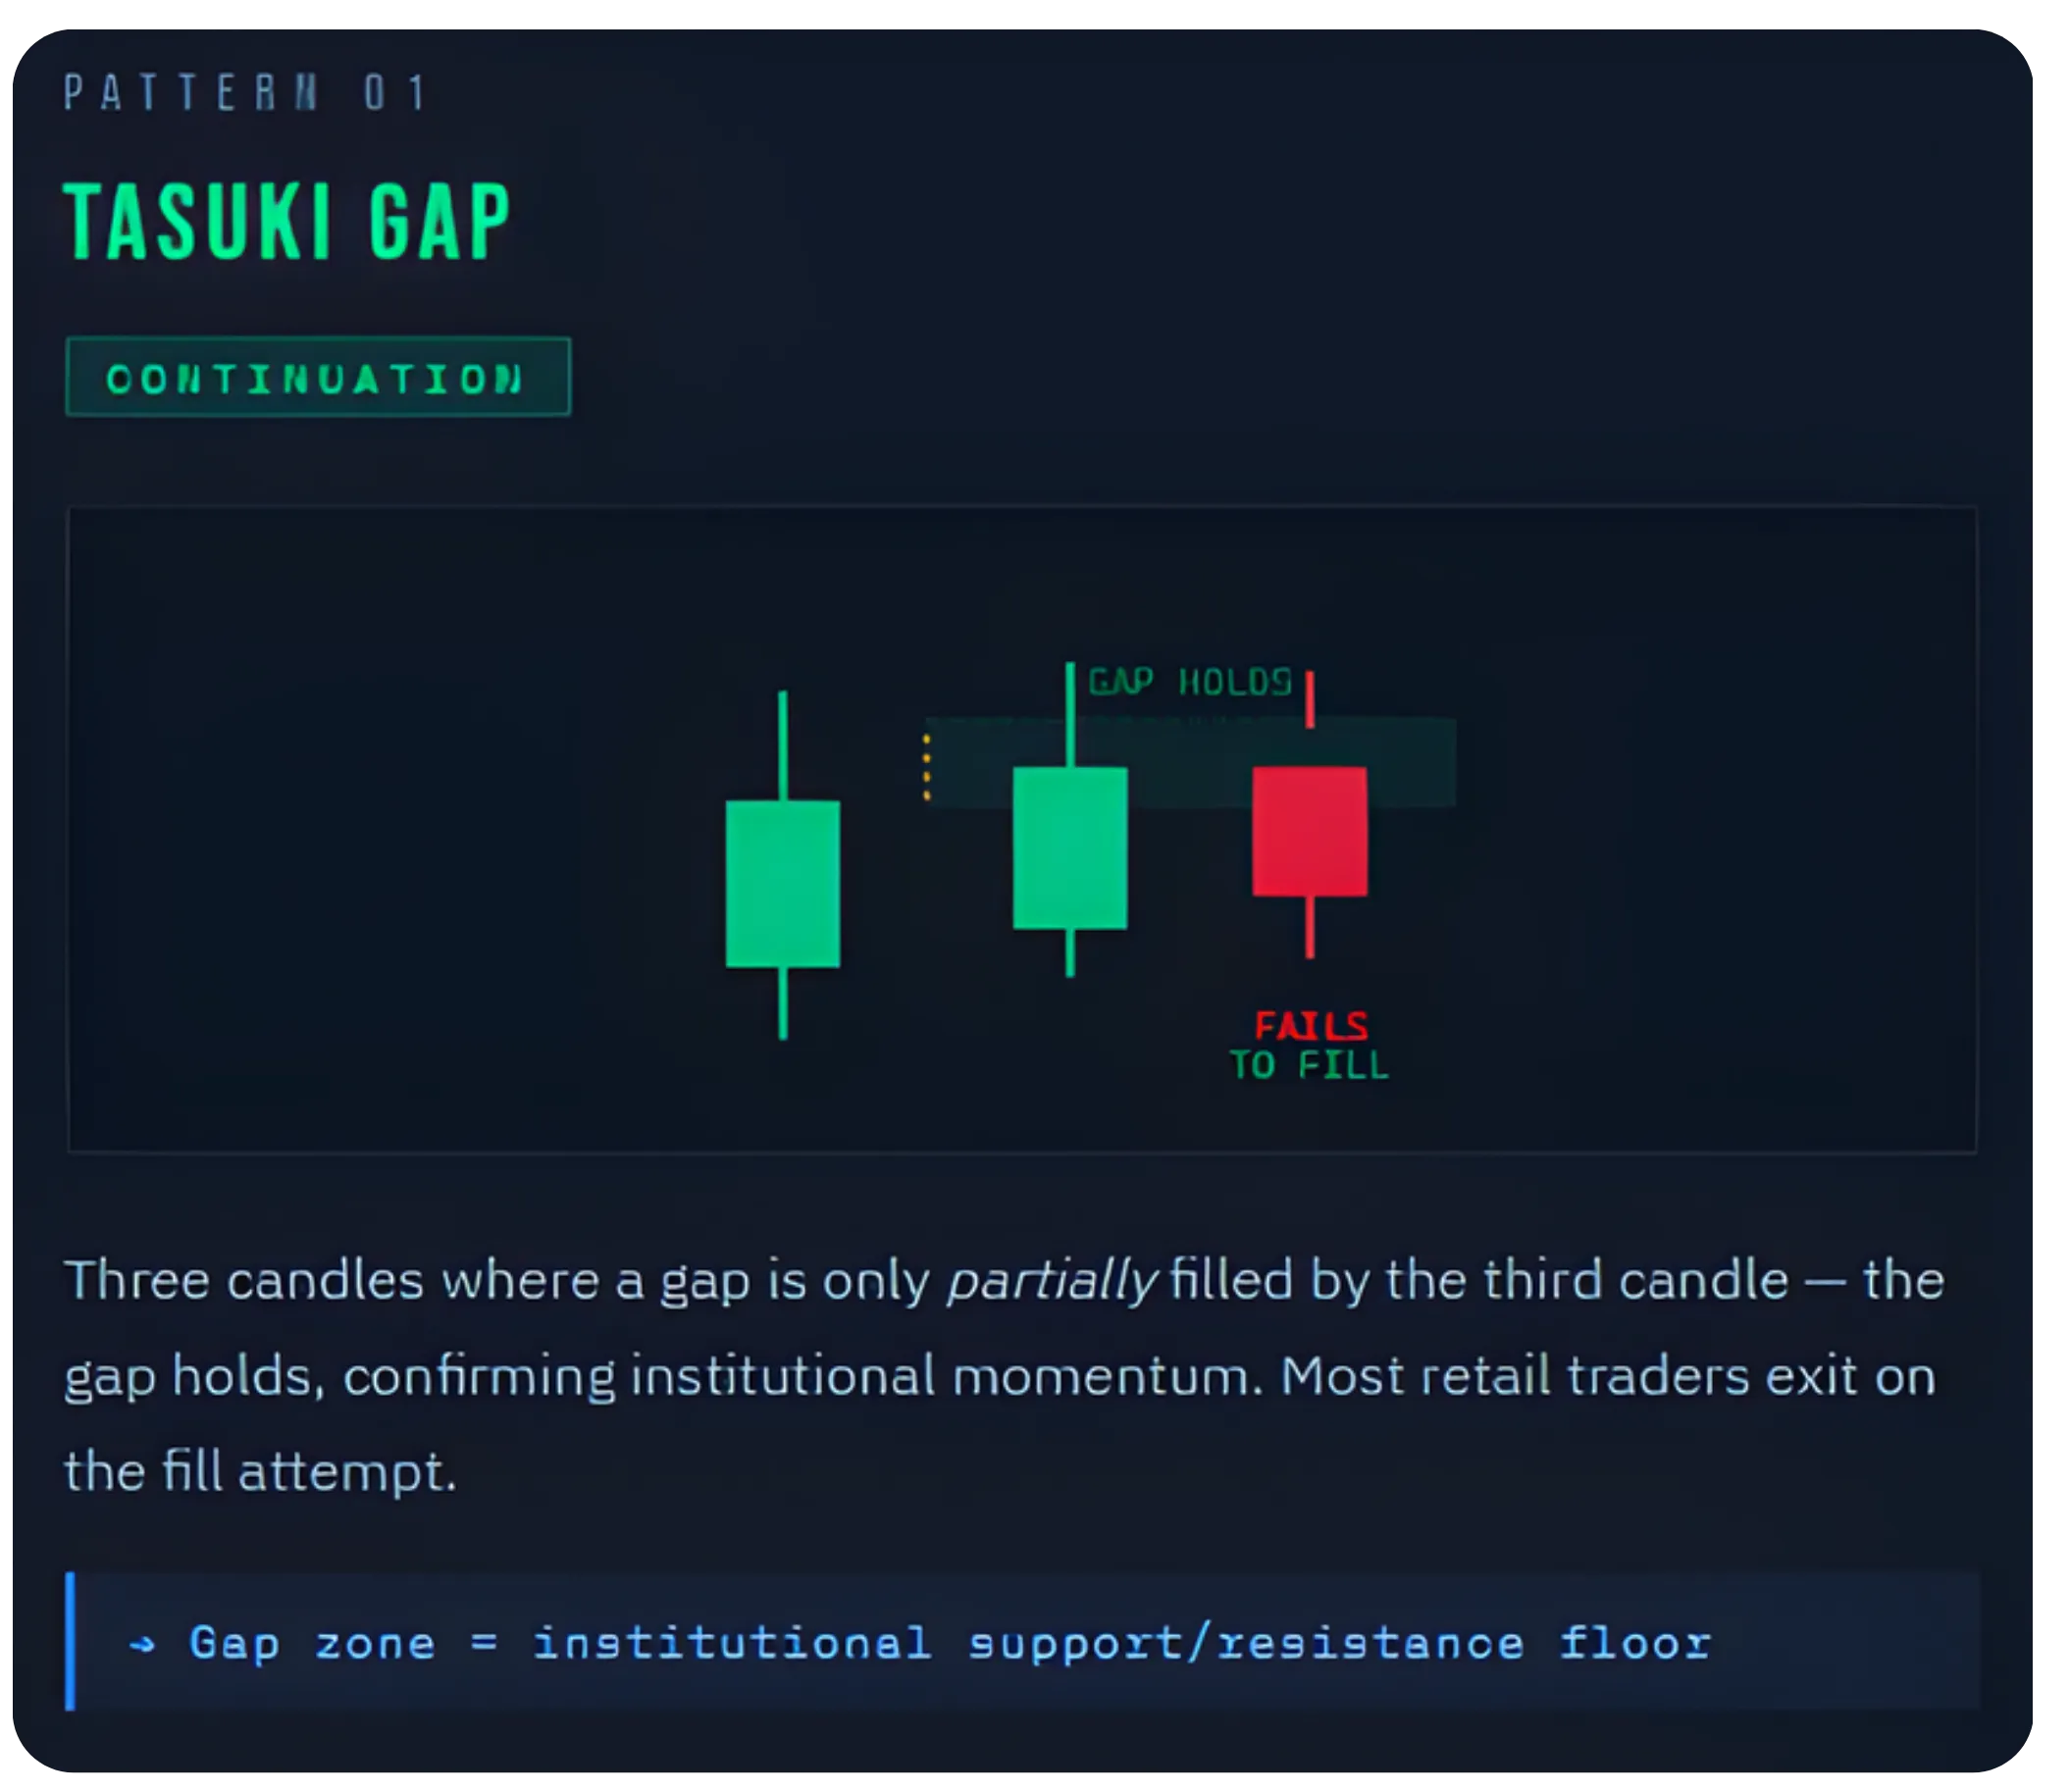
Tasuki gap A gap forms, then a candle tries to fill it but fails and closes inside the gap. When the gap holds, the Tasuki gap becomes one of the cleaner trend continuation candlestick signals; institutions are defending the zone aggressively, and the pattern's resolution confirms it as a high-conviction institutional candlestick setup.
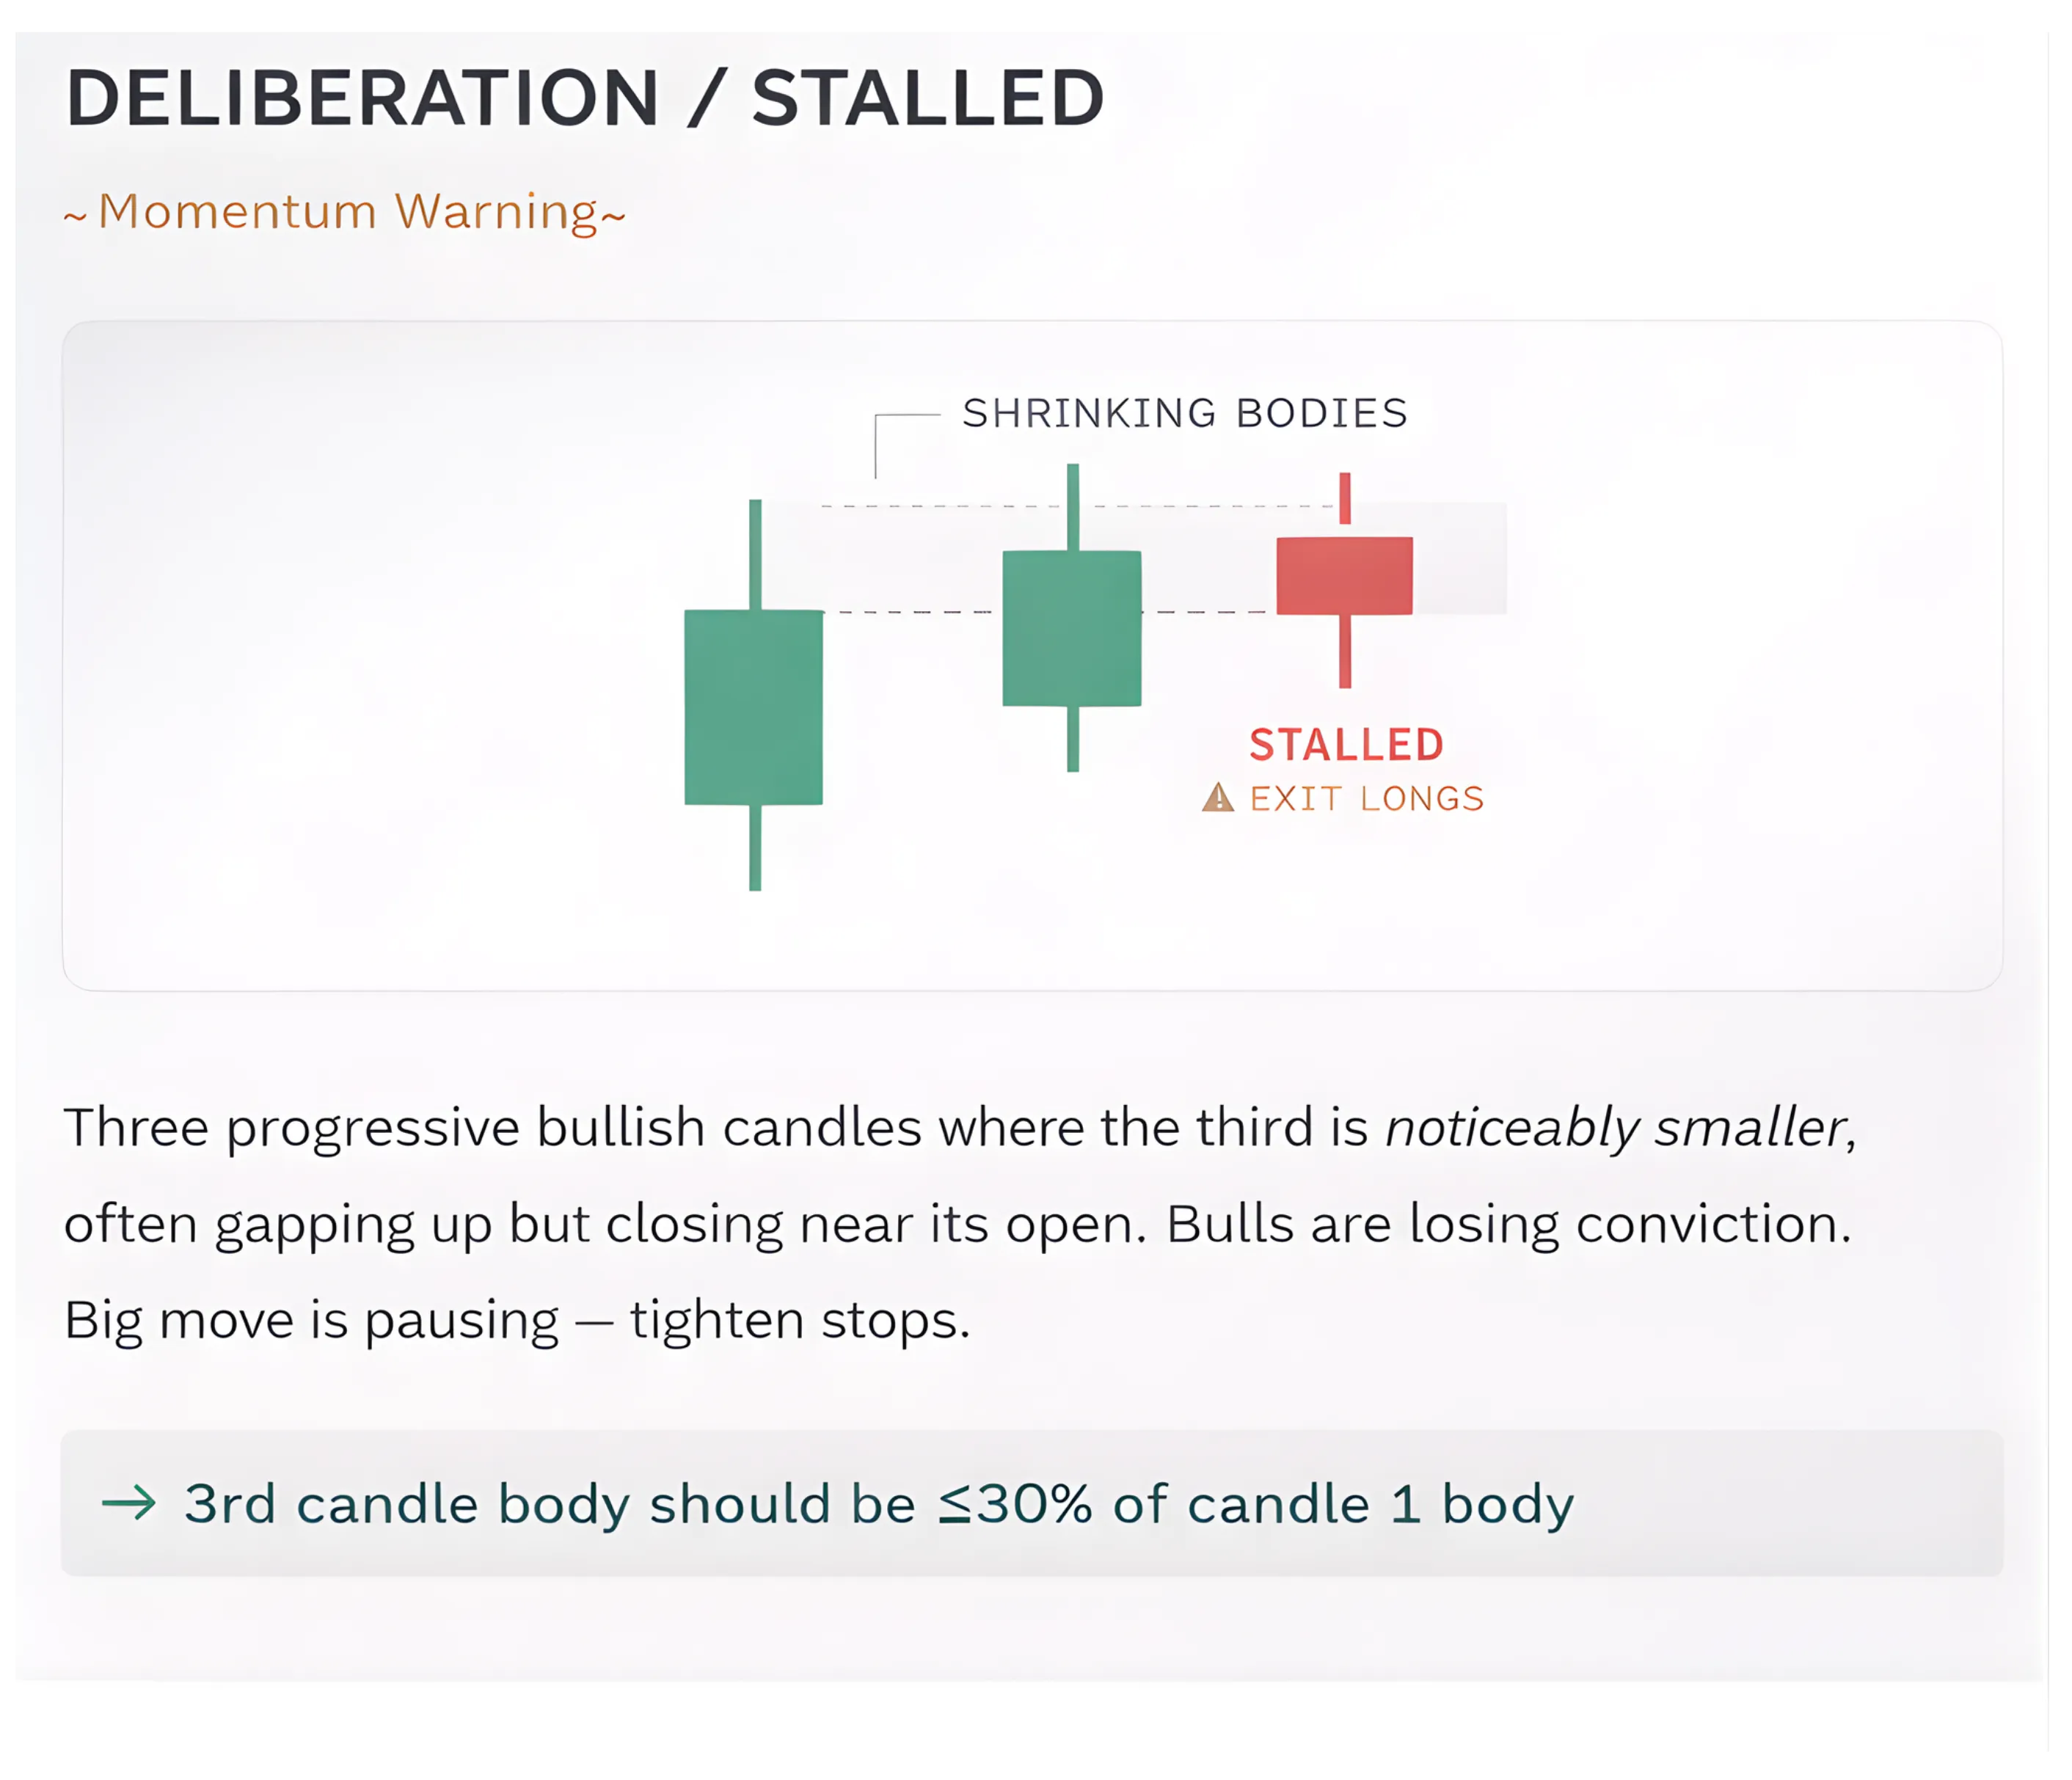
Deliberation / Stalled pattern three progressive bullish candles where the third is noticeably smaller and gaps slightly. Not a reversal necessarily, it's momentum pausing.For swing trading candlestick setups and positional trading patterns alike, the Deliberation and Stalled pattern is a signal to tighten stops, not abandon the trade. Deliberation pattern trading is about reading the pause, not panicking through it.
INDECISION → EXPLOSIVE MOVE PATTERNS
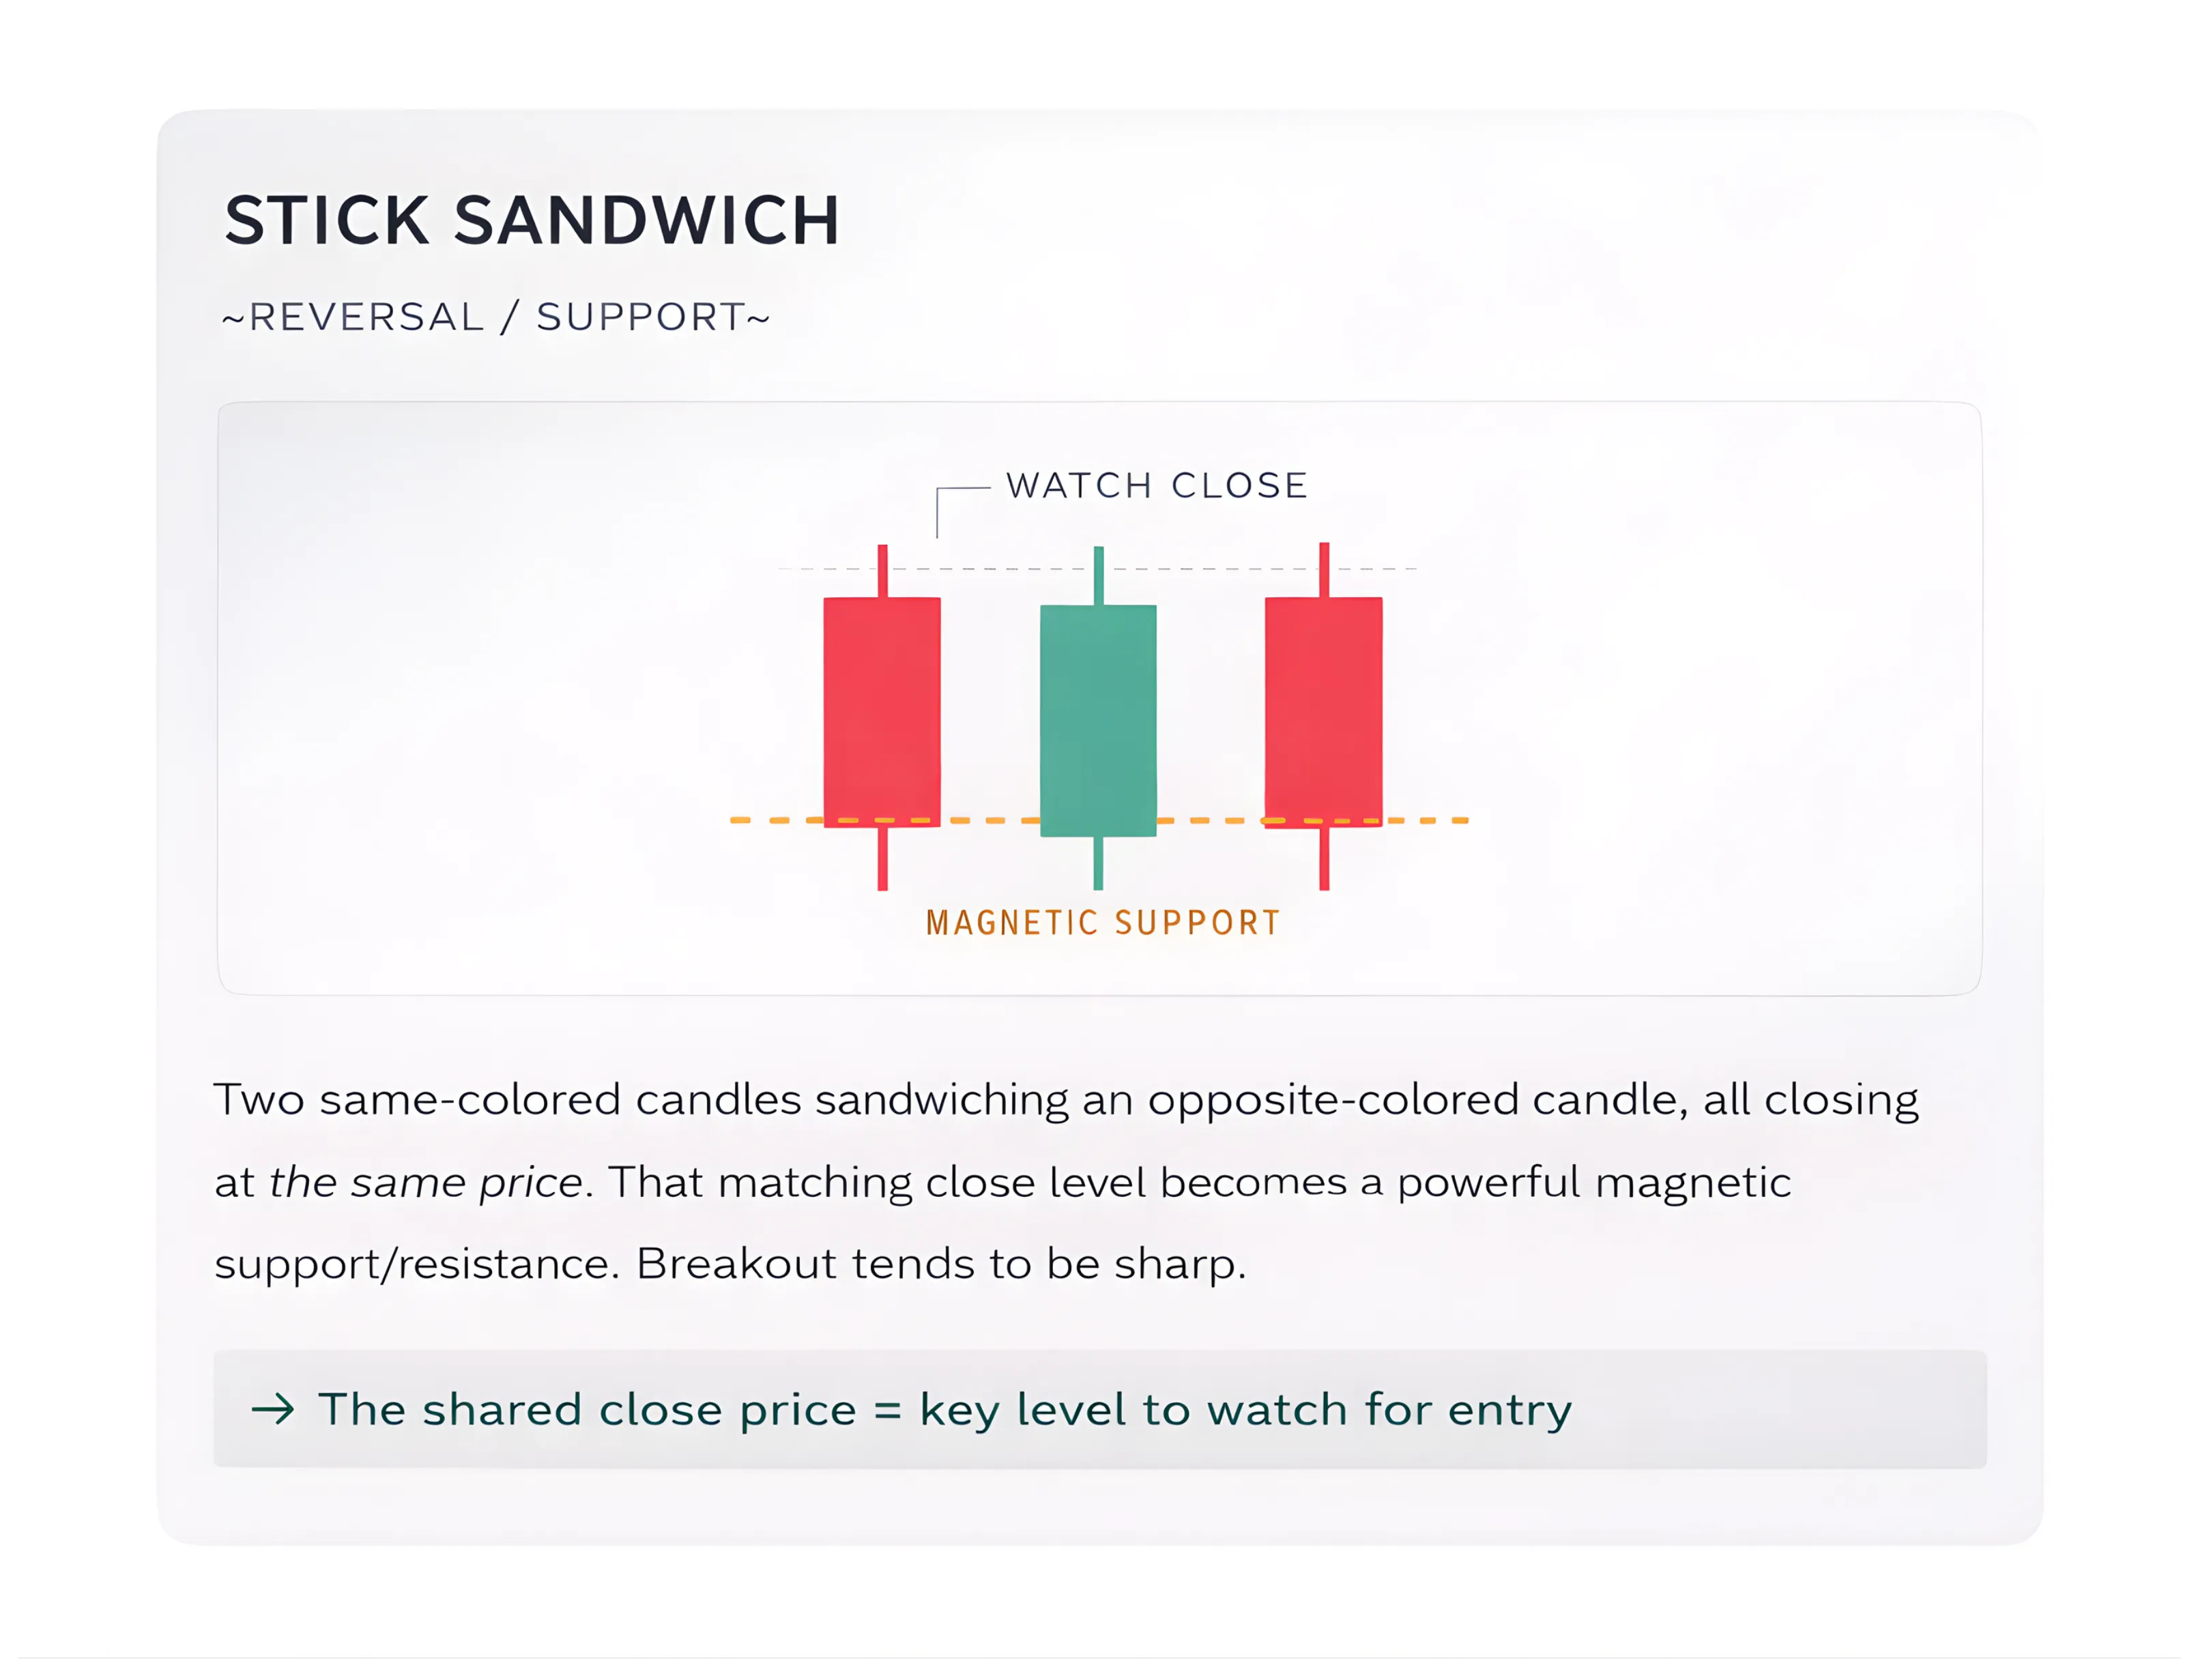
Stick sandwich two candles of the same color with an opposite candle between them, closing at the same price level. That matching close acts like a magnet — price respects it as hard support/resistance. When this forms at a key zone, the breakout from it tends to be sharp and sustained.
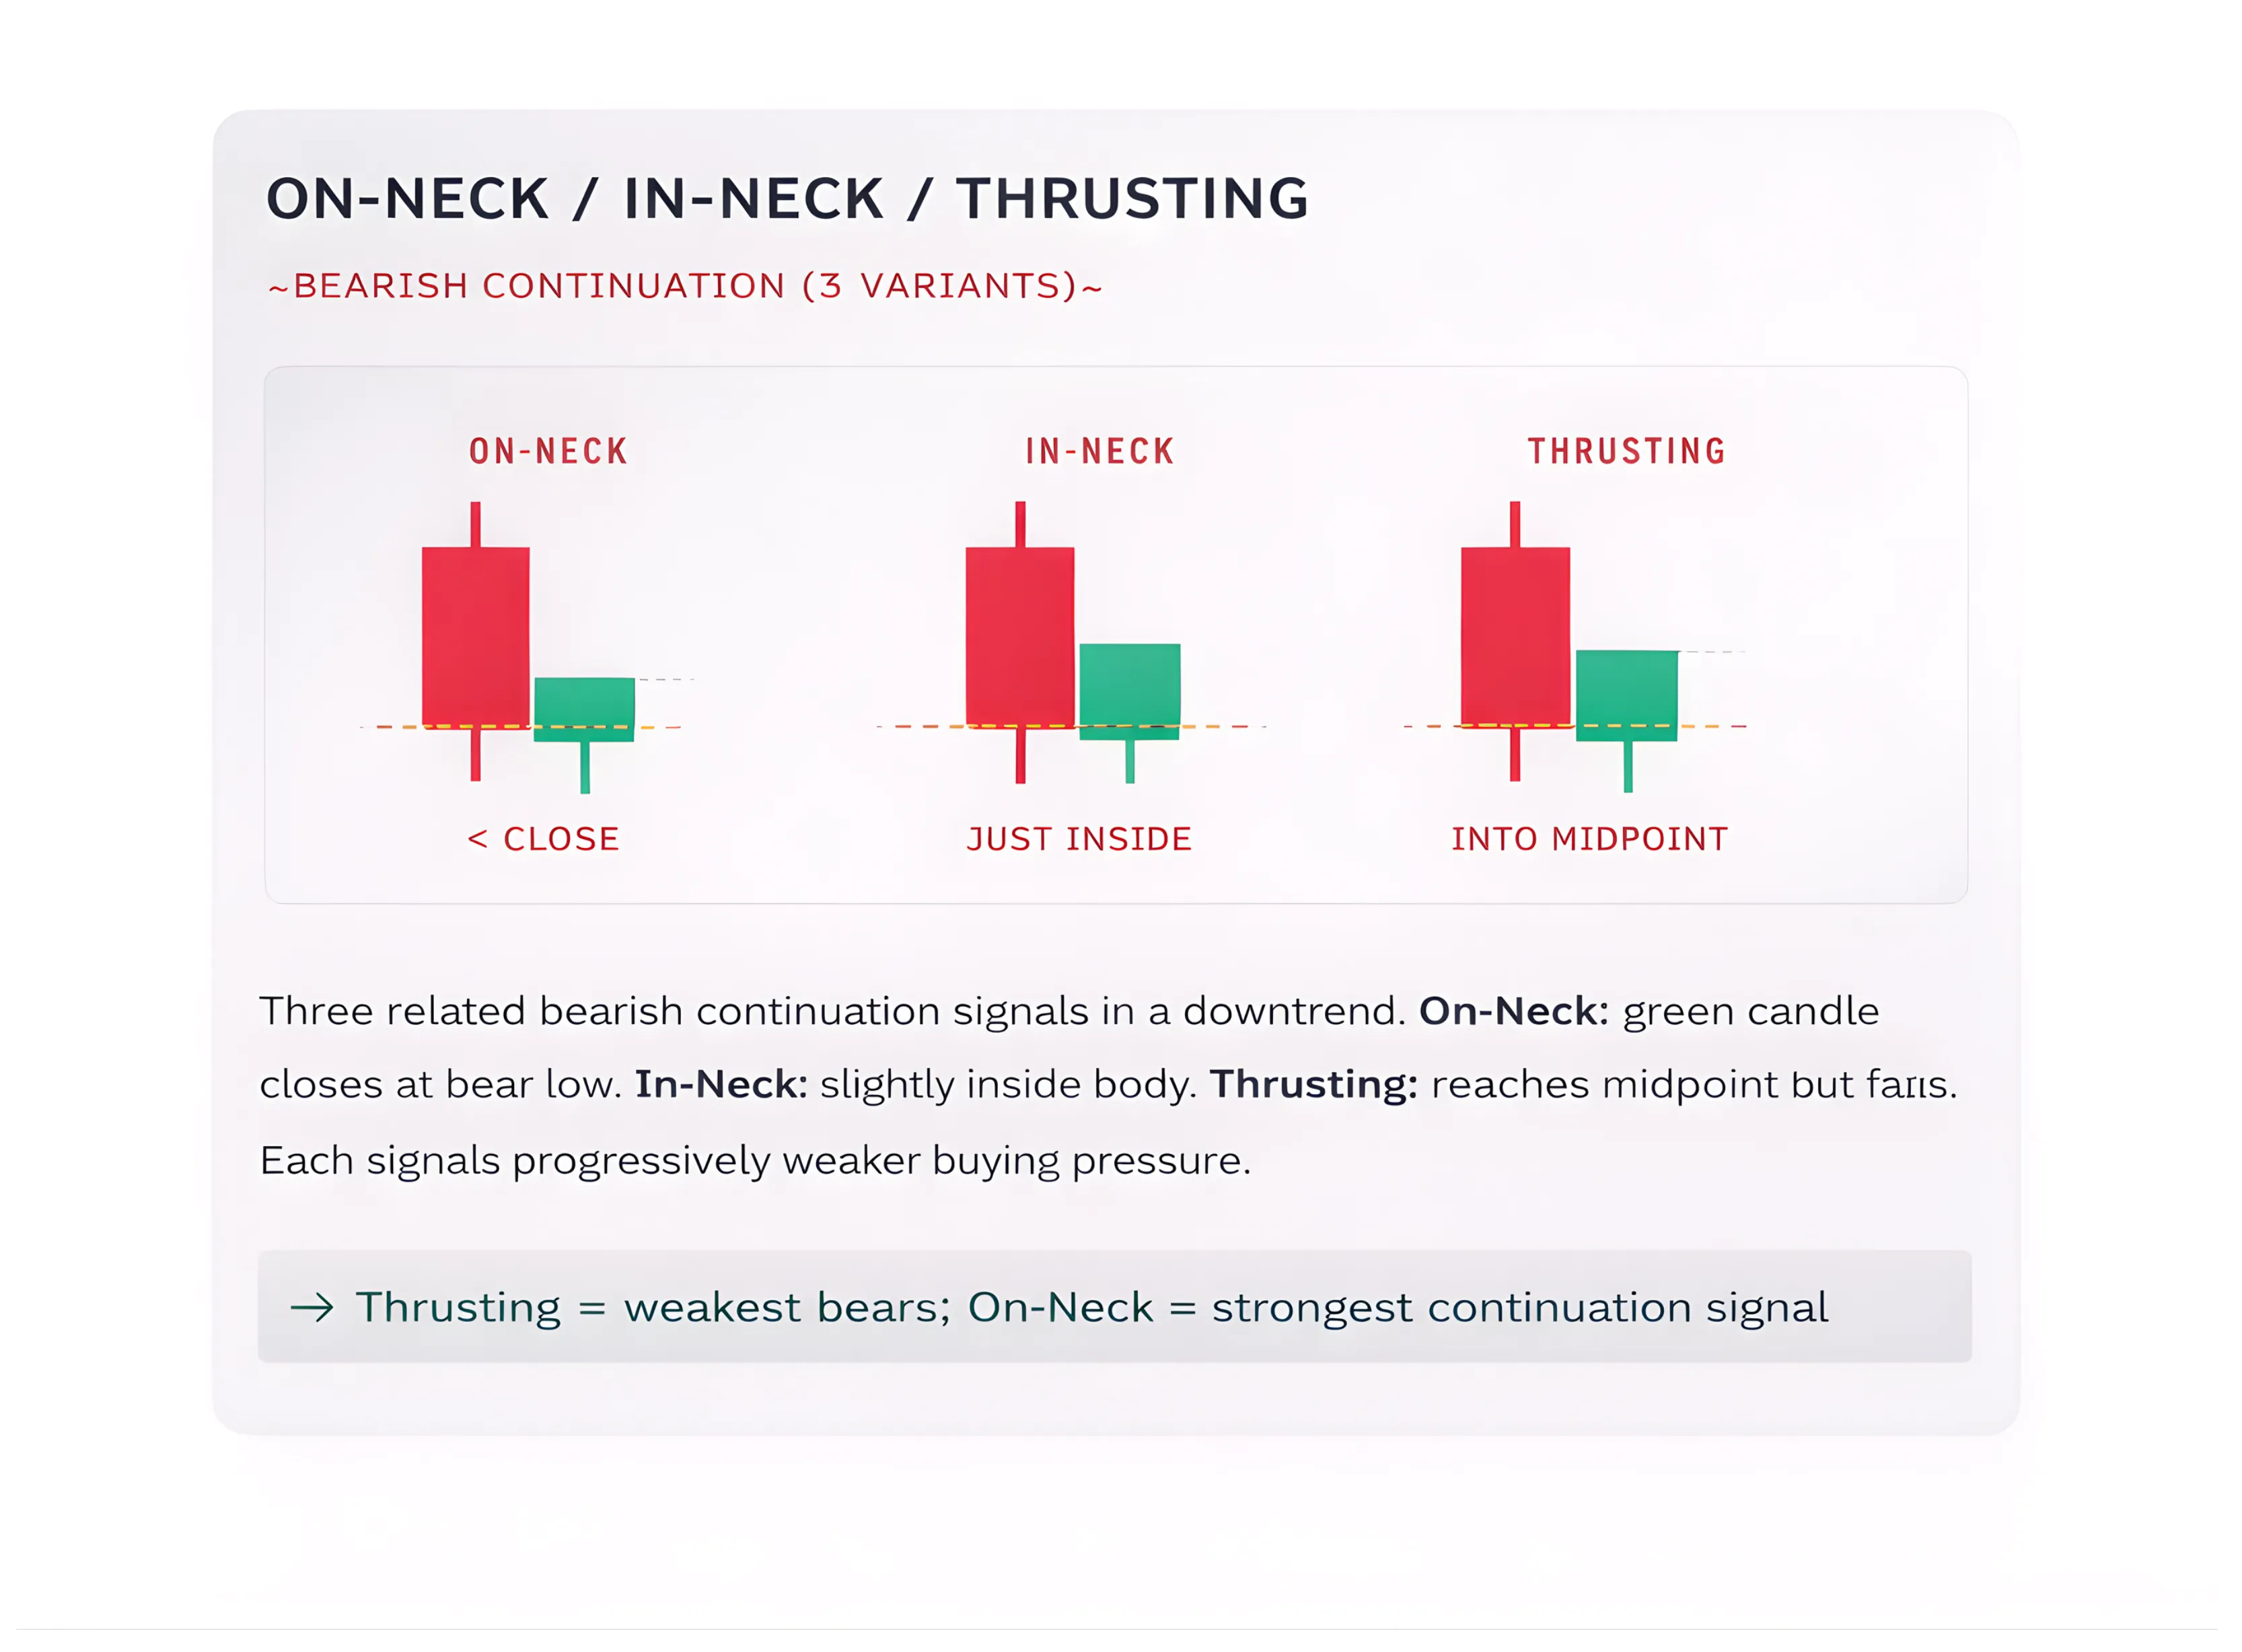
On-neck / In-neck / Thrusting line three separate but related patterns during downtrends. A red candle followed by a small green candle closing at, just above, or partially into the prior body respectively. The On Neck pattern signals the weakest bullish attempt; further downside likely remains. The In Neck pattern shows marginally better buying but is still corrective. The Thrusting Line pattern is the strongest of the three, signalling that the immediate downside may be nearly exhausted. Professionals use these distinctions to calibrate exactly how much trend remains before a real reversal.
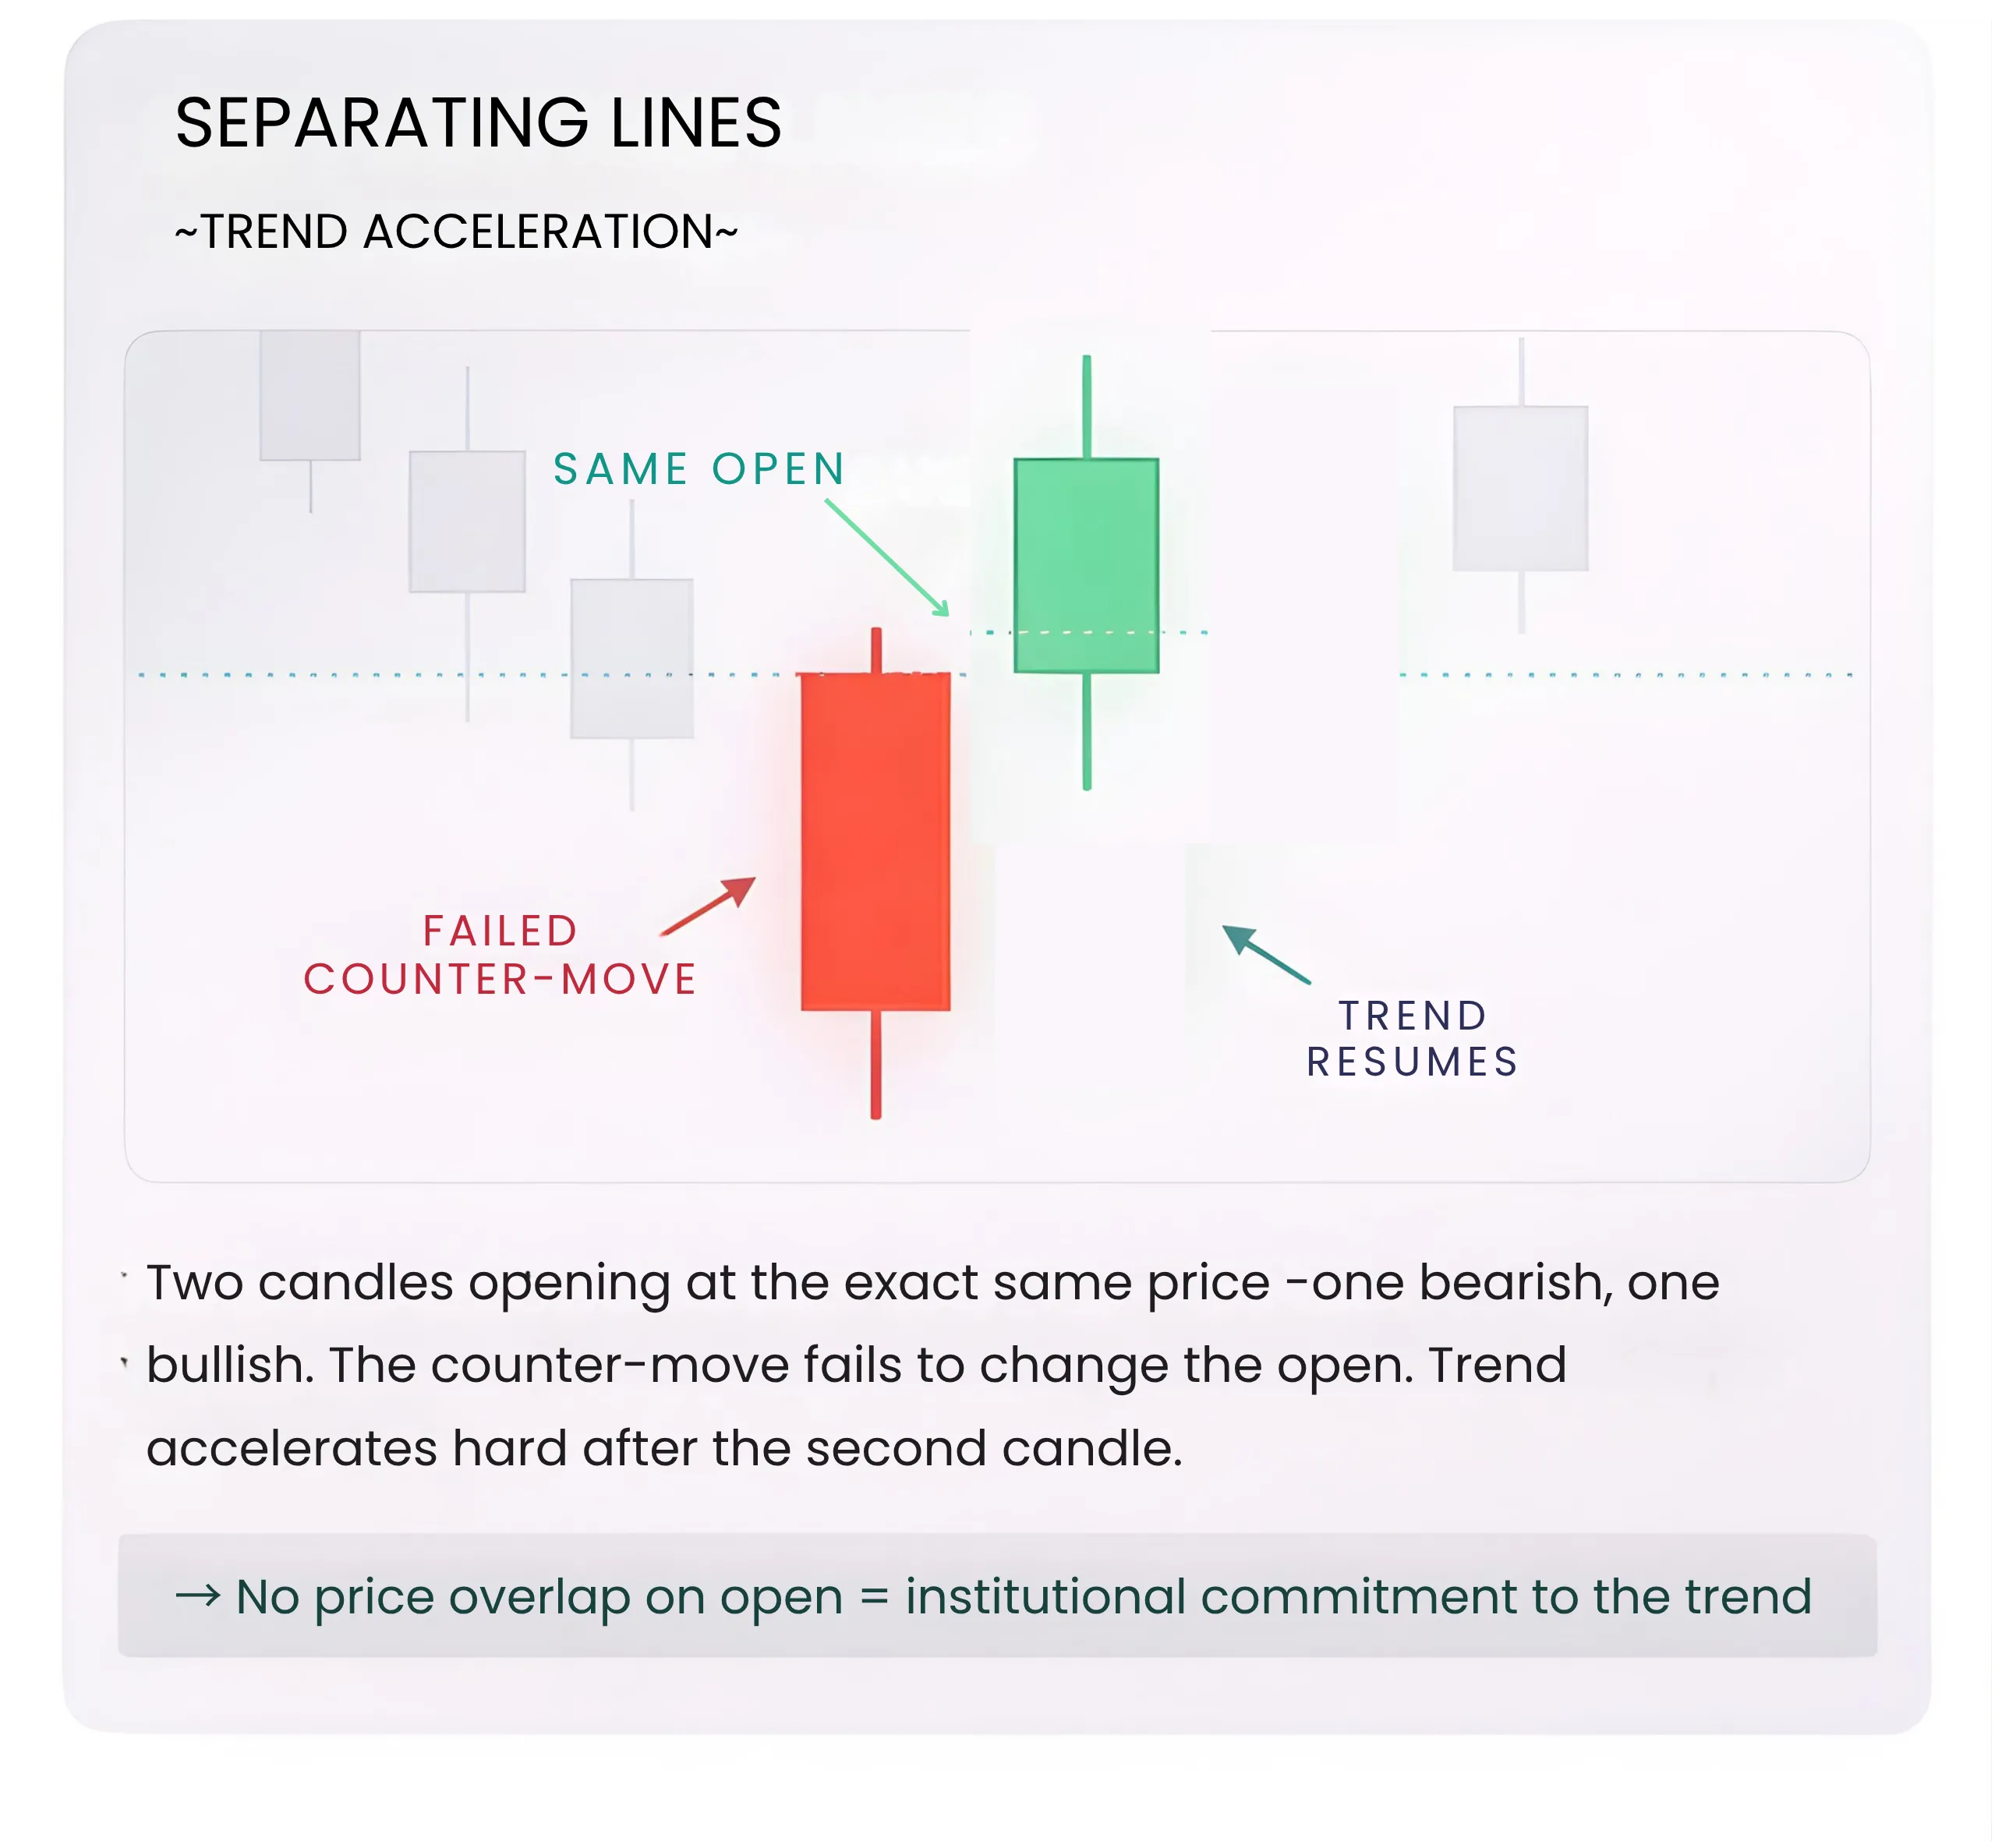
Separating lines Two candles opening at the exact same price but one bearish, one bullish. The Separating Lines pattern is especially powerful on weekly chart candlestick setups after consolidations.The failed counter-move opens at the exact same price, and the trend continuation candlestick fires immediately after, offering one of the cleaner entries in a resuming trend.
If you're serious about acting on these patterns without blowing up your account, this is the next read: Momentum Trading Risk Management India
Uncovering Institutional Footprints for High-Probability Trades
The vast majority of retail traders rely on common patterns like the Engulfing or Hammer, overlooking the nuanced signals that highlight where institutional money is truly positioned. This breakdown delves into sophisticated, lesser-known candlestick formations that are critical for identifying market turning points and acceleration zones with high confidence.
I. High-Confidence Reversal Patterns (Detecting Complete Exhaustion)
These formations are crucial for spotting the exact moment a trend is running out of steam, signaling an imminent, sharp price change.
| Pattern Name | Visual Structure & Mechanics | Institutional Interpretation & Confirmation |
|---|---|---|
| Ladder Bottom | A five-candle formation marking a potential bottom. It features three consecutive large bearish candles, followed by a fourth bearish candle with a long upper wick (indicating a failed attempt to push higher, but still closing low), and culminates in a strong, full-bodied bullish close. |
This is the signature of complete seller exhaustion. The long upper wick on the fourth candle is a shakeout attempt. The subsequent strong bullish close confirms the last sellers have capitulated and the smart money is entering aggressively. Contextual Example: The bottoming process in fundamentally strong stocks often exhibits this structure after a prolonged scare. |
| Kicker Pattern | A rare, two-candle powerhouse. The second candle opens at the exact same price level as the first (a gap), but immediately moves in the completely opposite direction of the first candle, resulting in no overlap between the two bodies. |
The ultimate institutional repositioning signal. It is almost always driven by surprise, high-impact news or a massive shift in core fund positioning. The lack of overlap signifies the market did not allow for a single transaction at a price level between the two bodies—a sign of immense conviction. Reliability is extremely high when spotted, especially on weekly or monthly charts. |
| Homing Pigeon | Two consecutive red (bearish) candles. The key is that the second bearish candle is entirely contained within the body of the first—it has a higher low and a lower high than the first. Both candles are bearish, yet the pattern is bullish. |
A subtle sign of seller momentum loss. Although the price continues to dip (both candles are red), the range and depth of the second candle are significantly constrained. This indicates sellers are becoming tentative and reluctant to push the price lower. Confirmation: Watch for a notable decline in volume on the second candle, which proves the diminished selling pressure. |
| Concealing Baby Swallow | A devastating four-candle bearish reversal pattern, typically found near market tops. Starts with two full-bodied Marubozu red candles (no wicks, high conviction selling), followed by a gap-down red candle with an upper wick that manages to reach back into the prior body, and finally, a fourth candle that fully engulfs the third. |
Signals institutions quietly distributing positions. The full Marubozu candles create a sense of strong downside momentum, trapping late shorts. The gap-down followed by the reaching wick and final engulfment is the mechanism for smart money to offload at slightly better prices before initiating the final, major drop. |
| Unique Three River Bottom | A three-candle bottom formation. Starts with a large bearish candle, followed by a small, doji-like bearish candle with a long lower wick (near the low of the first), and concludes with a small bullish candle that closes near the middle of the second candle's body. |
The most significant part is the middle candle—it shows a deep penetration of selling that is immediately rejected (long lower wick), yet the close is weak. Most retail traders ignore it because the bullish follow-through is small and unconvincing. Professionals recognize the deep rejection as a sign of seller exhaustion, anticipating the eventual aggressive breakout. |
II. Strategic Continuation Patterns (Identifying Trend Acceleration and Shakeouts)
These patterns are critical for traders holding positions, providing signals that the existing trend has merely paused or is deliberately shaking out weak hands before accelerating.
| Pattern Name | Visual Structure & Mechanics | Institutional Interpretation & Confirmation |
|---|---|---|
| Mat Hold | Appears deceptively like a reversal. Starts with a big bullish candle, followed by 2 to 3 small, overlapping pullback candles (often red), and finishes with a strong bullish candle that closes decisively above the high of the initial big candle. |
This is a classic shakeout and absorption phase. The small pullback candles terrify retail traders, prompting them to panic-sell their positions at a loss or break-even. Institutions use this low-volatility dip to absorb all the supply before initiating the second, more powerful leg of the rally. |
| Three-Line Strike (Bullish) | Begins with three consecutive bearish candles (creating a false sense of a developing downtrend), immediately followed by one massive bullish candle that fully engulfs the bodies of all three preceding candles. |
Statistically one of the highest win-rate continuation patterns across multiple asset classes (often >80% backtested reliability). The market engineers a deep "false bottom" with the three bearish candles to flush out weak longs and tempt new shorts, only to reverse violently, confirming the original upward trend's strength. |
| Tasuki Gap | A gap forms in the direction of the trend (e.g., upward gap), followed by a candle that moves in the opposite direction (e.g., a red candle) and tries to fill the original gap but fails to close below the gap's boundary. |
Aggressive institutional defense of a price zone. The gap itself marks a significant shift in value perception. The counter-move candle attempts to test the commitment of the new buyers. If the gap holds, it signifies a high-conviction continuation signal, as institutions have defended the original entry point. |
| Deliberation / Stalled Pattern | A series of three or more progressive bullish candles, where the third (and sometimes fourth) candle is noticeably smaller than the previous ones and often gaps slightly higher. |
This is a signal of momentum pausing, not necessarily reversing. The smaller body and gap indicate that the buying is less aggressive, allowing smart traders to tighten stops rather than exit entirely. It often precedes either a sharp continuation after a brief rest or one final, high-volume shakeout before the trend resumes. |
III. Indecision to Explosive Move Patterns (Identifying Coil Structures)
These patterns appear during periods of consolidation, highlighting price levels where opposing forces are balanced, leading to an imminent, sharp breakout.
| Pattern Name | Visual Structure & Mechanics | Institutional Interpretation & Confirmation |
|---|---|---|
| Stick Sandwich | A three-candle pattern where two candles of the same color (e.g., green/bullish) have an opposite-colored candle (red/bearish) sandwiched between them, with the crucial element being that the two outer candles close at the exact same price level. |
The matching close price acts as a powerful magnetic support/resistance zone. This price level has been repeatedly validated by both buyers and sellers as a point of equilibrium. When this forms near a key psychological or technical zone, the eventual breakout from the "sandwich" is typically sharp, sustained, and highly reliable. |
| On-Neck / In-Neck / Thrusting Line | Three related patterns occurring during a downtrend. A large red candle is followed by a small green candle, with the difference being where the green candle closes: On-Neck (closes exactly at the prior red candle's low), In-Neck (closes slightly into the prior red body), Thrusting Line (closes well into the prior red body, near the middle). |
These signals track progressively weaker selling pressure. The On-Neck is the weakest bullish attempt, suggesting further downside remains. The In-Neck shows slightly better buying but is still corrective. The Thrusting Line signals the strongest counter-move, indicating that the immediate downside may be exhausted and a reversal is closer. Professionals use these nuances to gauge the remaining duration of the downtrend. |
| Separating Lines | Two candles—one bearish, one bullish—that both open at the exact same price level. In an uptrend, the first is bearish and the second is bullish. |
Signals a failed counter-move and imminent acceleration. The bearish candle attempts to reverse the trend, but the very next candle opens at the same price (meaning the trend's conviction is immediately reasserted) and moves in the opposite direction. This often occurs after a period of consolidation, confirming that the dominant trend is about to resume with renewed vigor. |
These lesser-known formations help you read who is trapped, who is exiting, and who is building size quietly. Used with context, volume, and structure, they dramatically improve timing and risk control.
Mastering these high probability candlestick patterns is the next step beyond engulfing pattern basics and doji candlestick fundamentals. This is price action trading at an advanced level, where candlestick pattern technical analysis stops being about shape recognition and starts being about reading who is trapped, who is exiting, and who is building size. Fewer setups. Better timing. Bigger moves.
For traders applying these in Indian markets, the context holds just as well. Nifty candlestick patterns and Bank Nifty candlestick setups regularly exhibit Tasuki Gaps, Mat Hold structures, and Three-Line Strike formations on daily and weekly timeframes. Price action in India follows the same institutional logic — volume, structure, and zone confluence remain the primary confirmation tools. Technical analysis at this advanced level works across markets, and India's liquidity profile on index derivatives makes these candlestick pattern India setups particularly trackable.
Start your smart investing on CubePlus and take control of your financial goals.
Disclaimer: The information provided in our blogs is for informational purposes only and should not be construed as financial, investment, or trading advice. Trading and investing in the securities market carries risk. Always conduct your own research and consult with a qualified financial advisor before making any investment decisions. Past performance is not indicative of future results. Copyrighted and original content for your trading and investing needs.
© 2026 — Tradejini. All Rights Reserved.


