


Markets speak in patterns. If you have ever stared at a price chart and wondered whether there is a method to all the madness, you are not alone.
One of the lesser-discussed price action setups among traders is what some market participants refer to as the ‘Rain Drop’ pattern, a volatility compression cluster followed by a breakout.
Think of it this way. Imagine you are standing outside and you notice a single raindrop fall on the pavement. One drop means nothing. But when those drops begin to cluster, picking up pace, you know a storm is building. The Rain Drop pattern works on a similar philosophy in the stock market. It signals that momentum is quietly building, and a meaningful price move may be just around the corner.
The Rain Drop is a multi-candle pattern that essentially captures an exhaustion or indecision phase in the market, followed by a shift in directional bias. It typically appears as a sequence of small-bodied candles, often Doji or near-Doji formations, clustered together with little price progress, before a decisive breakout candle emerges. The pattern gets its name from the visual resemblance to raindrops collecting before a downpour (or, in a bullish version, before a surge upward).
While it is not as widely discussed as patterns like the Hammer or the Engulfing candle, experienced traders who incorporate it into their framework often find it a reliable precursor to trend reversals and momentum bursts, especially when combined with volume and broader market context.
The rain drop candlestick pattern is part of a broader family of candlestick chart patterns used in technical analysis India traders rely on. For those practicing price action trading, this formation offers insight into shifting market psychology without depending solely on lagging indicators.
Understanding the Structure
The Bearish Rain Drop
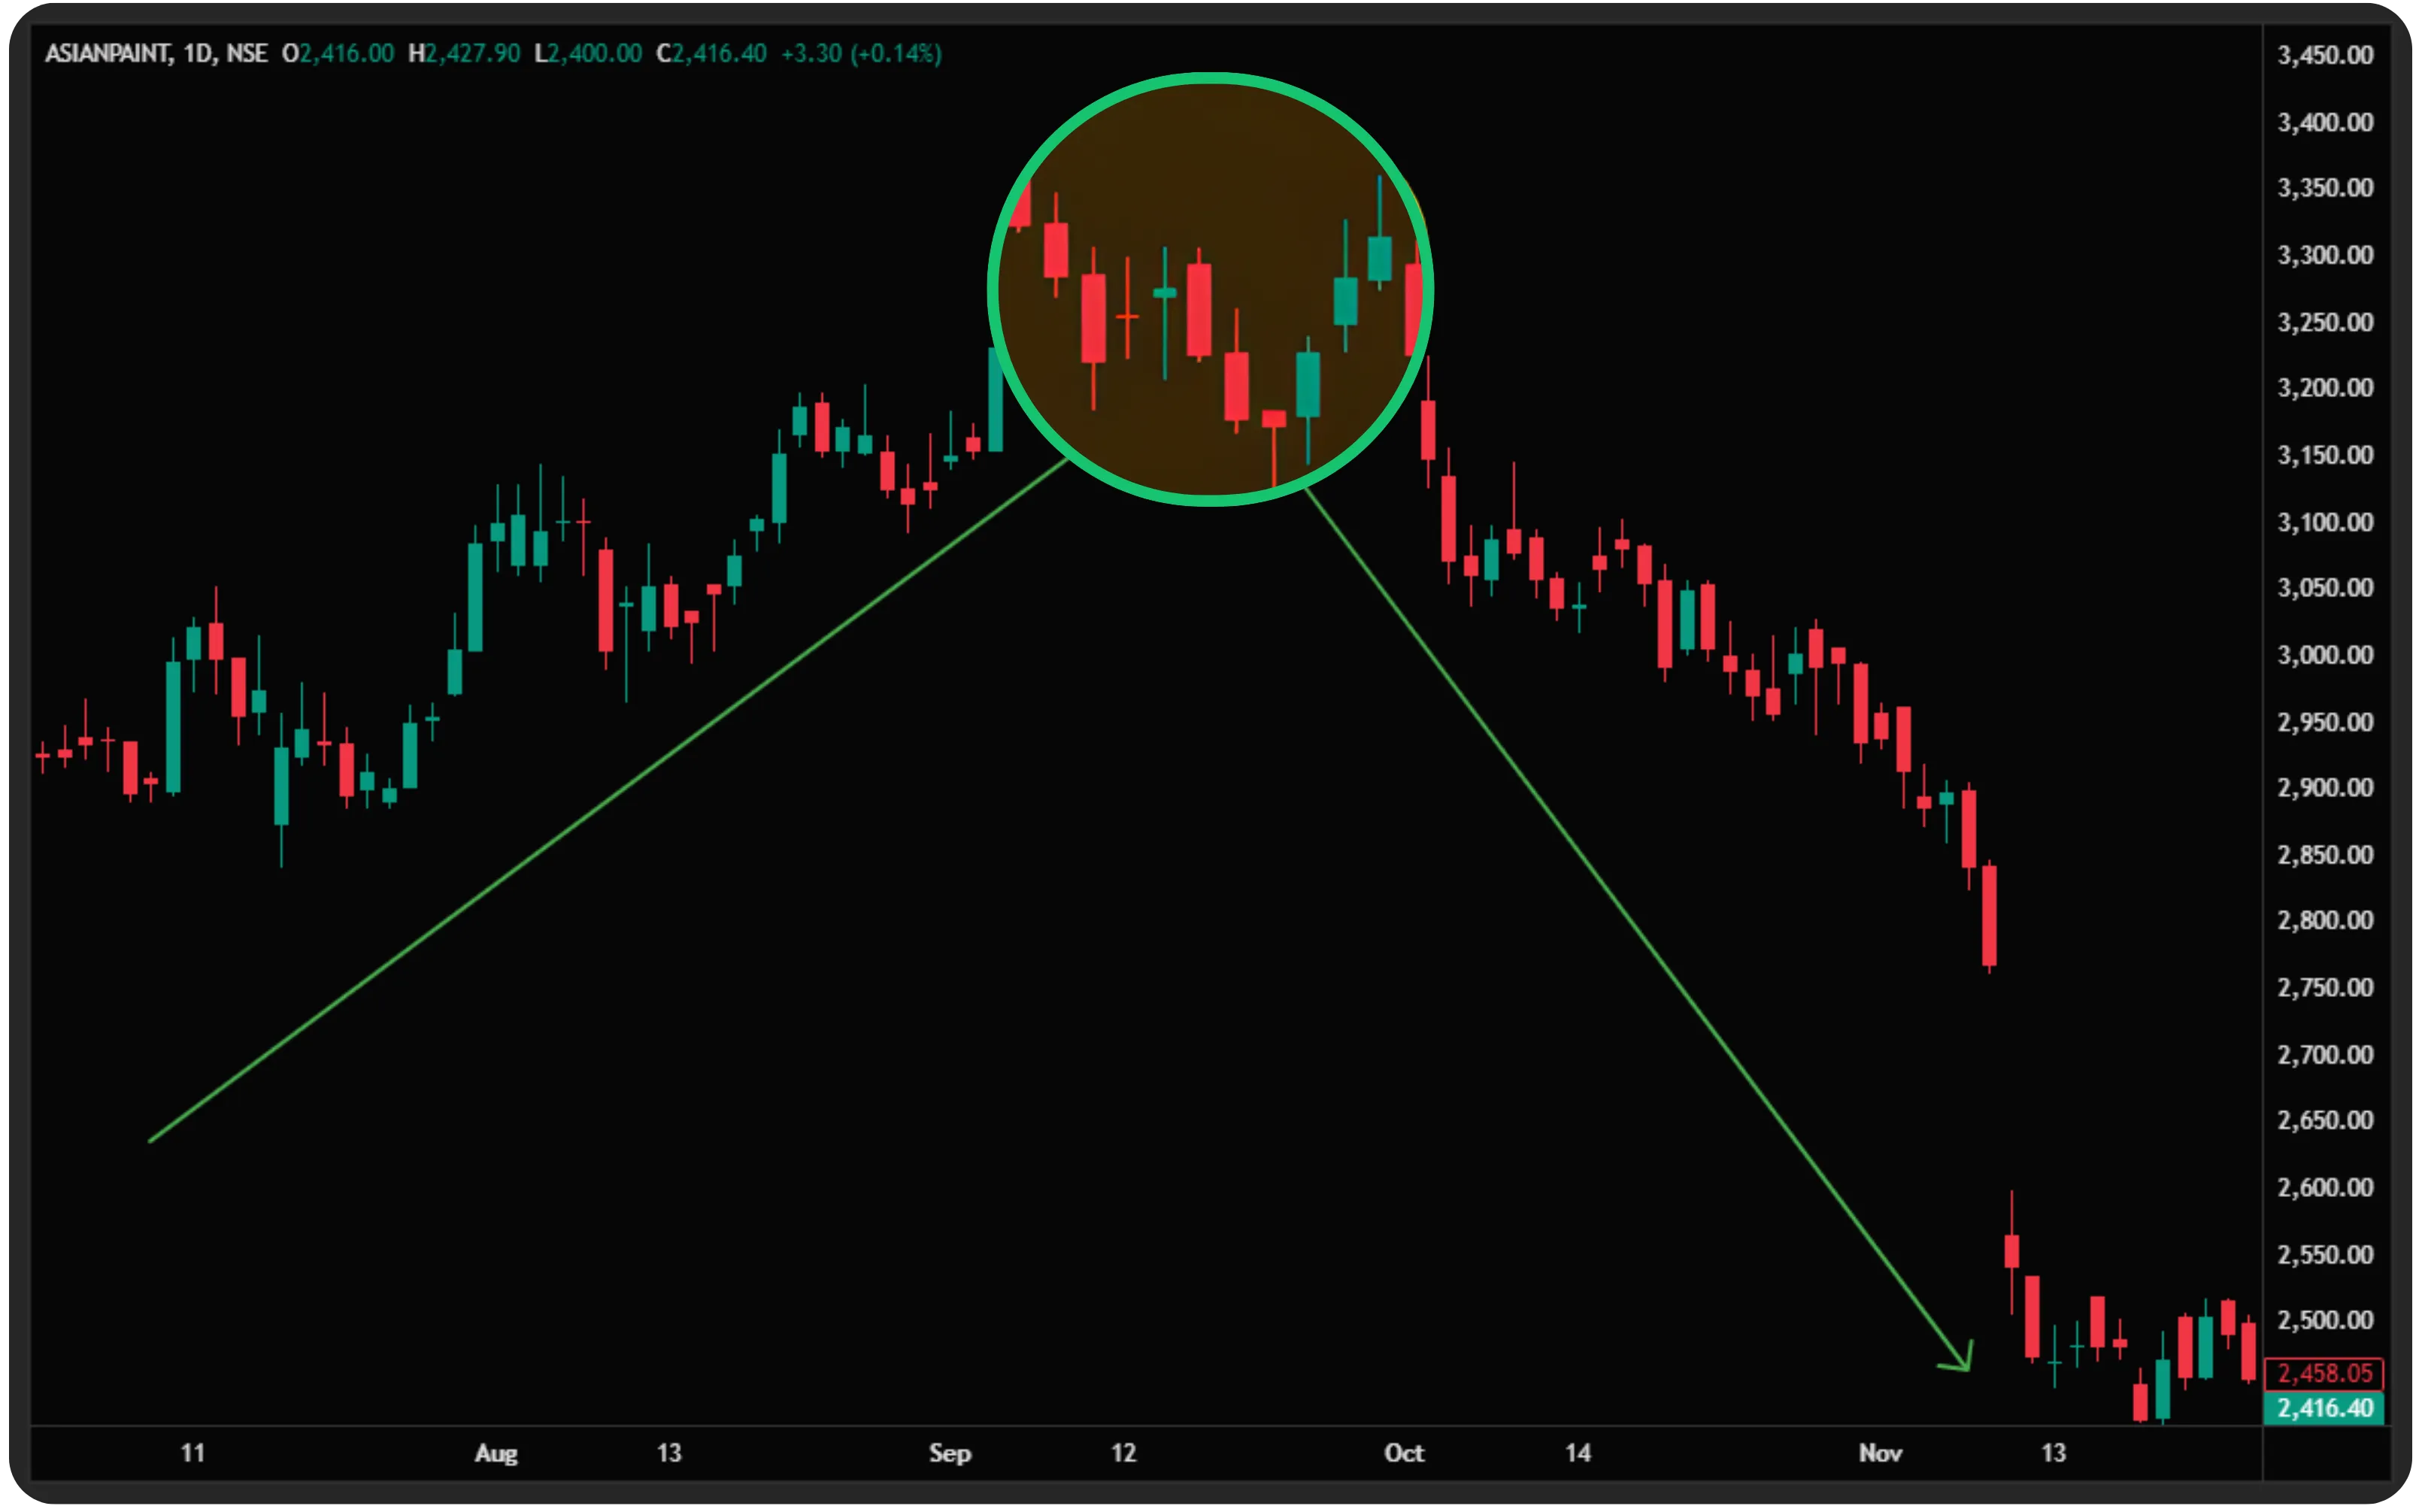
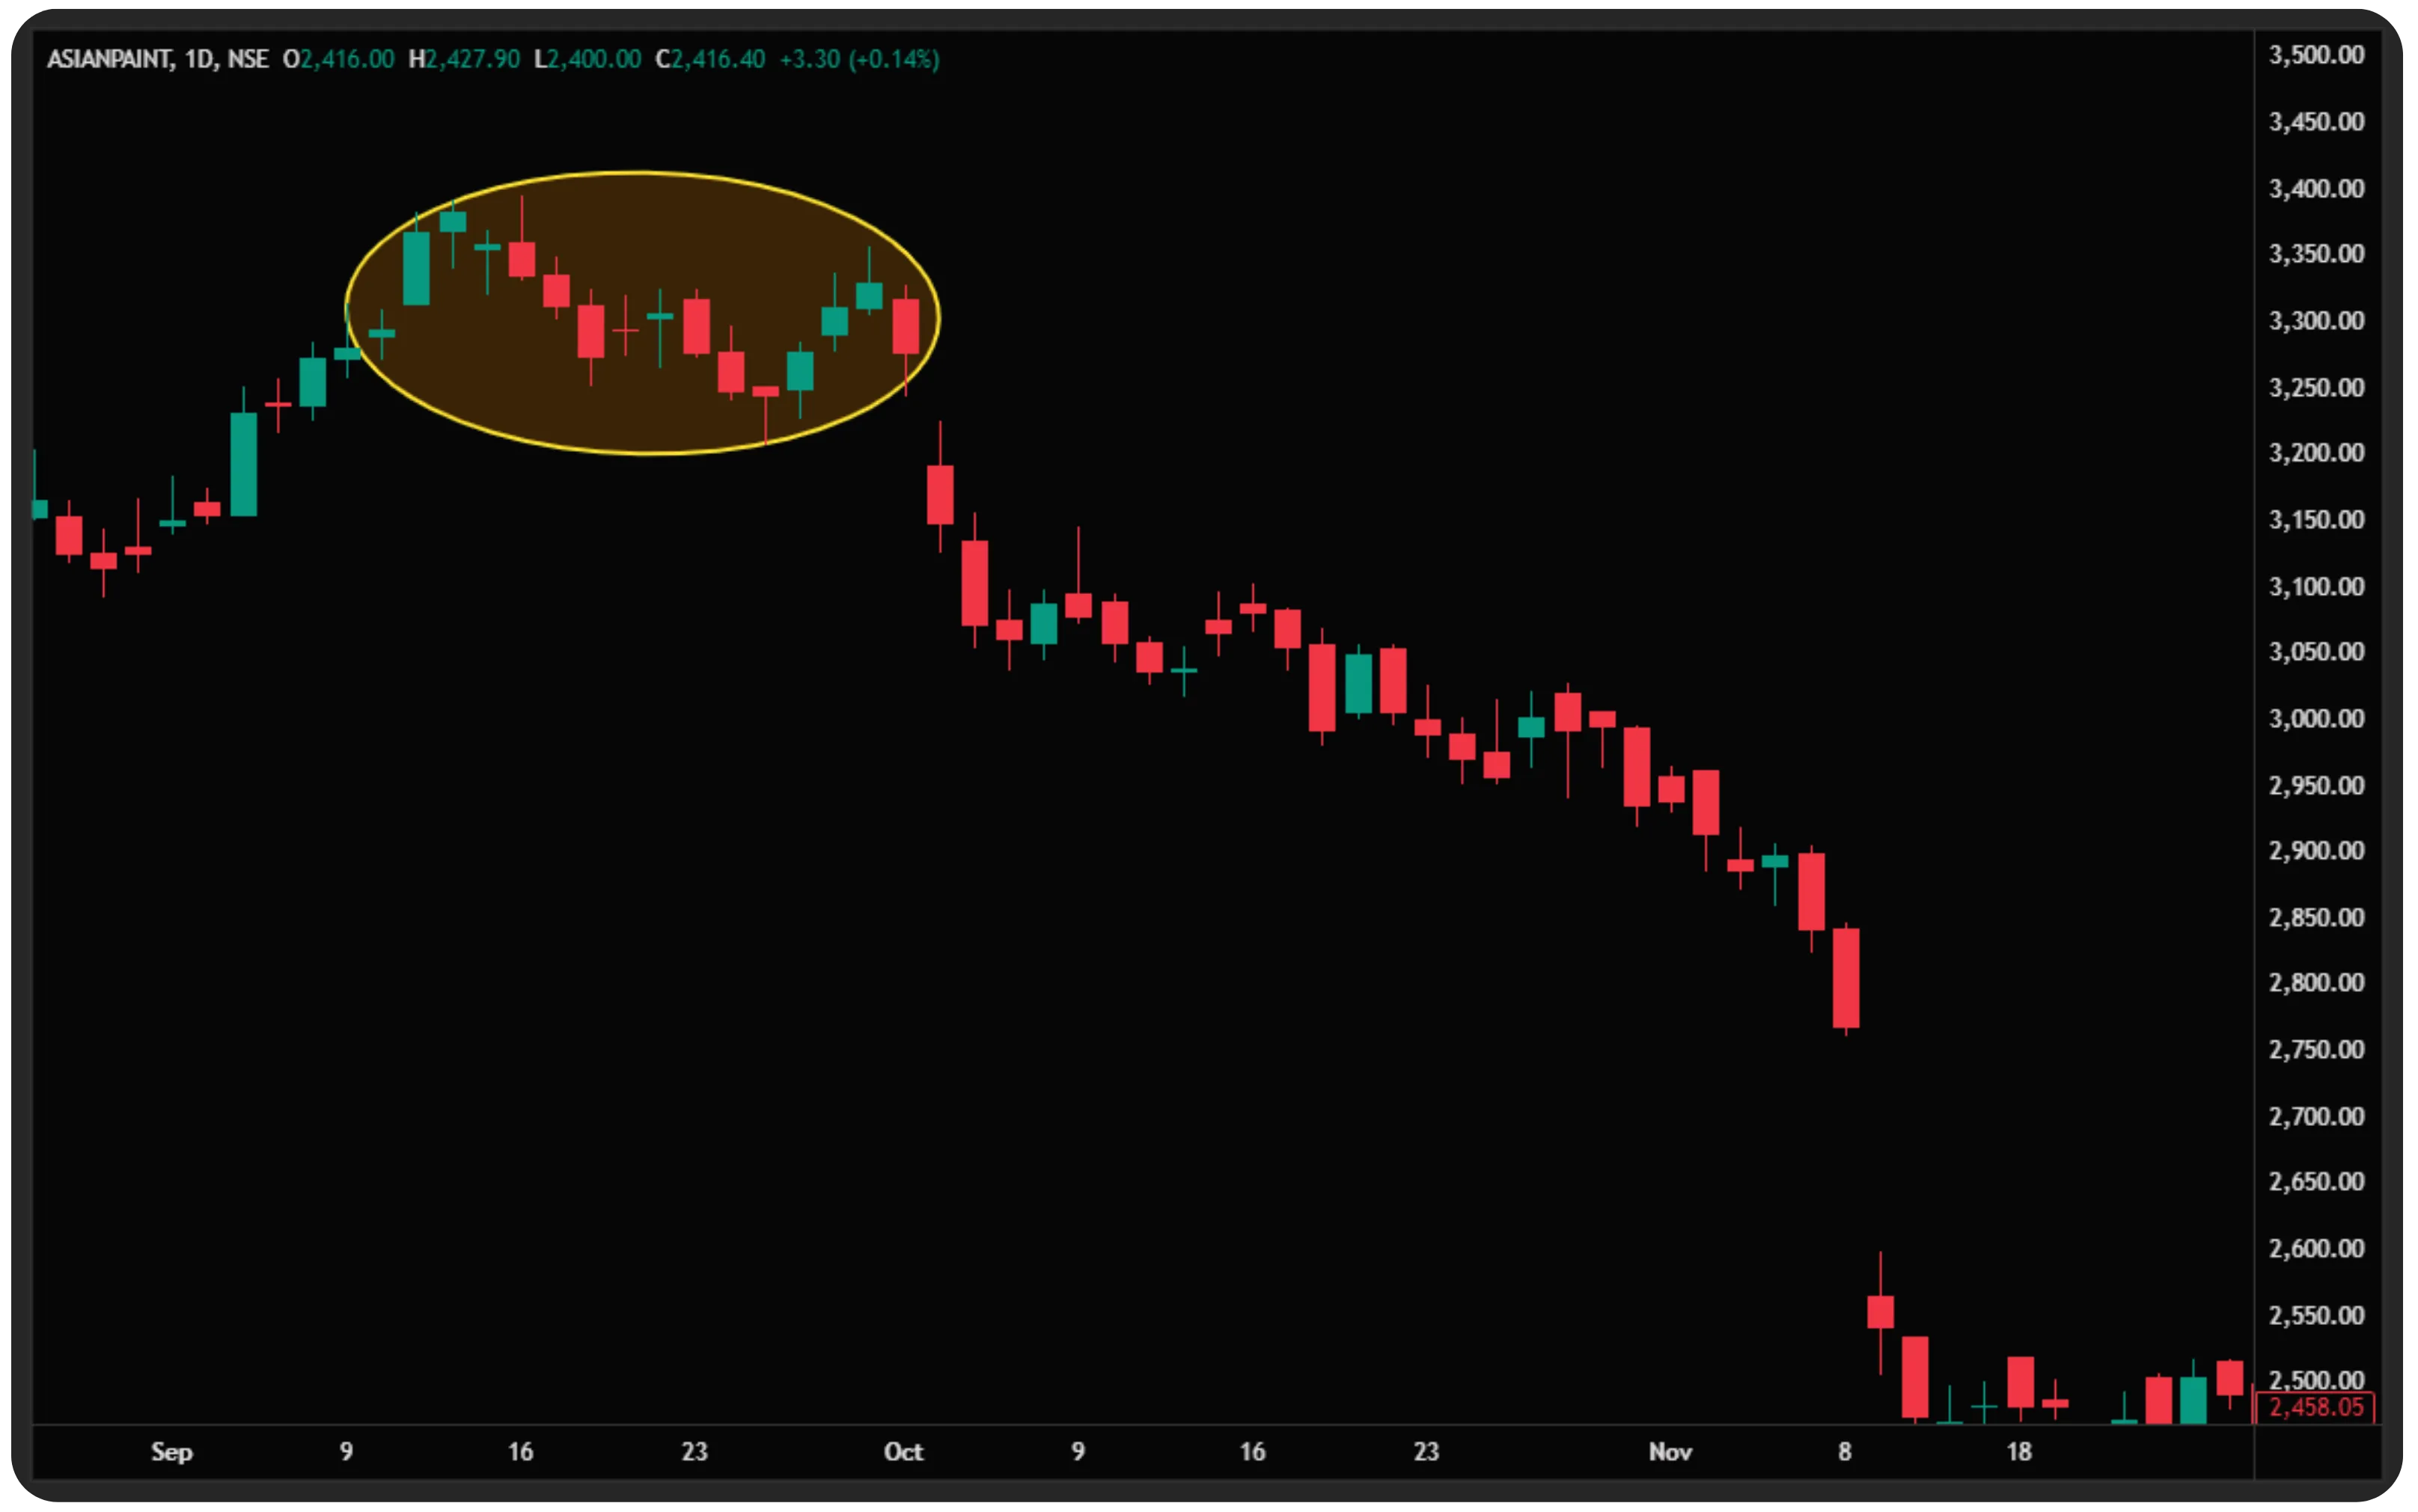
In a bearish Rain Drop, the market has been trending upward. Then, over the course of several sessions, you begin to see candles with tiny bodies, sellers and buyers are essentially neutralizing each other. Volume tends to be subdued. This is the ‘gathering of clouds.’ Then, a larger bearish candle forms, closing decisively lower than the indecision cluster. This is the rain finally falling, and it signals that the bulls have lost control.
The Bullish Rain Drop
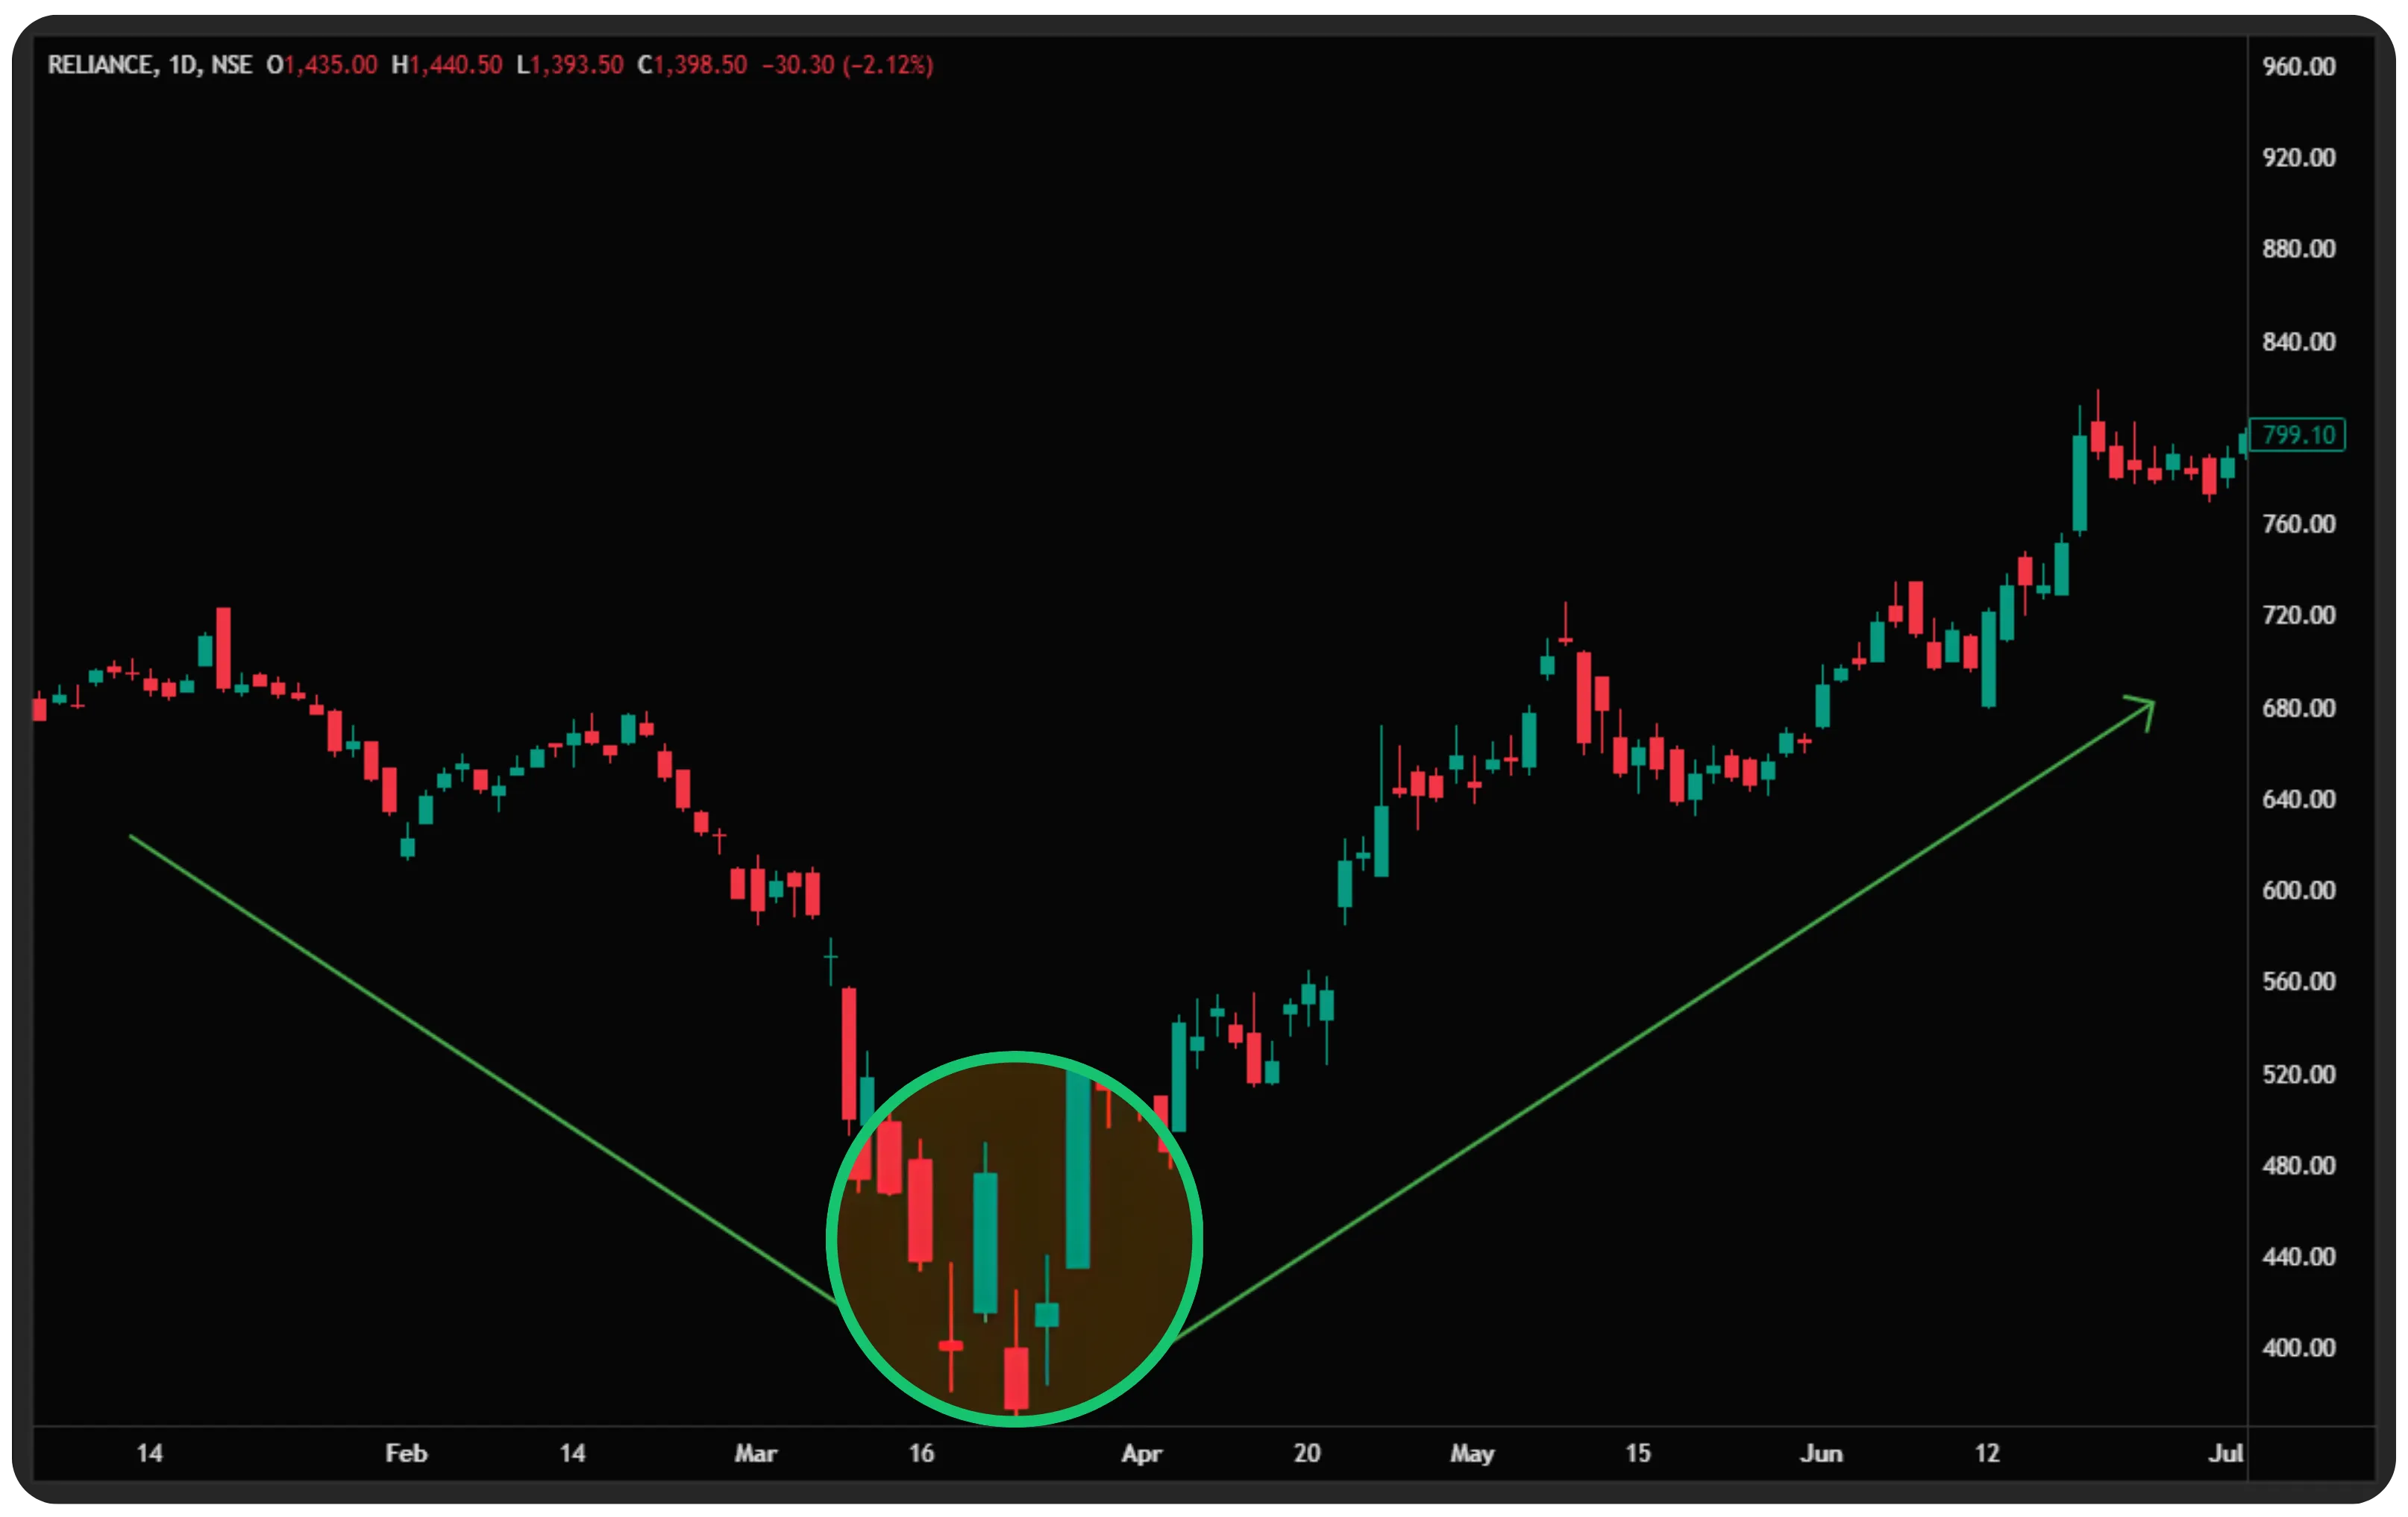
The bullish version works in reverse. After a downtrend or a significant decline, a cluster of small-bodied indecisive candles forms near a key support zone. Sellers are exhausted; buyers are slowly entering. Then a strong bullish candle breaks out above the cluster, confirming that momentum has shifted in favor of the upside.
The key elements you are always looking for in both variants are: a prior trend (up or down), a consolidation phase with small real-bodied candles (the ‘raindrops’), and a breakout candle with volume confirmation that seals the direction of the next move.
The Most Suitable Timeframes.. This Is Critical
One of the most important questions any trader asks about a candlestick pattern is: ‘On which chart should I look for this?’ The answer matters enormously, and with the Rain Drop pattern, the sweet spot lies in the daily and weekly timeframes for positional and swing traders, and the 15-minute to 1-hour charts for intraday traders.
Daily Timeframe
The daily chart is arguably the most reliable canvas for the Rain Drop pattern. Each candle represents a full day of price action, which means the indecision phase reflected in the cluster of small candles genuinely indicates multi-day tug-of-war between bulls and bears. A breakout from this cluster on the daily chart often leads to moves that can last several days to weeks, making it ideal for swing traders.
In the Indian stock market context, a daily Rain Drop pattern on a Nifty 50 component stock can translate into price moves of 5% to 15% over a few weeks, which is significant for traders looking to capture medium-term momentum.
Weekly Timeframe
The weekly chart version of the Rain Drop is gold for positional traders. When you see two to three weeks of doji-like candles clustered near a key level, followed by a breakout week with high volume, the move that follows can be substantial. These setups are rare, but when they appear, they tend to precede major trend changes. If you are a long-term trader in the Indian market, stocks like Infosys, HDFC Bank, or Tata Consultancy Services, weekly Rain Drops can give you early entry signals ahead of institutional accumulation.
15-Minute and 1-Hour Charts
For intraday traders on NSE or BSE, the 15-minute and 1-hour charts provide excellent opportunities. The indecision cluster tends to form during the first hour of trading or just after lunch when volatility dips, and the breakout candle often arrives during power hour, the final hour before market close. Futures and options traders who work with Nifty 50 or Bank Nifty frequently exploit Rain Drop setups on these shorter timeframes.
A word of caution: On very short timeframes such as 1-minute or 3-minute charts, market noise increases significantly, which can reduce the reliability of breakout-based setups.
How to Trade the Rain Drop Pattern
Step 1 — Identify the Prior Trend
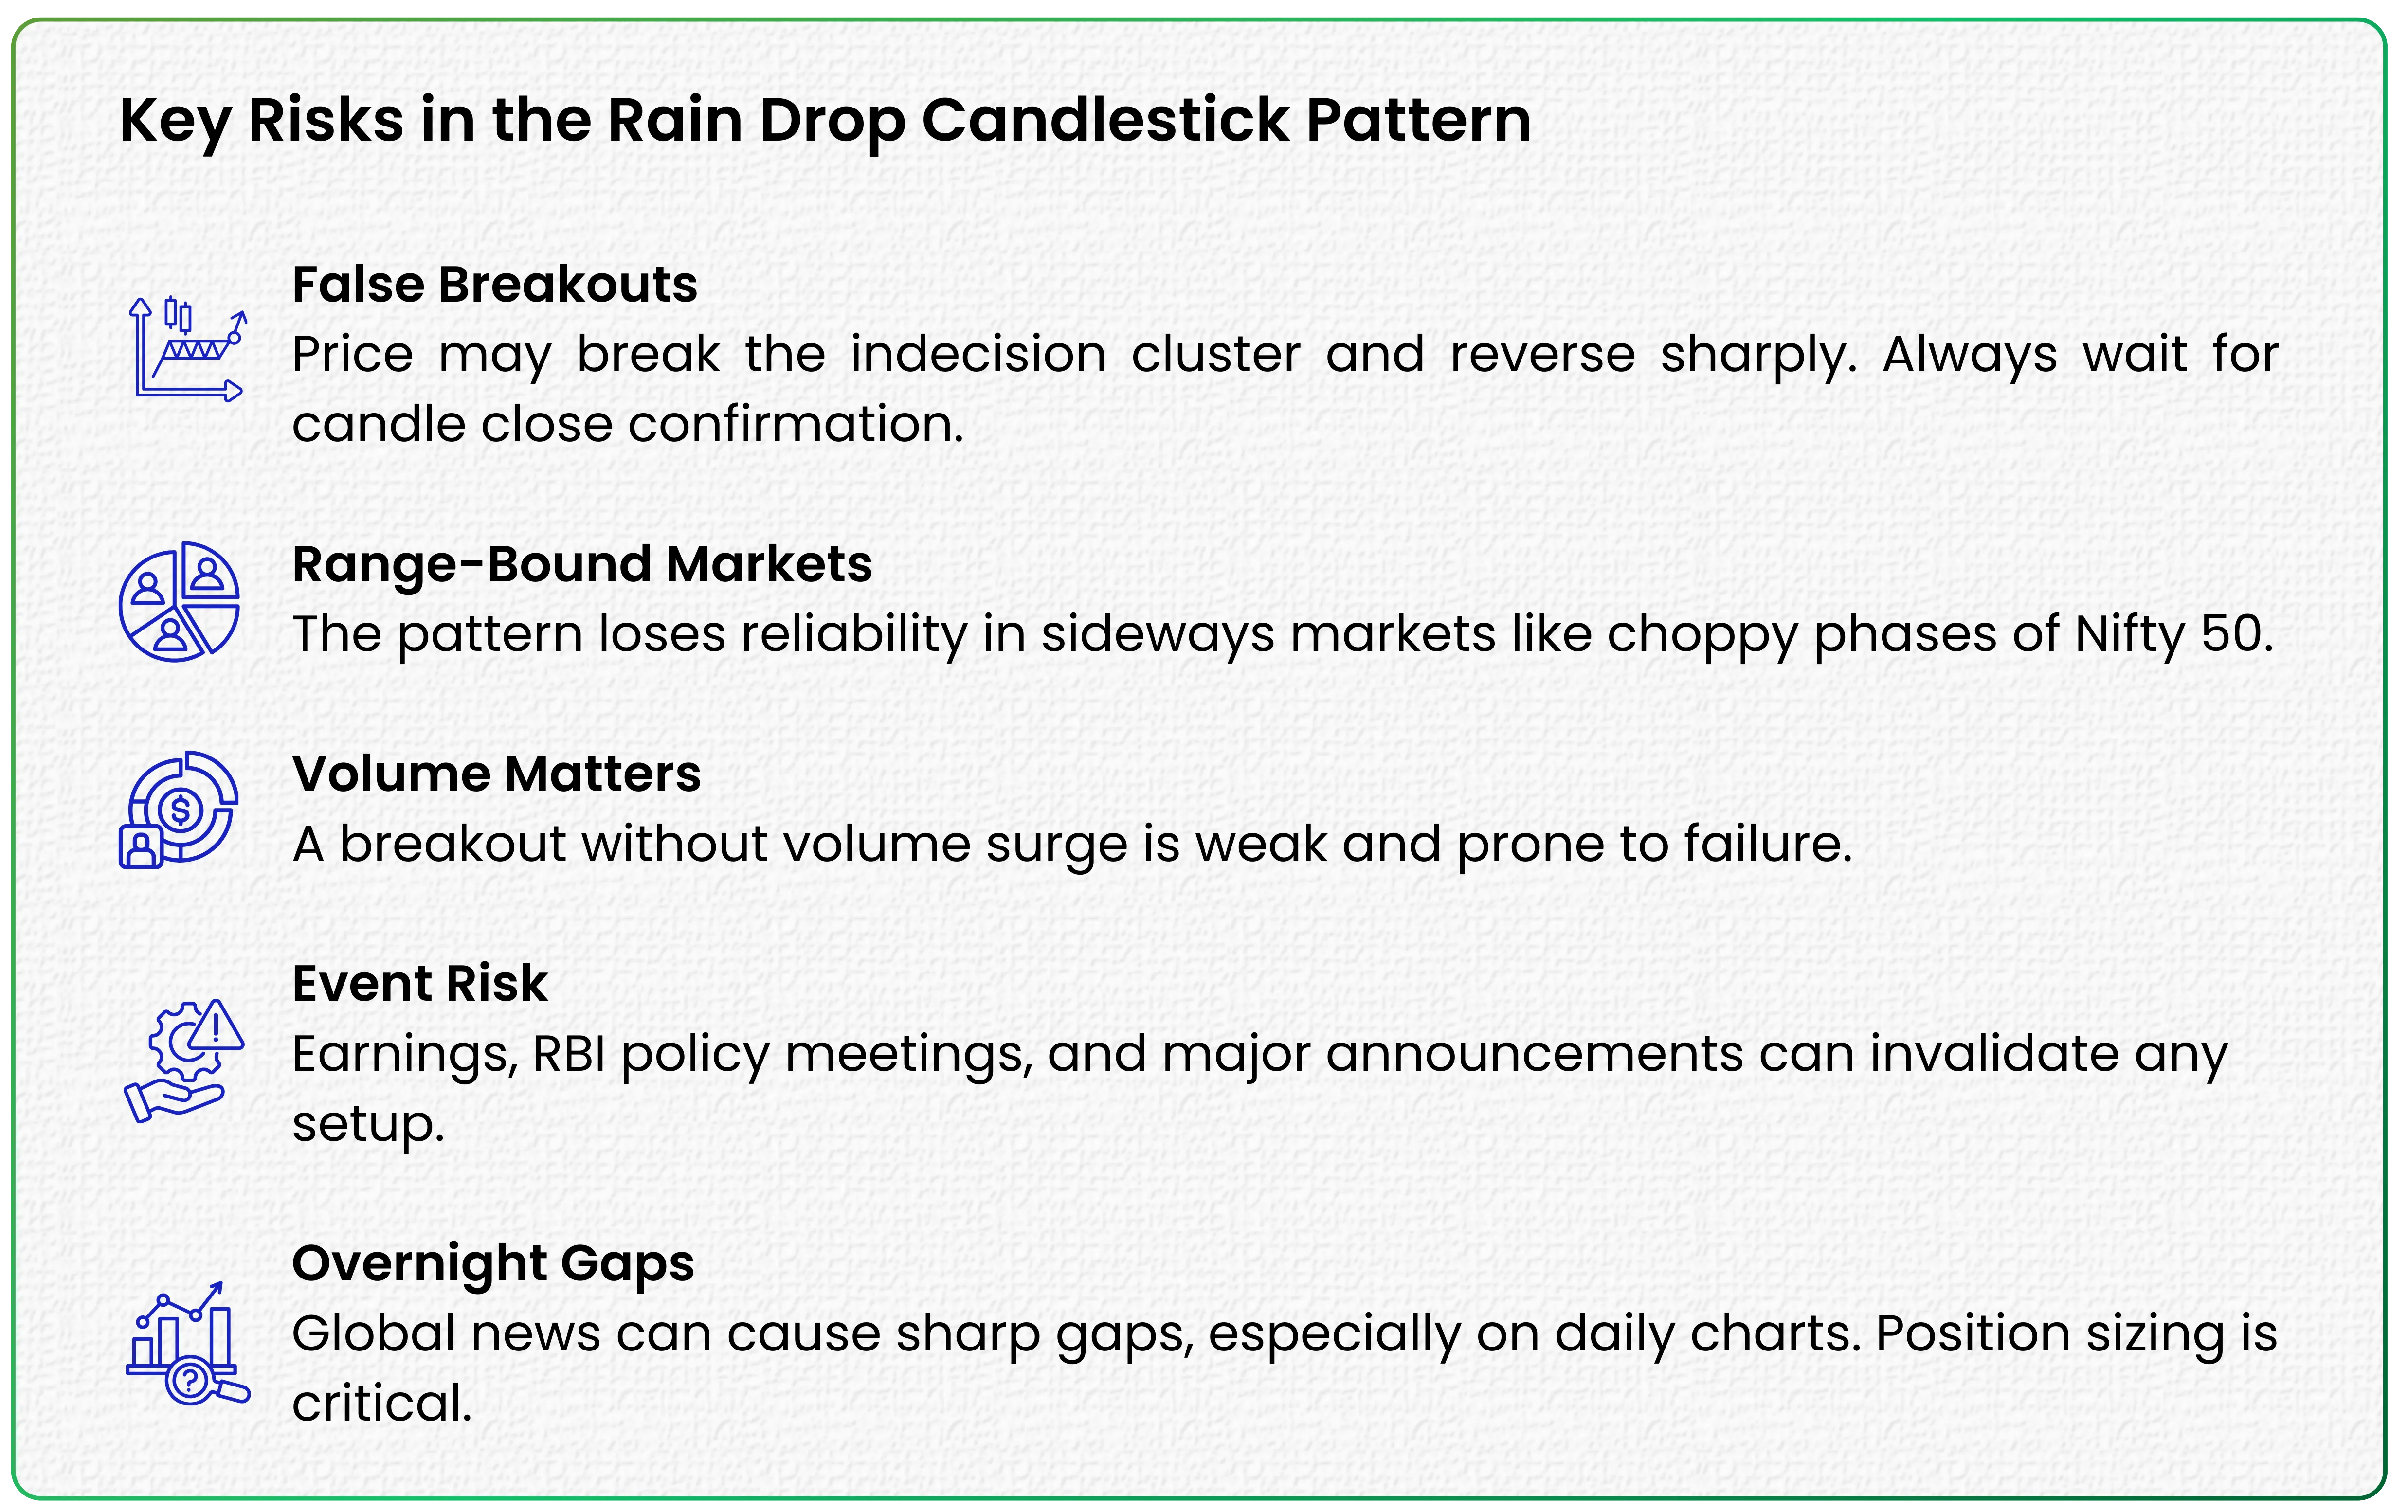
Before you even look for the cluster of indecision candles, establish whether there is a clear prior trend. A bullish Rain Drop only makes sense if there was a meaningful downtrend before it. A bearish Rain Drop only holds weight if there was a prior uptrend. Trading this pattern in a sideways, range-bound market without a clear trend dramatically reduces its effectiveness.
Step 2 — Spot the Indecision Cluster
Look for two to five consecutive candles with small real bodies. These can be dojis, spinning tops, or any candle where the open and close are very close to each other. The key is that price is going nowhere, it is coiling. Ideally, this cluster should form near a significant technical level: a support zone, a resistance zone, a moving average, or a Fibonacci retracement level.
Step 3 — Wait for the Breakout Candle
Patience is a virtue here. Do not jump in during the indecision cluster phase. Wait for the decisive candle that breaks out of the cluster's range. For a bearish Rain Drop, this would be a strong red candle closing below the cluster's low. For a bullish Rain Drop, a strong green candle closing above the cluster's high. The breakout candle should ideally be accompanied by a spike in volume, that is your confirmation that institutional money is moving.
Step 4 — Entry, Stop Loss, and Target
Entry: Enter on the close of the breakout candle, or on the next candle's open if you missed the close.
Stop Loss: Place your stop loss just beyond the opposite end of the indecision cluster. For a bullish breakout, your stop goes just below the lowest wick of the cluster. For a bearish breakout, just above the highest wick.
Target: Use a minimum risk-reward ratio of 1:2. Measure the height of the indecision cluster and project that distance as a minimum target from the breakout point. Alternatively, use the next key support or resistance level as your target.
Case Study
Let us assume a hypothetical but realistic scenario with Reliance Industries Limited (RIL), one of the most traded stocks on the NSE.
Imagine RIL has been in a strong uptrend, moving from Rs. 1,400 to Rs. 1,900 over a couple of months. Then, over five trading sessions, the stock begins to form candles with very small bodies, one day up marginally, the next day down marginally, with wicks on both sides. The stock is essentially stuck between Rs. 1,870 and Rs. 1,910. Volume is drying up. This is the Rain Drop cluster forming at the top of a rally.
On the sixth session, RIL opens near Rs. 1,890 but selling pressure builds through the day. By close, it has fallen to Rs. 1,820 a convincing close below the cluster's support. Volume jumps to nearly 1.5 times the average. This is the bearish Rain Drop completing itself.
A trader who identified this pattern could have entered a short position around Rs. 1,820, placed a stop loss at Rs. 1,915 (just above the cluster's high), and targeted Rs. 1,630 a level corresponding to the prior consolidation zone. That is a potential gain of Rs. 190 per share against a risk of Rs. 95, giving a healthy 2:1 risk-reward ratio.
Enhancing the Pattern with Other Tools
The Rain Drop pattern is most powerful when it does not stand alone. Combine it with the Relative Strength Index (RSI) to check if the breakout is happening from an overbought or oversold zone. Use Bollinger Bands to see if the indecision cluster is forming near a band squeeze, a classic sign of compressed volatility about to explode. Moving averages like the 20-day EMA or the 200-day EMA can act as natural targets or barriers for the move following the breakout.
For Indian traders working with derivatives, pay attention to Open Interest data alongside the Rain Drop setup. Rising Open Interest on the breakout candle adds another layer of confirmation that fresh positions are being built in the direction of the breakout rather than existing positions being squared off.
Trade Smarter with Tradejini Cube Plus
Spotting Rain Drop setups across multiple stocks manually can be time-consuming and inefficient. Tradejini Cube Plus simplifies this process with advanced charting tools that allow you to scan, analyse, and track candlestick patterns across timeframes with ease.
You can create custom screeners to identify consolidation clusters, overlay volume, RSI, and moving averages for confirmation, and execute trades instantly with one-click bracket orders. For intraday traders in Nifty, fast execution can make all the difference.
Cube Plus also offers trade analytics and journaling tools to help you review performance and refine your strategy over time. Whether you trade swing setups or intraday breakouts, the platform gives you the speed and structure needed to act with confidence.
Spot the pattern. Seize the move and trade confidently on CubePlus.
Disclaimer: The information provided in our blogs is for informational purposes only and should not be construed as financial, investment, or trading advice. Trading and investing in the securities market carries risk. Always conduct your own research and consult with a qualified financial advisor before making any investment decisions. Past performance is not indicative of future results. Copyrighted and original content for your trading and investing needs.
© 2026 — Tradejini. All Rights Reserved.