


Momentum trading is a widely used approach in financial markets that focuses on identifying stocks showing strong directional price movement. The basic premise is straightforward: securities that are moving decisively in one direction tend to continue doing so for a period. This idea, often captured by the phrase ‘the trend is your friend,’ underpins many professional trading strategies across global markets, including India.
In the Indian context, momentum is reinforced by structural factors such as high retail participation, the influence of foreign institutional flows, frequent sector rotation, and phases of elevated volatility. Once trends emerge, these dynamics can sustain price movement, making momentum-based strategies effective for aligning with prevailing market direction rather than attempting time reversals. Understanding sector rotation trends Nifty 50 becomes essential, as leadership often shifts between defensives and cyclicals based on macro cues, earnings visibility, and policy direction.

Momentum is also closely tied to market psychology. Positive developments can attract incremental buying interest, reinforcing upward price movement, while negative news can trigger sustained selling pressure. Understanding how prices respond to these evolving demand and supply forces lies at the core of momentum trading.
Science Behind Momentum, Why It Persists?
Momentum is not merely a trading belief; it is supported by long-term academic research across markets, timeframes, and asset classes. Several behavioural and structural factors explain its persistence.
Behavioural biases play a key role. Investors often underreact to new information initially and respond more strongly only after trends become visible. These patterns are reinforced by behavioral biases in momentum trading, where delayed reactions and herd behaviour contribute to price continuation. In the Indian market, this pattern is frequently observed during earnings seasons. Stocks such as Infosys or TCS may not fully reflect earnings surprises immediately, instead trending higher over days or weeks as analyst revisions, institutional activity, and broader investor attention build.
Institutional flows also contribute to sustained momentum. Large investors, including mutual funds and FPIs, deploy capital in phases due to liquidity and size constraints. When allocations shift toward India or specific sectors such as banking or IT, the resulting buying or selling pressure tends to persist. The extended market uptrend during 2020–2021, supported by strong FPI inflows, is a clear example.
Information diffusion occurs unevenly across participants. Policy initiatives, sectoral tailwinds, or company-level changes are absorbed gradually. When the Production Linked Incentive (PLI) schemes were announced, beneficiary stocks did not react uniformly on day one. Momentum developed over time as investors assessed implications and identified winners.
Explore, an all-in-one analysis platform for informed trading decisions.
Identifying Momentum
Trading momentum effectively requires objective tools to measure price strength and trend continuation. Technical indicators play a central role here, and platforms such as Tradejini Cube Plus technical indicators provide access to a wide range of these indicators within a single interface.
Relative Strength Index (RSI)
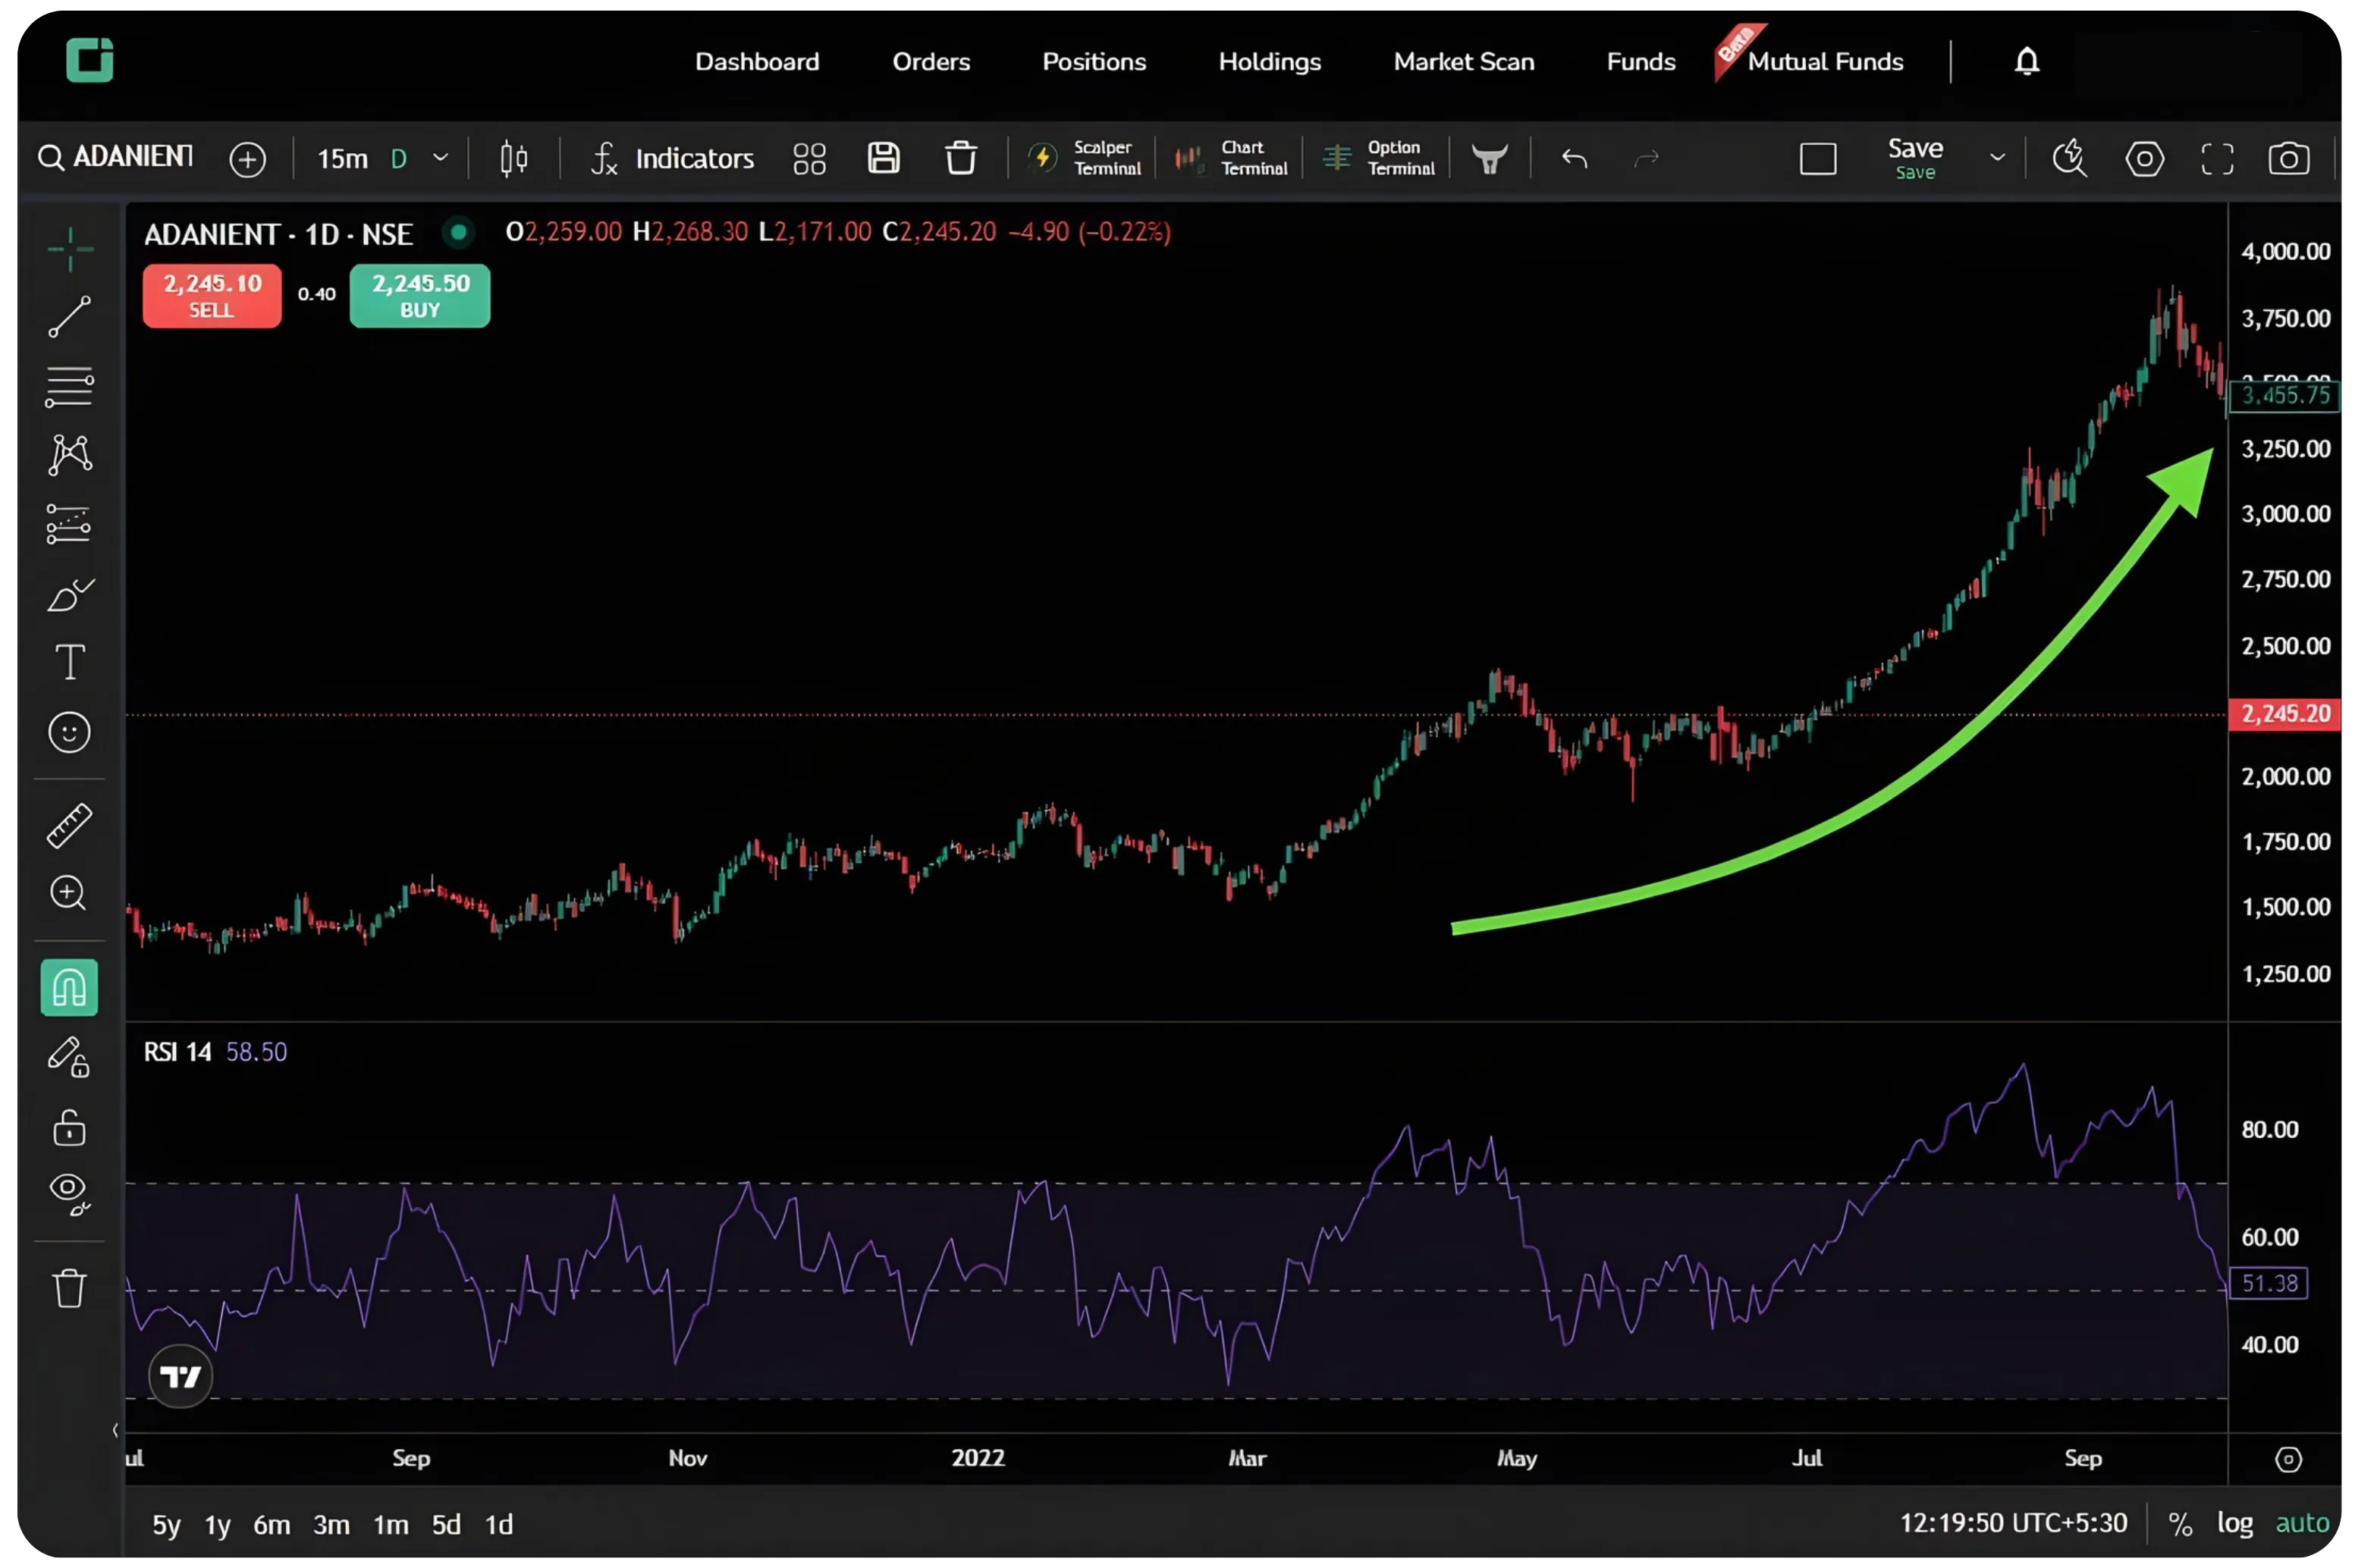
RSI measures the speed and magnitude of price changes on a scale of 0 to 100. While RSI values above 70 are traditionally viewed as overbought, momentum traders interpret them differently. In strong uptrends, RSI can remain elevated for extended periods, reflecting sustained buying interest rather than imminent reversal.
*Rather than treating overbought levels as exit signals, experienced traders focus on RSI momentum trading levels, where sustained readings above 60–70 confirm trend strength instead of reversal risk.
During Adani Enterprises’ rally in 2021–2022, RSI frequently stayed above 70, confirming trend strength. More meaningful signals often emerge through divergences, where prices make new highs but RSI fails to do so, indicating weakening momentum.
Tradejini Cube Plus allows traders to adjust RSI periods and analyse momentum across multiple timeframes, which is useful for aligning short-term and medium-term trends.
Moving Average Convergence Divergence (MACD)
MACD tracks changes in trend direction and momentum by comparing short- and long-term exponential moving averages. Bullish and bearish crossovers provide momentum signals, while the histogram highlights early signs of acceleration or deceleration.
HDFC Bank’s recovery from the March 2020 lows illustrates this well. A bullish MACD crossover in late March signalled improving momentum, which persisted for several months. Later, a declining MACD histogram during late 2021 warned of weakening momentum ahead of consolidation.
Most trading platforms, including Tradejini Cube Plus, allow customisation of MACD settings and alerts for crossover signals. (Refer our guide on how to ‘Create Alert’ )
Rate of Change (ROC)
ROC measures the percentage change in price over a selected period, helping traders assess how quickly prices are moving. This is particularly relevant in momentum trading, where acceleration often matters as much as direction.
For instance, when Reliance Industries announced major growth initiatives in its digital and retail businesses, price momentum strengthened steadily. ROC would have reflected this acceleration early, while a declining ROC often serves as an early signal of slowing momentum even if prices remain elevated.
Momentum in the Indian Market Context
The Indian market presents specific conditions that influence how momentum plays out.
Sectoral rotation is a defining feature. Different sectors respond to varying economic and policy cycles, causing momentum to shift over time. During the pandemic, pharmaceutical stocks exhibited strong momentum, while reopening phases saw leadership rotate toward banking and automobiles. Traders who tracked these shifts were better positioned to stay aligned with emerging trends.
FII flows impact on stock momentum, significantly impact momentum, especially in large-cap stocks. Sustained FII selling between late 2021 and mid-2022 coincided with prolonged negative momentum in benchmark indices. When flows stabilised and turned positive, bullish momentum gradually returned. Combining awareness of FII activity with technical indicators often provides better context for momentum trades.
Liquidity considerations are critical. Momentum strategies work best in liquid stocks where entries and exits can be executed efficiently. In India, this typically means focusing on Nifty 50, Nifty 100, or actively traded mid-cap stocks. Illiquid small-cap names may display strong technical signals but can pose exit risks during reversals.
Building a Momentum Trading Framework
Momentum trading benefits from a structured approach rather than ad-hoc decision-making.
Universe definition involves selecting a liquid and manageable set of stocks. Many Indian traders focus on Nifty 100 or Nifty 200 constituents, filtering further based on average traded value. Screening for price above key moving averages, positive momentum indicators, and improving relative strength helps narrow candidates.
Relative strength analysis adds another layer. Stocks that outperform both their sector and the broader index often sustain momentum longer. During the 2020–2021 rally, companies like Asian Paints, Titan, and Pidilite outperformed not just in absolute terms but relative to the market. Comparing stock performance against benchmarks, a feature available on platforms like Tradejini’s Cube Plus, helps identify such leaders.
Applying Momentum with Discipline
Momentum trading offers a structured way to participate in market trends by aligning with price strength rather than forecasting turning points. By understanding the behavioural drivers behind momentum, using indicators such as RSI, MACD, and ROC, and adapting strategies to Indian market dynamics like sector rotation and FII flows, traders can approach momentum more systematically.
In Part 2 of this series, we will focus on position sizing, stop-loss strategies, and managing drawdowns, which are essential for applying momentum trading in real-world conditions.
Disclaimer: The information provided in our blogs is for informational purposes only and should not be construed as financial, investment, or trading advice. Trading and investing in the securities market carries risk. Always conduct your own research and consult with a qualified financial advisor before making any investment decisions. Past performance is not indicative of future results. Copyrighted and original content for your trading and investing needs.
© 2026 — Tradejini. All Rights Reserved.