


Imagine a tug-of-war match where neither side is winning. The rope moves a little to one side, then back again, staying mostly in the middle. This is exactly what happens in a rectangle pattern on a stock chart. It is one of the simplest and most recognizable patterns in technical analysis, yet incredibly powerful when used correctly.
A rectangle forms when the price of a stock moves sideways between two horizontal lines, resistance at the top and support at the bottom. This price movement creates a box-like shape, giving the pattern its name. It represents a phase where buyers and sellers are evenly matched. Traders see this as a pause or consolidation in the ongoing trend. When the price finally breaks out of this range, either upwards or downwards, it often signals a continuation or a reversal of the previous trend.
What is a Rectangle Pattern?
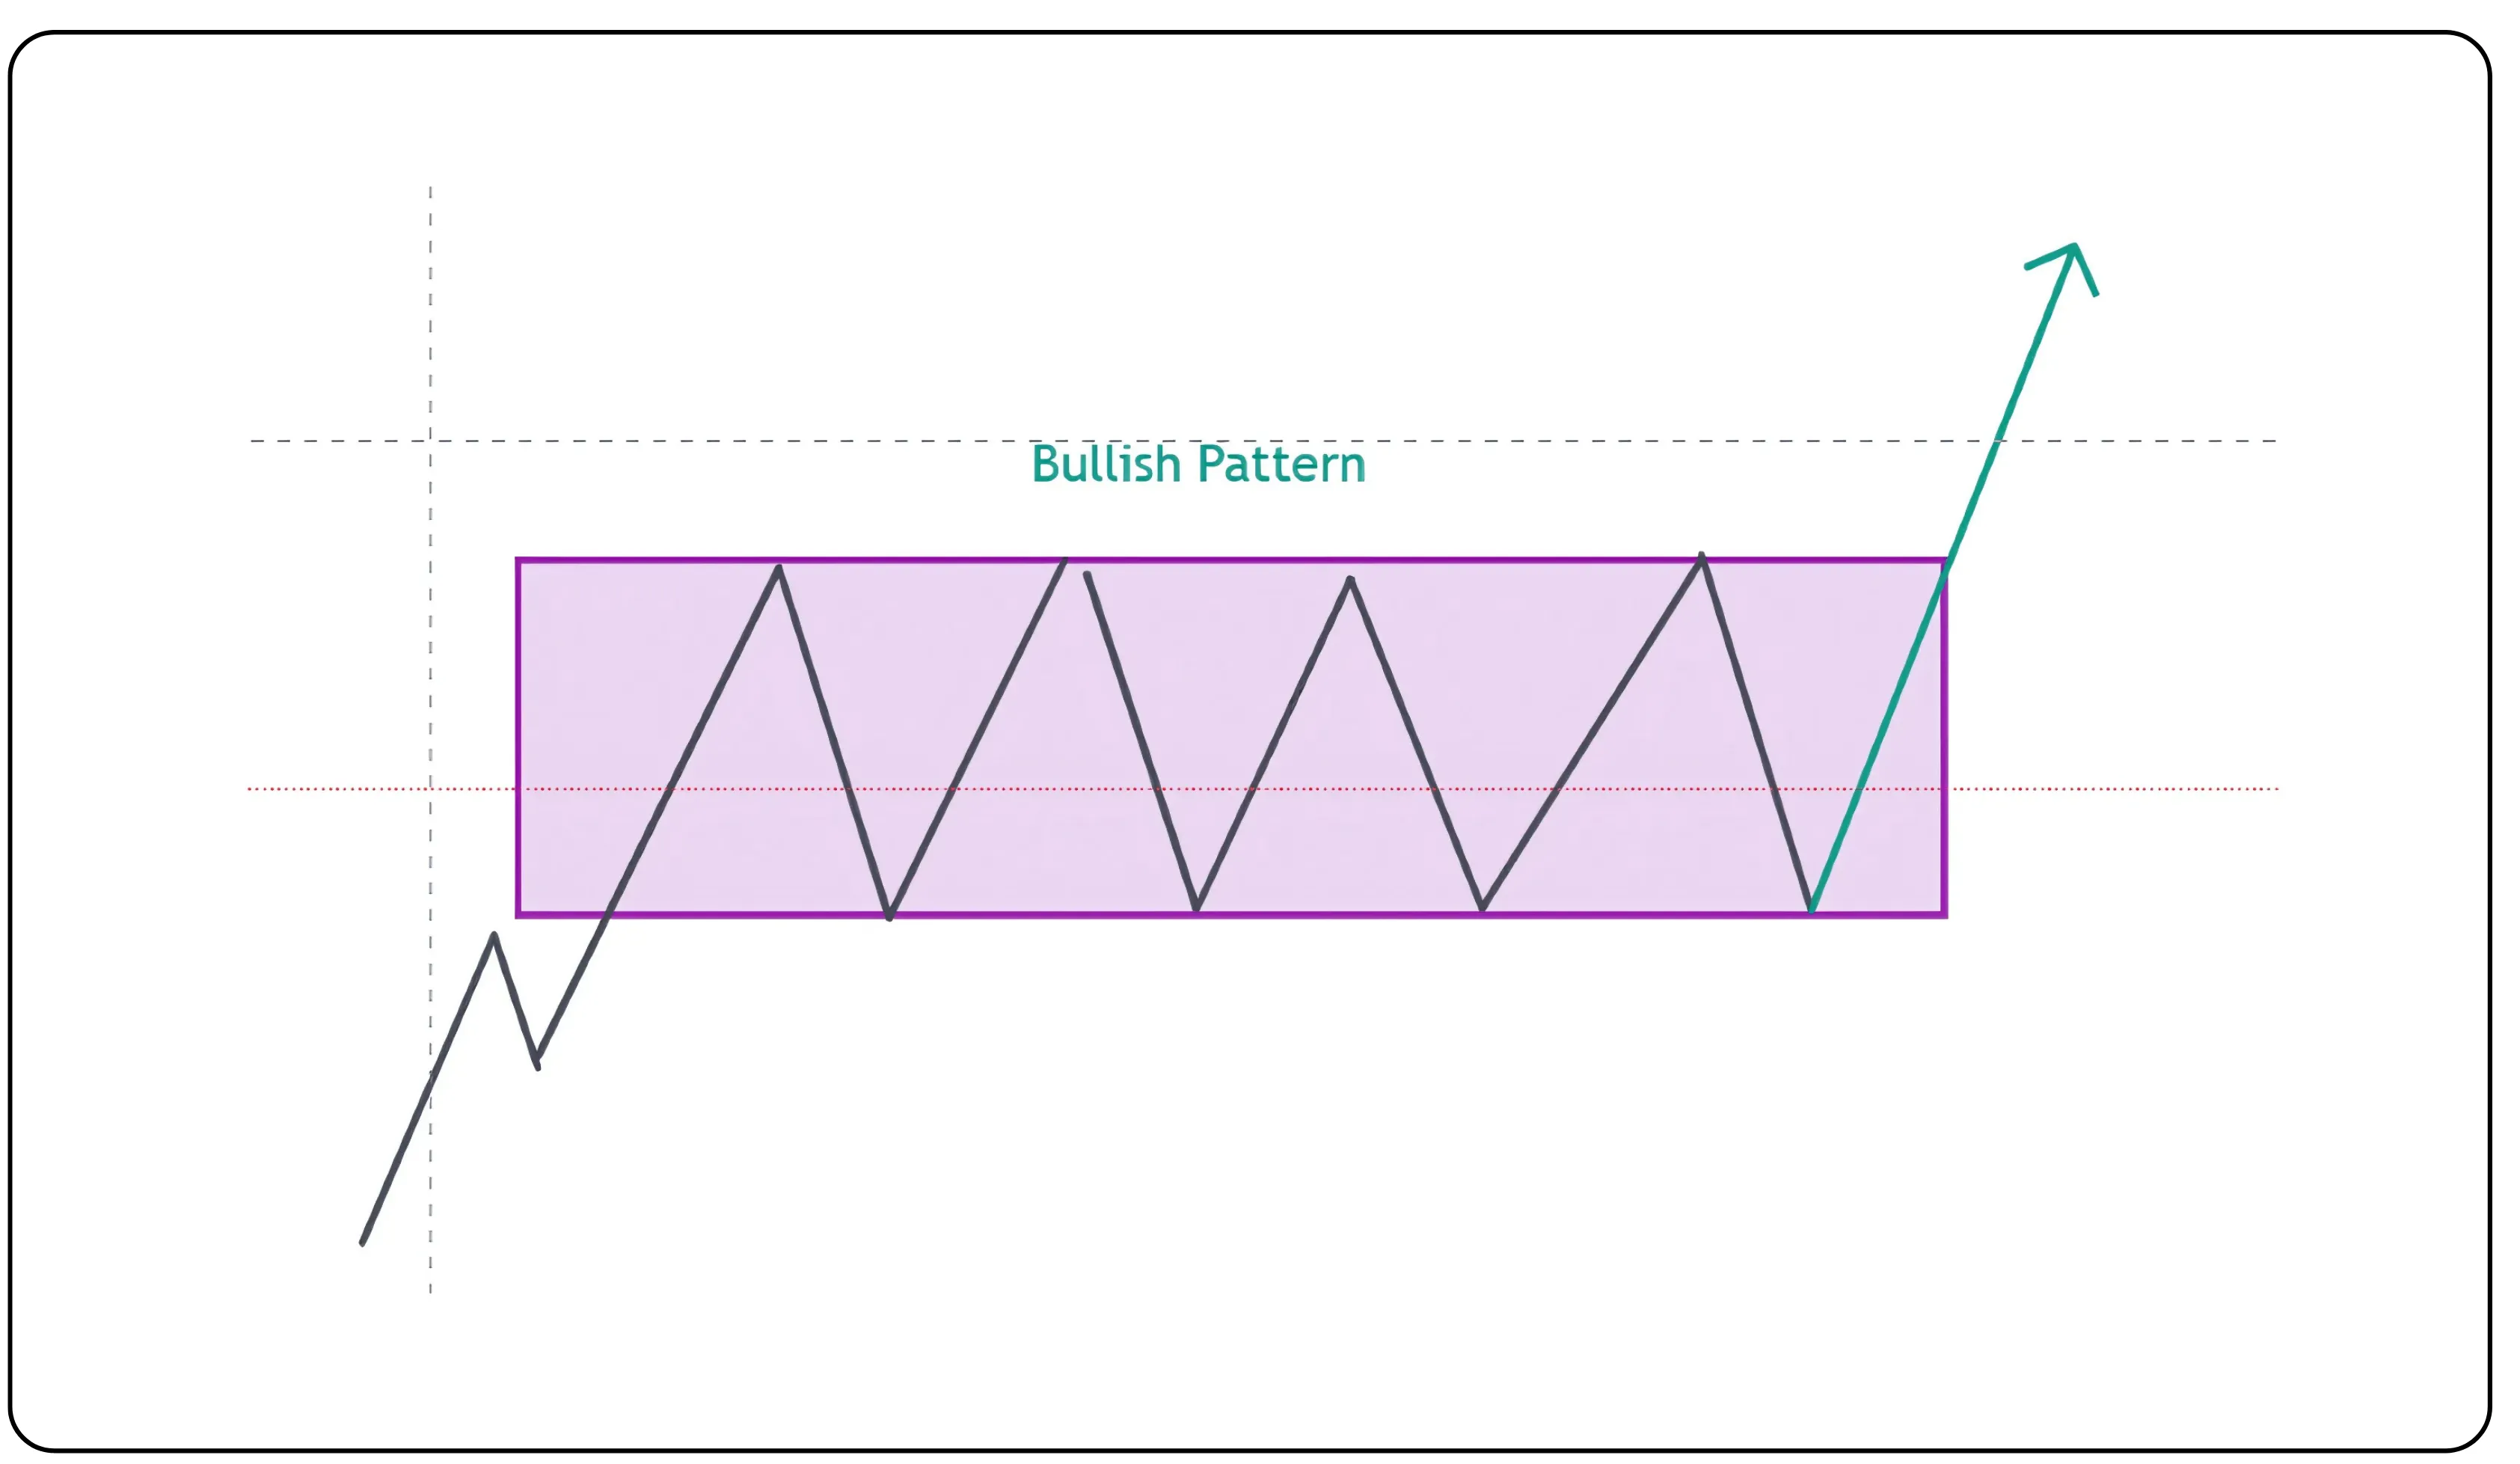
Rectangle Bottom Bullish pattern
What is happening: The price falls first, then starts moving sideways in a range.
This means sellers were in control, but now buyers are stepping in, creating support at the bottom.
If the price breaks upward out of the rectangle, it shows that buyers have taken control.
Signal: A possible trend reversal to the upside or continuation of a larger uptrend.
Think of it like this: The price took a hit and paused. Buyers are now slowly building strength. If it breaks out upwards, it is a bullish sign.
Also read: What are seasonality charts?
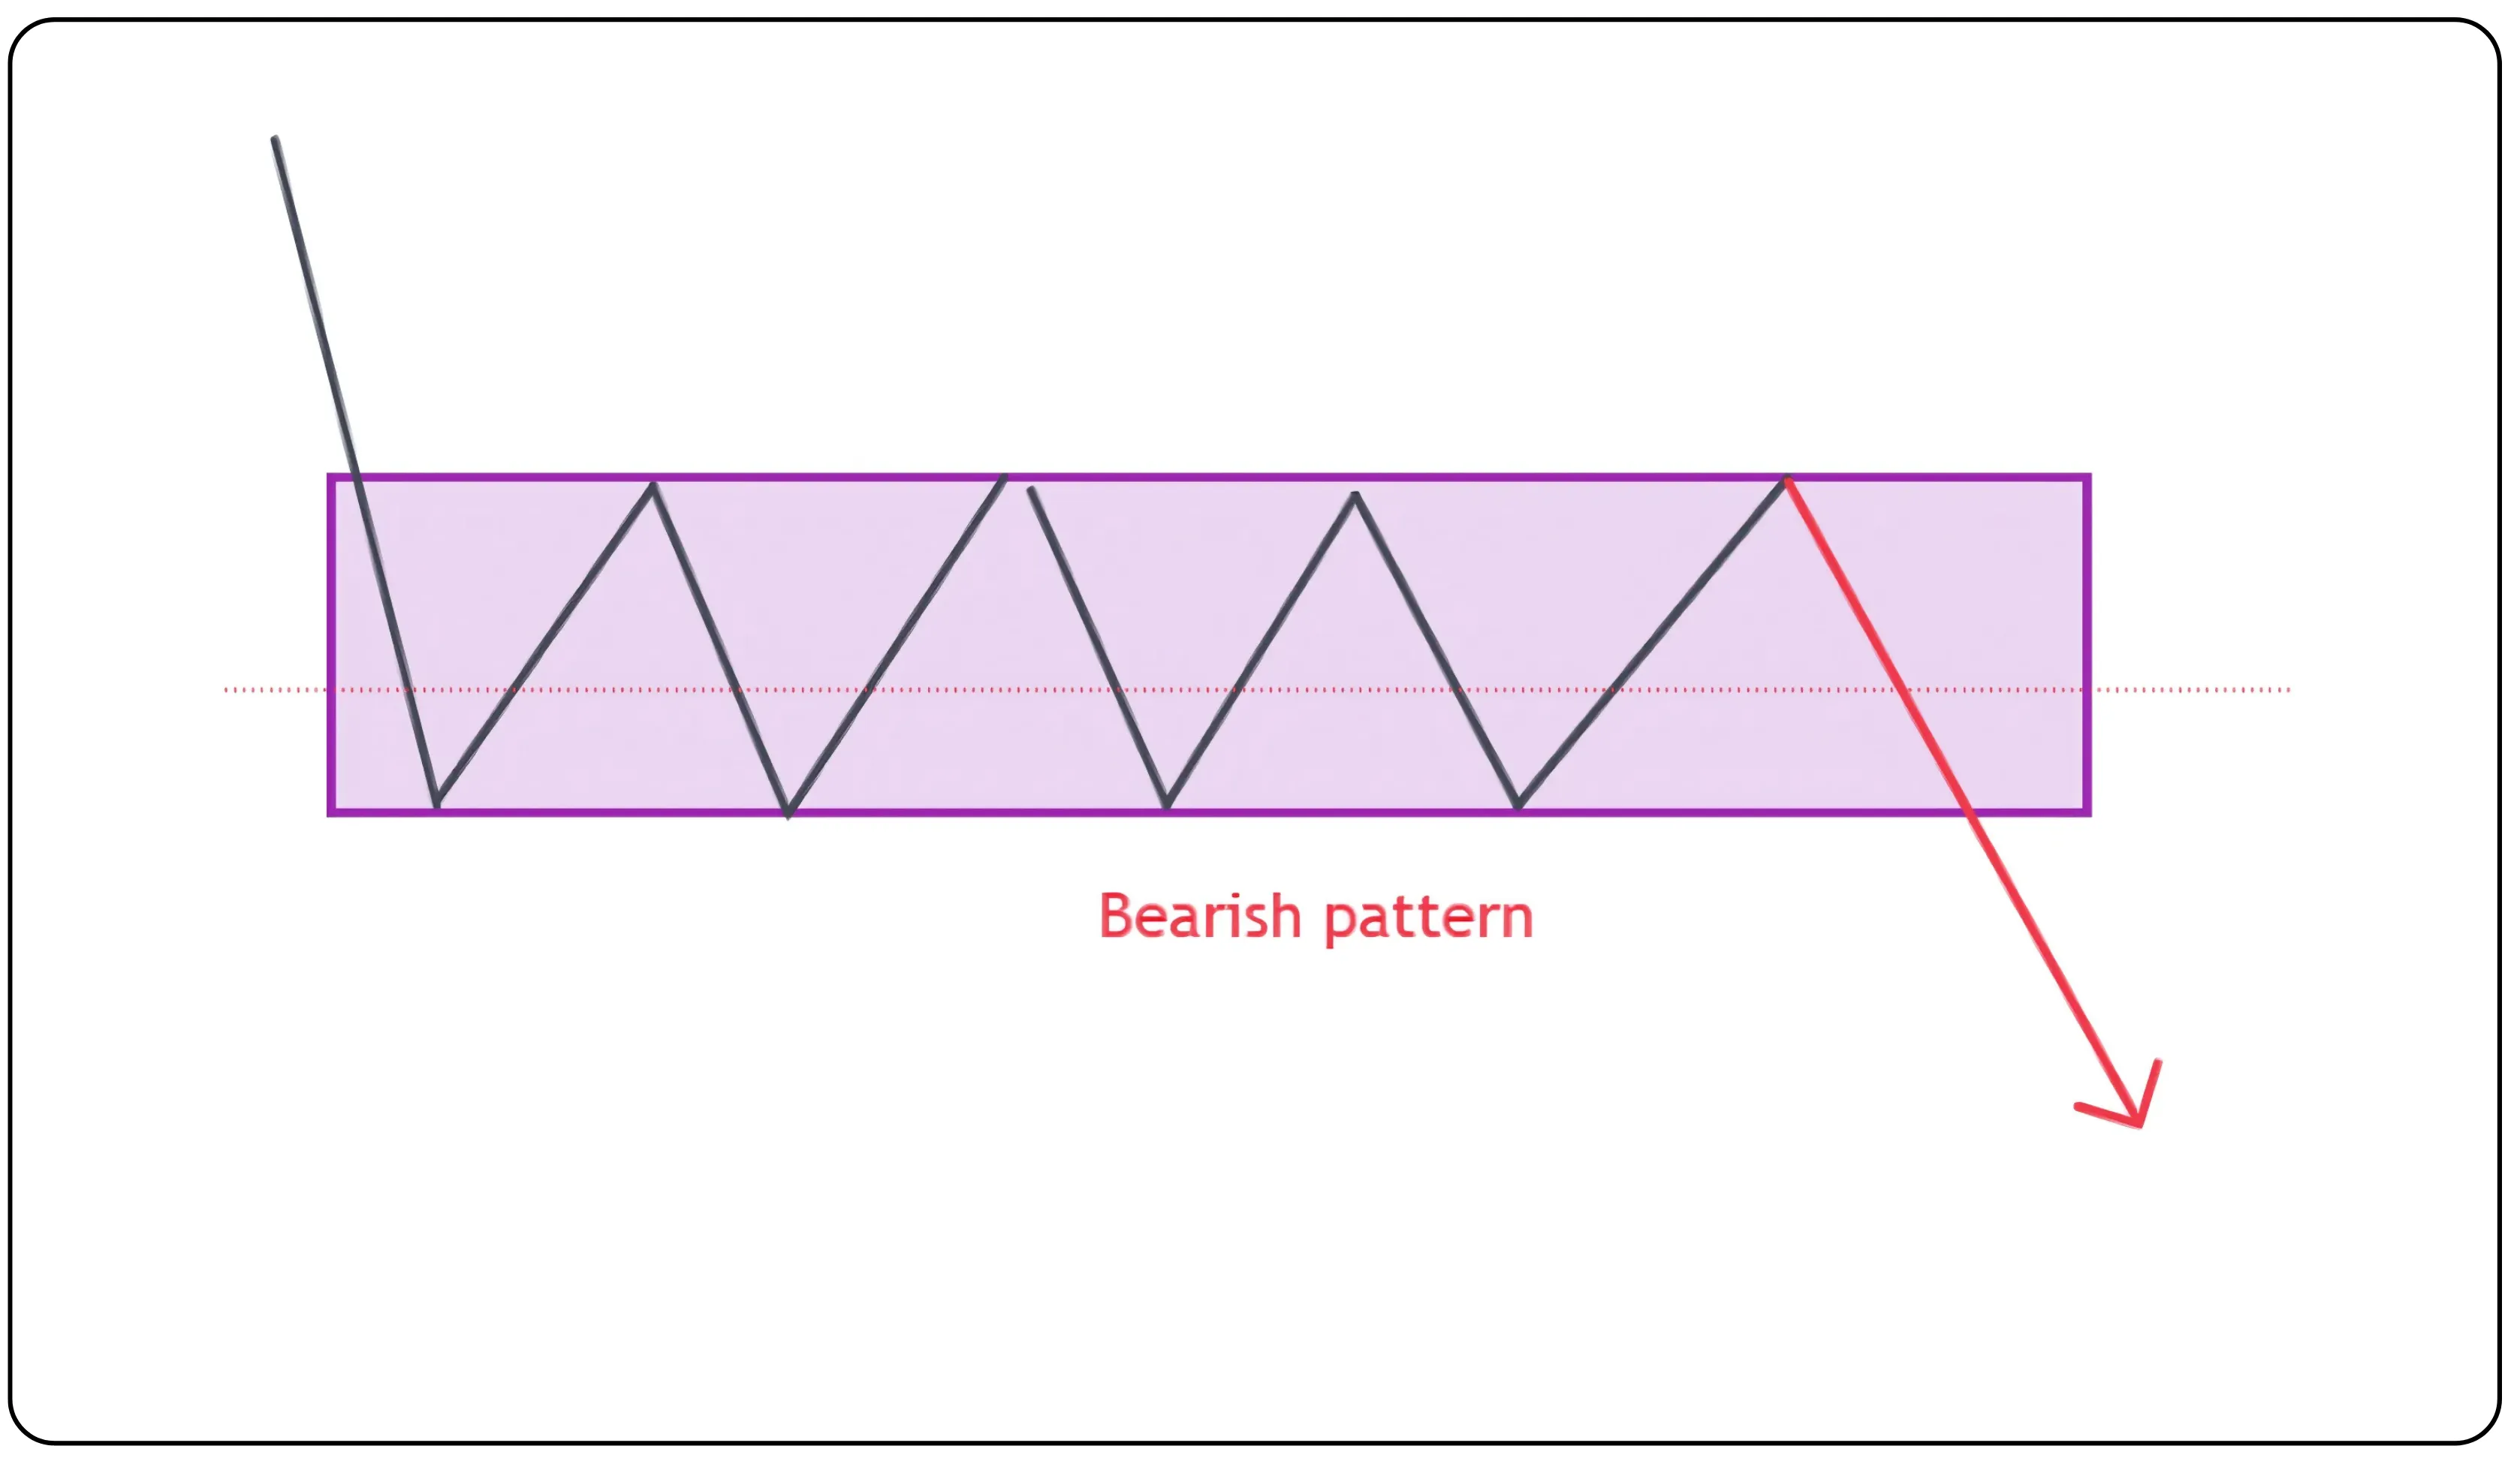
Rectangle Top Bearish pattern
What is happening: The price rises first, then starts moving sideways in a range.
This means buyers were in control, but now sellers are stepping in, creating resistance at the top.
If the price breaks downward out of the rectangle, it shows that sellers have taken control.
Signal: A possible trend reversal to the downside or continuation of a downtrend.
Think of it like this: The price had a strong run, but now it is struggling to go higher. If it breaks down, it is a bearish sign.
| Feature | Description |
|---|---|
| Trend Before | Downtrend before the rectangle means rectangle Bottom. Uptrend means rectangle Top. |
| Shape | Two horizontal or nearly flat trendlines on top and bottom. |
| Touches | At least two, ideally three, touches on both top and bottom trendlines. |
| Breakout | Happens when the price closes above the resistance or below the support. |
| Volume Clue | Volume often drops during the pattern and then rises in the breakout direction. |
| Duration | Rectangles can last from a few weeks to two or three months. |
| Measured Move | Measure the height of the rectangle and project it from the breakout point to estimate the target. |
Visual Clues
Rectangle patterns usually last from a few weeks to a few months.
Look for congestion zones where price moves sideways within a range.
Ideally, touches should be spaced out evenly rather than clustered at one end.
The speed at which price enters the pattern often matches how fast it moves after the breakout.
Why Do Rectangles Form?
Rectangles often form when large institutional traders, like mutual funds, are trying to accumulate or offload stocks without creating too much price movement. For example, one fund may want to buy a stock at around 55 rupees but only in small chunks. Another may want to sell at around 60 rupees, also in parts. This push and pull keeps the price trapped within a range. Eventually, one side gives in, and the price breaks out decisively.
Smart Investor Tips
If the price moves into the pattern from below, it is a Rectangle Top.
If the price moves into the pattern from above, it is a Rectangle Bottom.
Do not worry if the volume does not follow the textbook pattern. Focus more on price action.
Drying volume just before a breakout is often a strong clue of an impending move.
Use the height of the rectangle to estimate your target after the breakout.
Consider using a stop-loss just outside the pattern to manage risk in case of false breakouts.
Technical Recap
A breakout happens when the price closes clearly outside the rectangle.
A small dip or spike before the pattern, known as an undershoot or overshoot, can usually be ignored.
Short-term rentals last up to 3 months. Intermediate ones last 3 to 6 months. Long-term patterns last beyond 6 months.
Also read: Relative Rotation Graph (RRG) Explained
How to trade the Rectangle Pattern?
Rectangle pattern bearish formation
Example- 1
A Rectangle Top pattern formed on the ABBOTINDIA 1-day chart from 5th April 2023 to 9th may 2023, indicating a phase of consolidation after an upward move. The price moved within a horizontal range before breaking down, signalling a potential bearish trend.
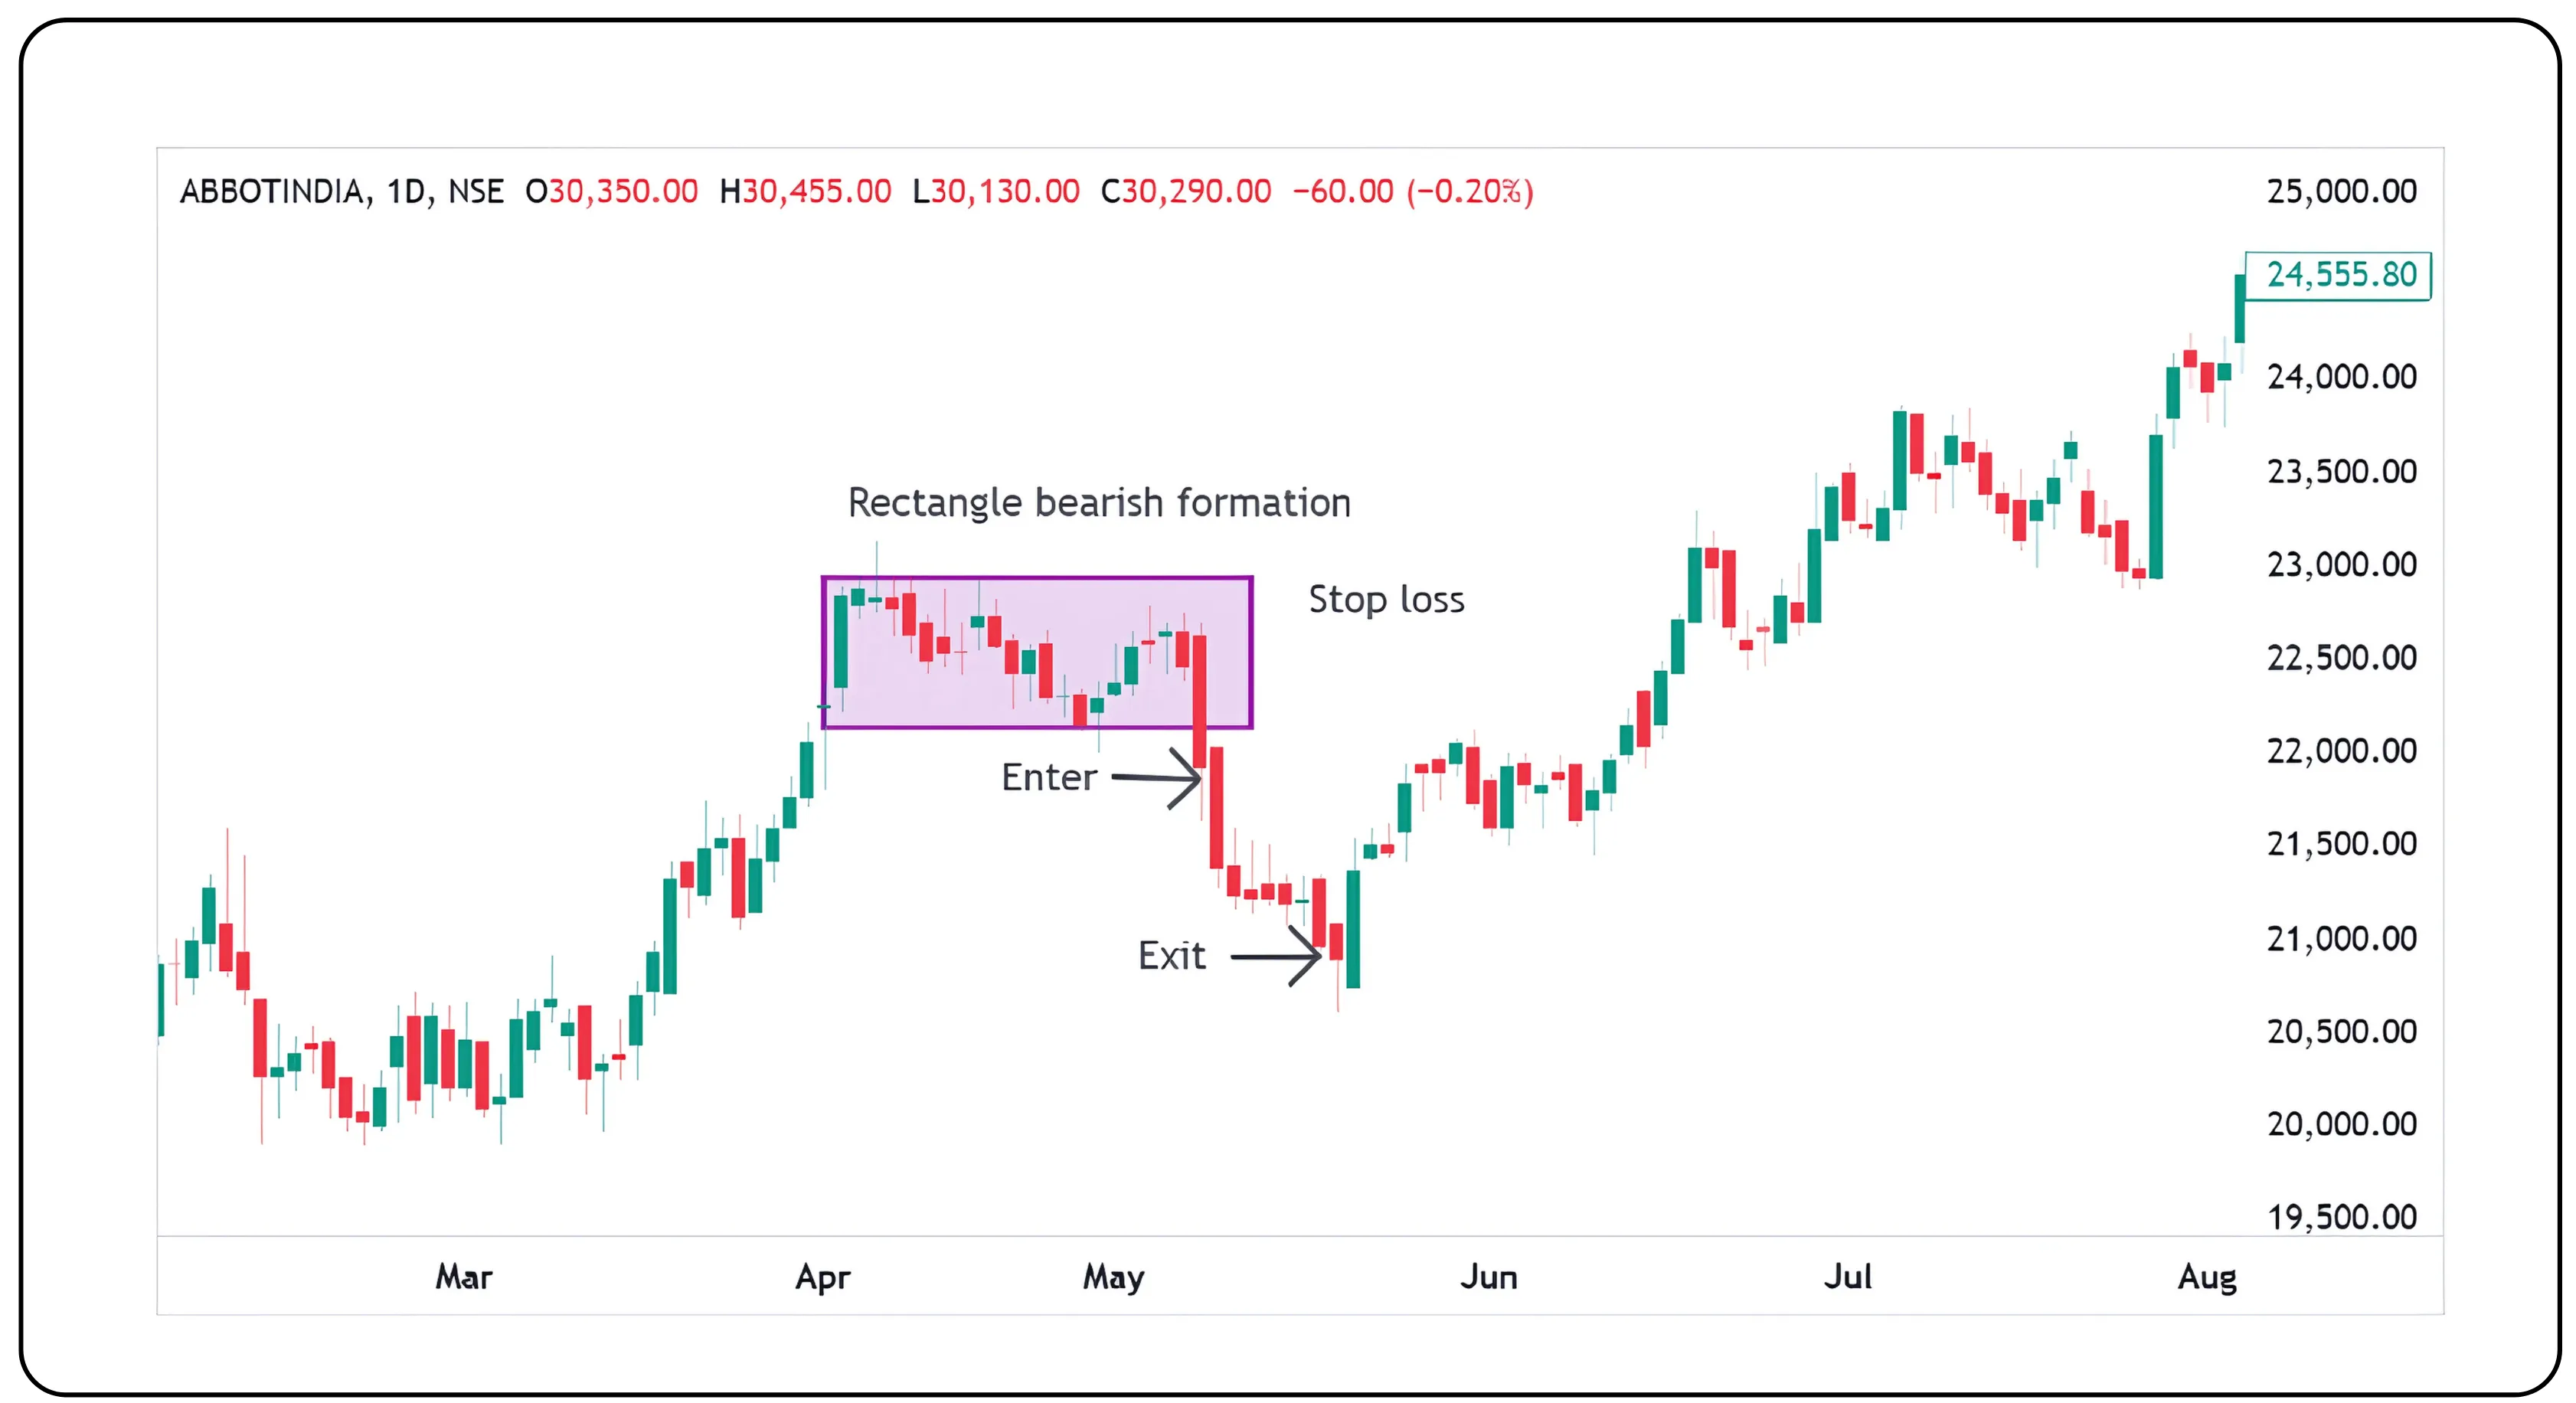
How to Take Entry Rectangle Top (Bearish Pattern)
Stock Name: ABBOTINDIA
Timeframe: 1-Day chart
Pattern: Rectangle Top (Bearish)
Trade Setup
Entry: Sell at ₹20,900 (after a confirmed breakdown below the rectangle’s support zone)
Stop Loss: ₹22,938 (placed just above the upper boundary of the rectangle)
Target (Exit): ₹12,948
Rectangle pattern bullish formation
Example - 2
Nifty 50 – Bullish Rectangle Breakout on 15–17 April 2025
Between 15th and 17th April 2025, Nifty 50 displayed a Rectangle Bottom pattern, reflecting a consolidation phase after a prior decline. The index moved sideways within a defined range, followed by a breakout above the resistance zone, indicating a bullish signal.
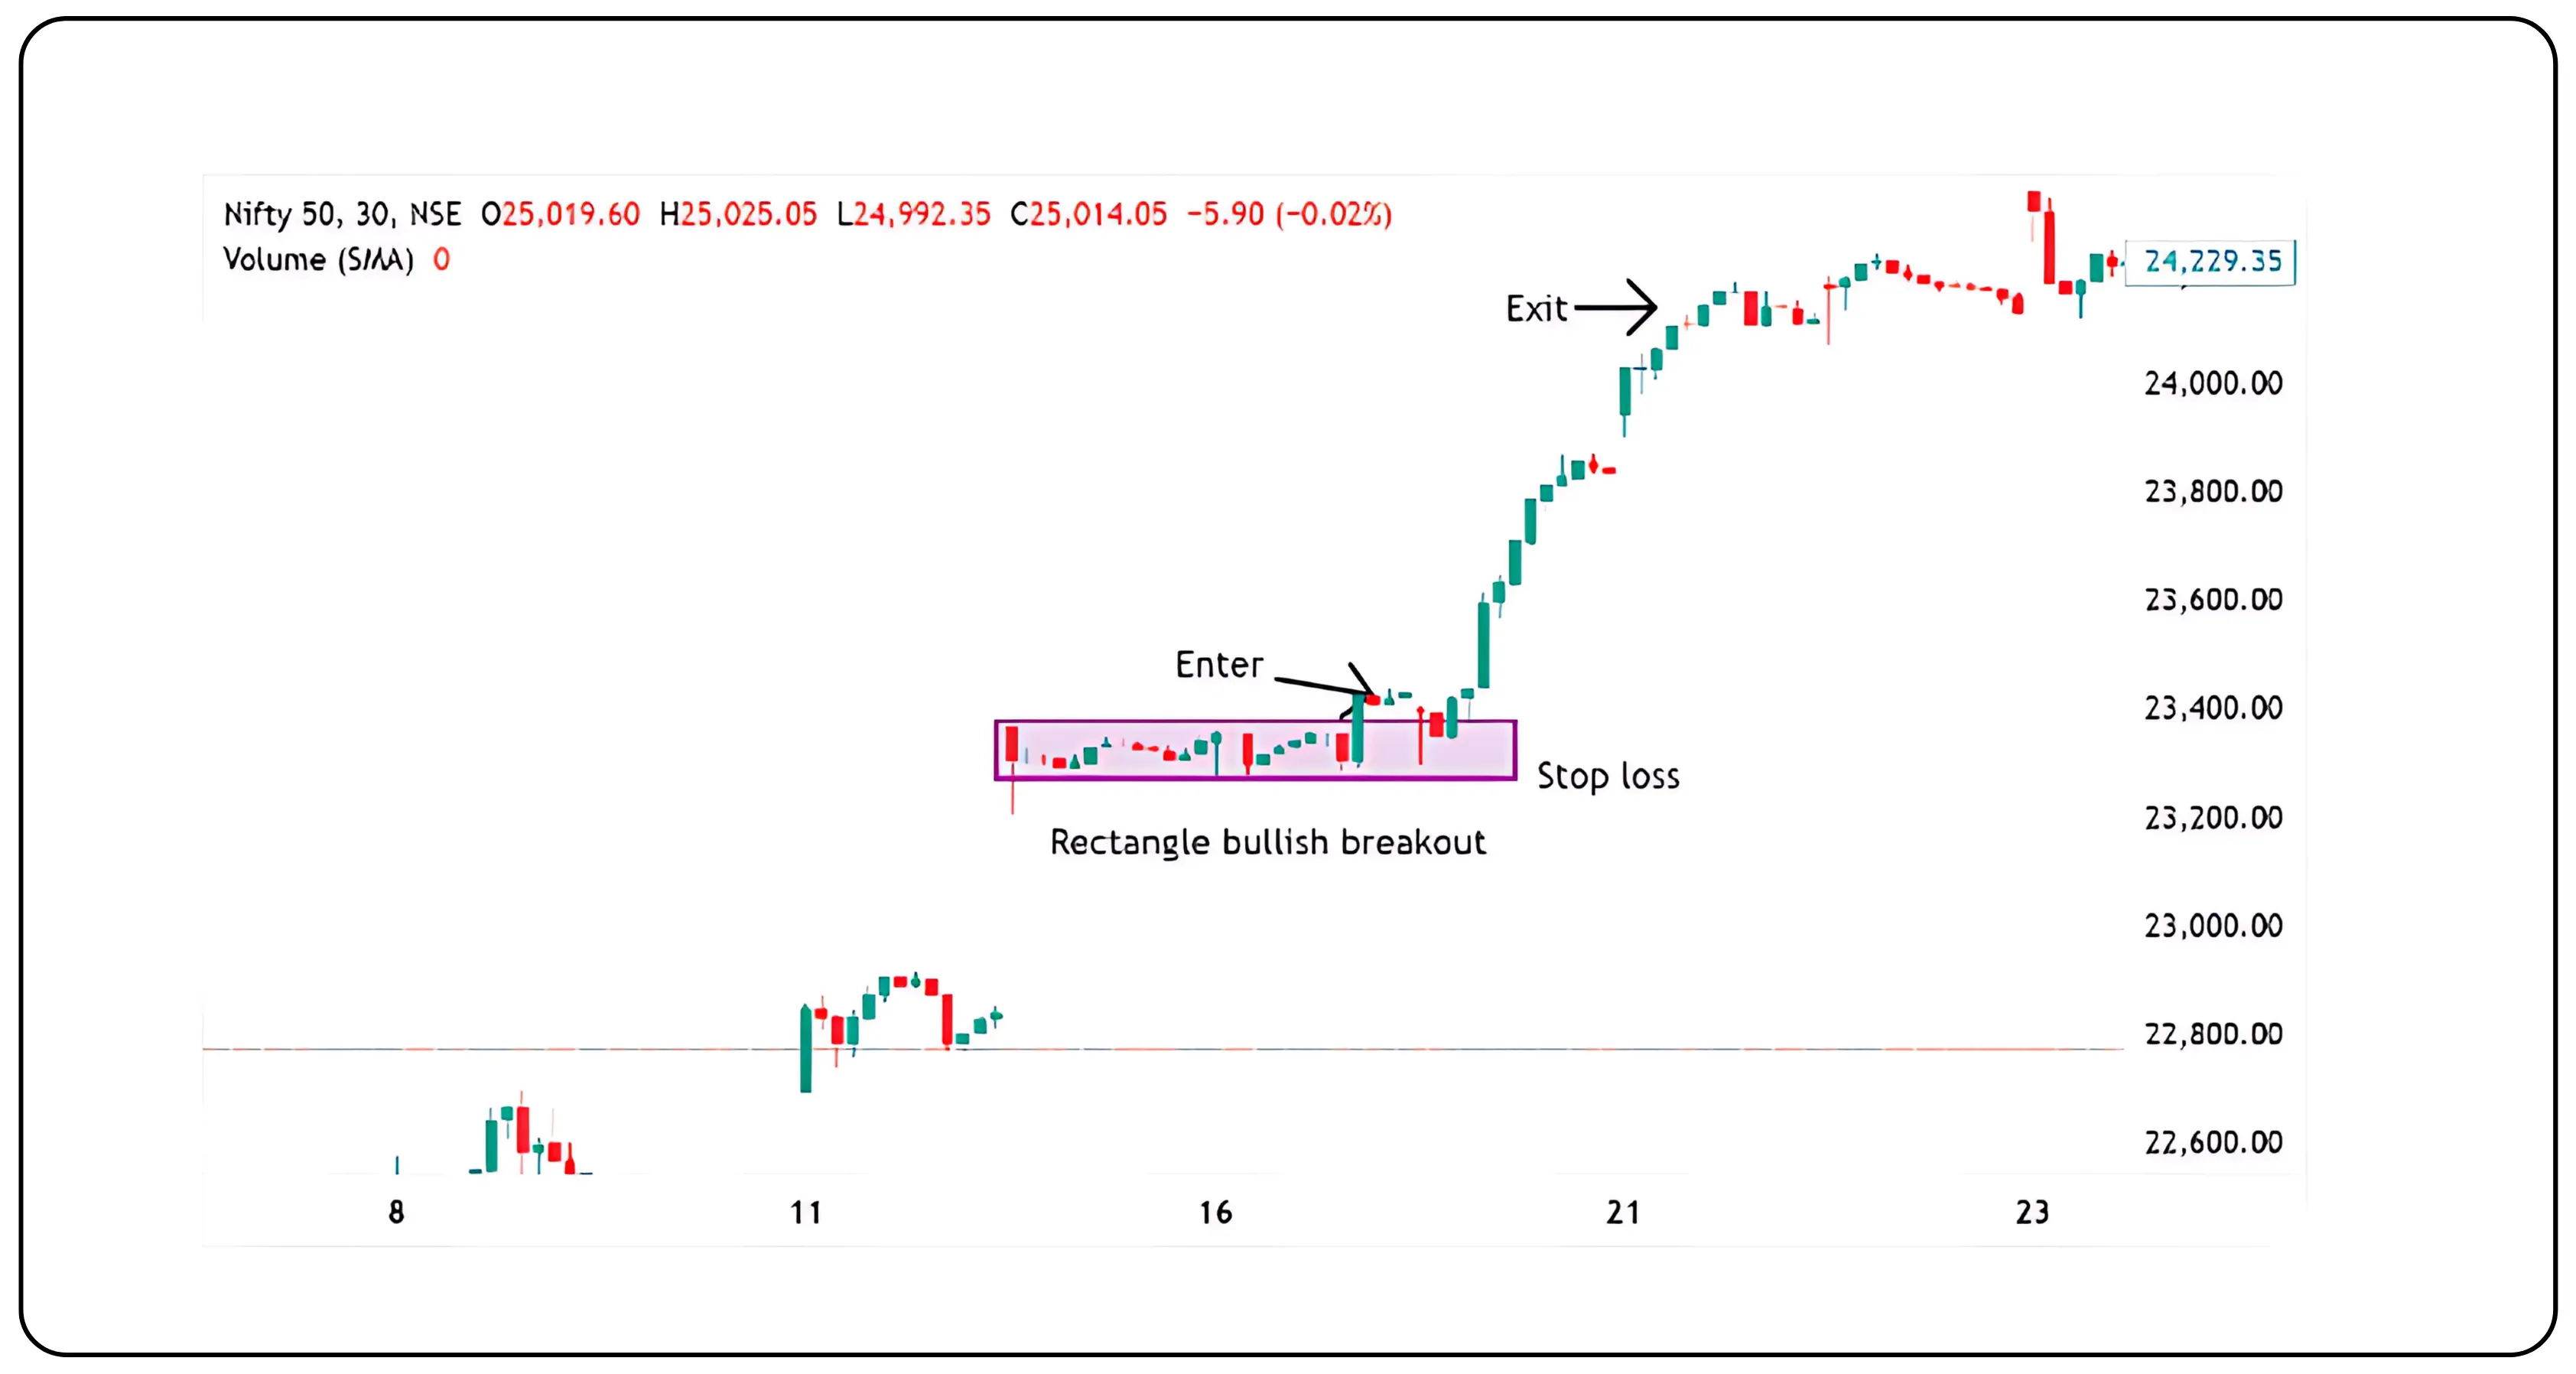
Trade Details
Pattern: Rectangle Bottom (Bullish)
Timeframe: 30-minute chart
Entry: Buy at ₹23,400 after a confirmed breakout above the resistance
Stop Loss: ₹23,278 (placed just below the lower boundary of the rectangle)
Targets:
First Target: ₹23,500 (based on the height of the rectangle, offering 100 points)
Extended Target: Trail the stop and exit near the next major resistance at ₹24,140 (potential gain of 700 points)
Also read: Using Multiple Time Frames to Improve Intraday Trades
False Breakdown Trap
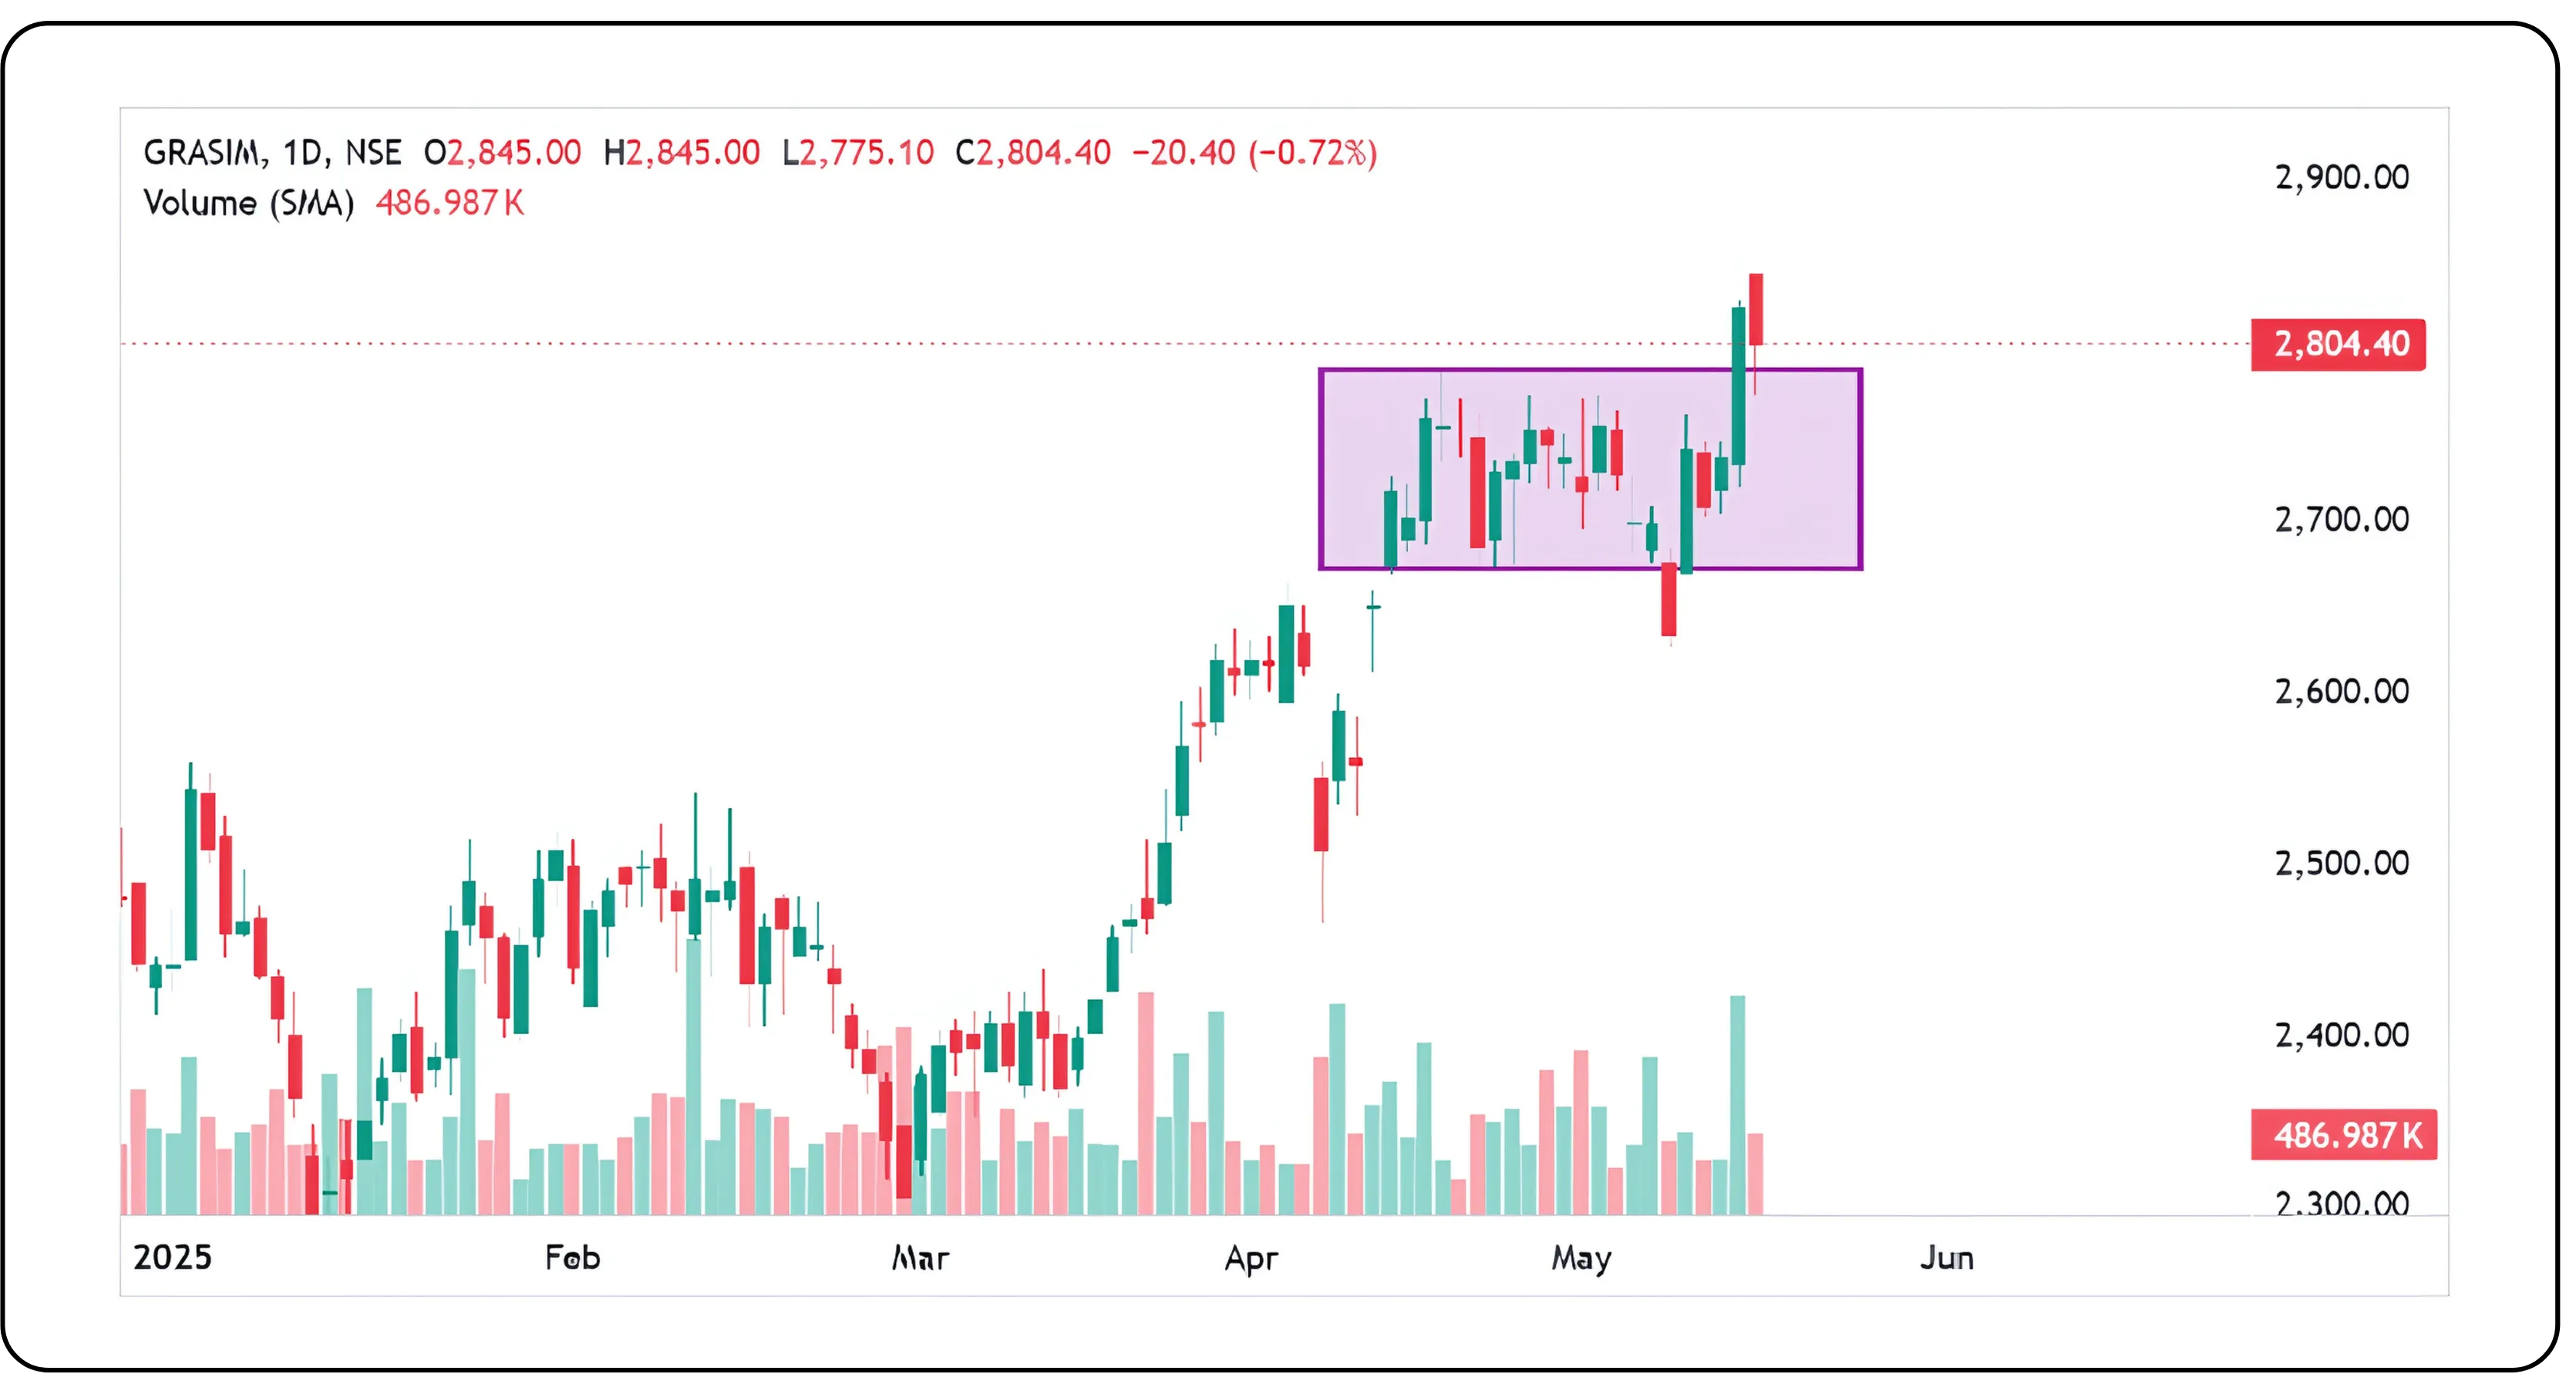
GRASIM formed a rectangle pattern from 15th April 2025 onwards. A false breakdown triggered a bear trap, followed by a breakout above the range with a close above the confirmation candle. The key now is to watch if this breakout sustains or turns into a bull trap. Volume and follow-through matter.
What went wrong?
Traders entered short too early.
The next candle didn’t open below the breakdown candle—no confirmation.
Price quickly reversed and moved up, trapping shorts.
What to do instead?
Enter only if the next candle opens and stays below the breakdown candle – that's your confirmation.
Always use a tight stop-loss above the range to protect capital.
No confirmation = no trade.
Discipline > Prediction. Wait for clean setups. Protect with a stop-loss.
Simple Shape, Strong Signal
Rectangle patterns are more than just sideways movements, they reflect real market psychology and institutional activity. With the right confirmation and discipline, traders can use them to spot high-probability setups. False breakouts are common, so waiting for clear signals and managing risk with tight stop-losses is crucial. Whether bullish or bearish, rectangles offer a clean, visual way to anticipate trend continuations or reversals with confidence.
Disclaimer: The information provided in our blogs is for informational purposes only and should not be construed as financial, investment, or trading advice. Trading and investing in the securities market carries risk. Always conduct your own research and consult with a qualified financial advisor before making any investment decisions. Past performance is not indicative of future results. Copyrighted and original content for your trading and investing needs.
© 2025 — Tradejini. All Rights Reserved.