


When you open a stock page on CubePlus, you’ll notice it’s not just about charts or placing orders. Alongside price data, there are tabs like Corporate Actions, Peers, Deals, News, and Info. They help you understand what is happening inside the company, how it compares with competitors, and who is buying or selling in size.
Here’s how to actually use each of them.
1. Corporate Actions
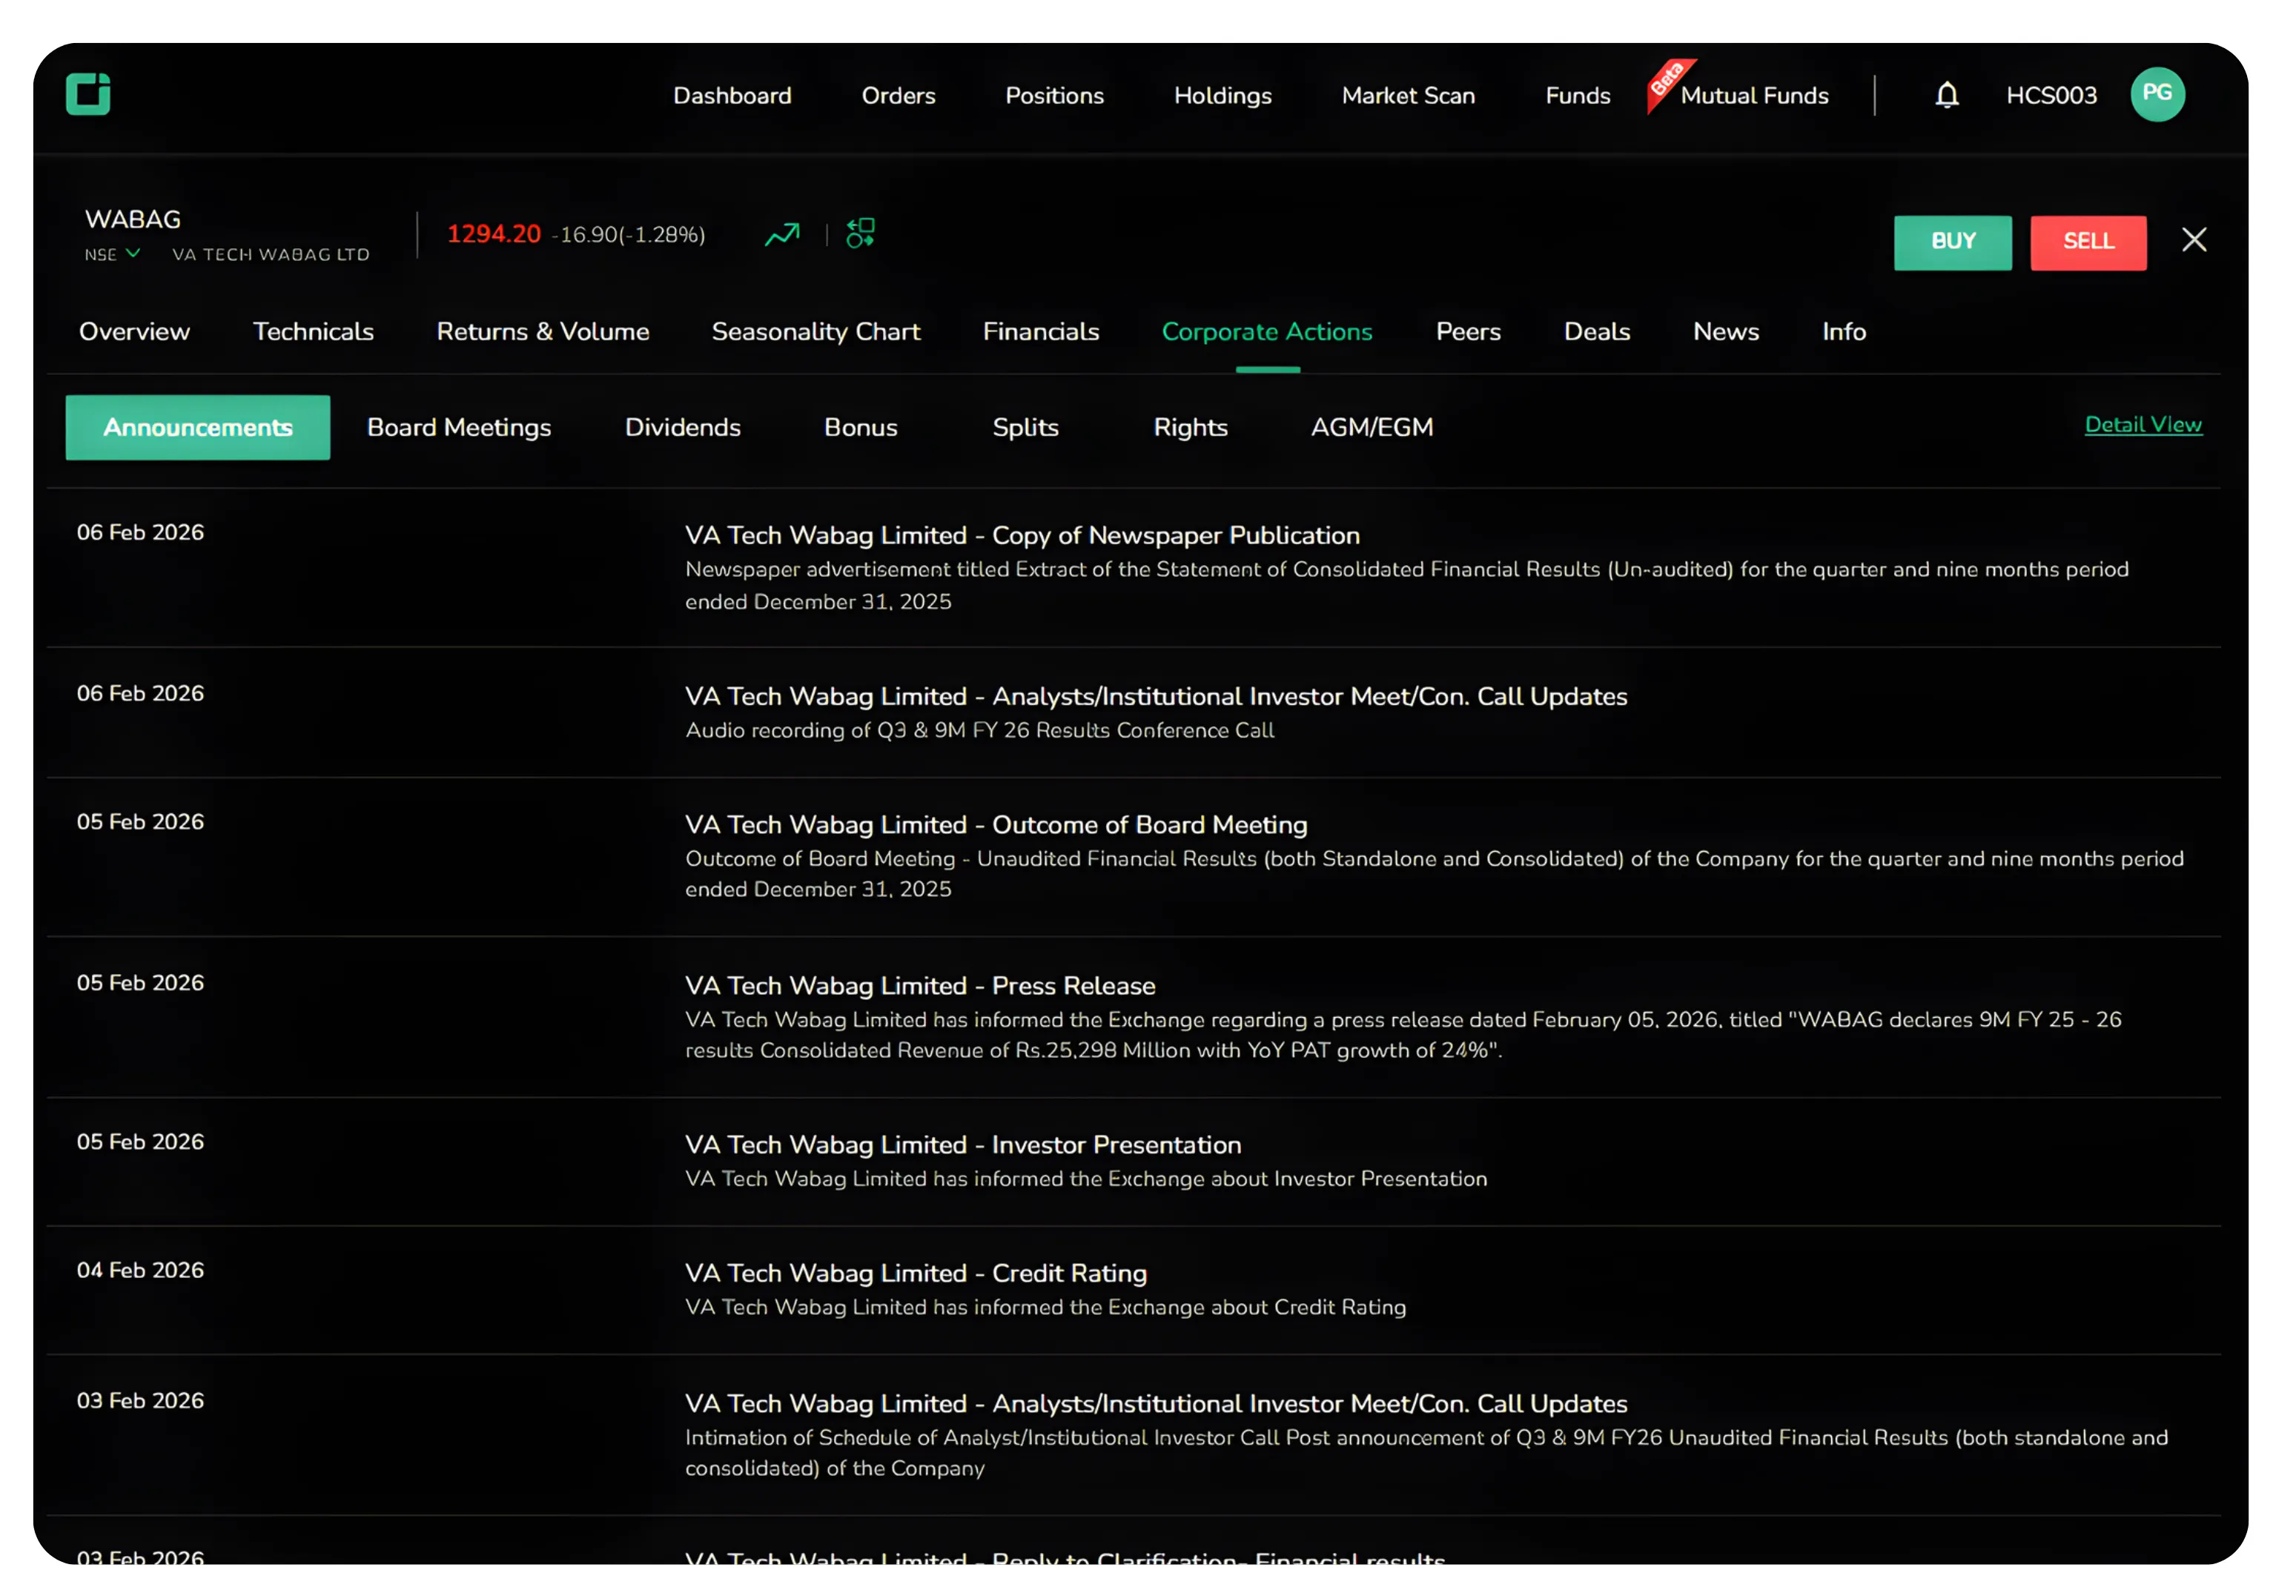
The Corporate Actions (stock market 2026) section tracks all major corporate events. The platform organizes these into clear categories, each serving a specific purpose in your research.
Announcements
This section shows company’s announcements including business updates, management changes, regulatory filings, and significant developments.
Board Meetings
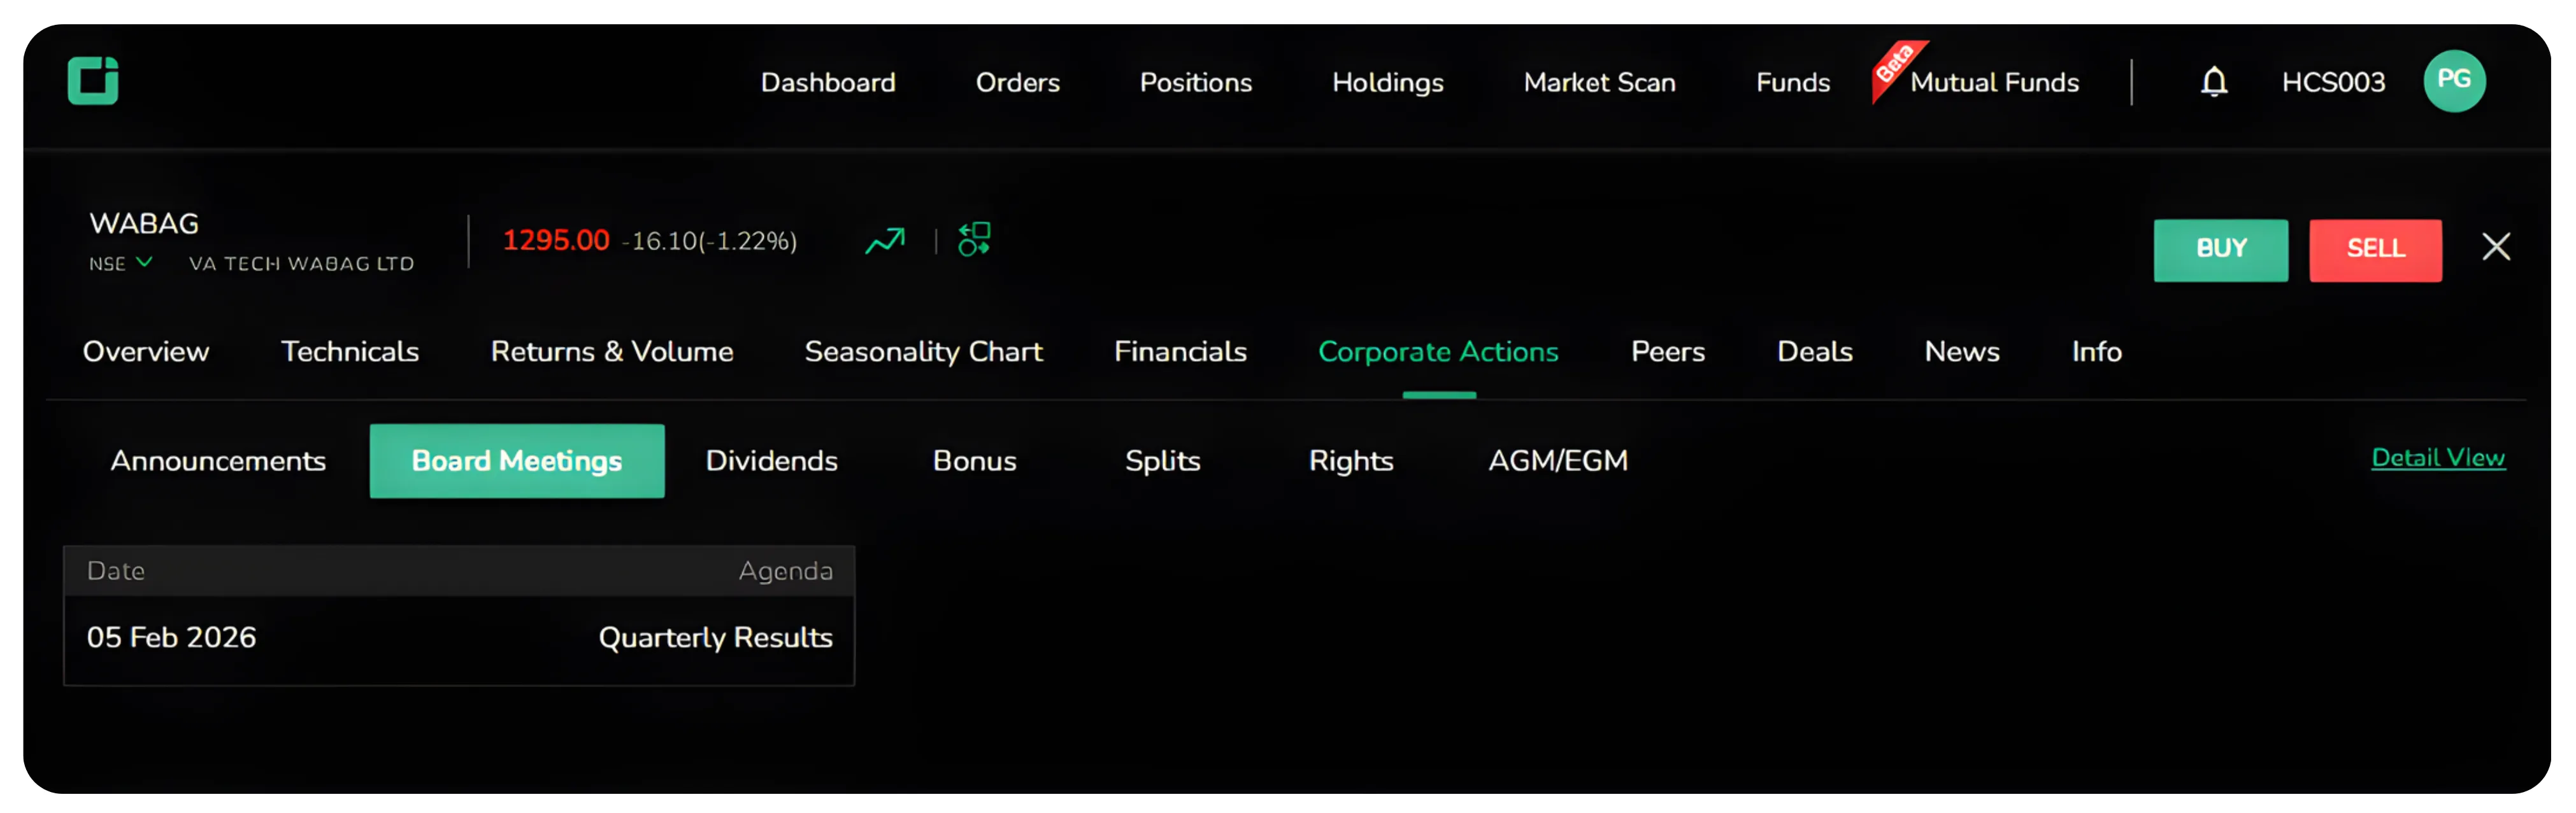
Here you will see scheduled and past board meetings with agendas and outcomes. These meetings discuss financial results, dividends, expansion plans, and strategic decisions.
Dividends
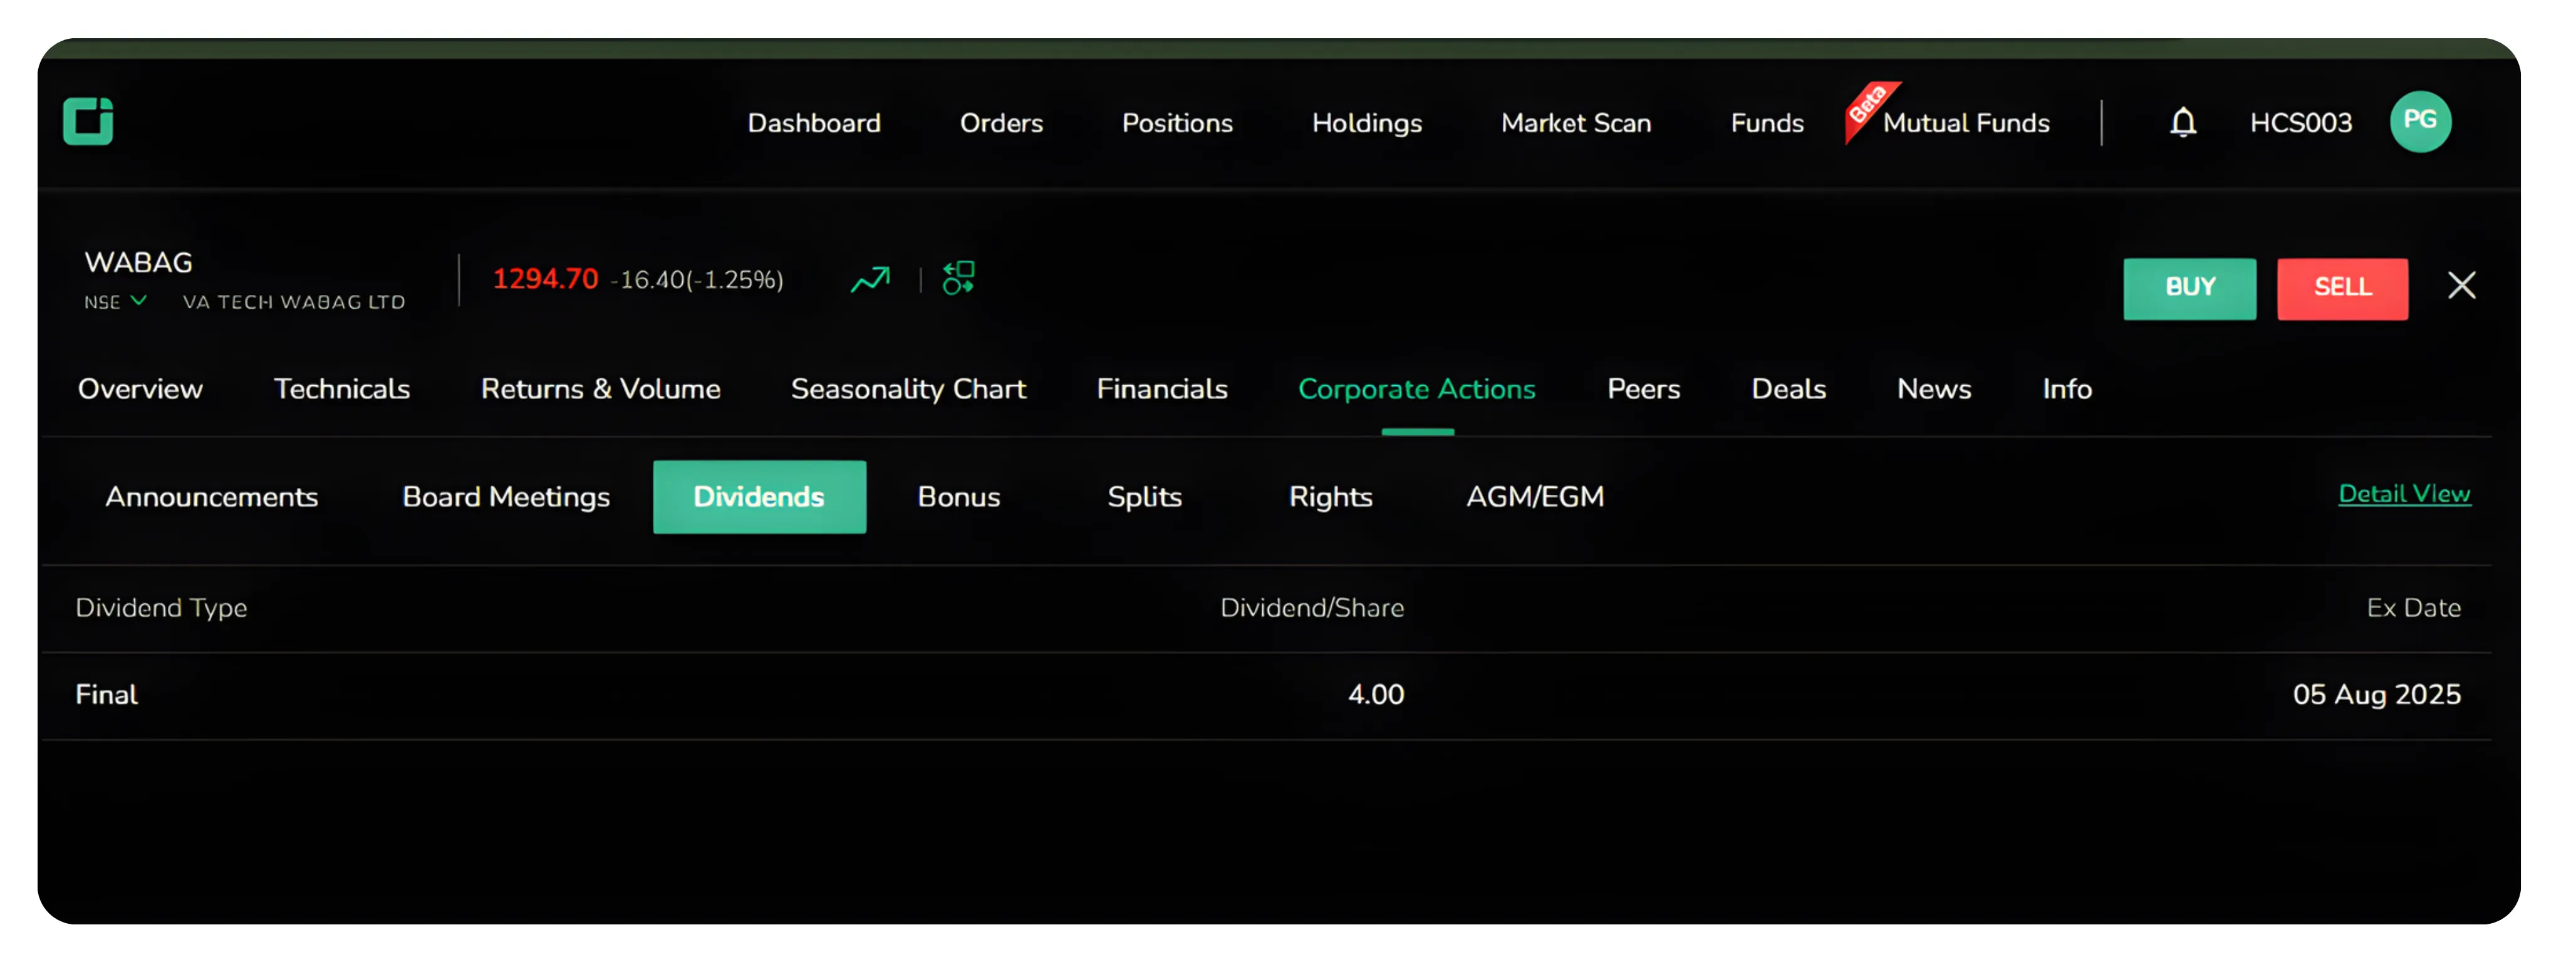
The full dividend history is available here. You can quickly check:
Dividend amount
Record date
Payment date
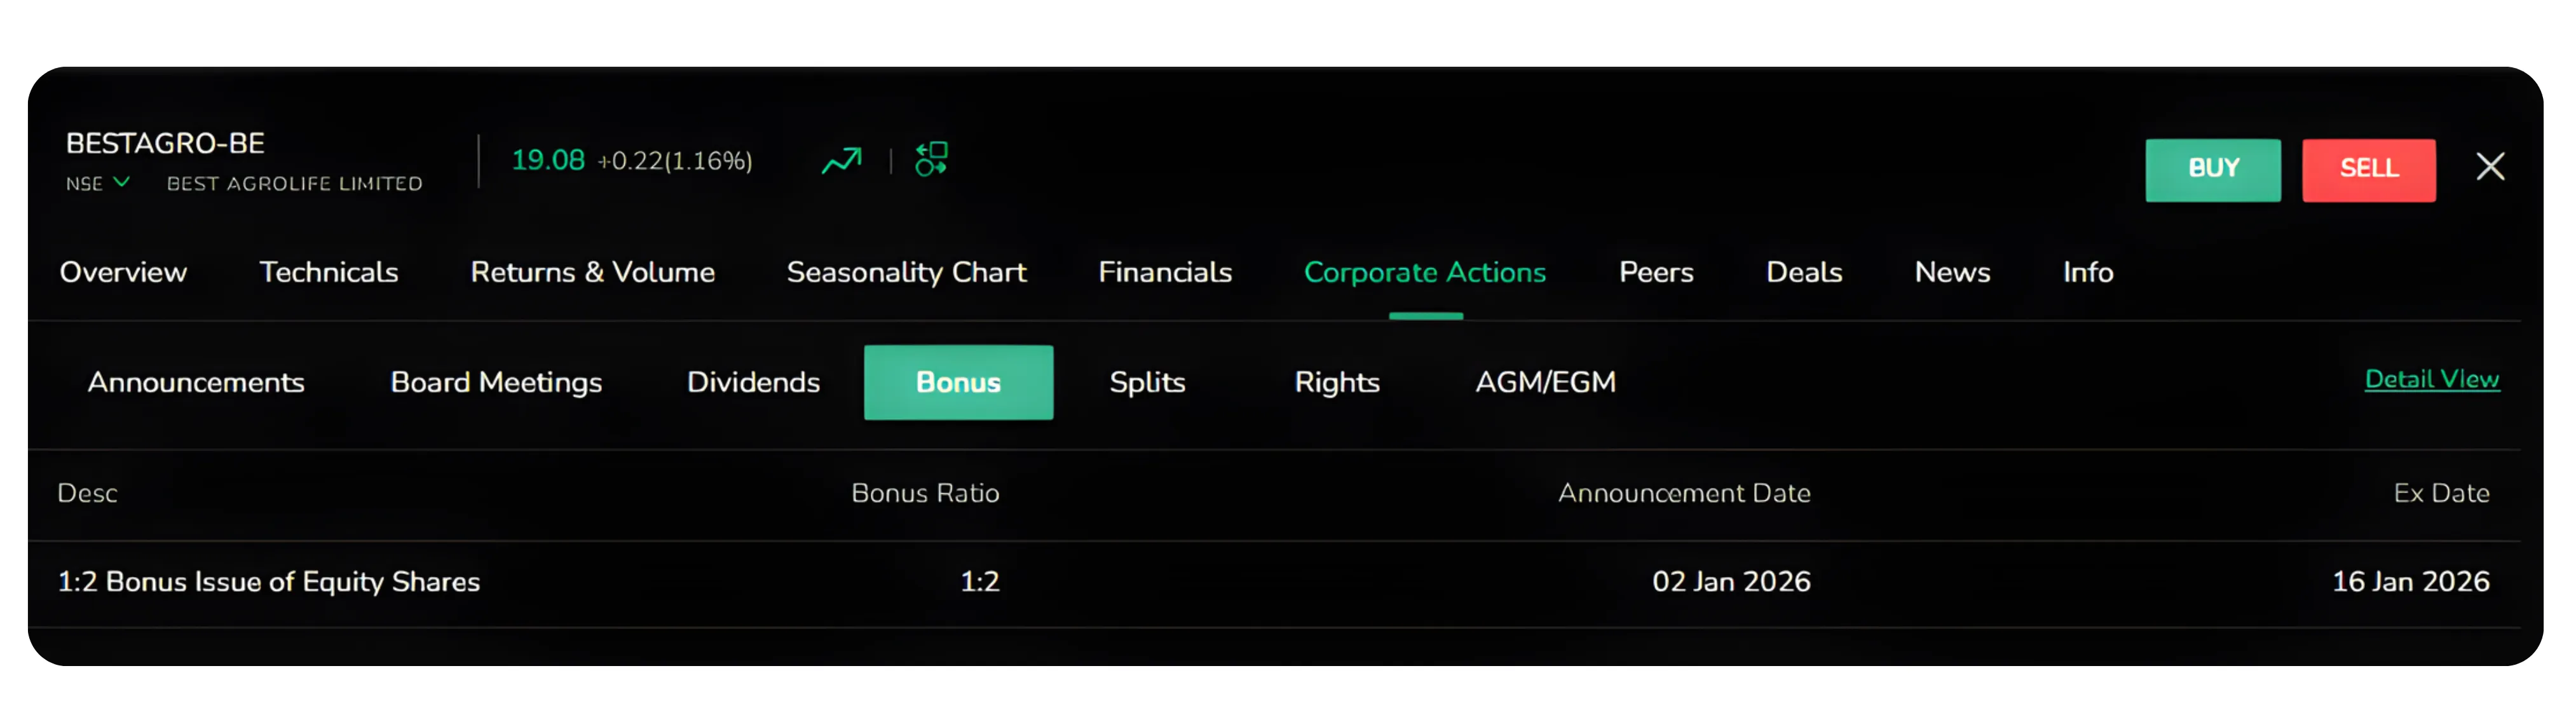
Bonus
Shows past bonus issues. While bonuses do not increase total value, they increase the number of shares you hold. Companies usually issue bonuses when they are confident about long-term performance.
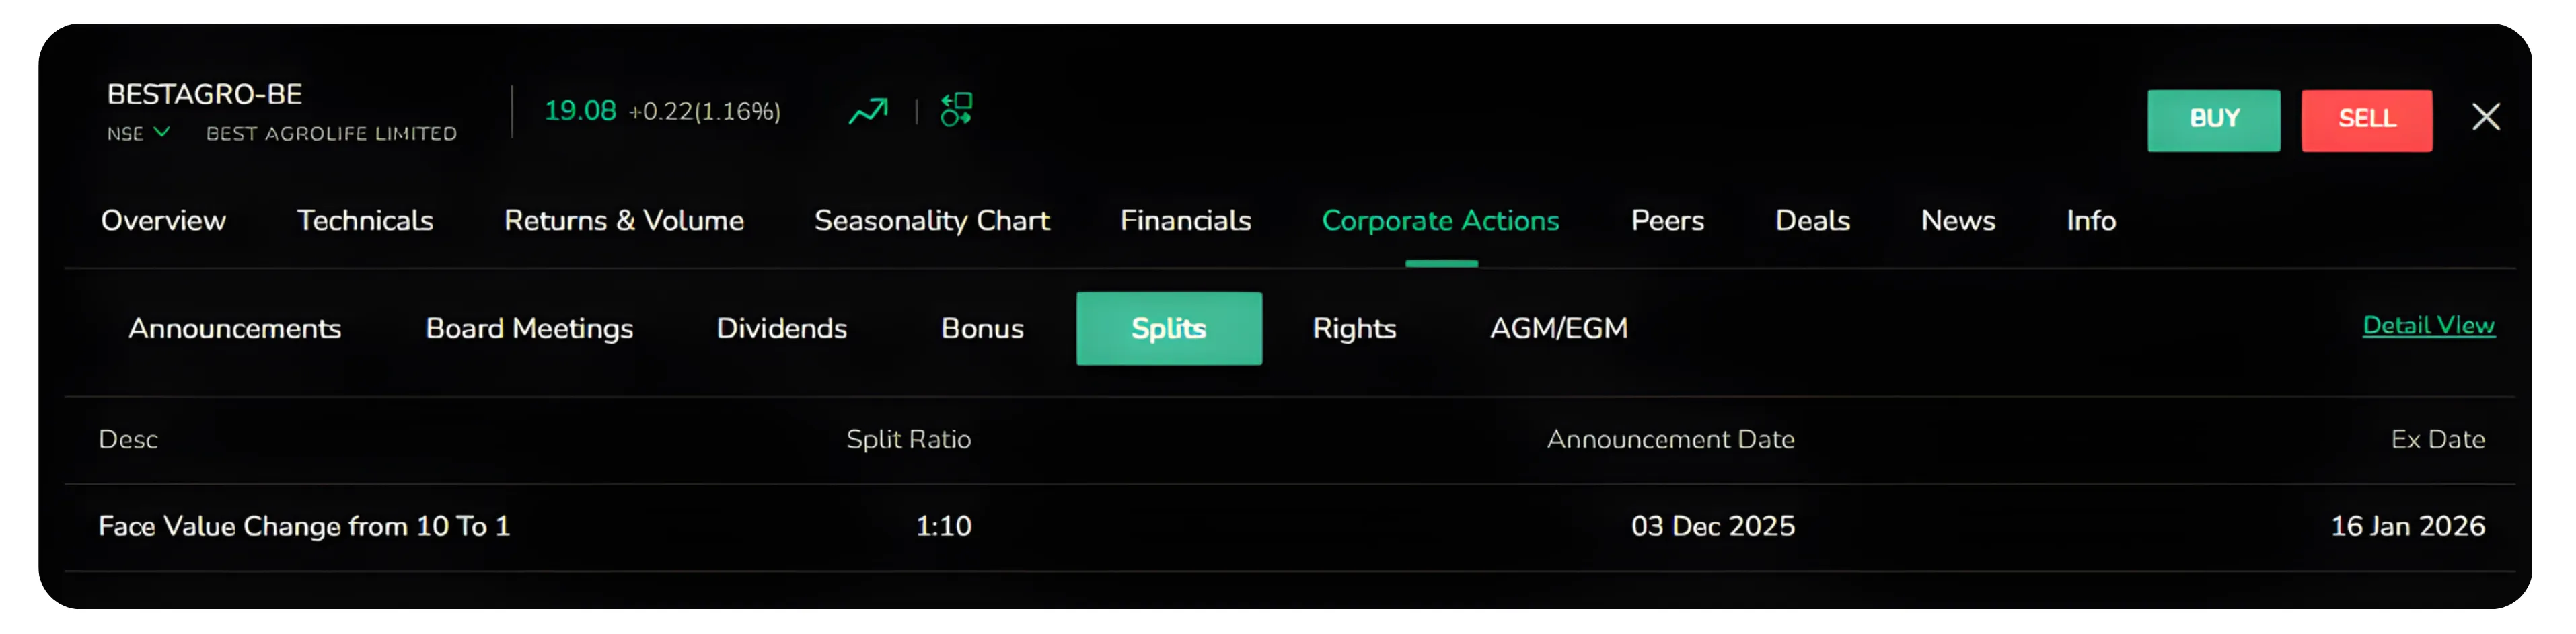
Splits
Tracks stock split events where shares are divided to make them more affordable. Splits don't change your investment value but improve accessibility and trading activity.
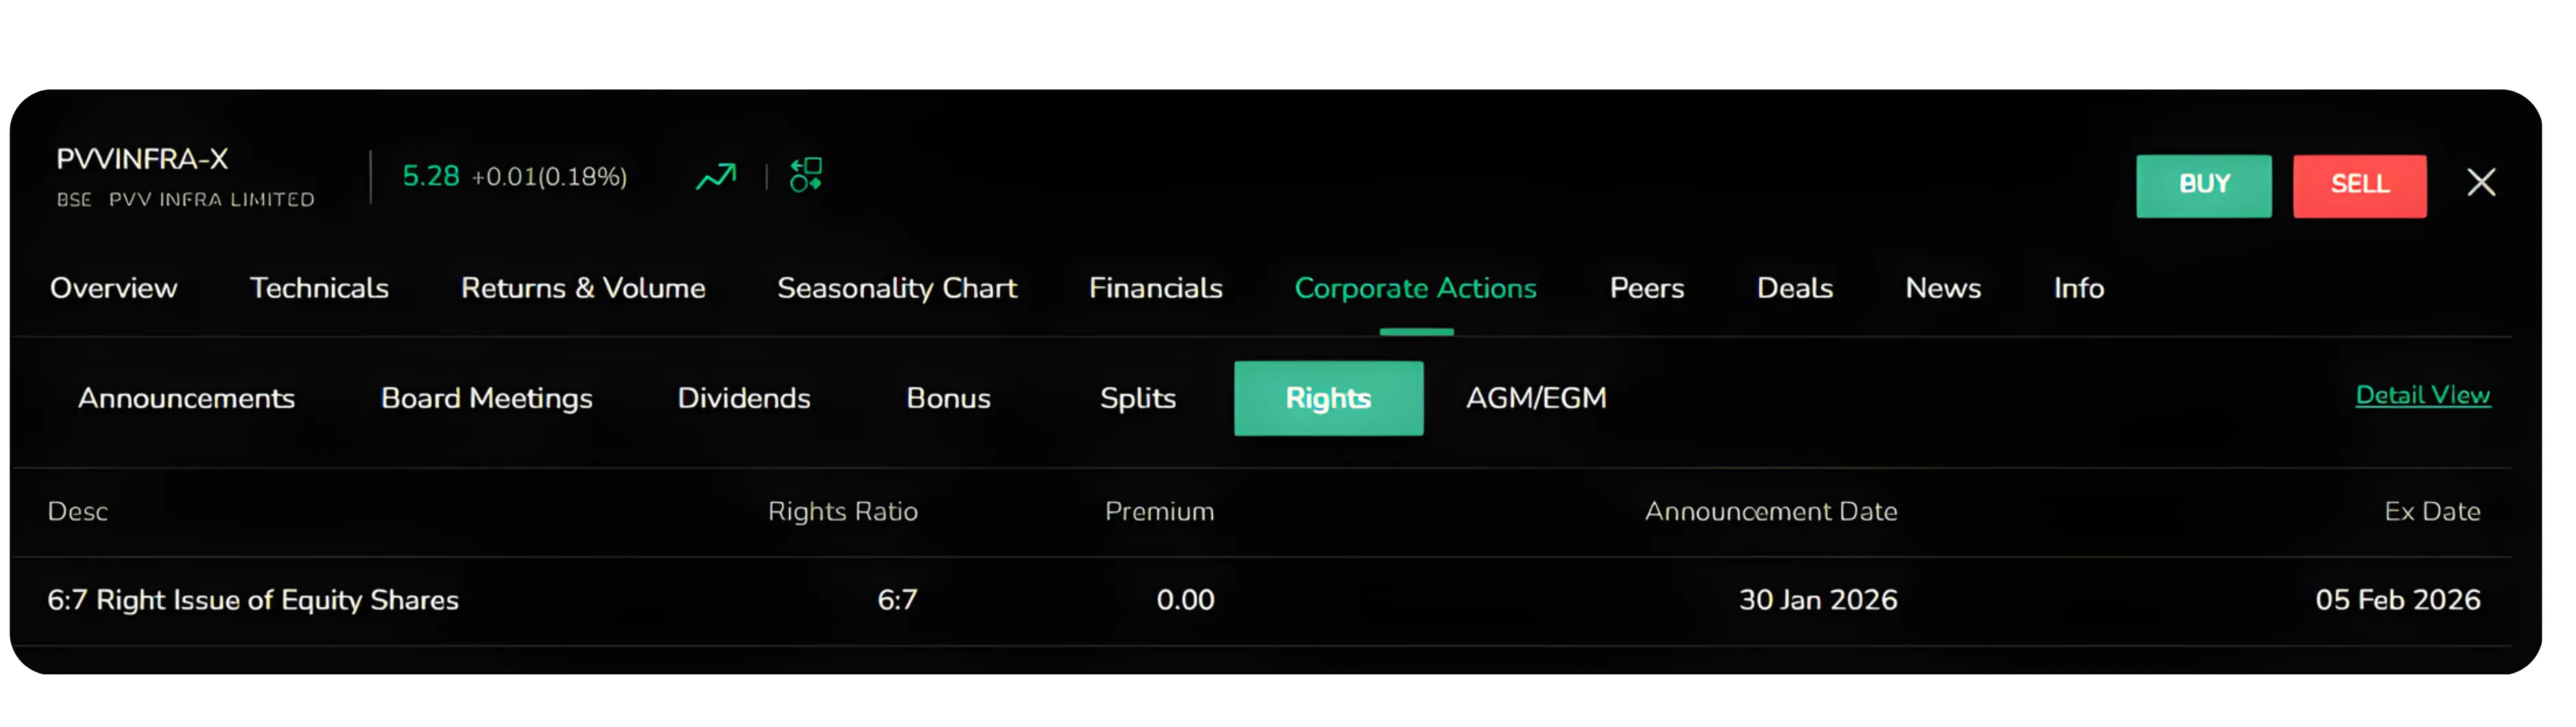
Rights
Shows rights offerings where existing shareholders can buy additional shares at a discount. This usually means the company is raising capital. Before reacting, check why funds are being raised.
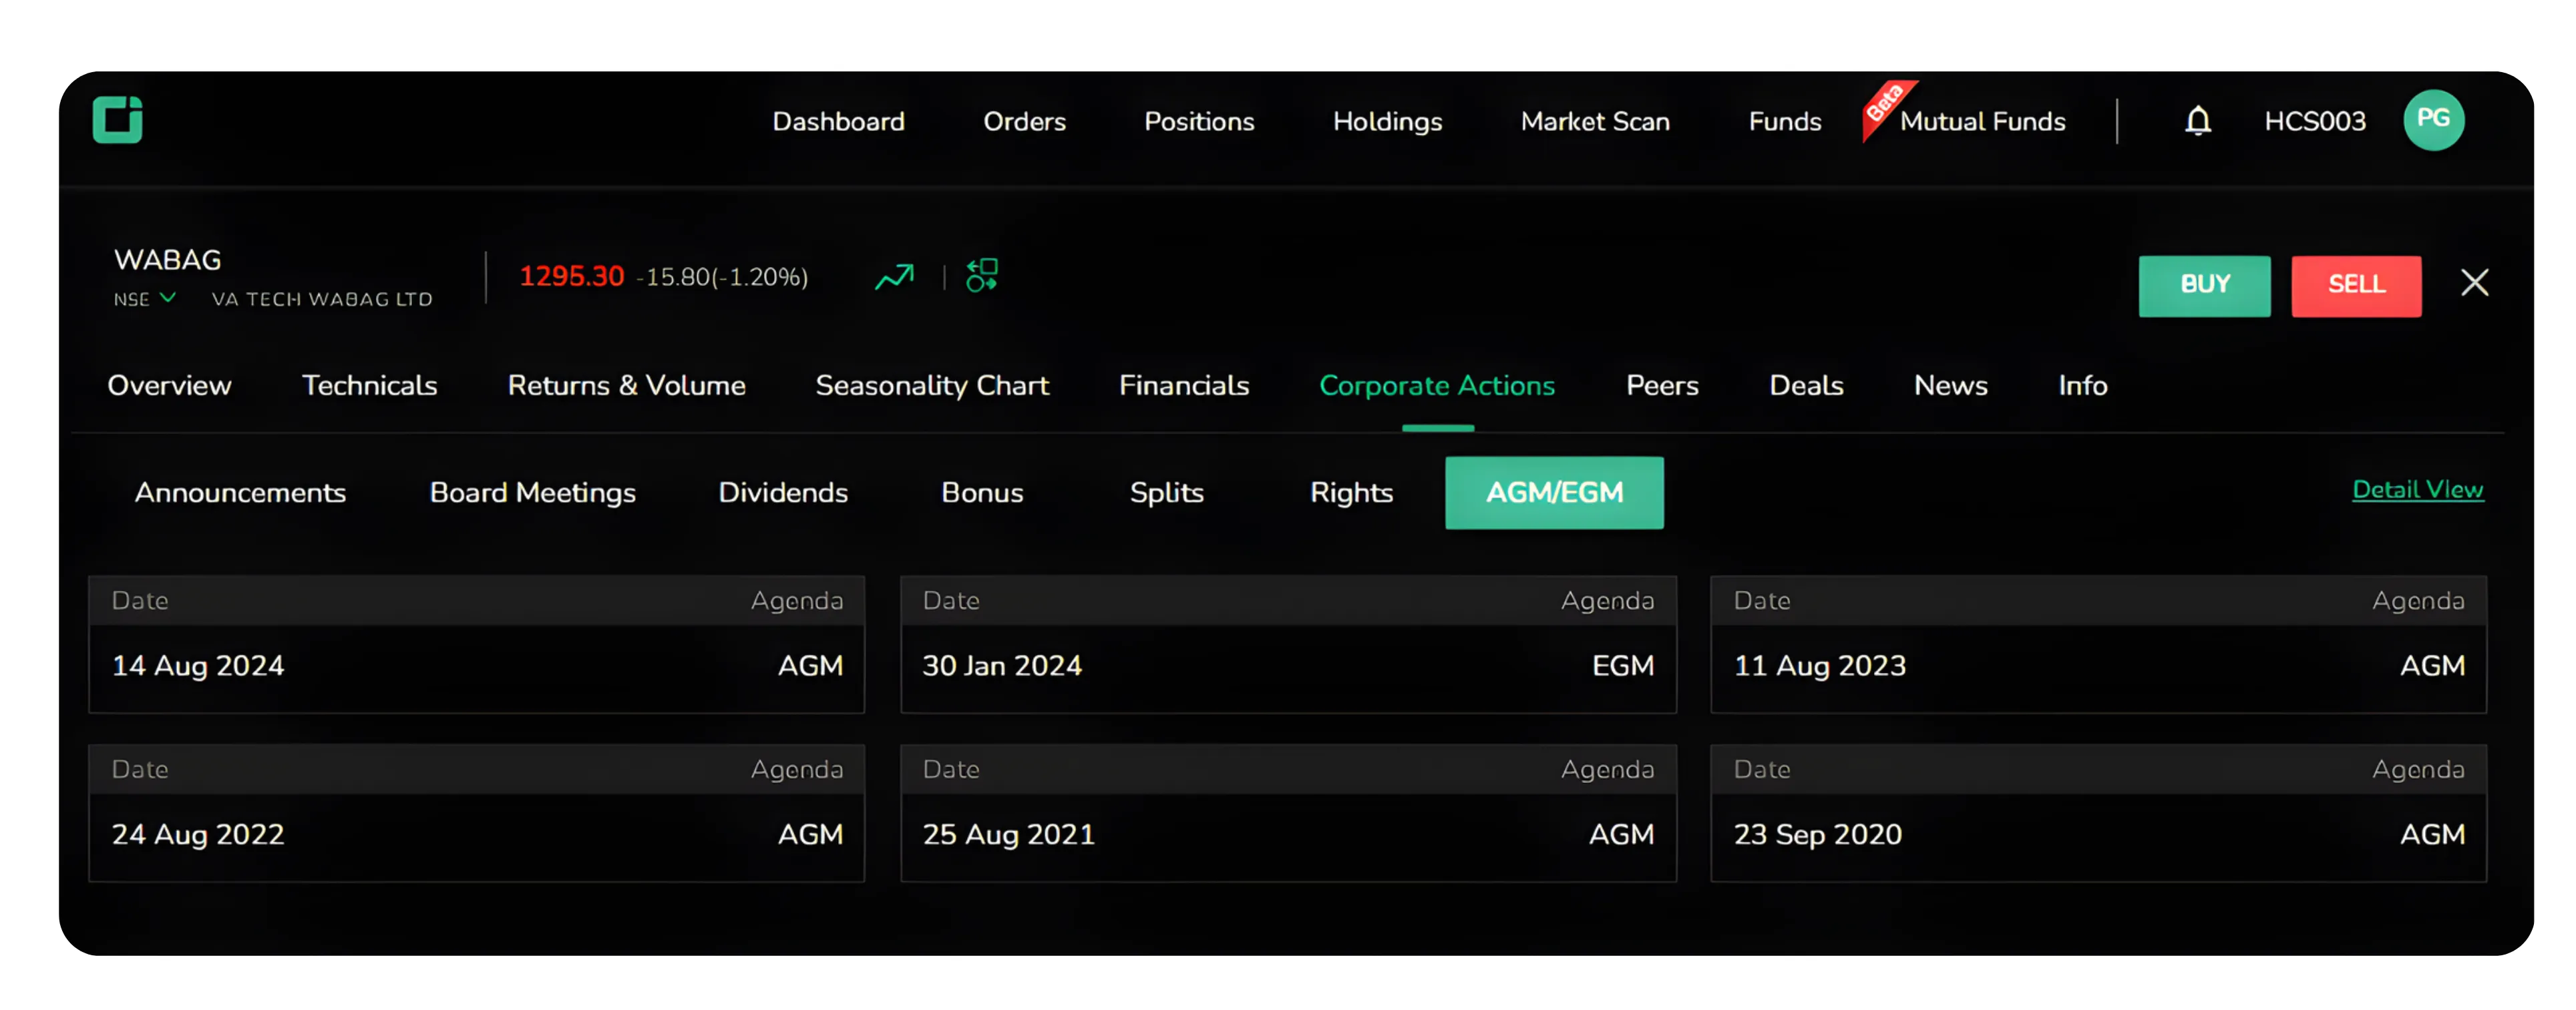
AGM/EGM
Annual and Extraordinary General Meetings where shareholder voting takes place. These include decisions related to directors, expansion plans, or structural changes.
Instead of reacting to market rumours, you can track all official corporate events here.
Struggling to find the data you need in your trading dashboard? Also read: Customize your CubePlus columns to display only the metrics that matter for faster, better decisions.
2. Peers
The stock peer comparison tool lets you compare your selected stock with competitors in the same sector, displaying key metrics like market price, market cap, PE ratio, and dividend yield side by side.
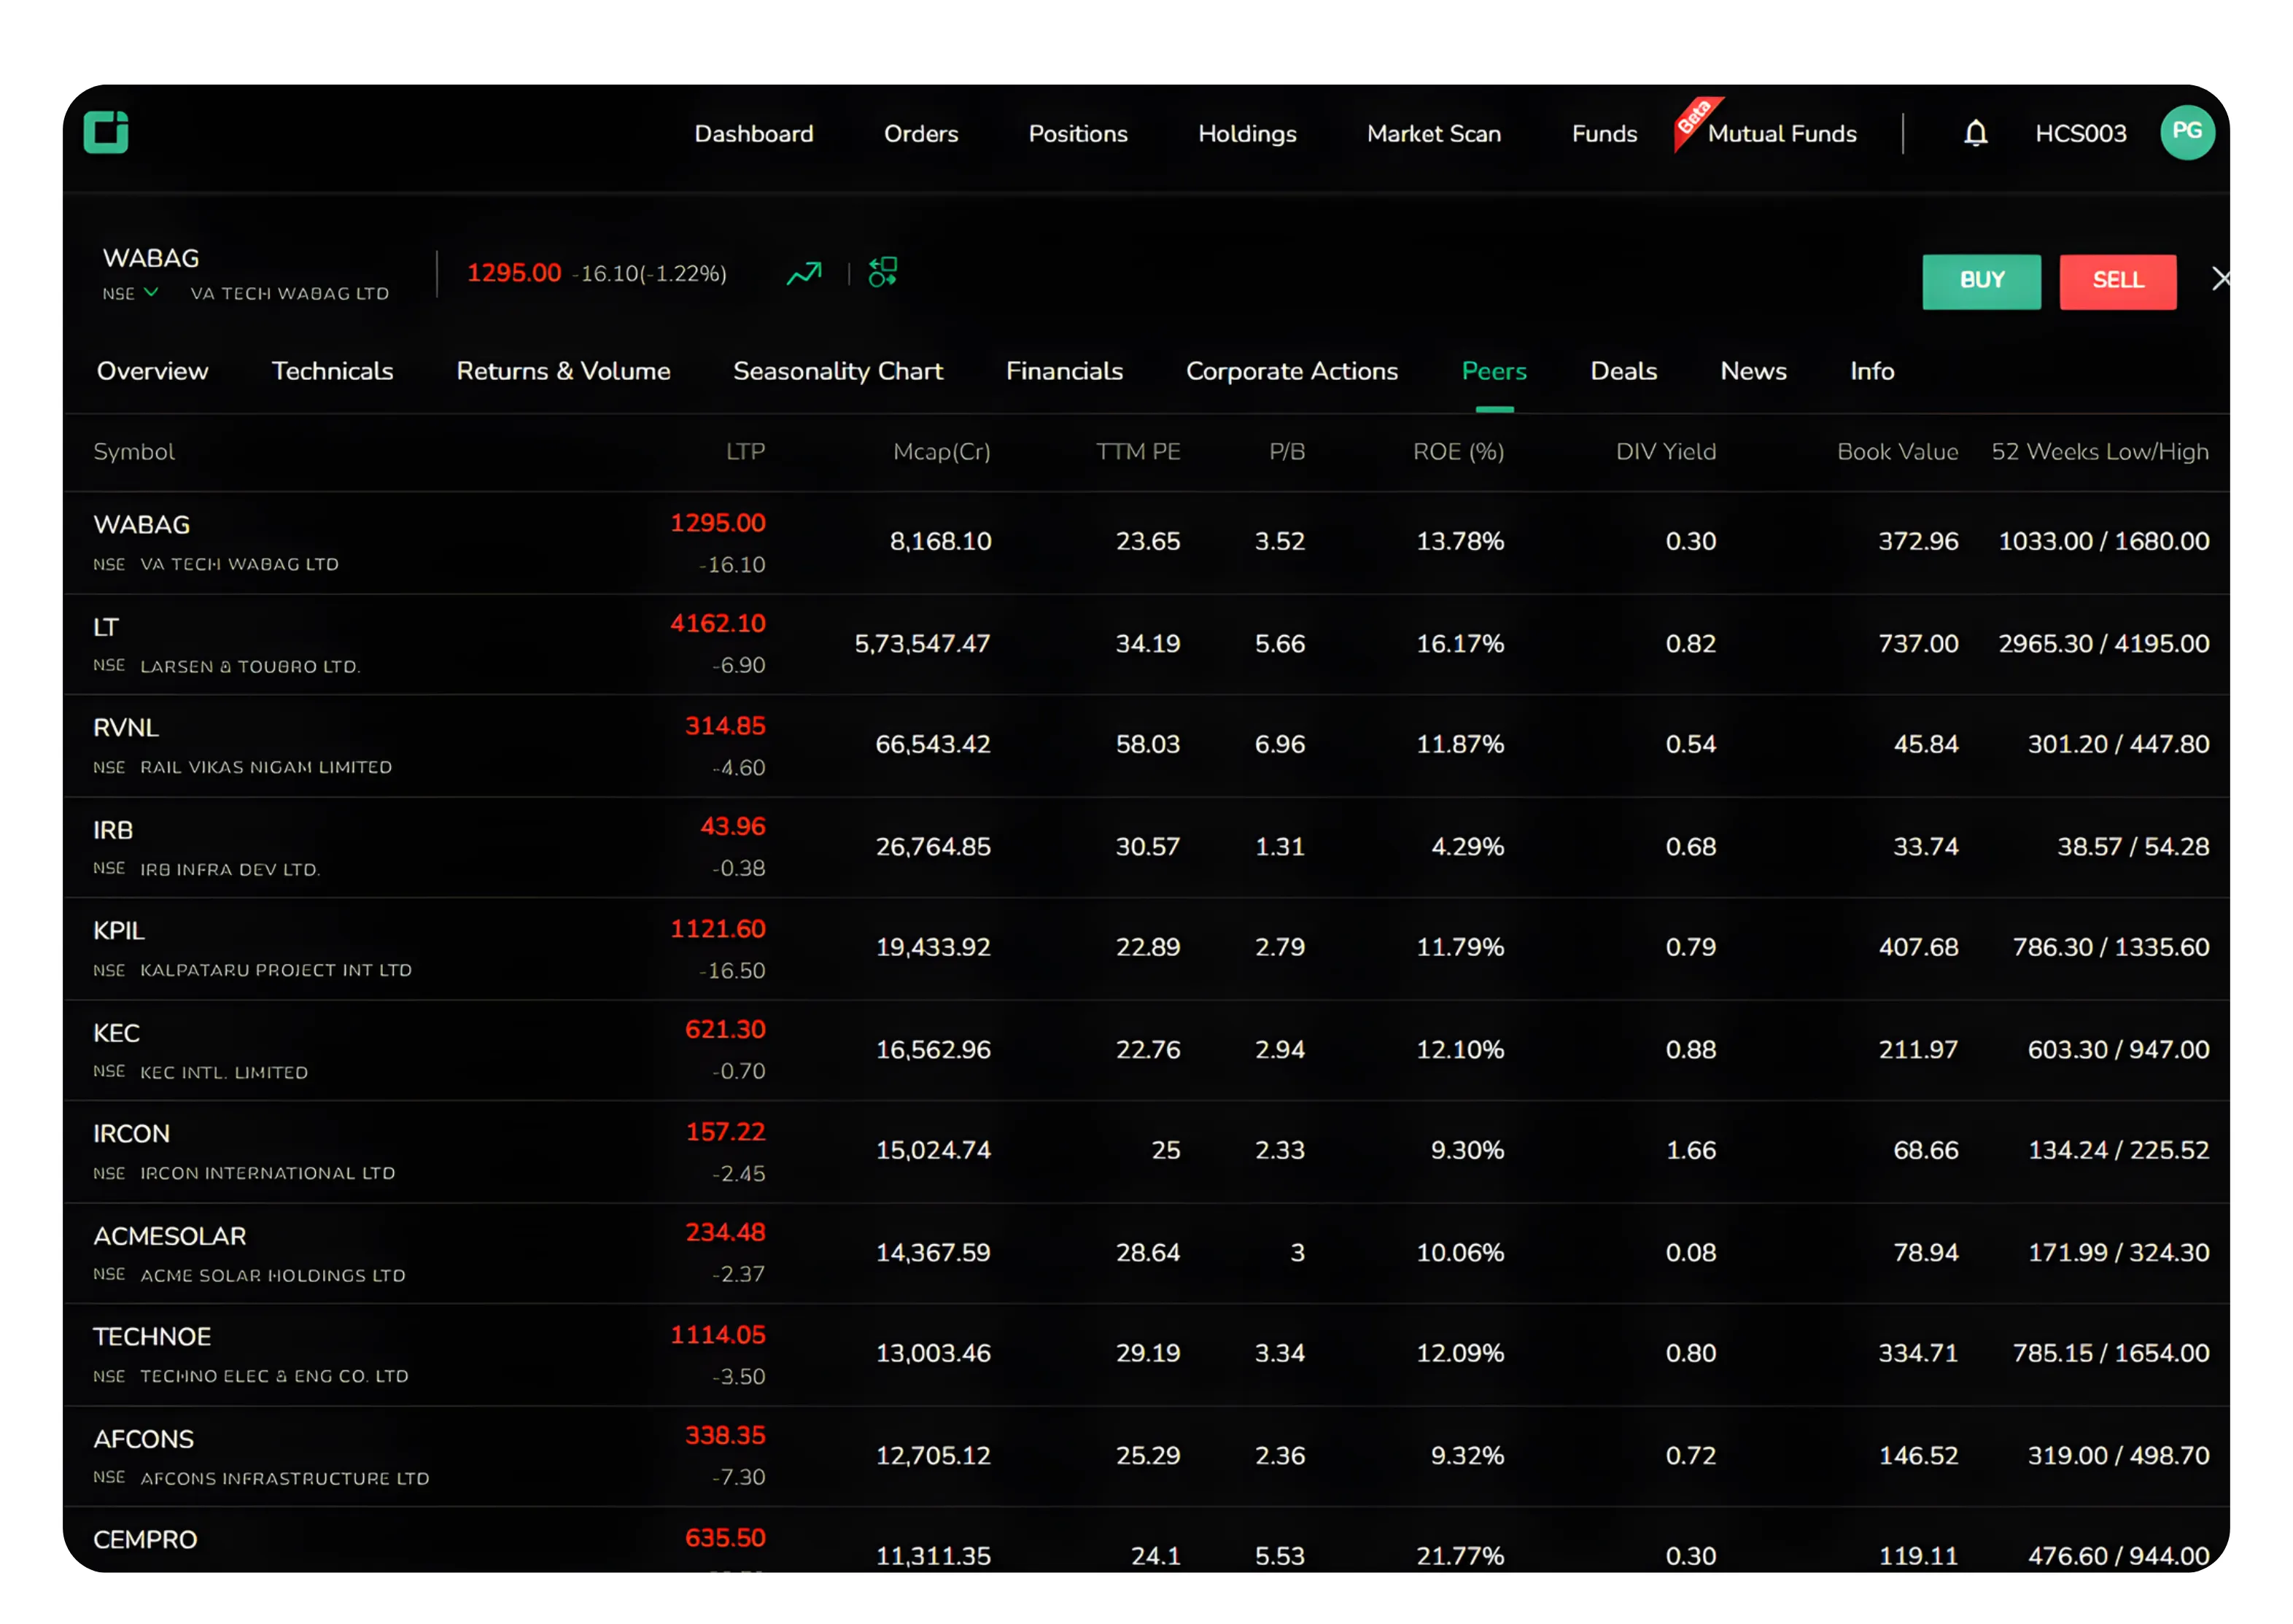
No stock exists in isolation. A lower PE ratio might suggest undervaluation, or a higher dividend yield might attract income investors. If peers outperform on most metrics, understand why. This comparison saves hours of research and helps you spot outliers that need deeper investigation.
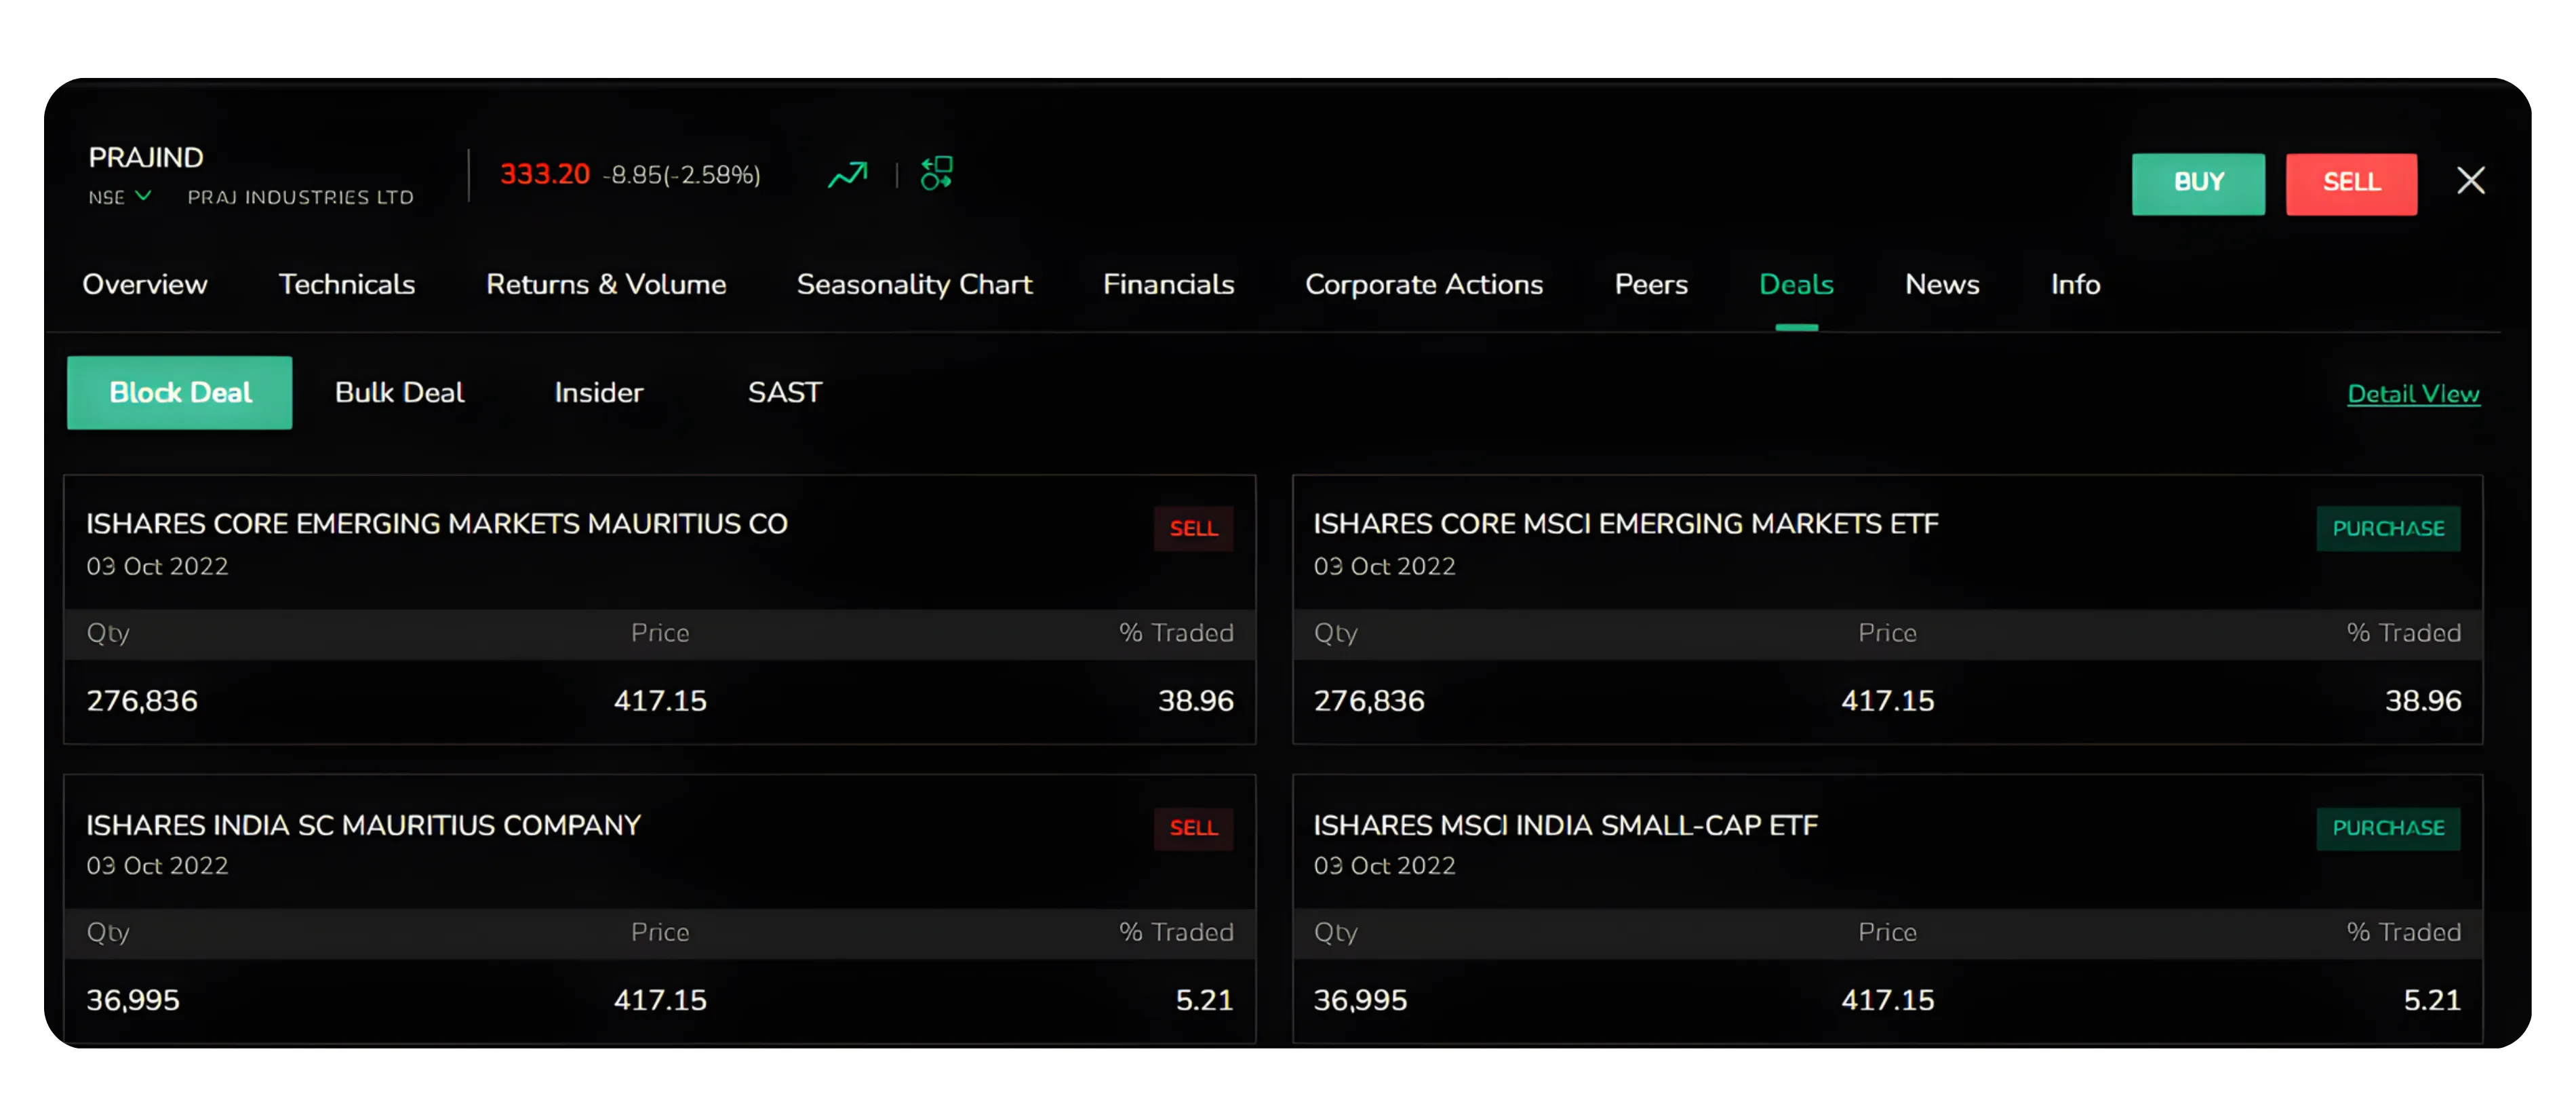
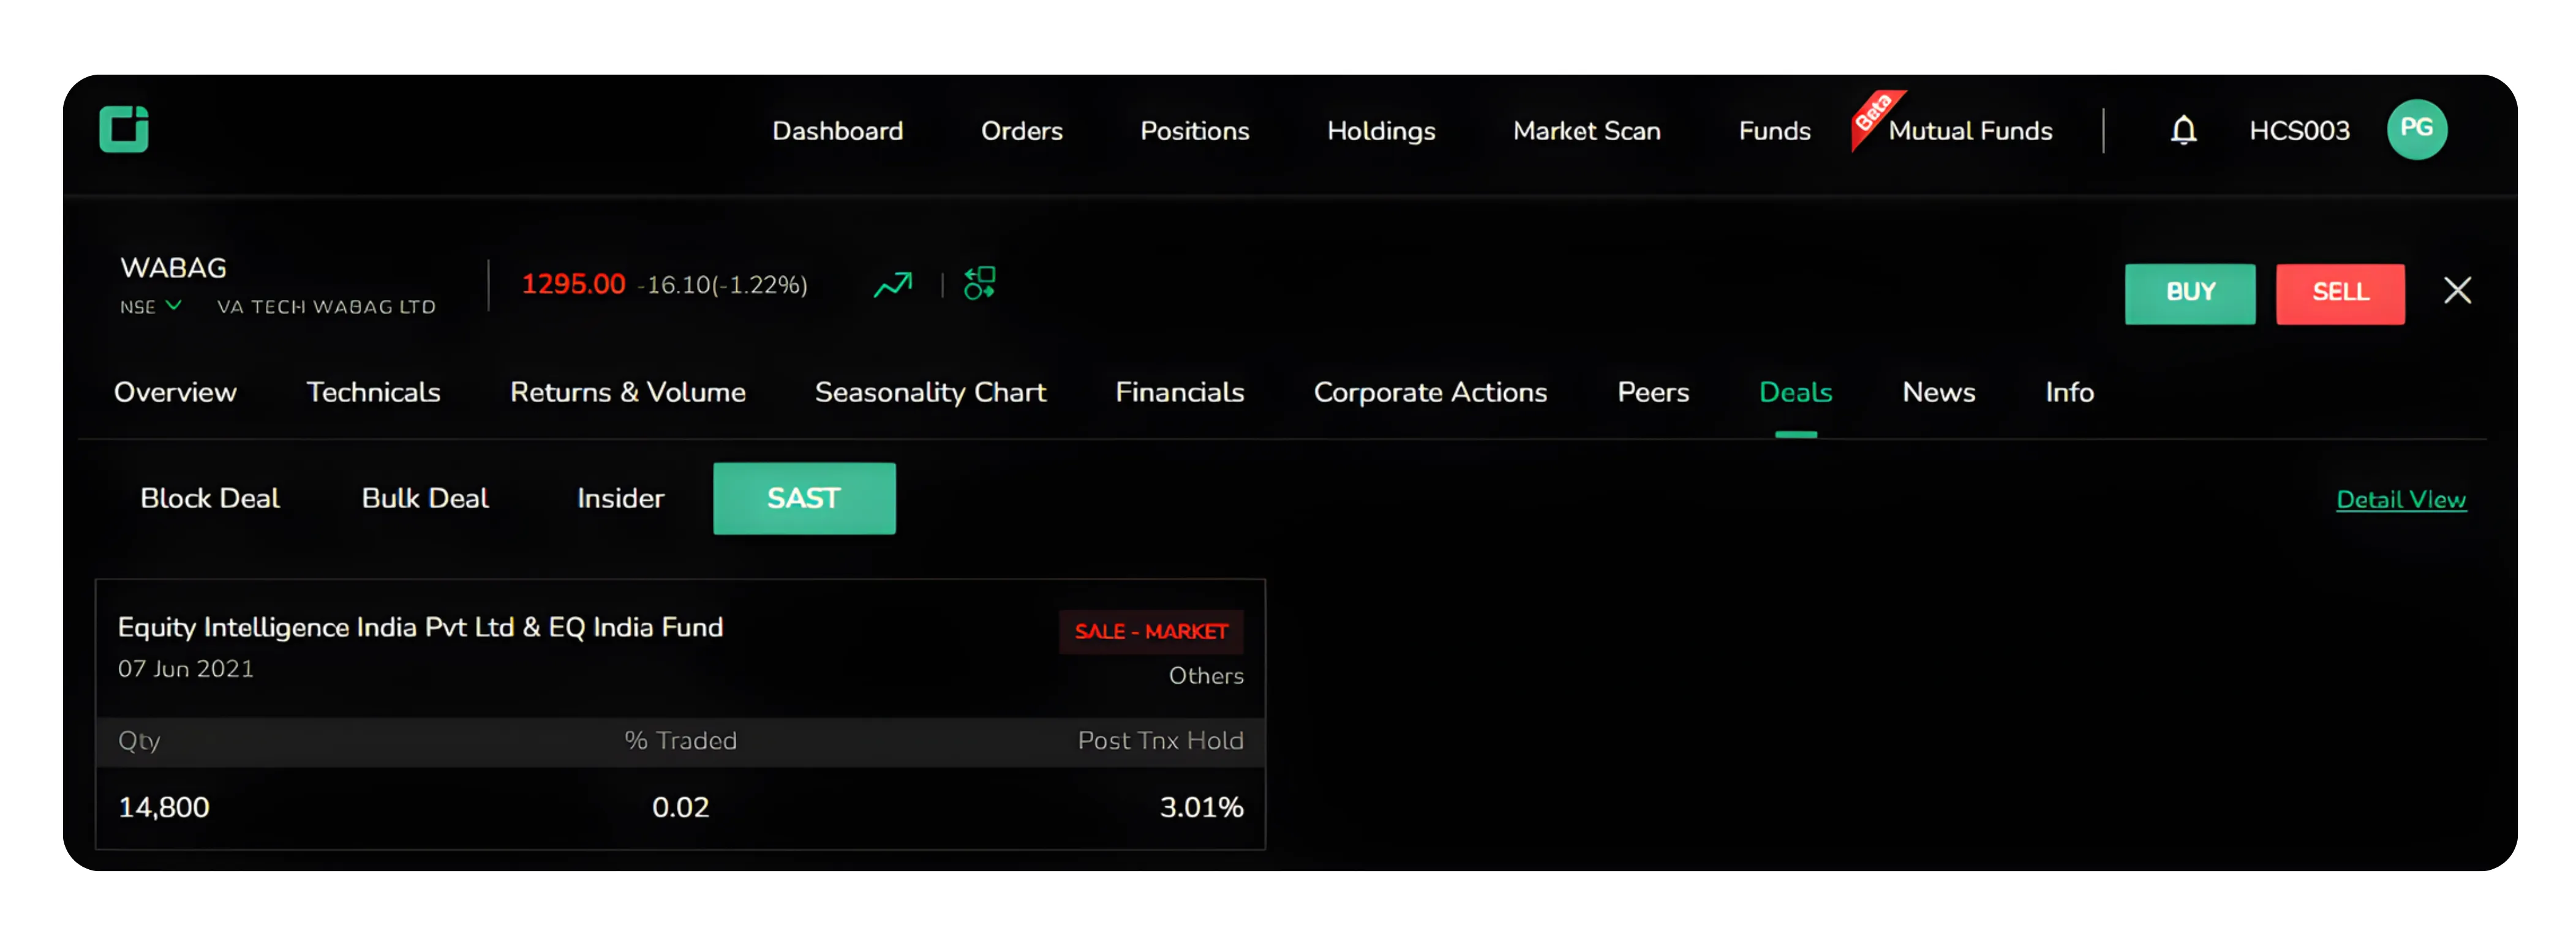
3. Deals
The Deals section helps you to track large transactions by institutions and insiders, revealing where smart money is moving.
Block Deals
Larger institutional trades outside regular hours, indicating major investors are entering or exiting positions.
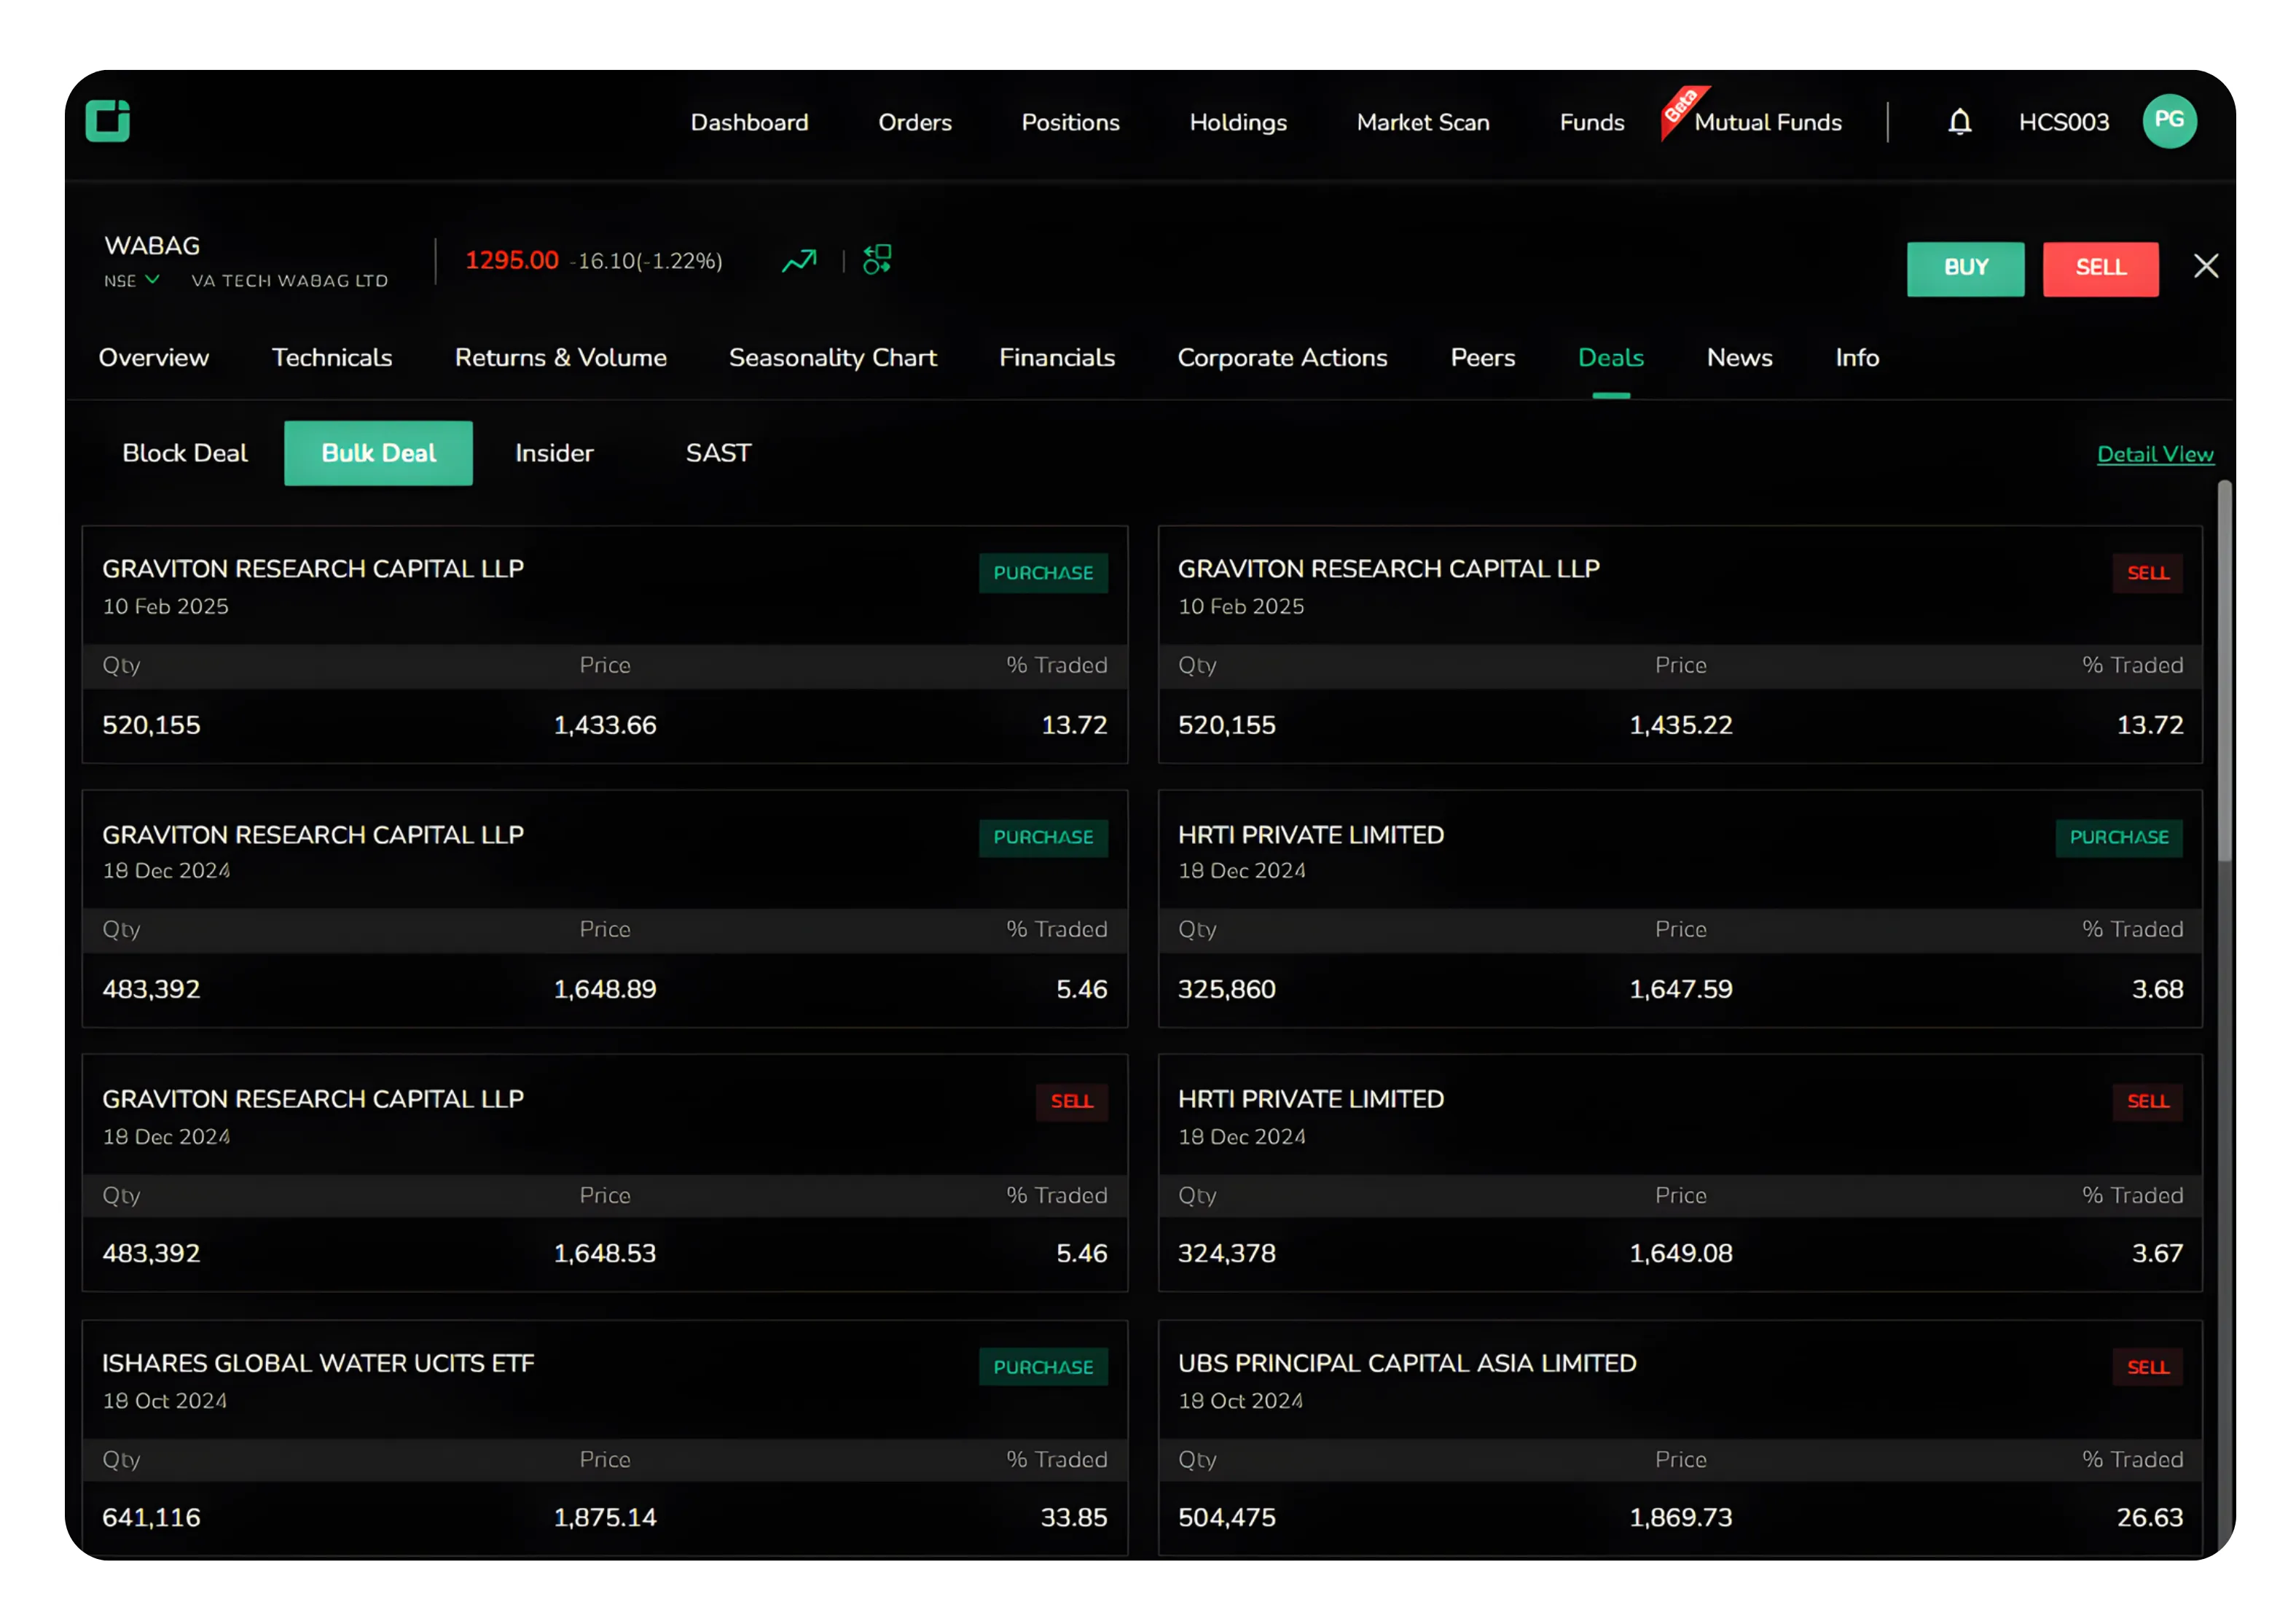
Bulk Deals
Shows transactions exceeding half a percent of total shares, with details on who traded, quantity, and price.
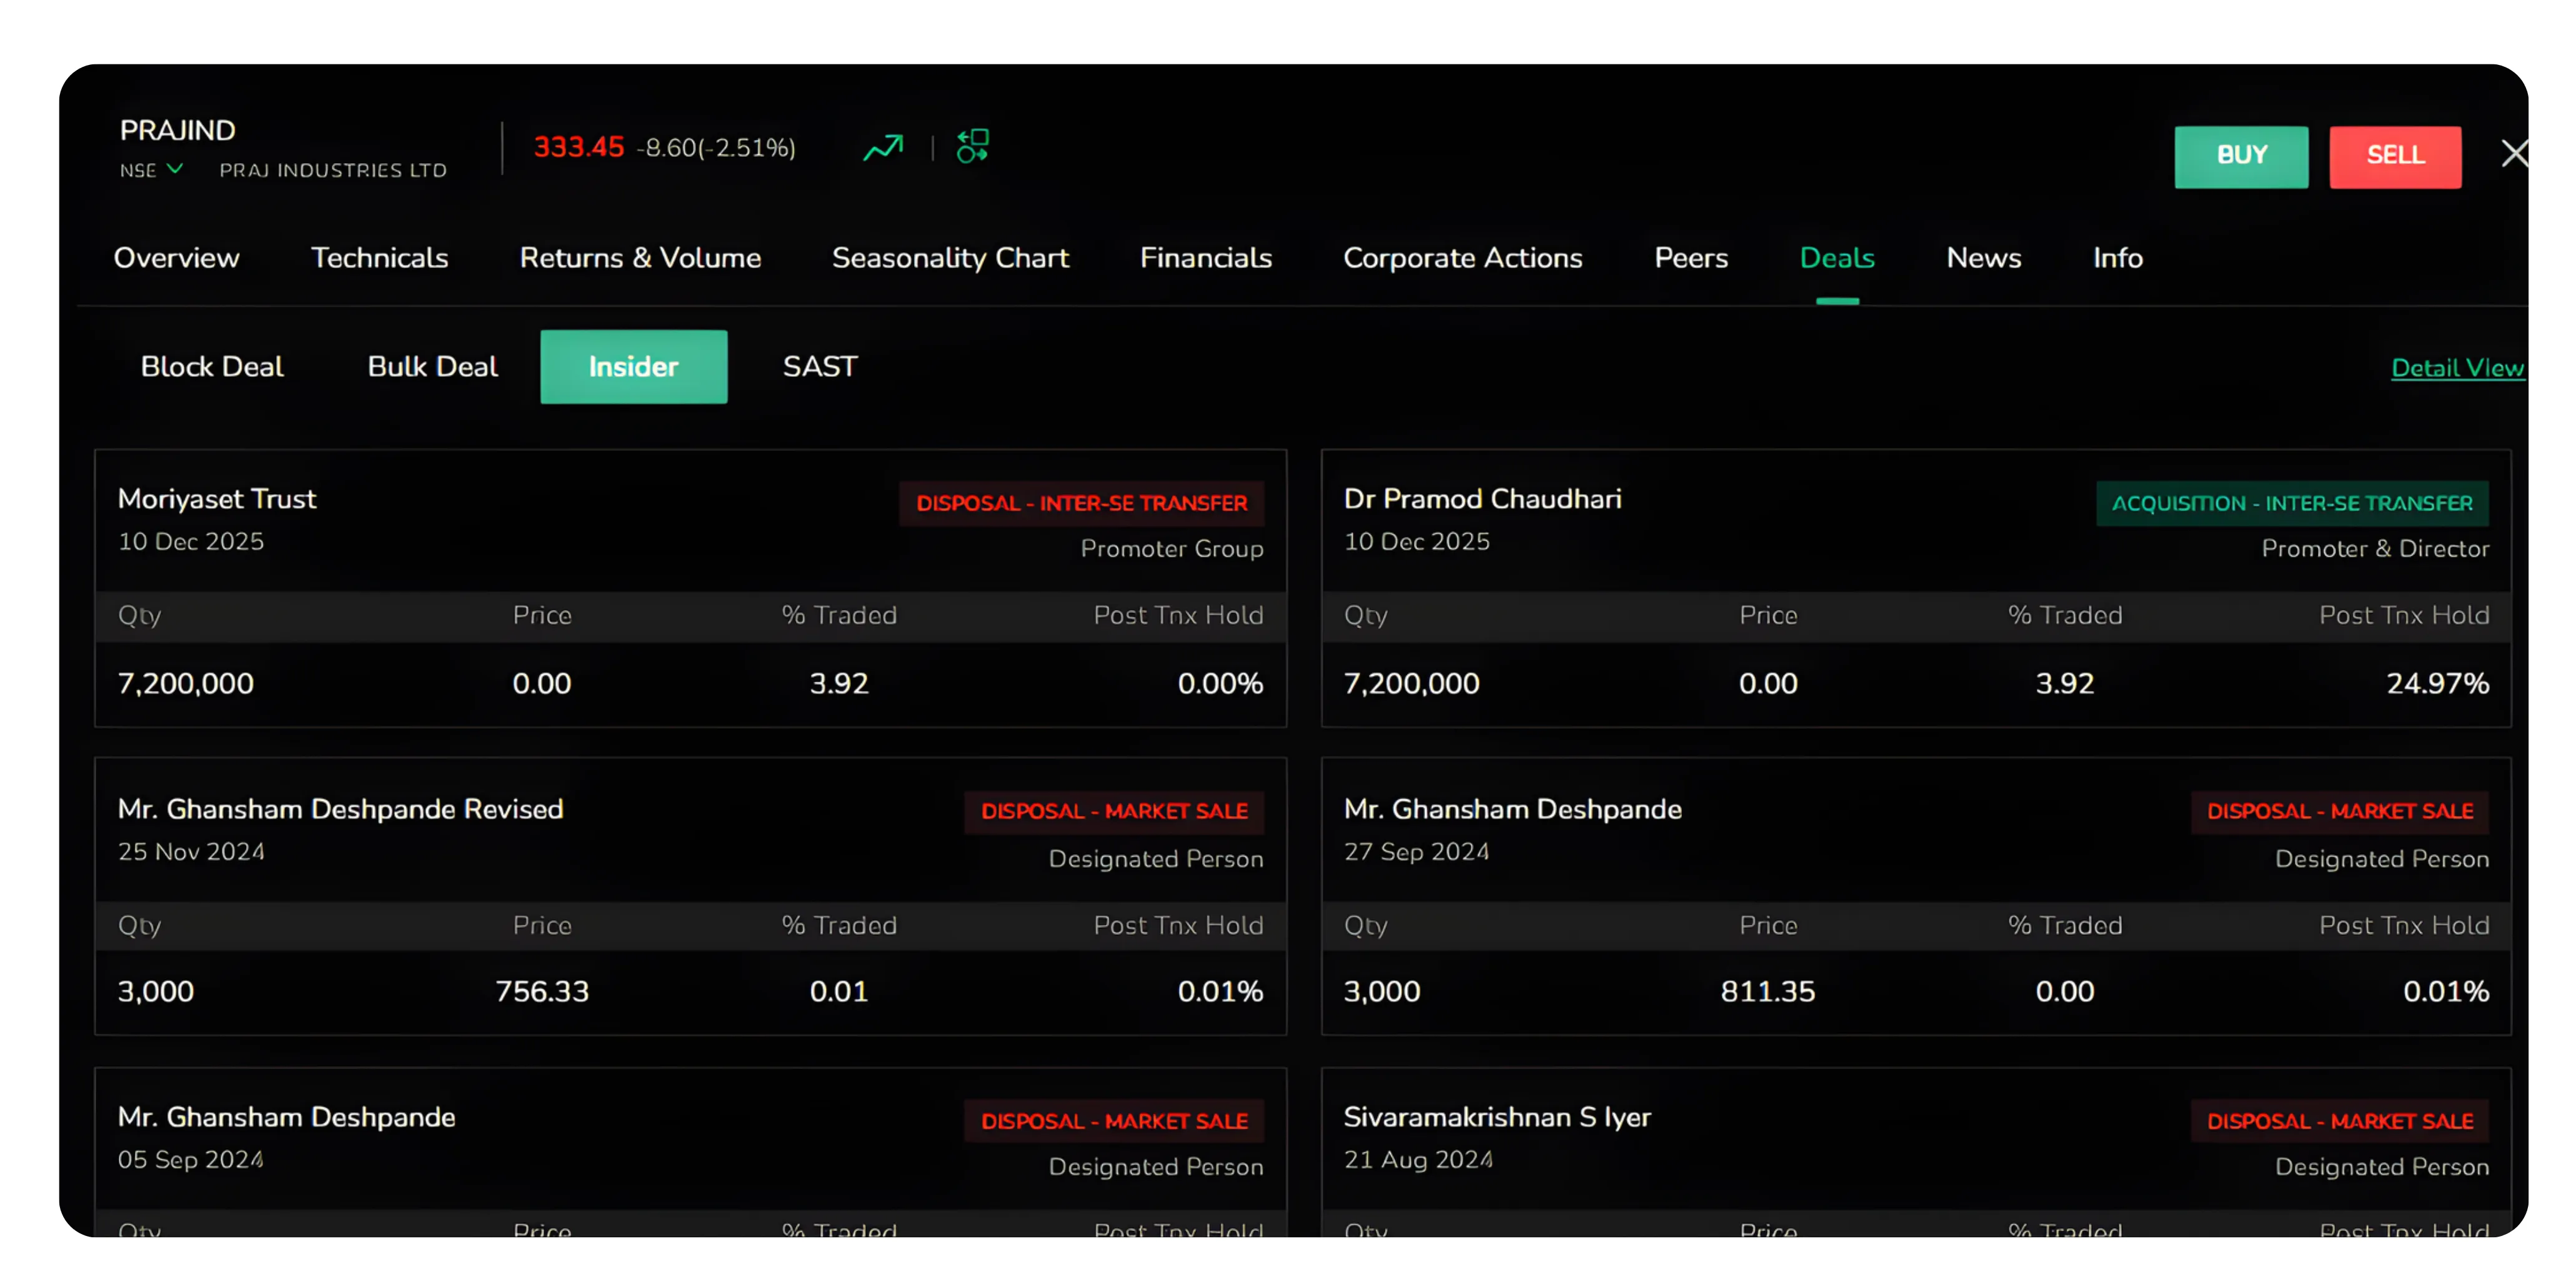
Insider
Tracks transactions by promoters, directors, and management. Insider buying suggests confidence, while selling warrants caution.
SAST
Substantial Acquisition of Shares and Takeovers tracks regulatory disclosures when investors acquire significant stakes in a company. These filings are mandatory when shareholding crosses certain thresholds and reveal serious long-term interest from strategic or financial investors.
These transactions don't tell the complete story but are important signals that add context to your analysis.
Also read: Using the Results Calendar on CubePlus to track quarterly results and plan trades around key earnings dates.
4. News
A curated feed of news articles, press releases, and market updates aggregated from multiple sources. You'll see project wins, quarterly results, management changes, and industry trends.
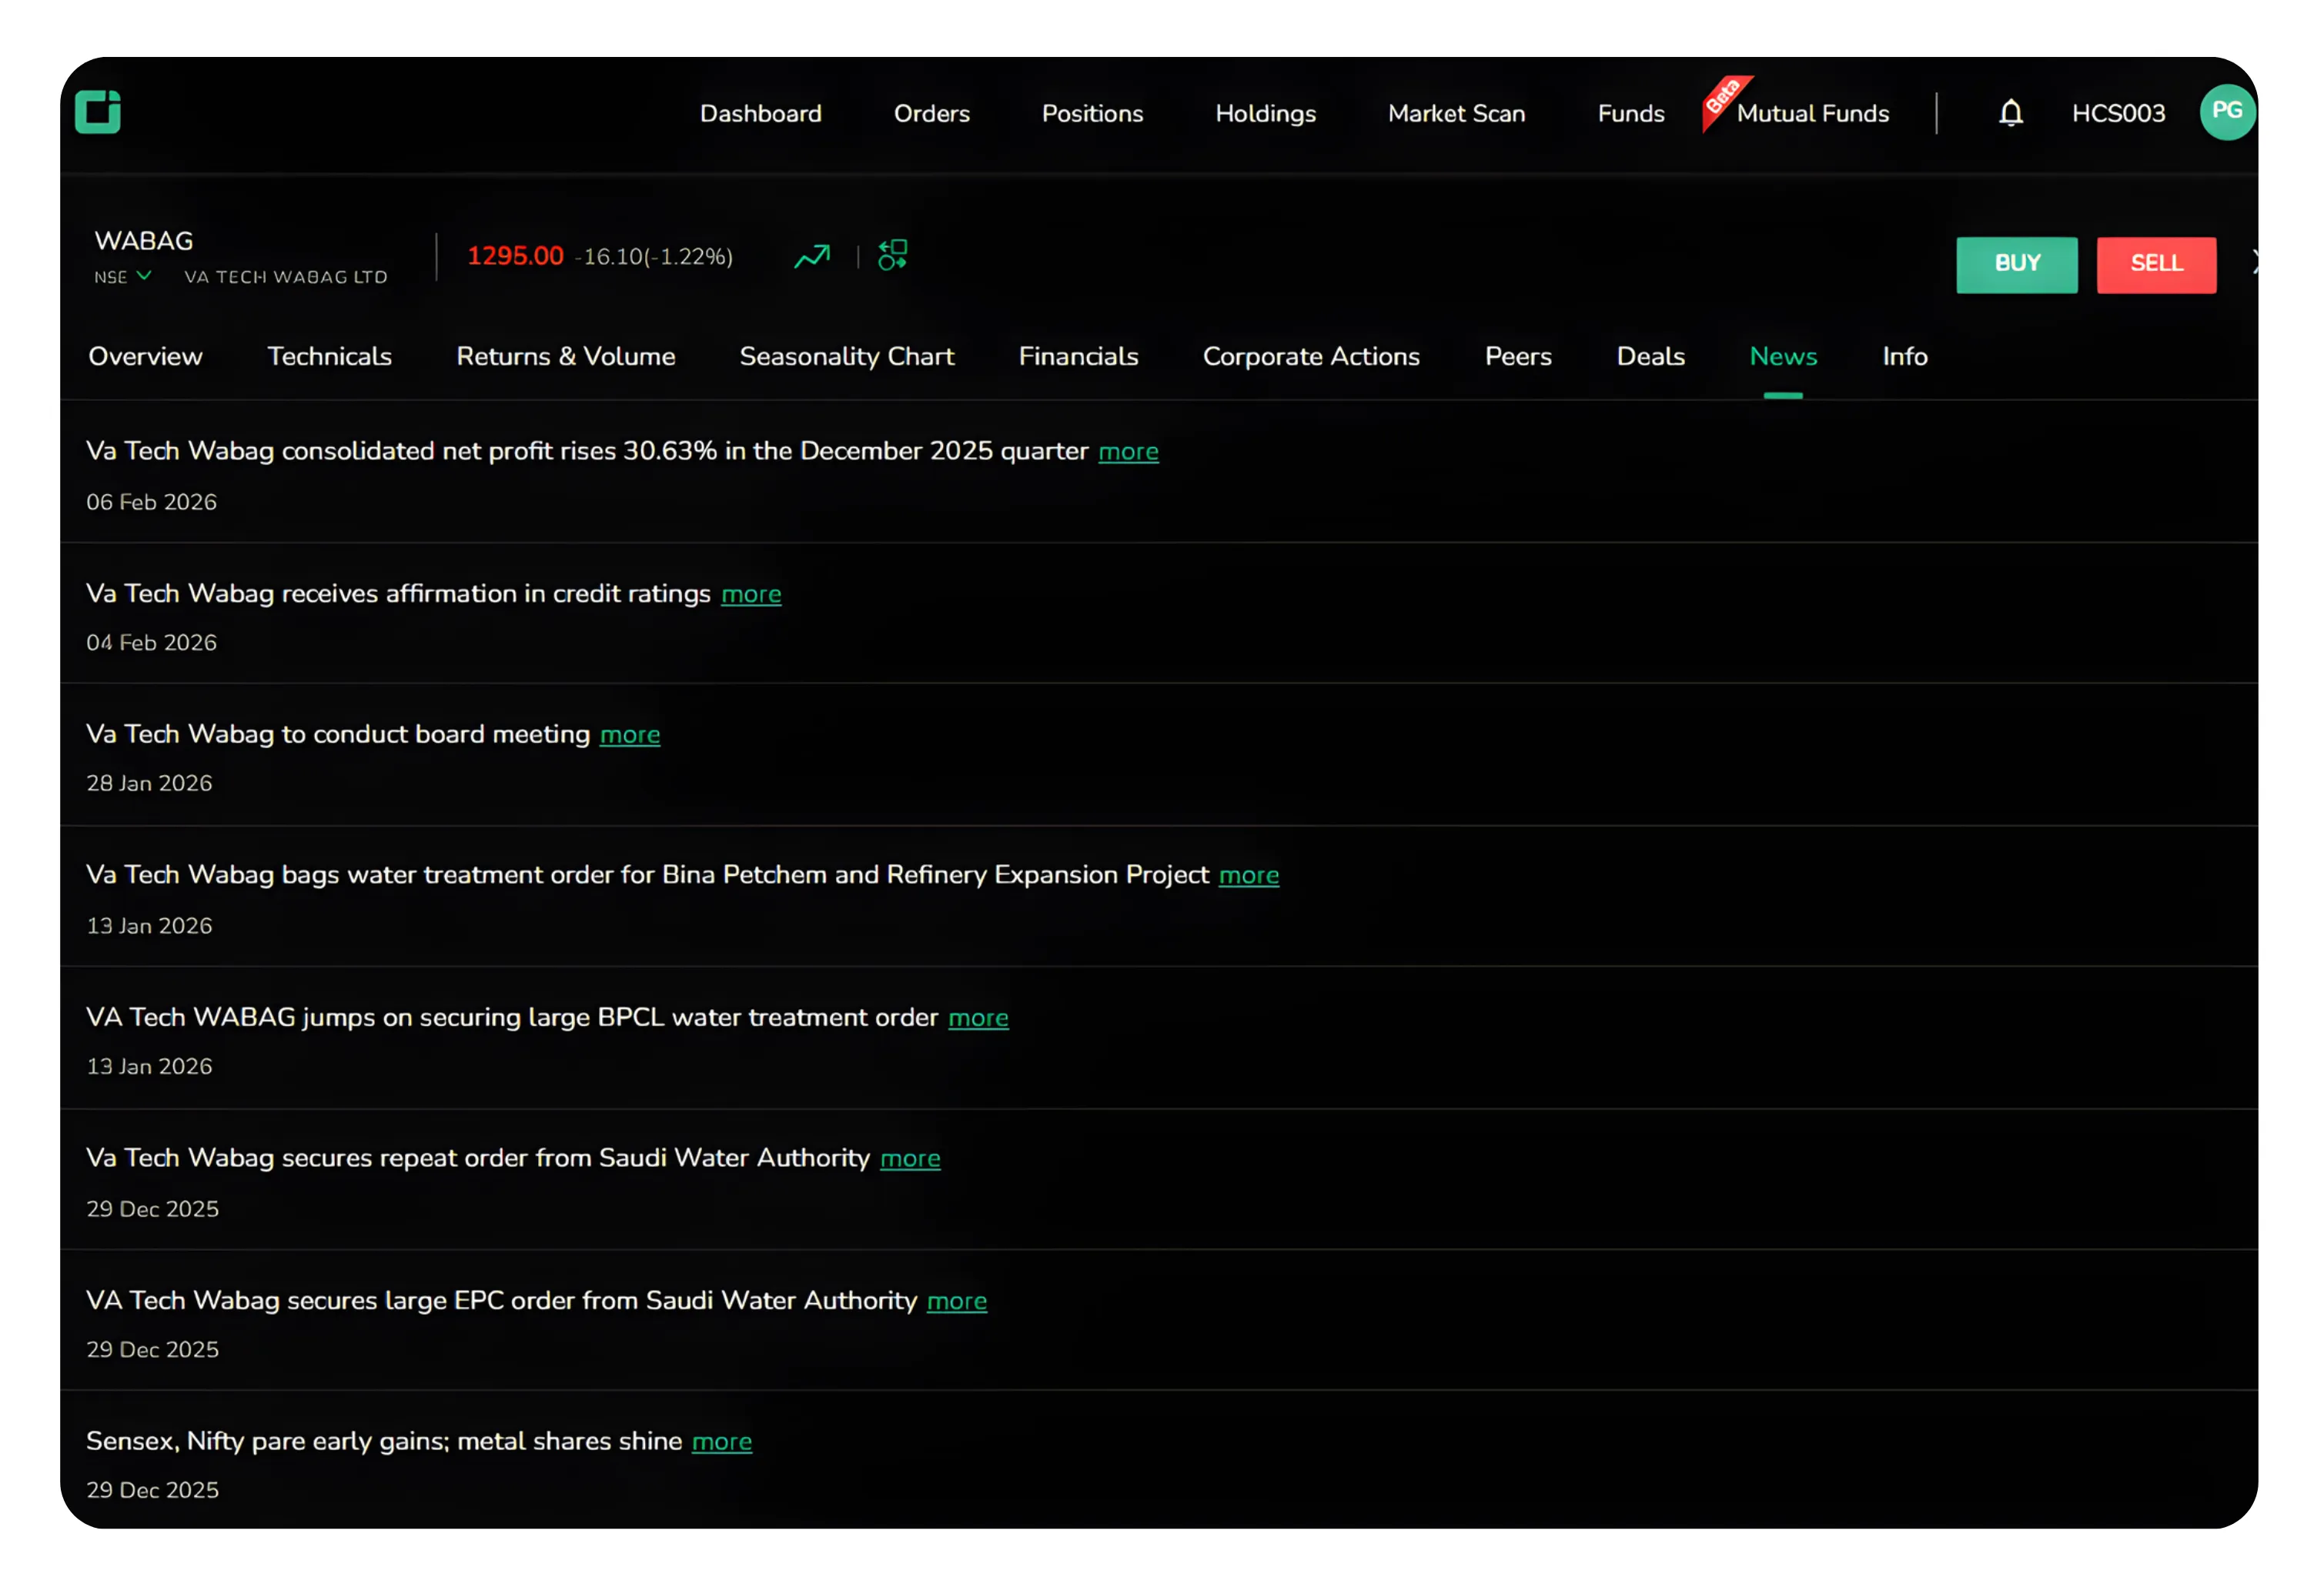
Use news to stay informed, not to make impulsive trades. Major contracts are positive, but check if the market has already reacted and whether the news changes your thesis. Similarly, don't panic-sell on negative news. Sometimes it's already priced in or temporary. Let Corporate Actions, Peers, and Deals guide your decisions.
5. Info
Essential background information about the company.
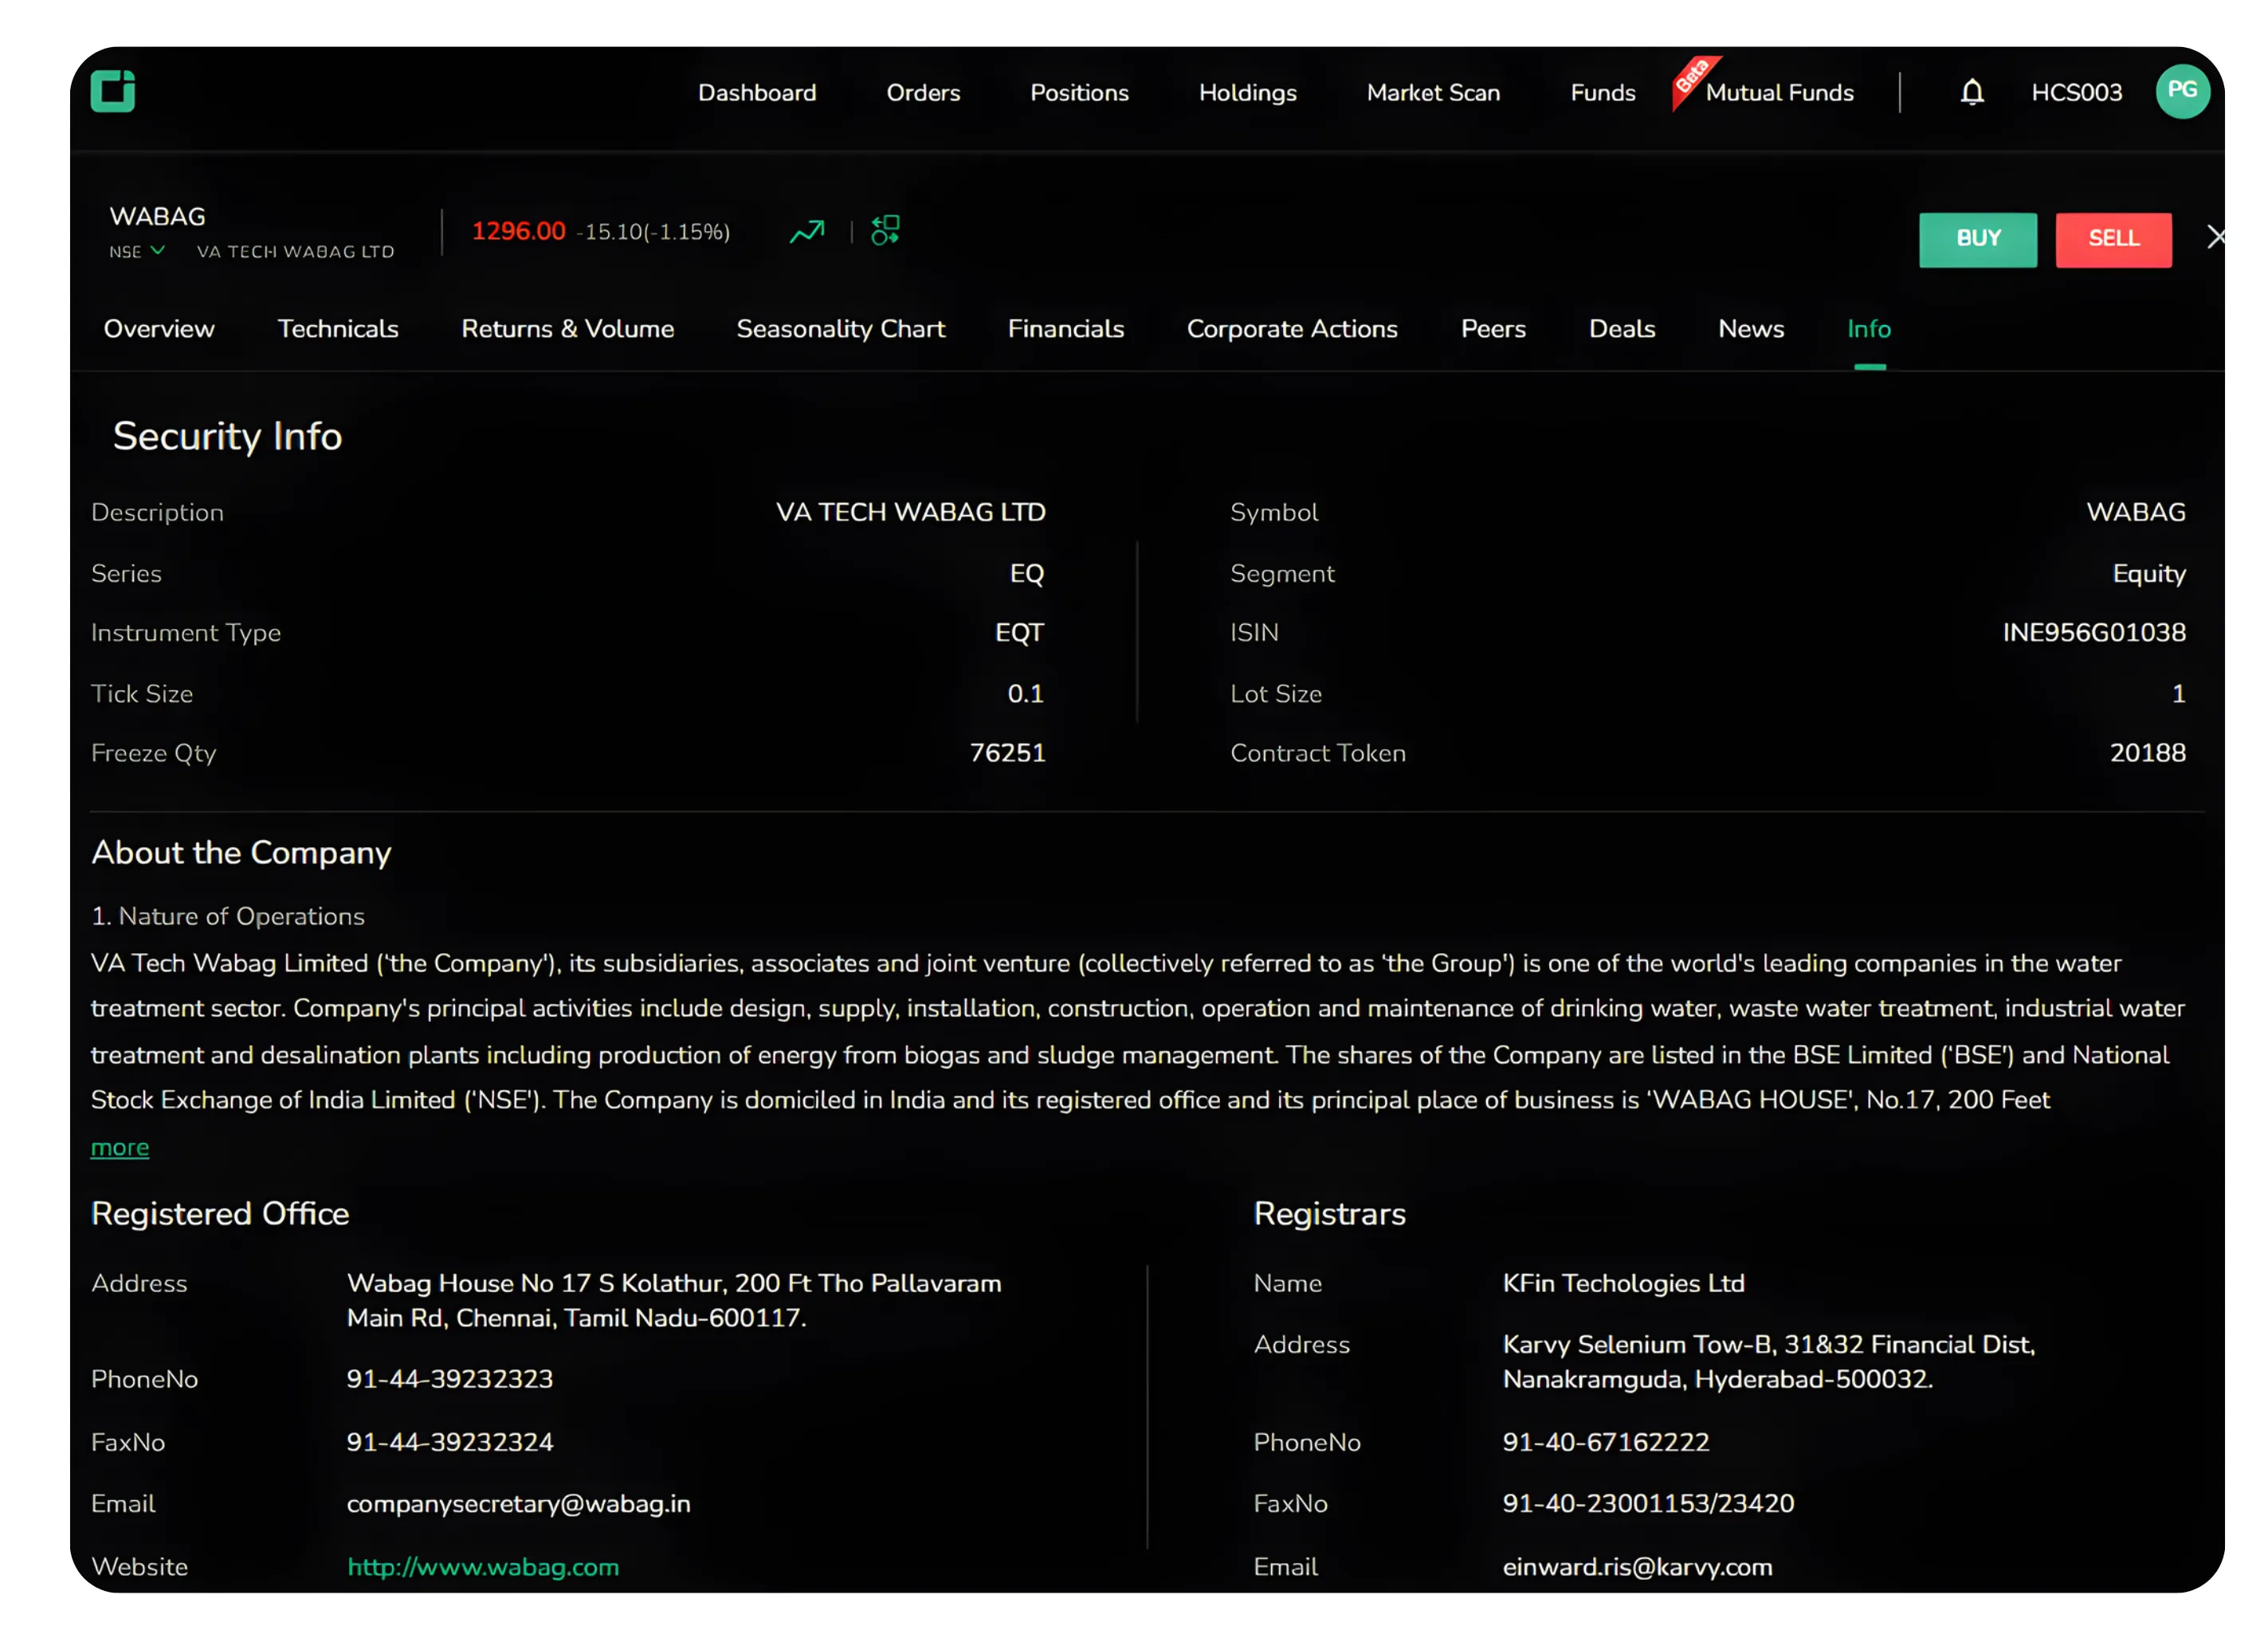
Security Info
Technical details like ISIN number, industry classification, face value, and listing information for reference and verification.
About the Company
Company overview including business description, registered office, and contact information. Understanding what the company does and its business model is fundamental.
Bringing It All Together
When evaluating a stock, check Corporate Actions for dividend history and bonuses, compare it with Peers to assess valuation, review Deals for institutional activity, scan News for developments, and verify the business model in Info. Combined, these sections give you confidence backed by data, not tips or chart patterns alone.
CubePlus brings these layers into one workspace so you don’t have to jump between multiple portals. Spend a few minutes exploring these tabs the next time you research a stock. The difference shows in the quality of decisions you make.
Disclaimer: The information provided in our blogs is for informational purposes only and should not be construed as financial, investment, or trading advice. Trading and investing in the securities market carries risk. Always conduct your own research and consult with a qualified financial advisor before making any investment decisions. Past performance is not indicative of future results. Copyrighted and original content for your trading and investing needs.
© 2026 — Tradejini. All Rights Reserved.