


During earnings season, investors track results to assess business momentum, portfolio managers look for confirmation or early warning signals, and traders focus on volatility and price reactions. The challenge isn’t access to information. It’s that earnings dates, price movement, and market context are usually spread across different screens. This becomes especially relevant when building an earnings season trading strategy in India, where result announcements are often tightly clustered.
The Tradejini CubePlus Results Calendar brings all of this into a single, structured view. Results are accessible directly from the watchlist as well as through the Market Scan section, keeping earnings events visible within everyday market workflows. This gives both investors and traders a clear view of who is reporting, when they are reporting, and how the market is reacting in real time. Instead of treating earnings as static calendar entries, the feature presents them as live market events that can be reviewed, analysed, and acted upon.
Accessing results directly from your watchlist
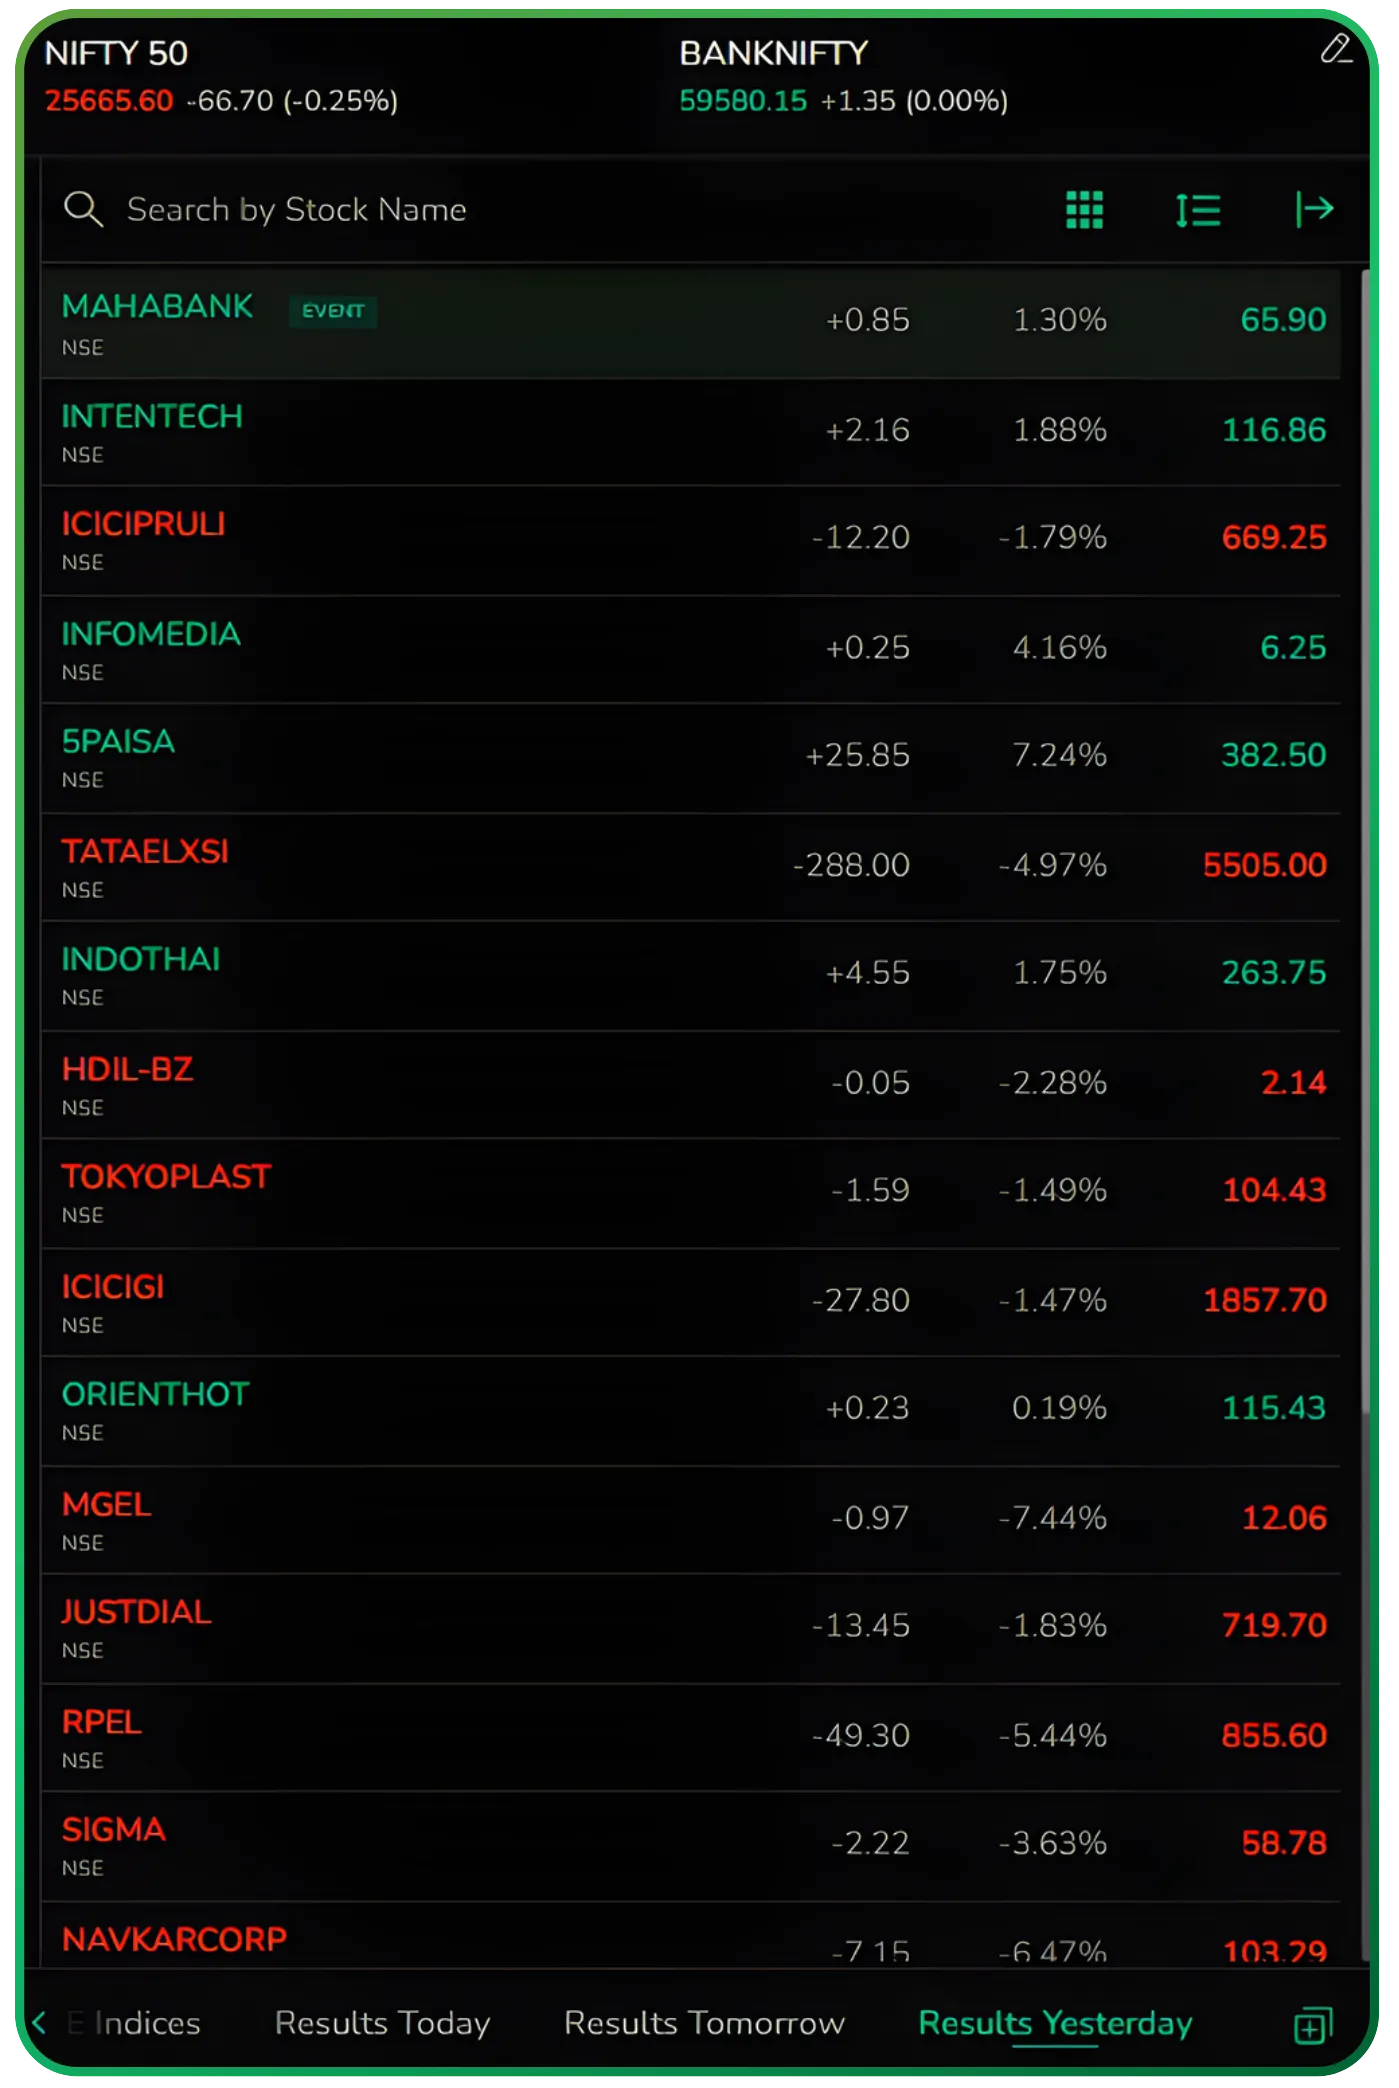
One of the more practical aspects of the Results Calendar is that it doesn’t live in isolation. Results are also surfaced directly inside your watchlist, marked clearly with an event tag. This means you don’t have to leave your active tracking screen to know which of your stocks are reporting today, tomorrow, or have reported recently.
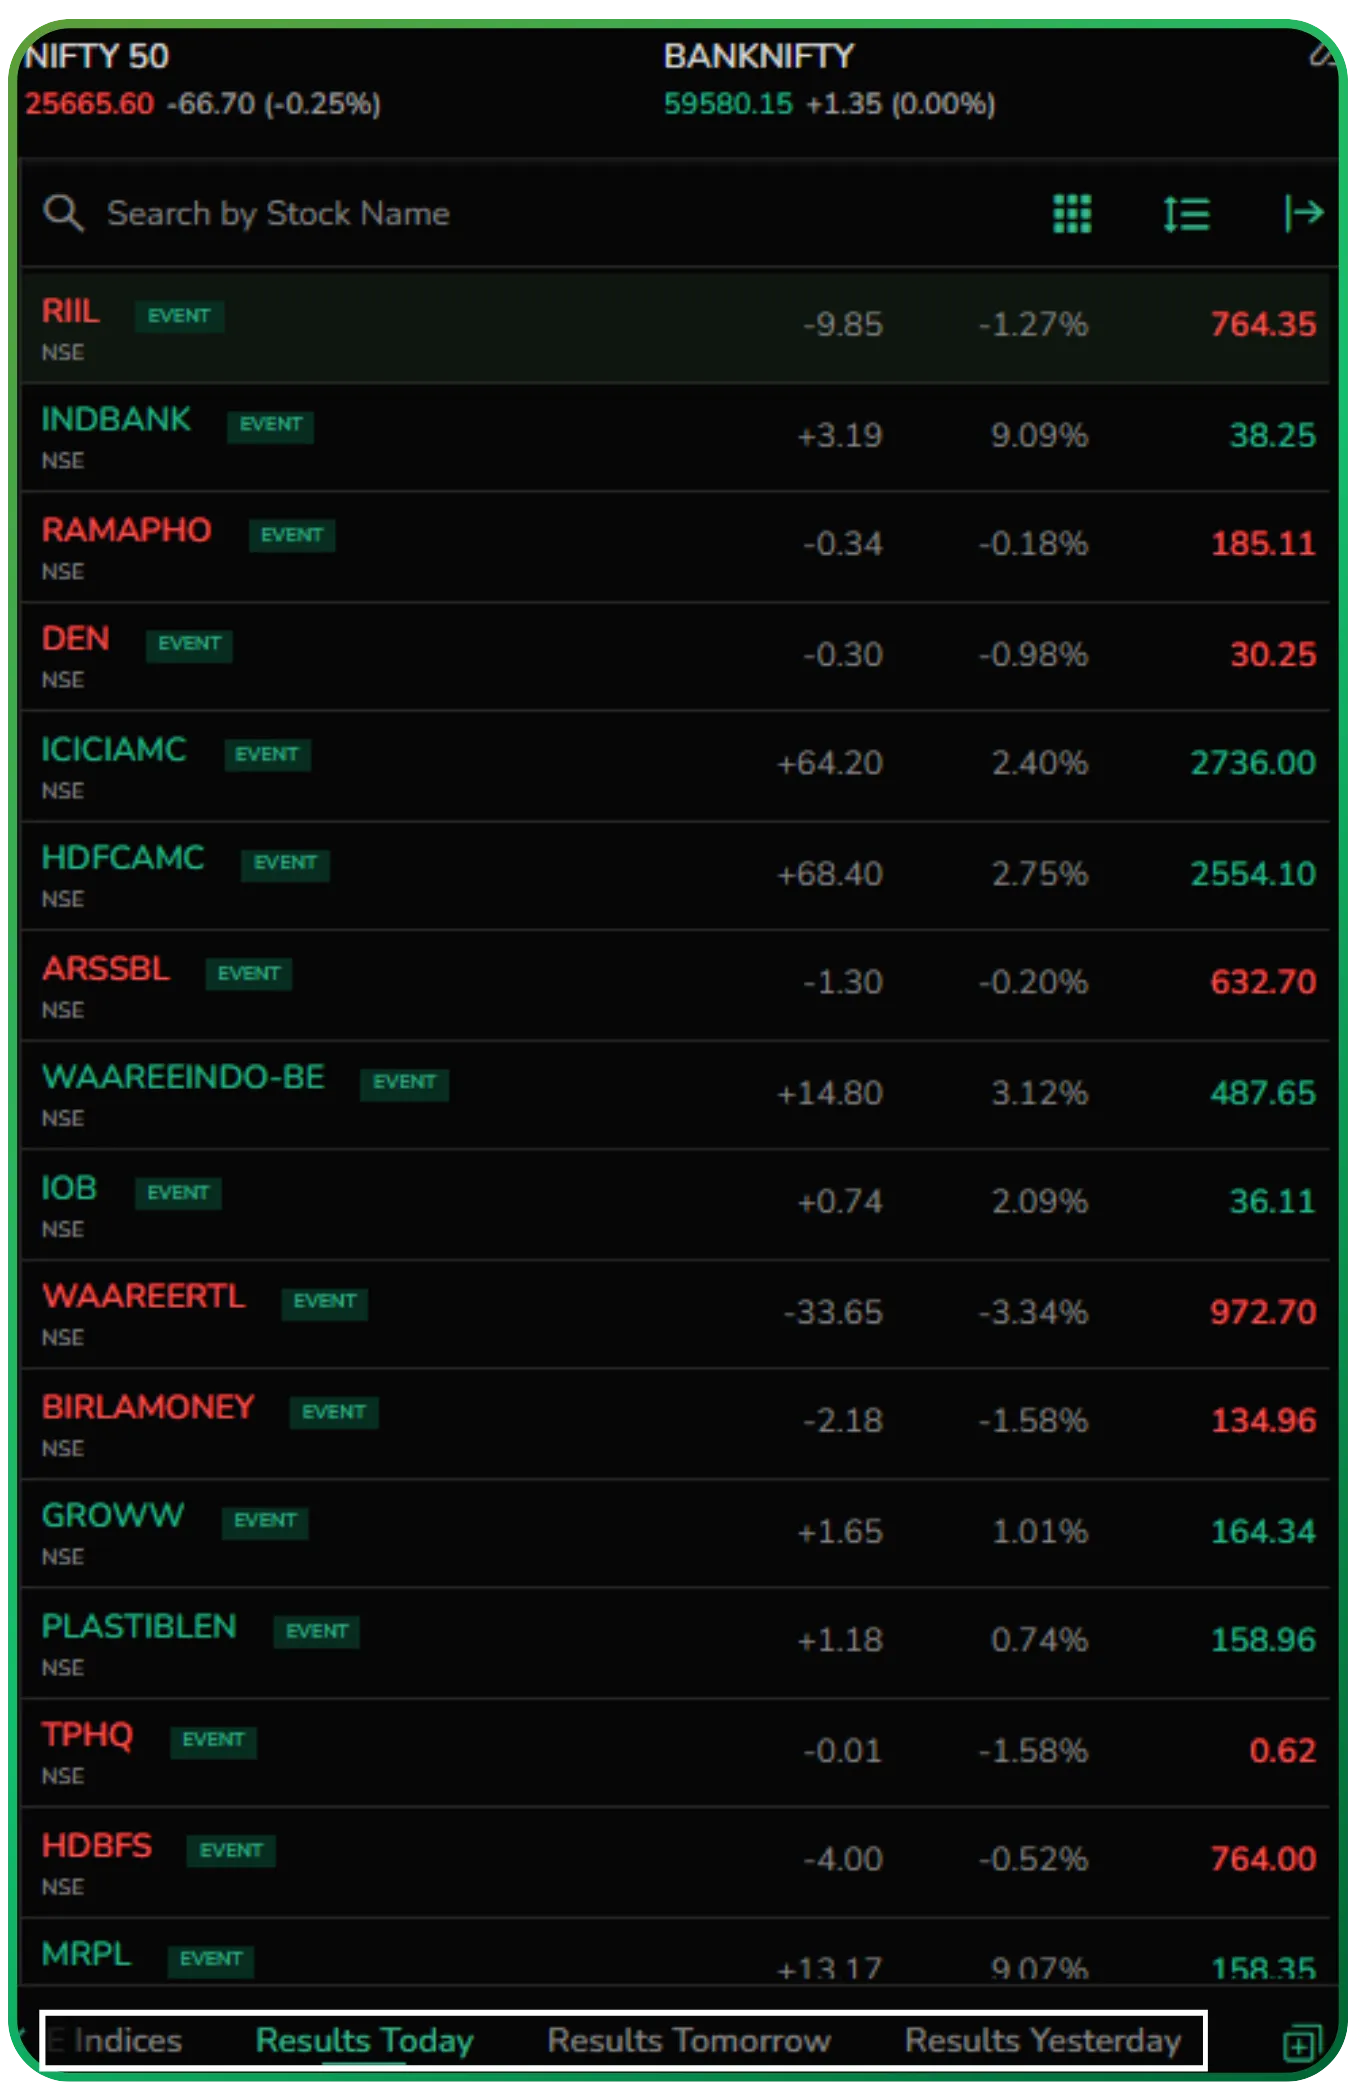
For investors, this makes portfolio monitoring more efficient. For traders, it ensures earnings events are visible exactly where price action is already being watched. The workflow stays intact. You notice the event, assess the move, and decide the next step without switching sections.
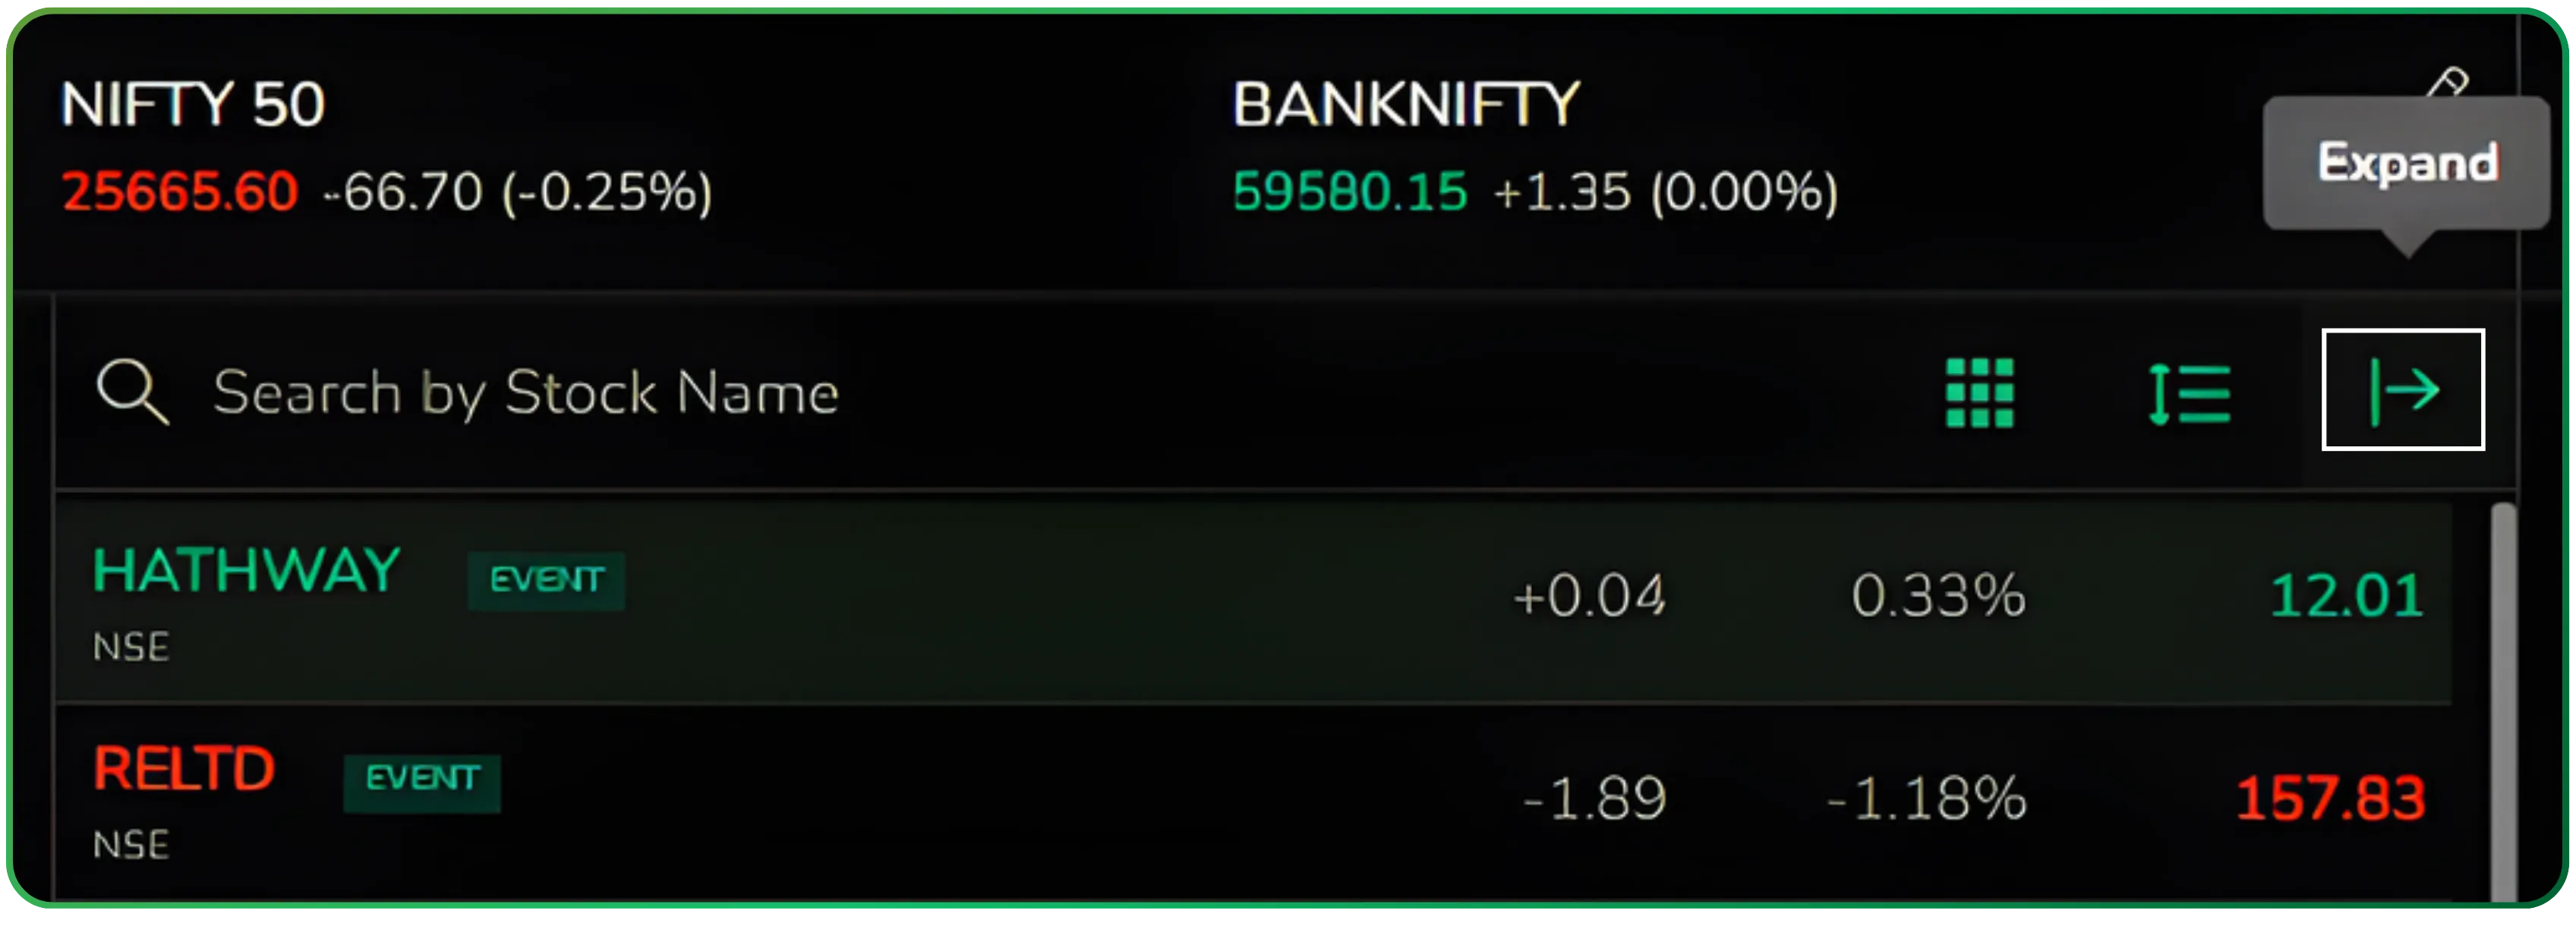
When you want more detail, the results view can be expanded into a full-screen layout using the expand option.
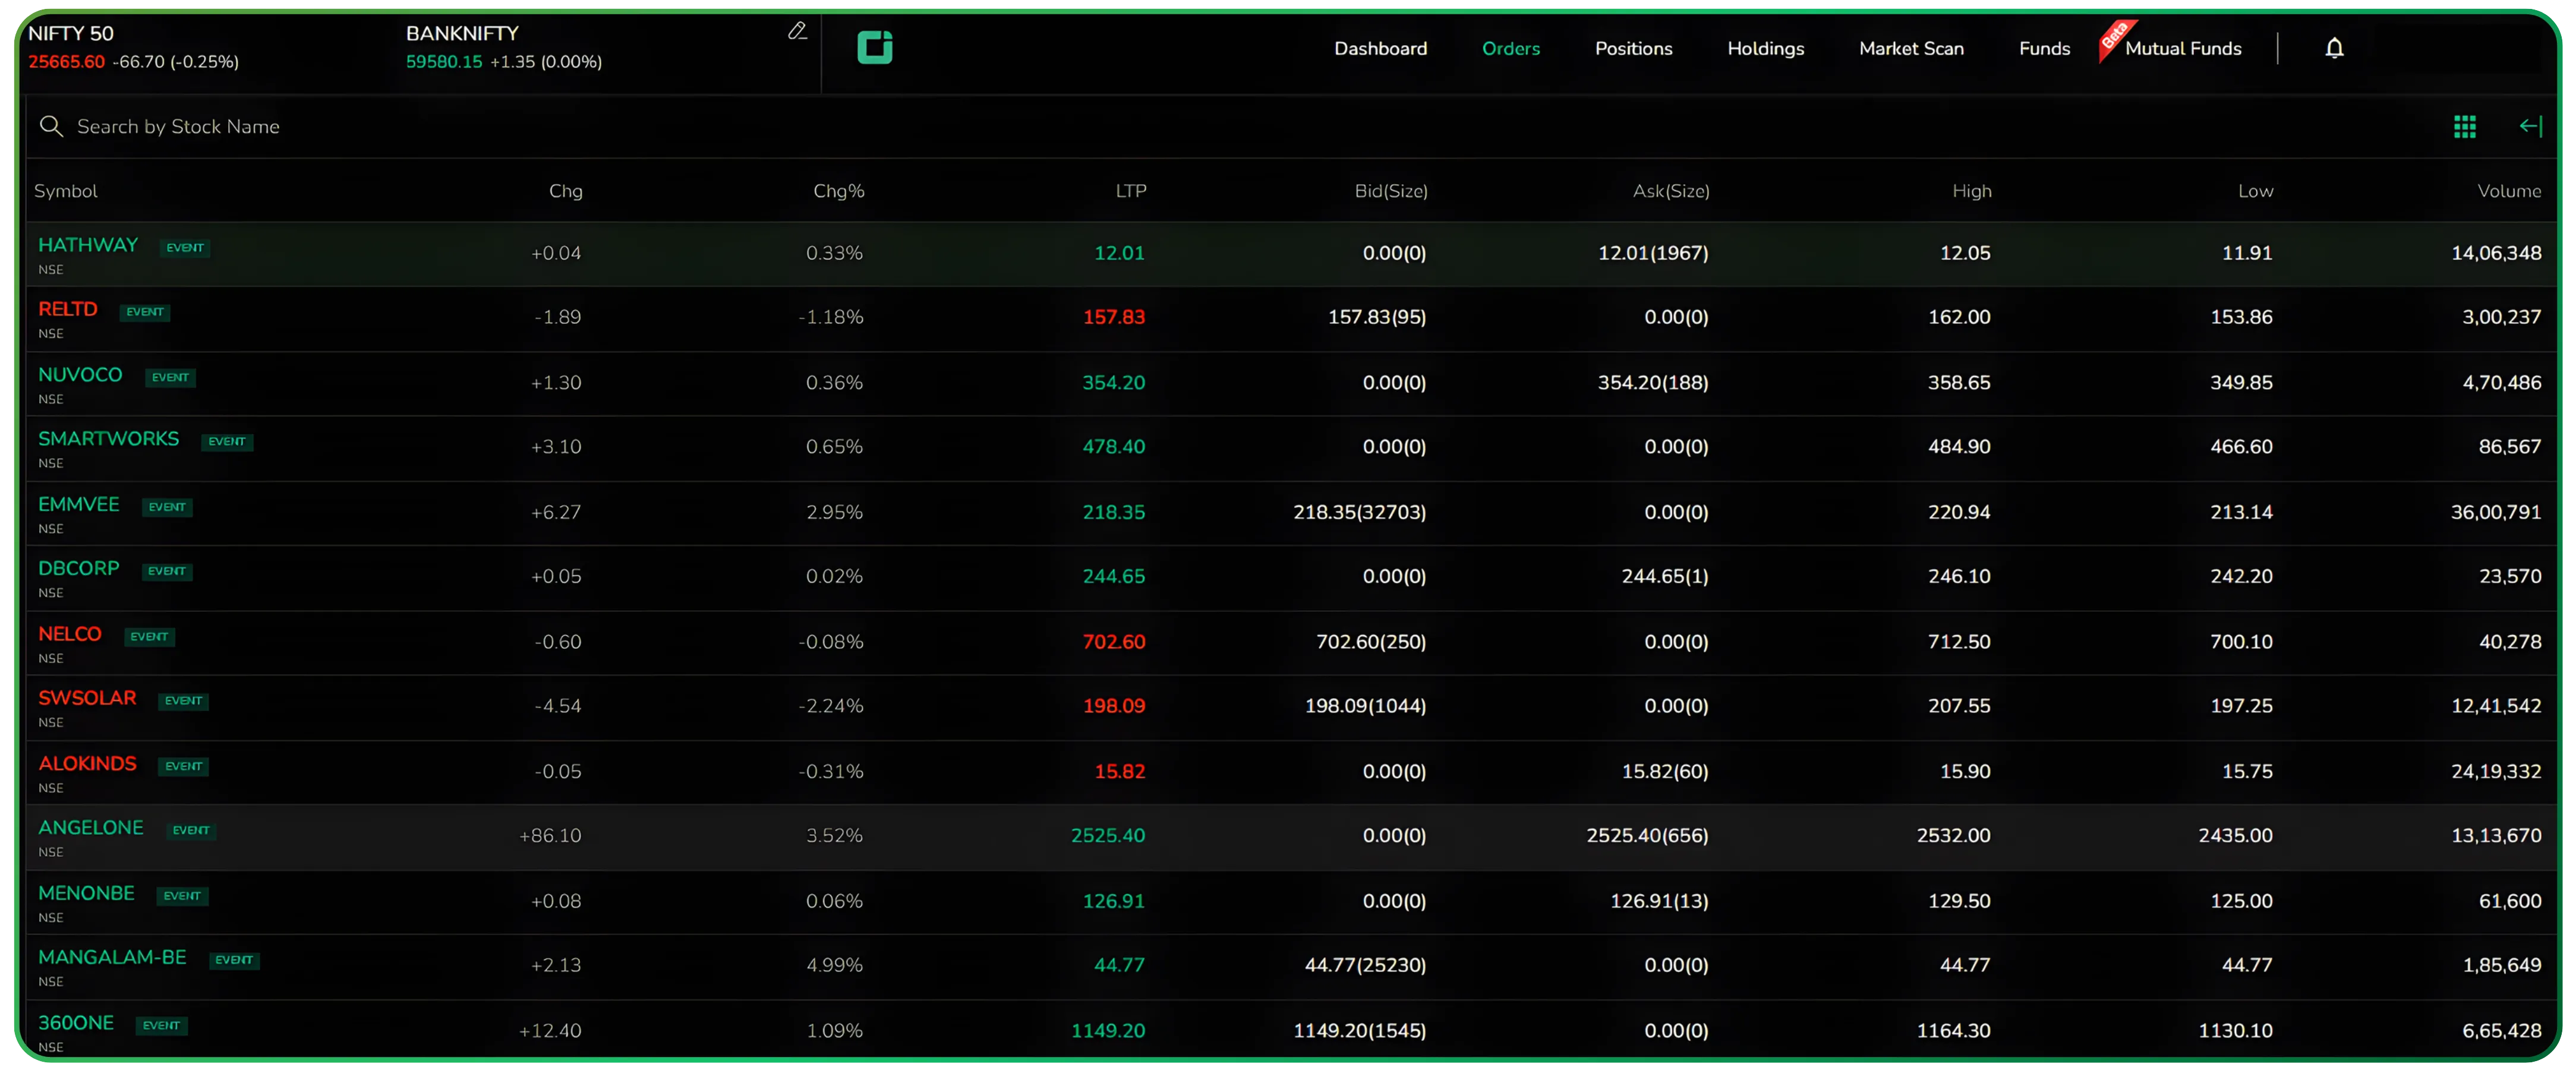
This opens up the complete table with additional market data, giving you a clearer, distraction-free view of price movement, volume, and intraday ranges around the earnings event. It’s a small interaction, but it turns the results view from a quick signal into a deeper review screen when required.
Placed early in the process, this watchlist-level access sets the tone for how the Results Calendar works across CubePlus: earnings information appears where decisions are already being made, not tucked away in a separate corner of the platform.
Earnings are one part of the picture. For a deeper financial view, read Exploring the Financials Dashboard on CubePlus.
Accessing the Tradejini CubePlus Results Calendar via Market Scan
From the top menu on CubePlus, move to Market Scan. Inside Market Scan, you’ll see a horizontal set of tools such as Seasonalitics, Equity, Options, Futures, and others. One of these is Results Calendar. Clicking on it opens a dedicated earnings view without taking you away from the broader market-scanning environment.
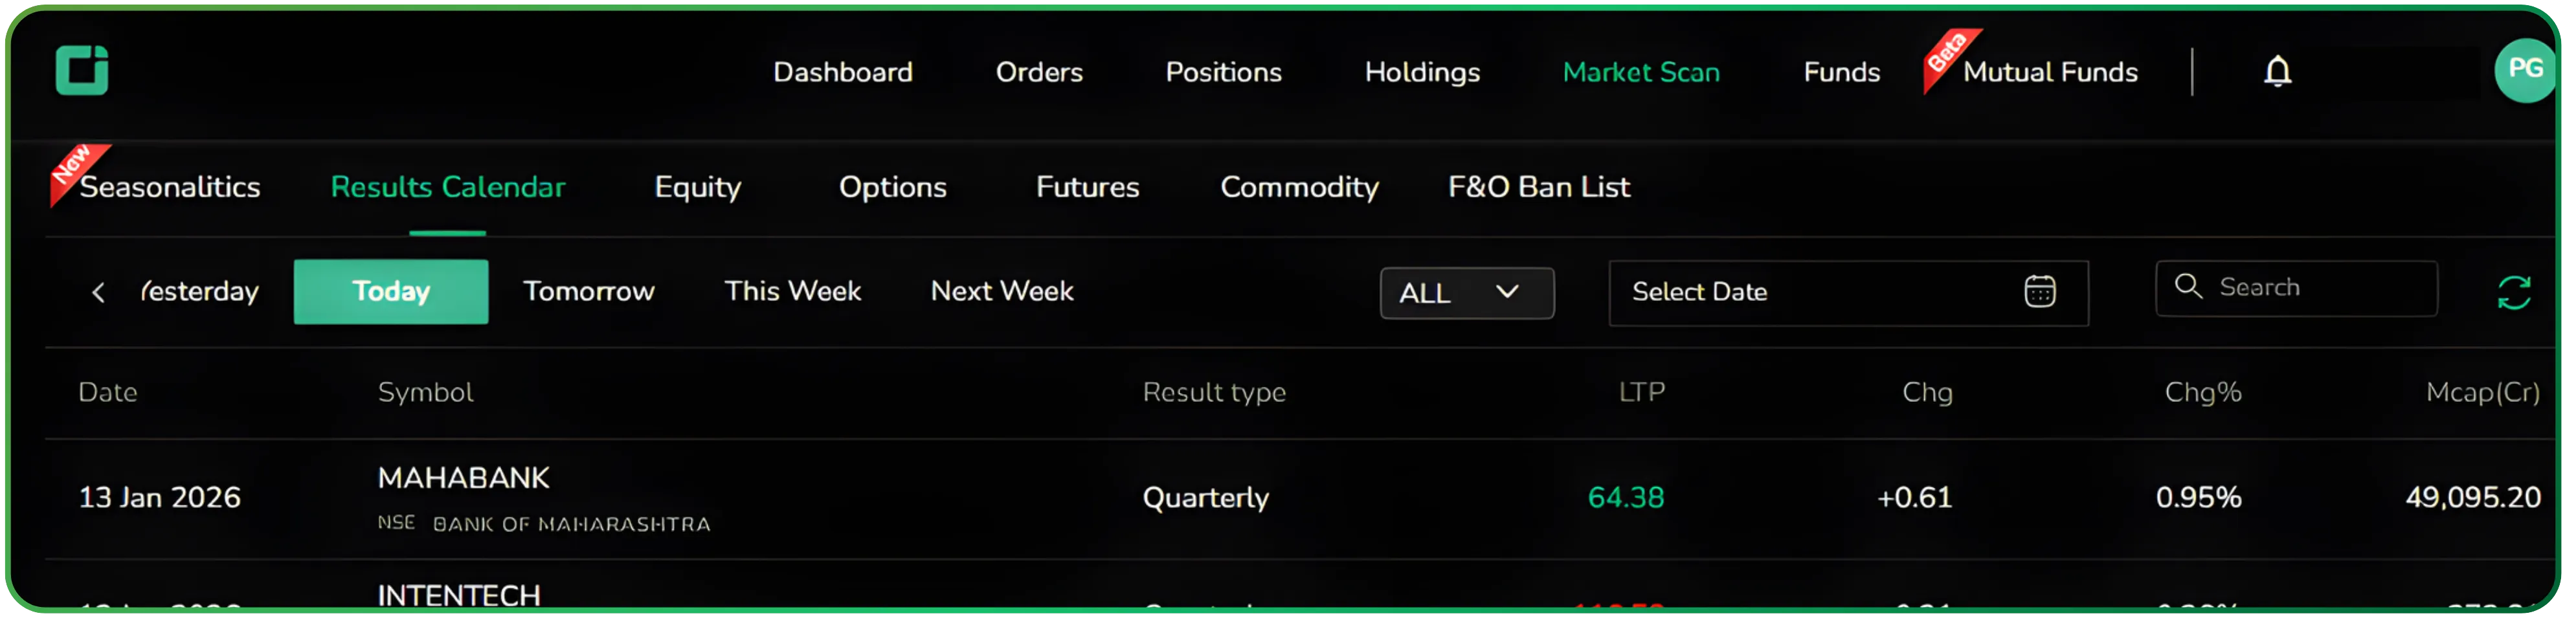
There’s no separate module, no buried submenu. It’s placed where active traders already spend time.
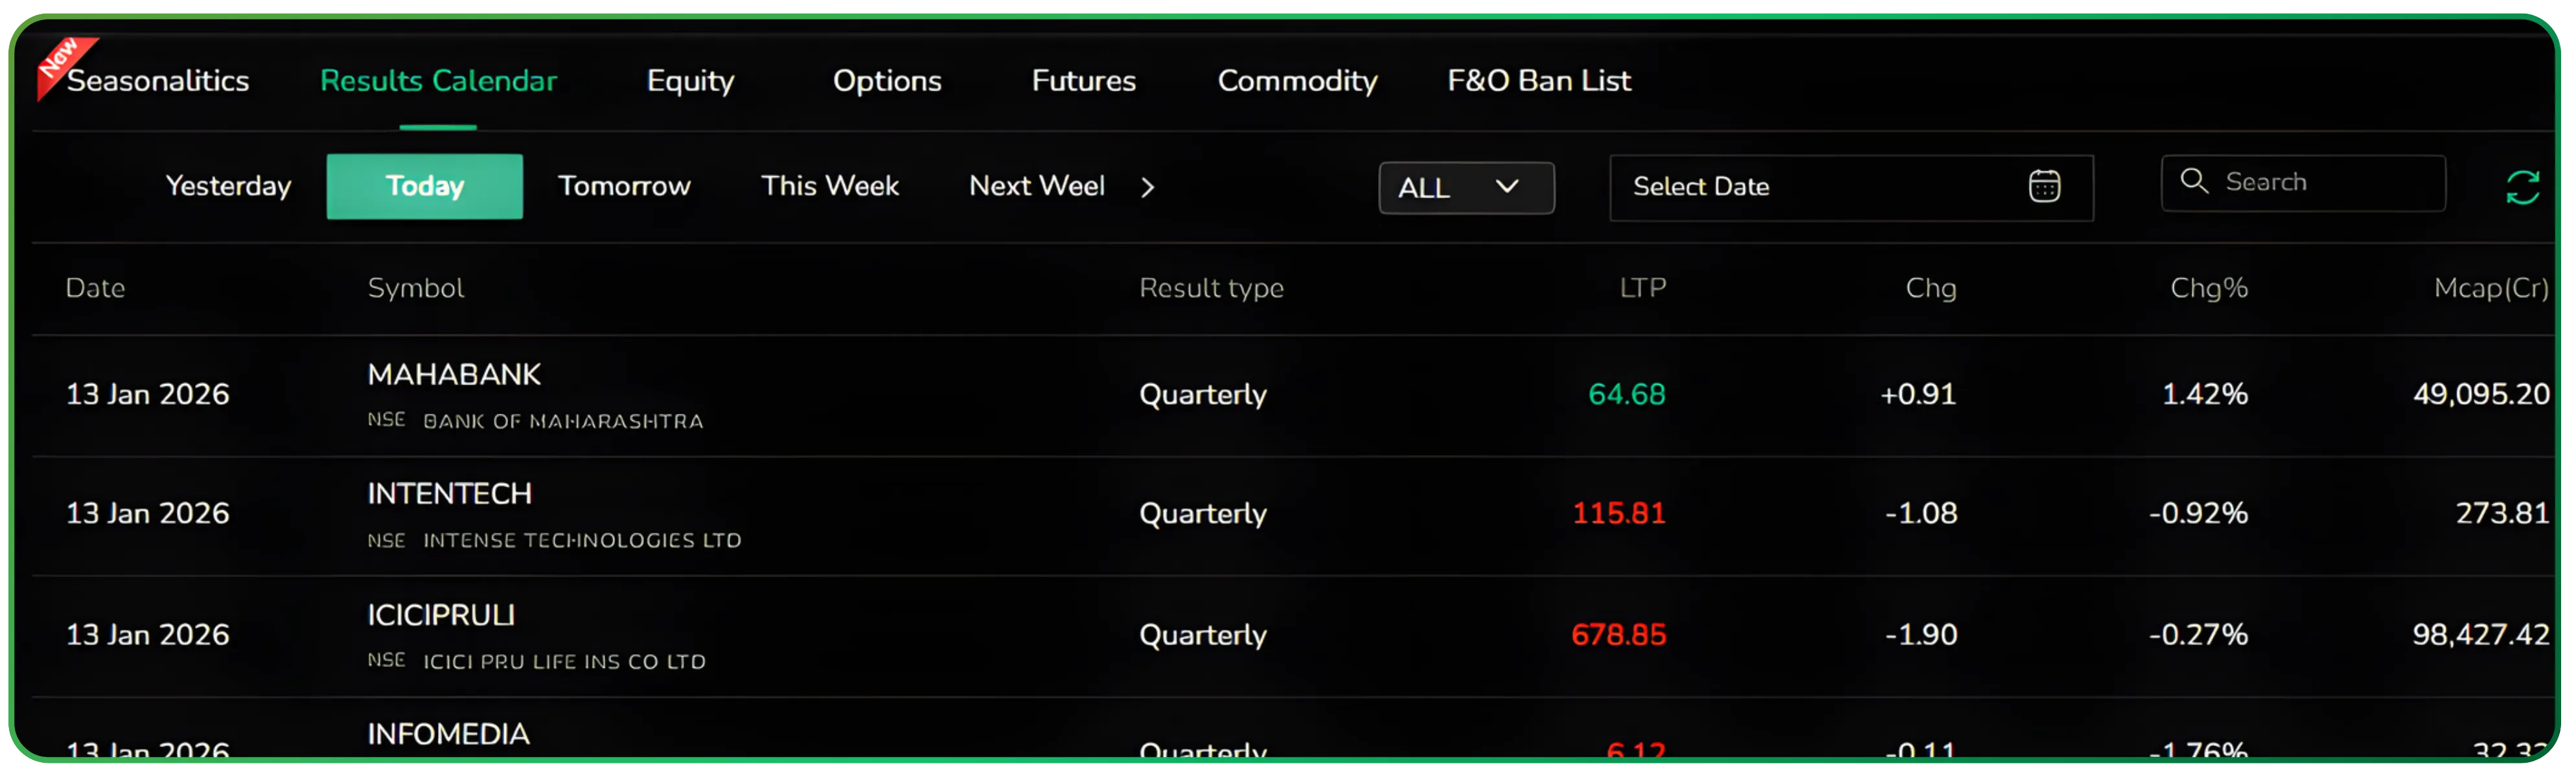
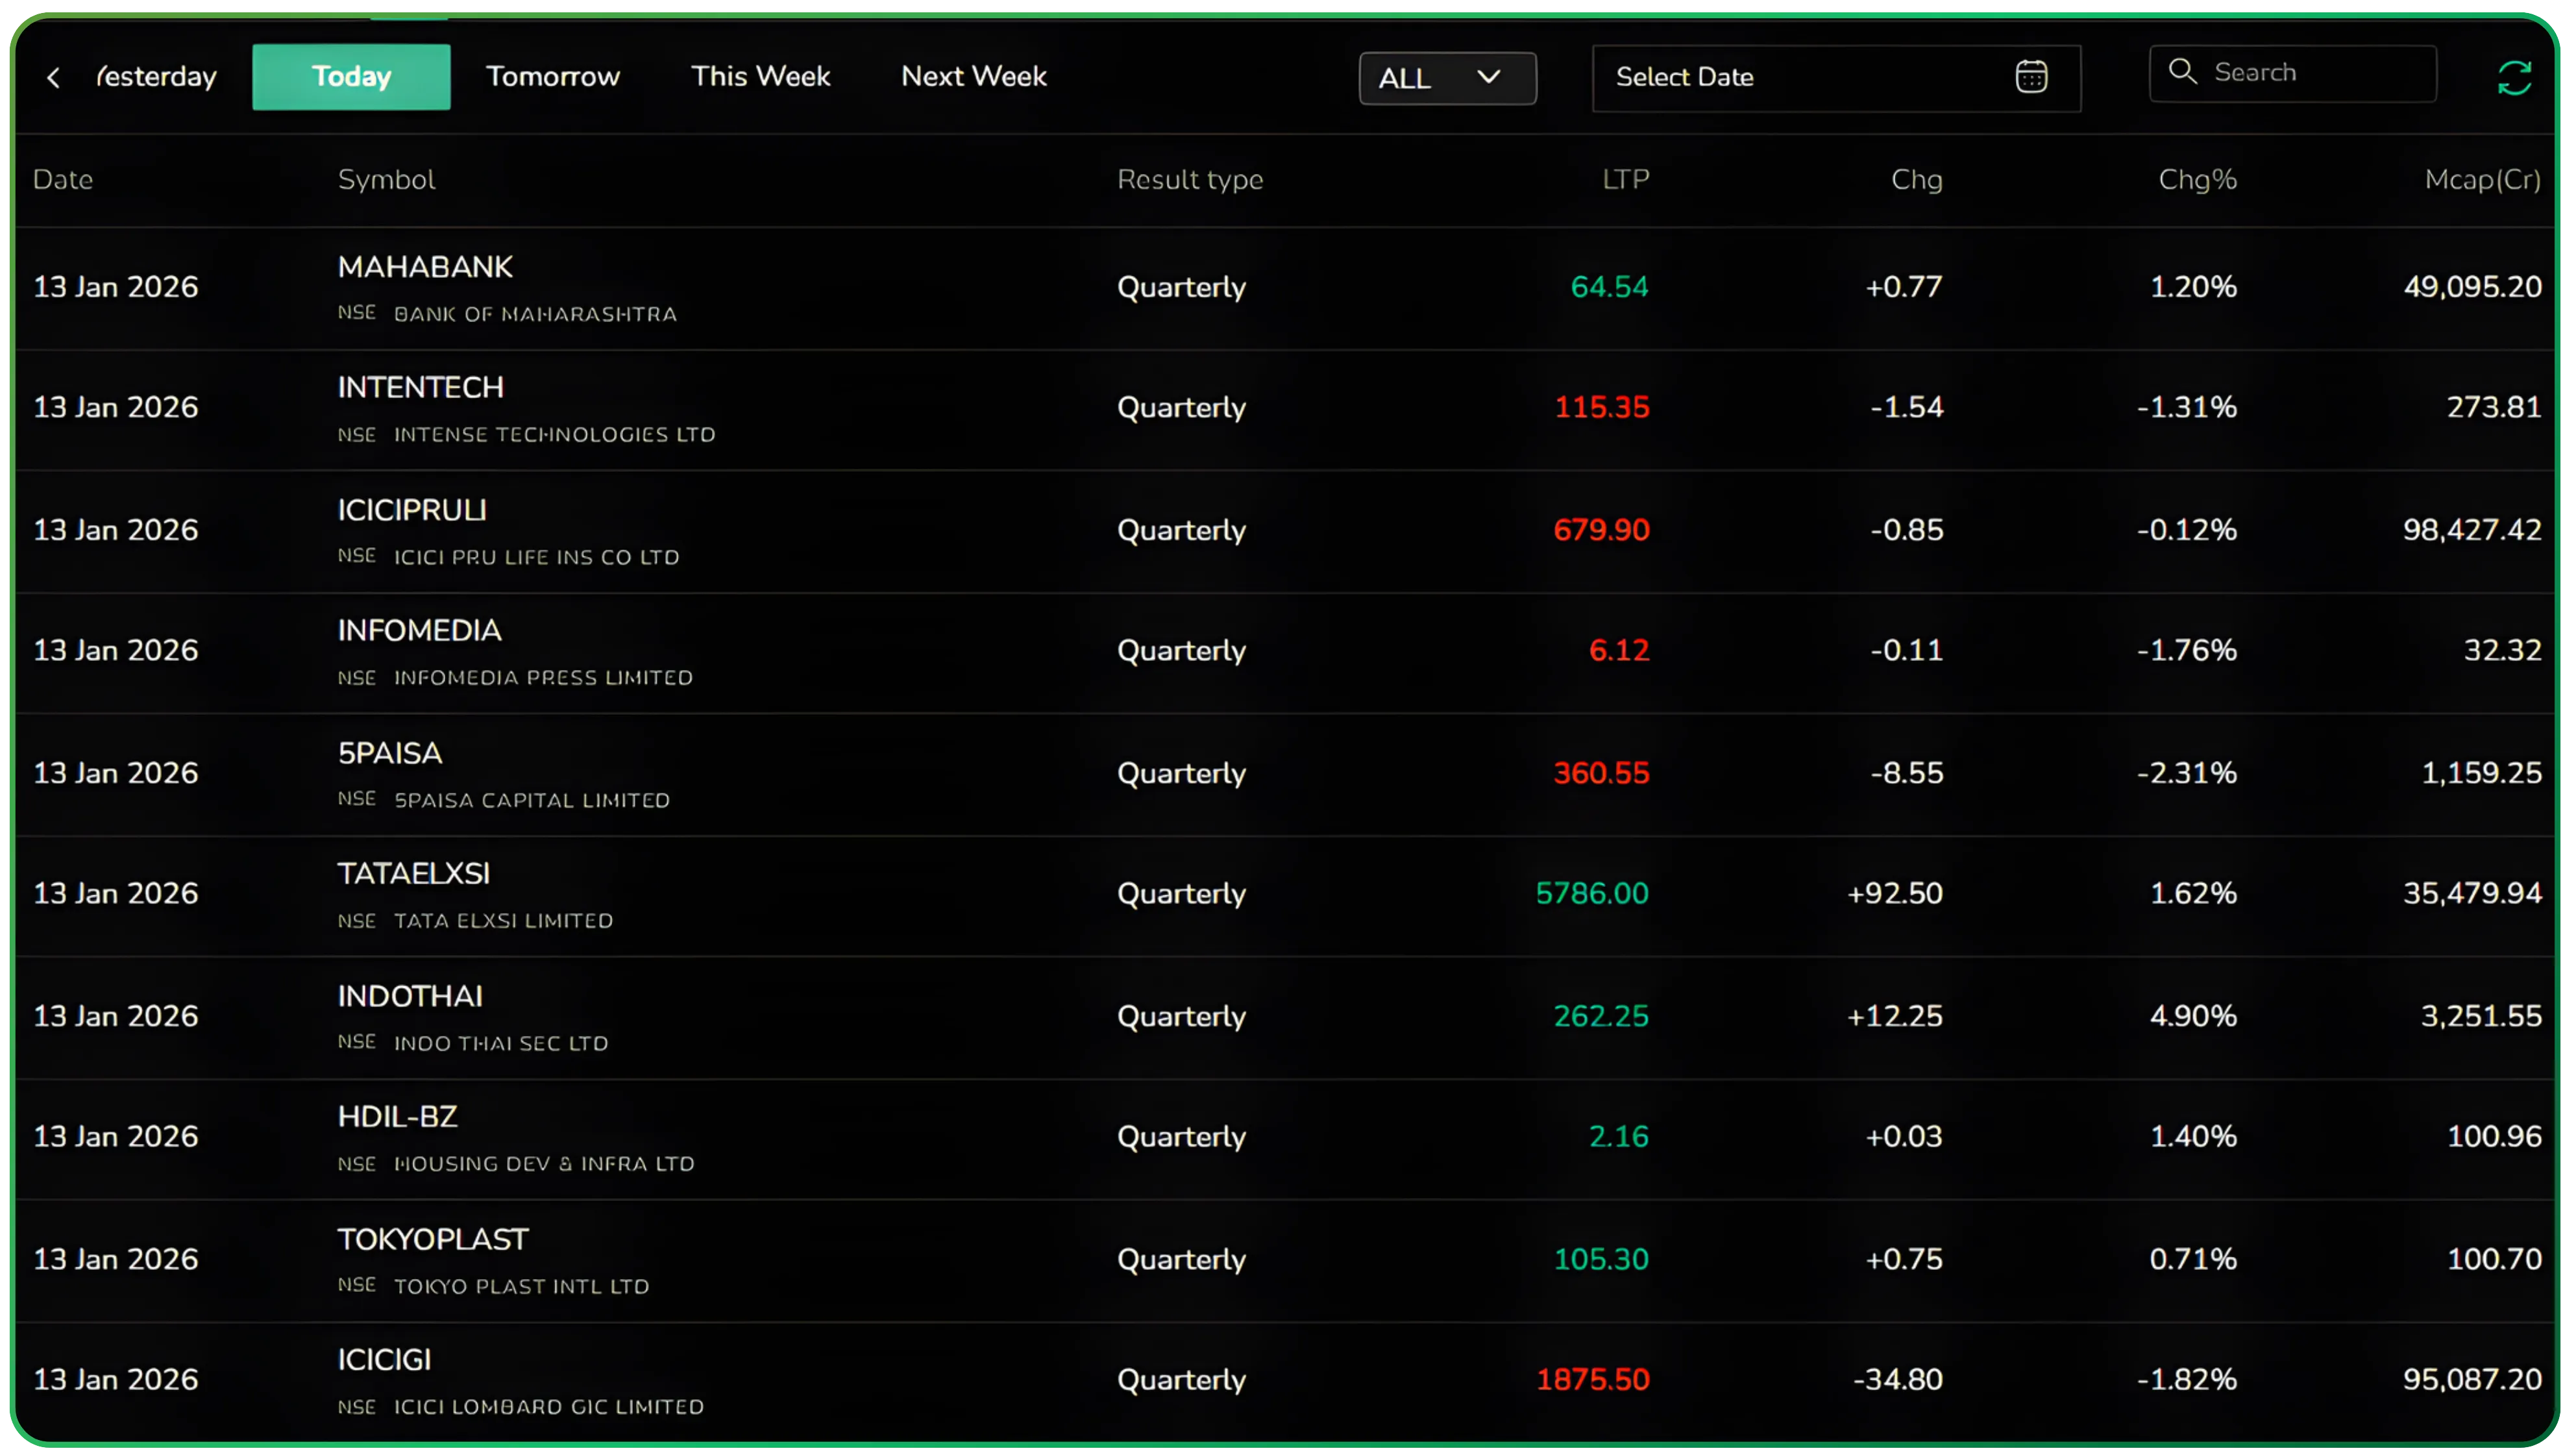
A single view of earnings and market reaction
Once inside the Results Calendar, you’re presented with a time-ordered list of companies announcing results. Each row combines the event and the market’s response. You see the result date, the company and exchange, the result type, and alongside it the live price, absolute change, percentage move, and market capitalisation.
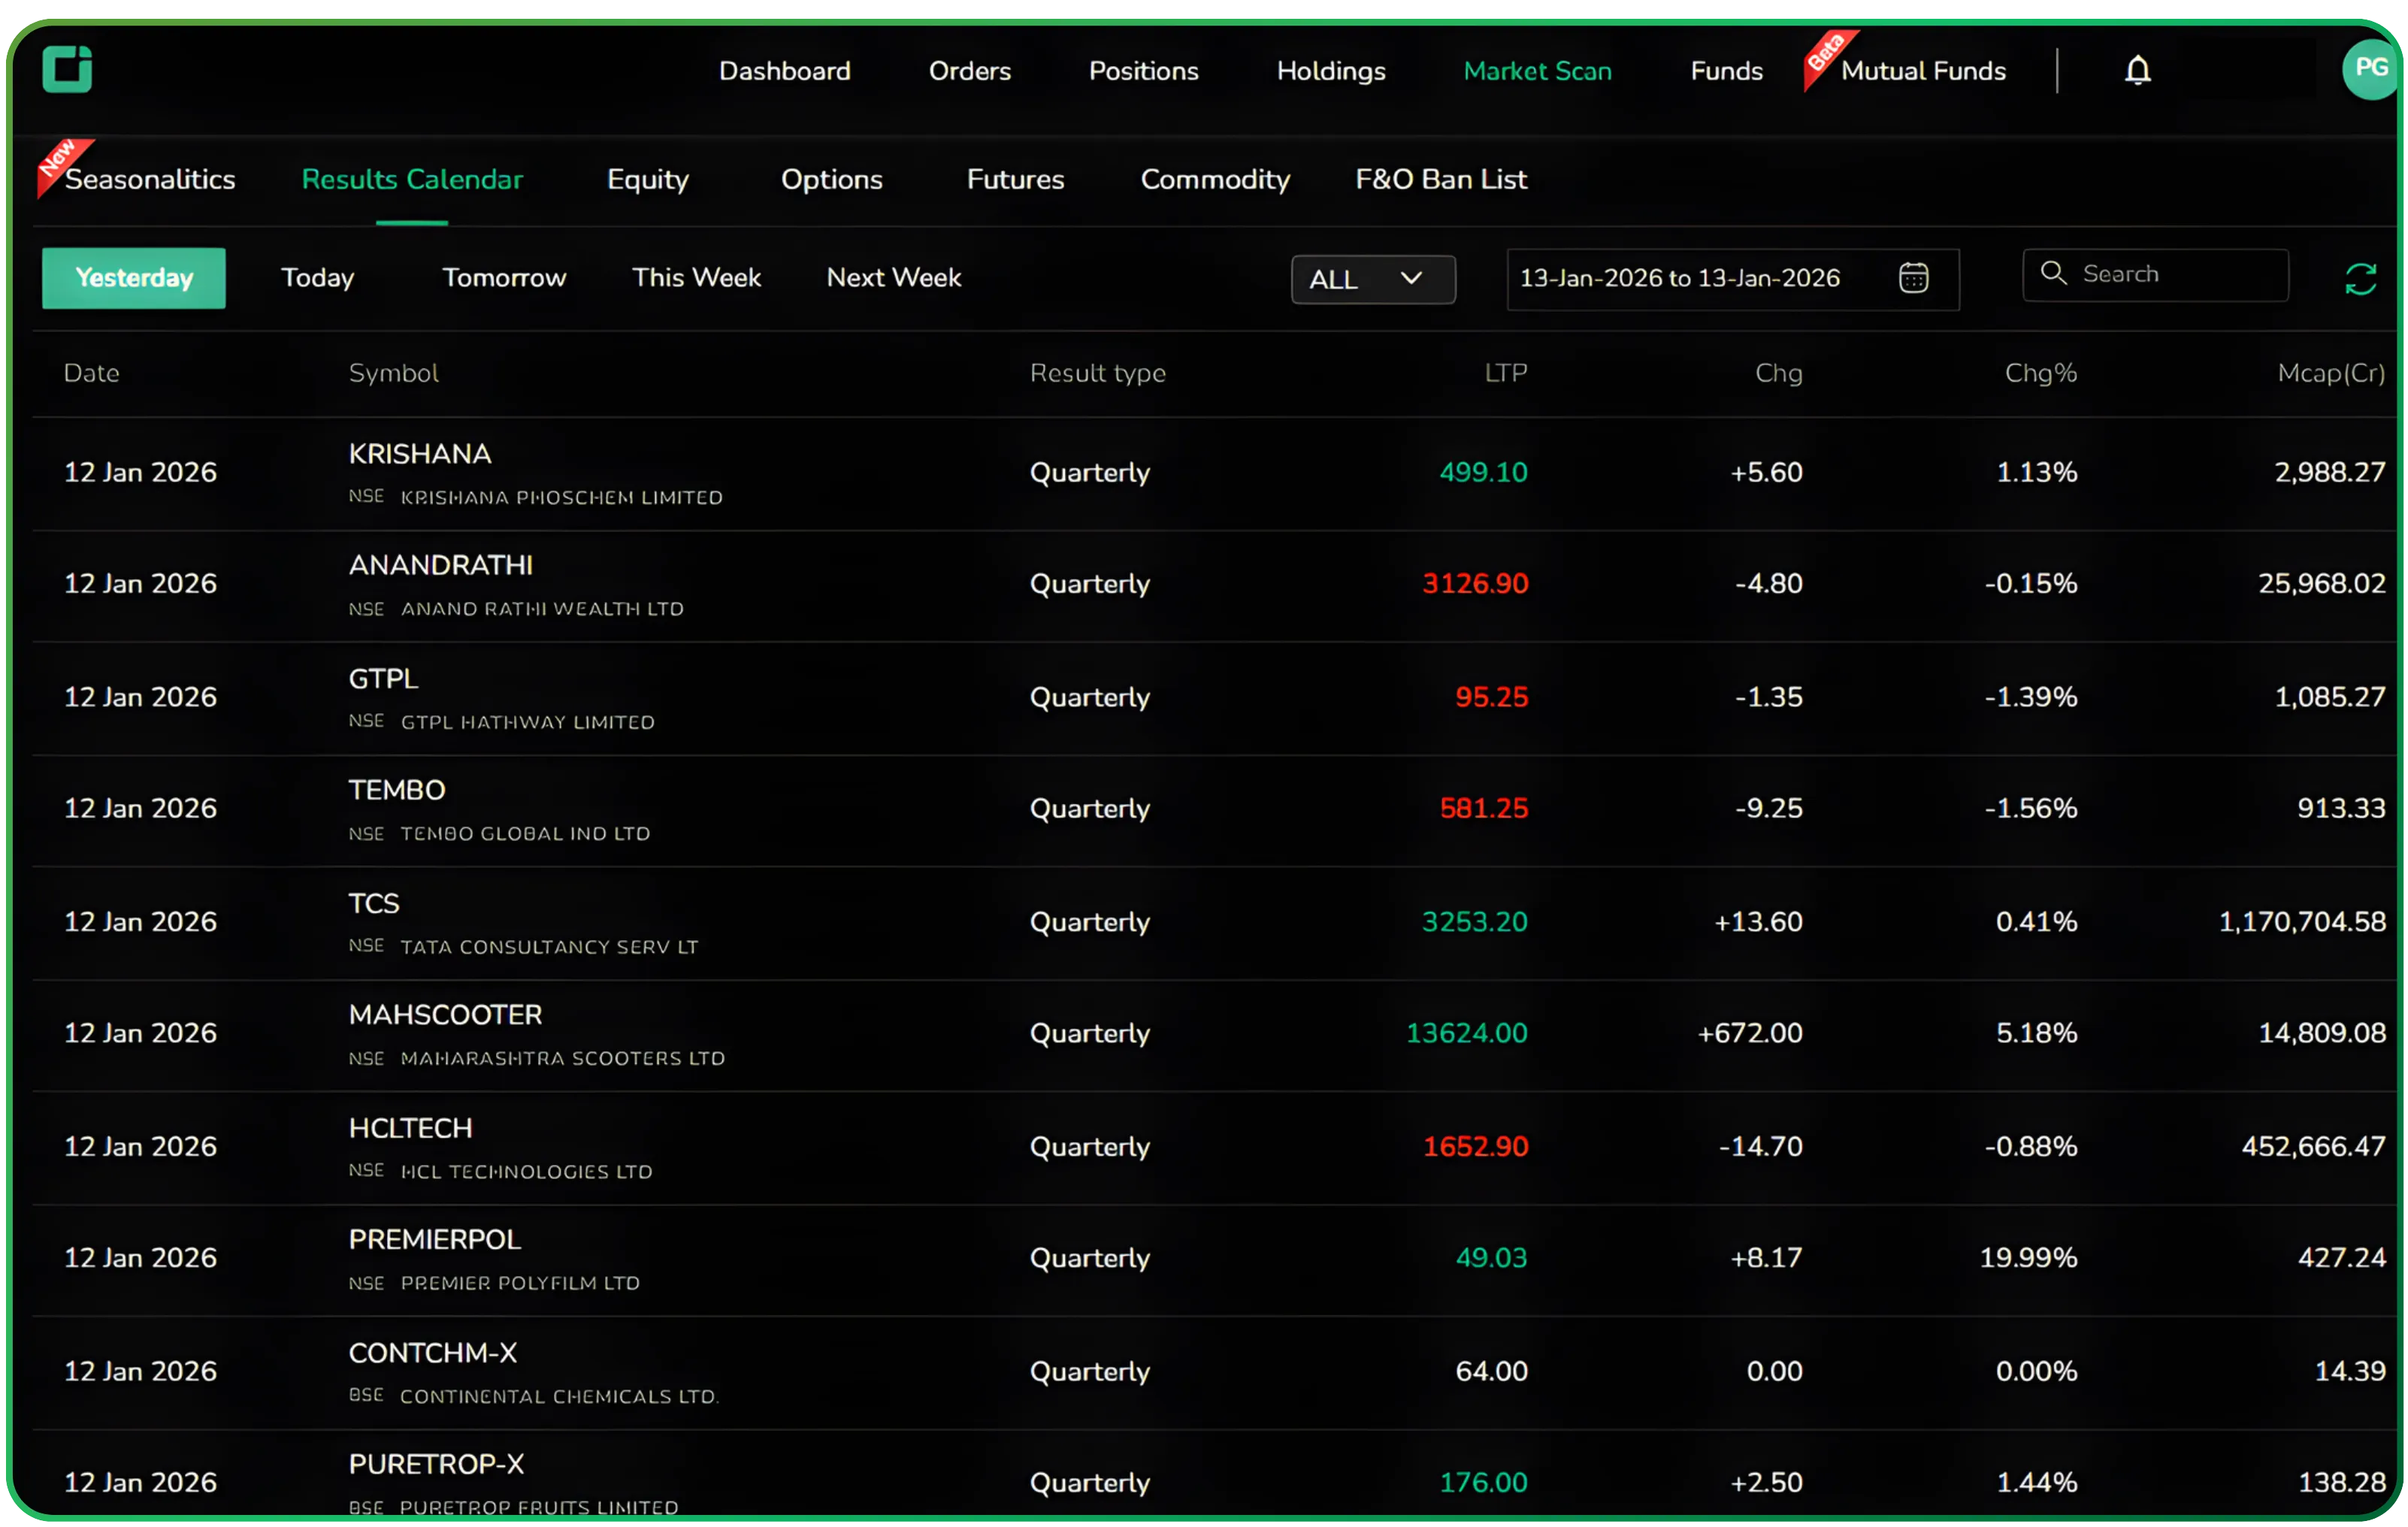
What this really means is that earnings are no longer abstract calendar entries. You can immediately see which results are being rewarded, which are being sold into, and whether the reaction is meaningful relative to the size of the company. It saves you from jumping between a calendar, a watchlist, and a price chart just to answer basic questions. This effectively positions the feature as a live quarterly results calendar for India, rather than a static earnings list.
Time filters that mirror how traders plan
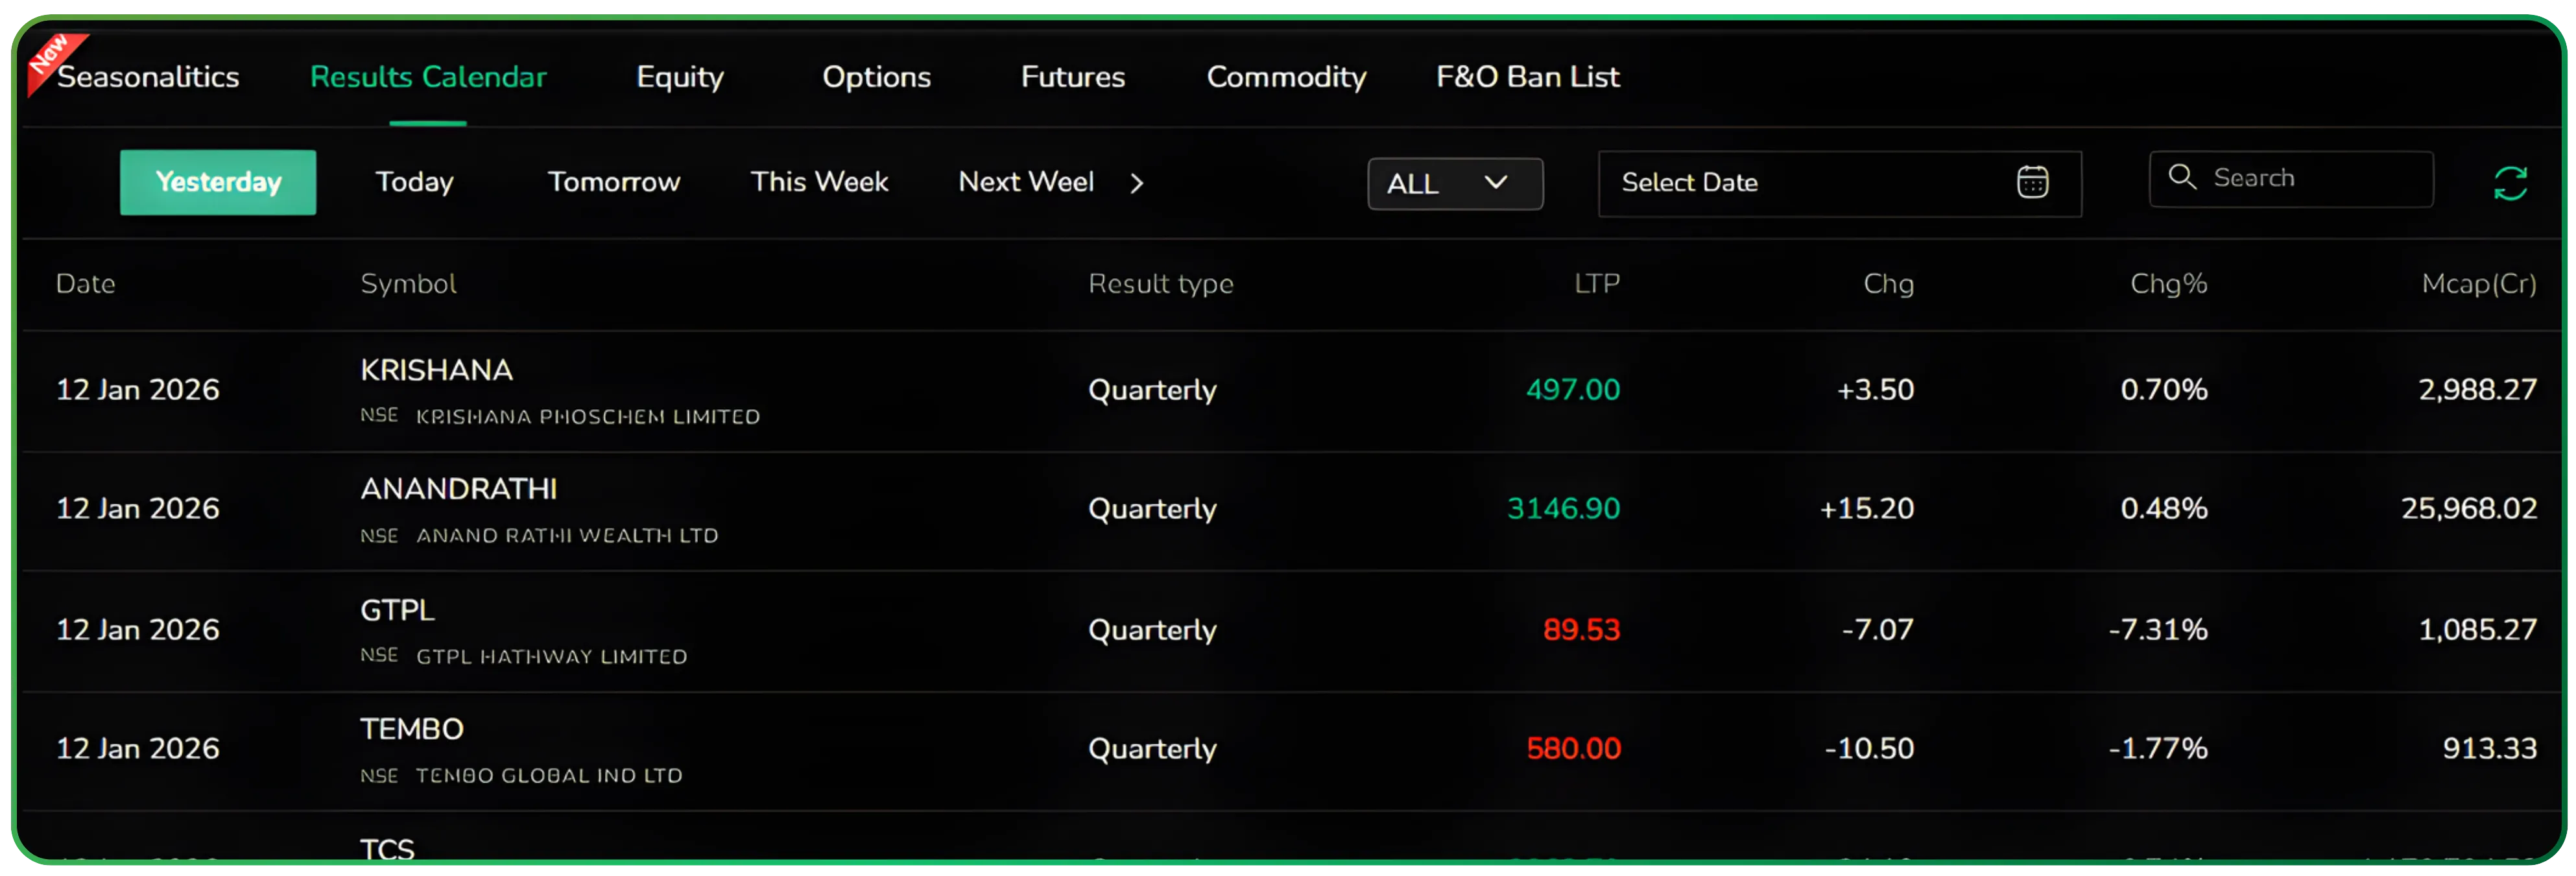
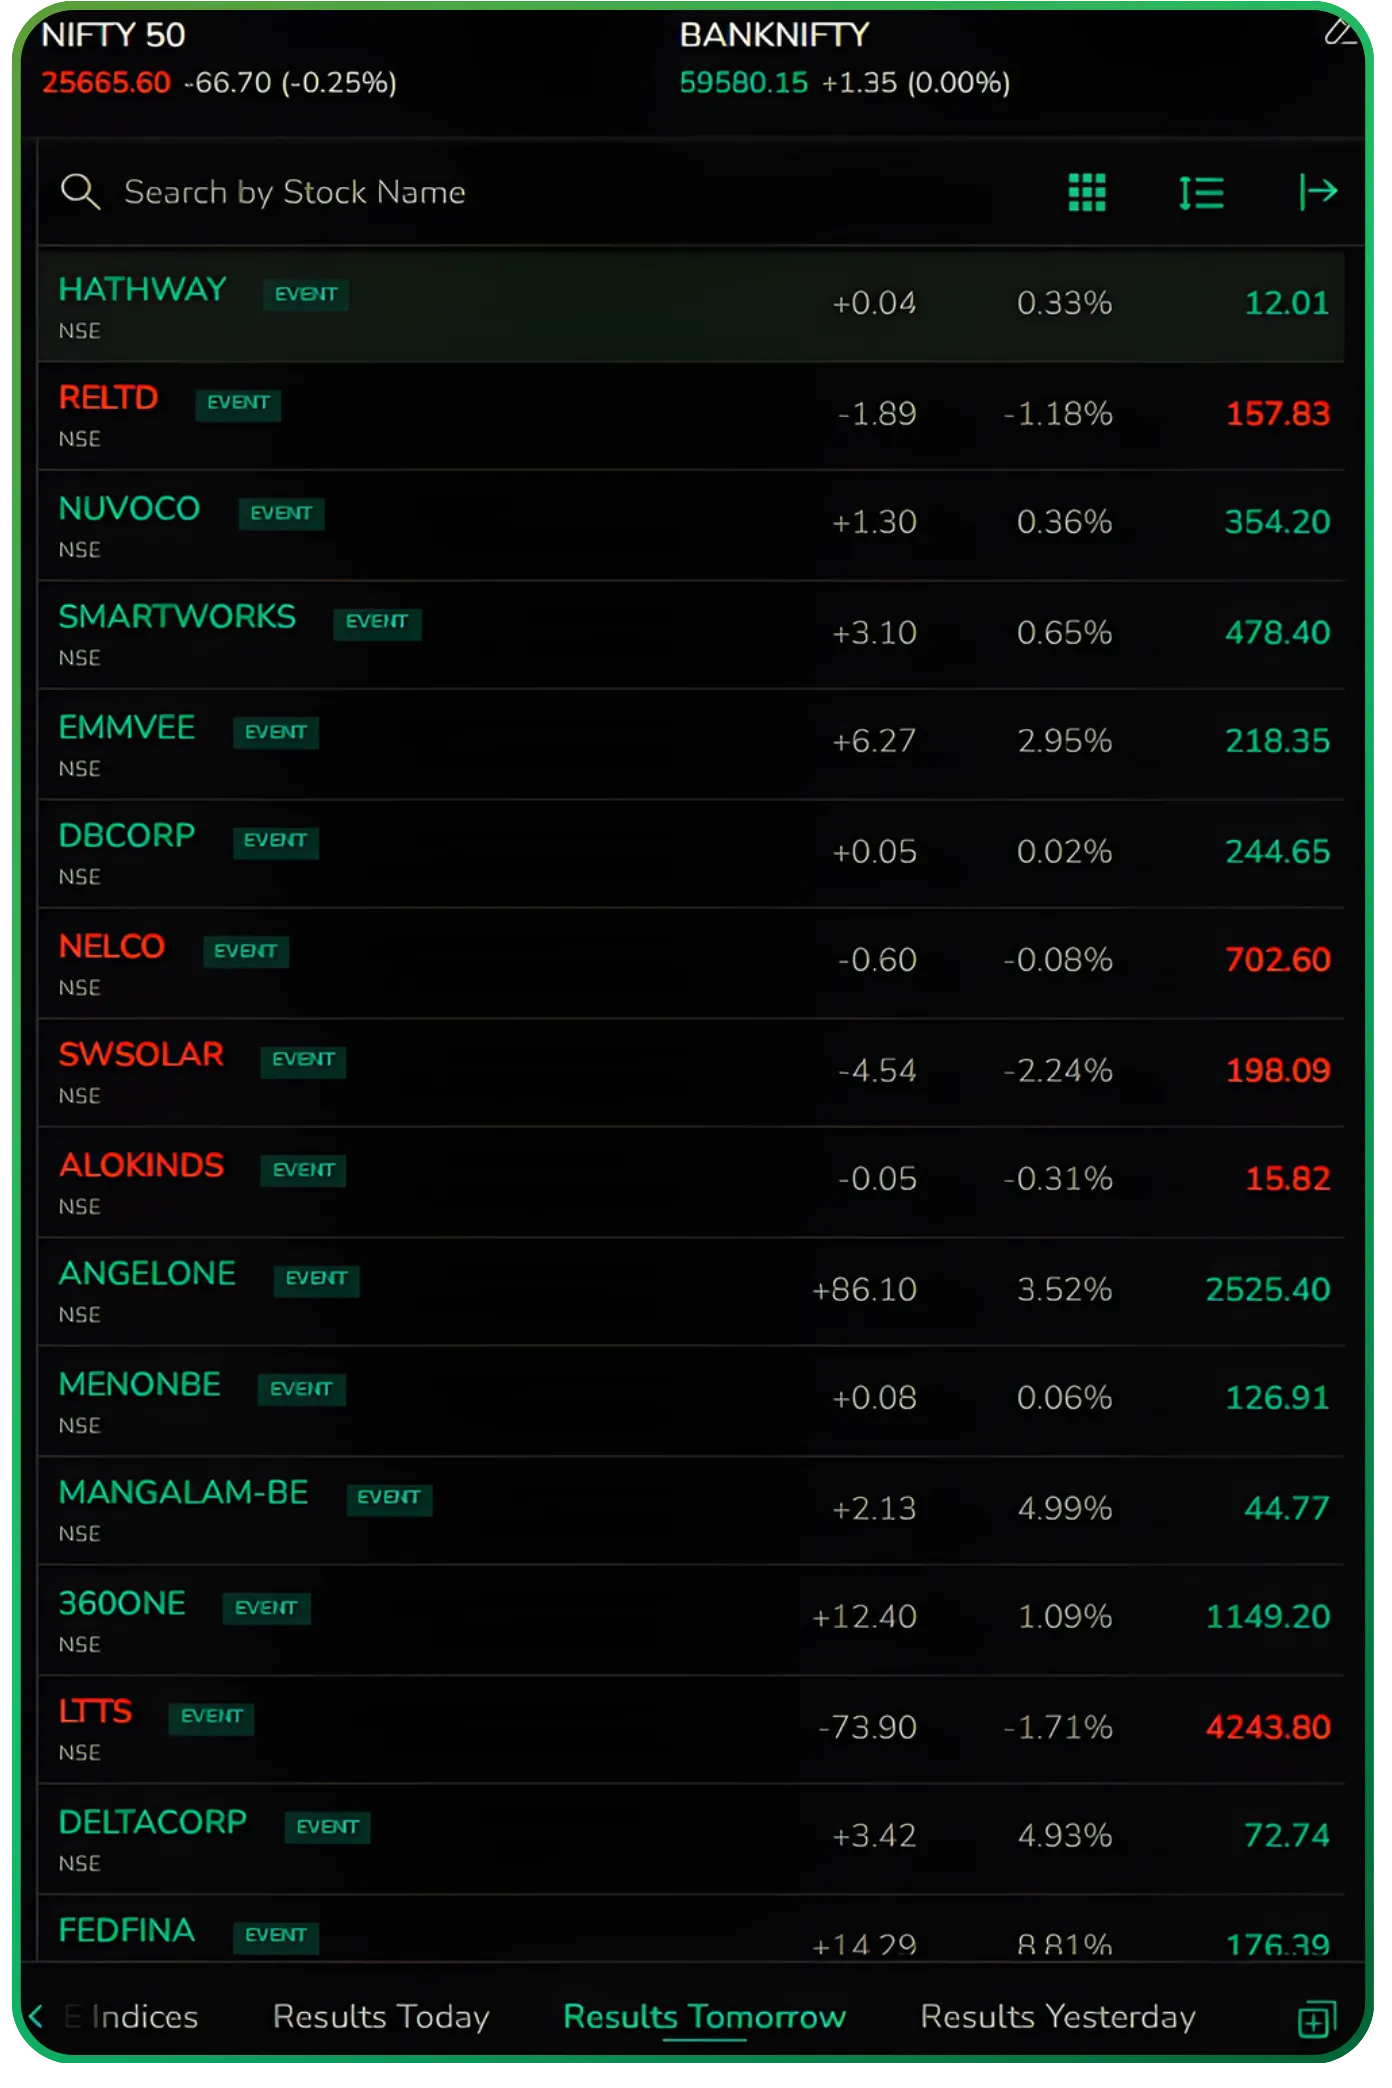
At the top of the table, the calendar is organised into intuitive time buckets: Yesterday, Today, Tomorrow, This Week, and Next Week.
These time-based buckets are particularly useful when structuring an earnings season trading strategy in India, helping users plan around result-heavy trading sessions.
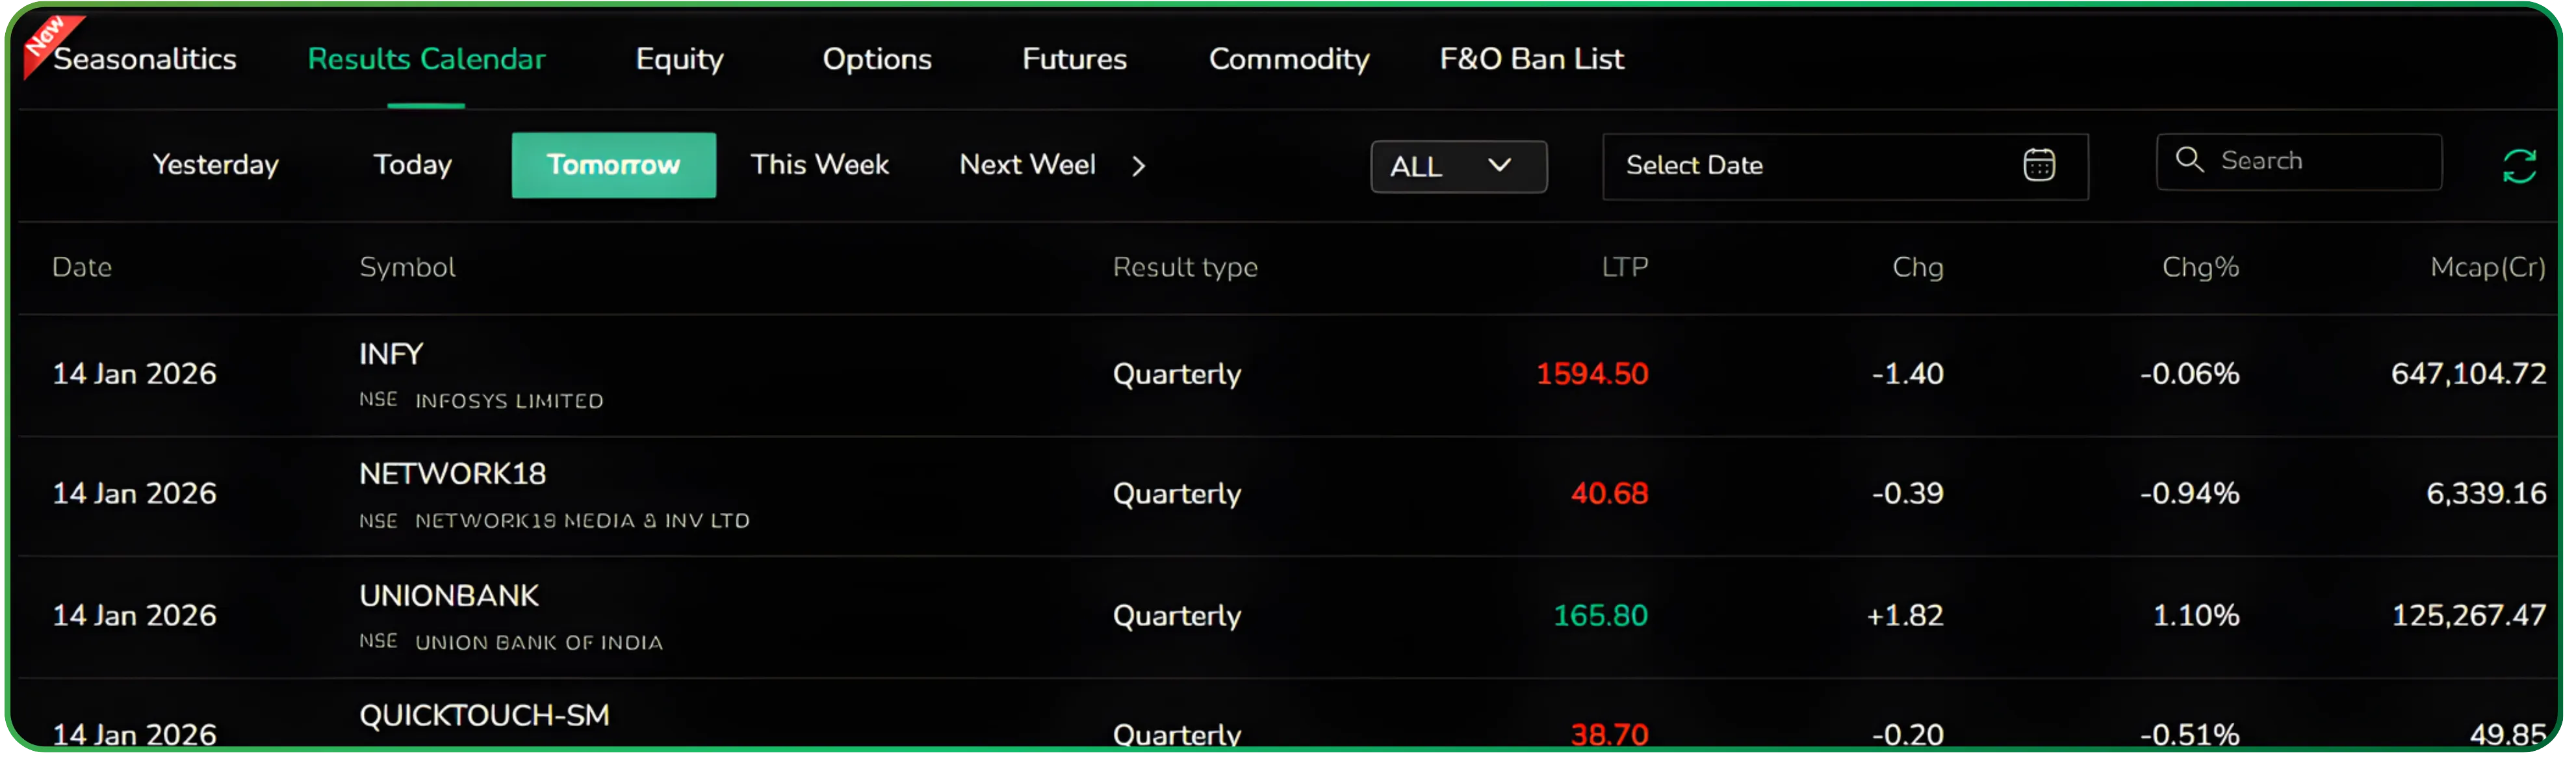
Recent days help in reviewing how the market digested numbers, the current day supports active decision-making, and the forward-looking views allow preparation around upcoming announcements and portfolio exposure.
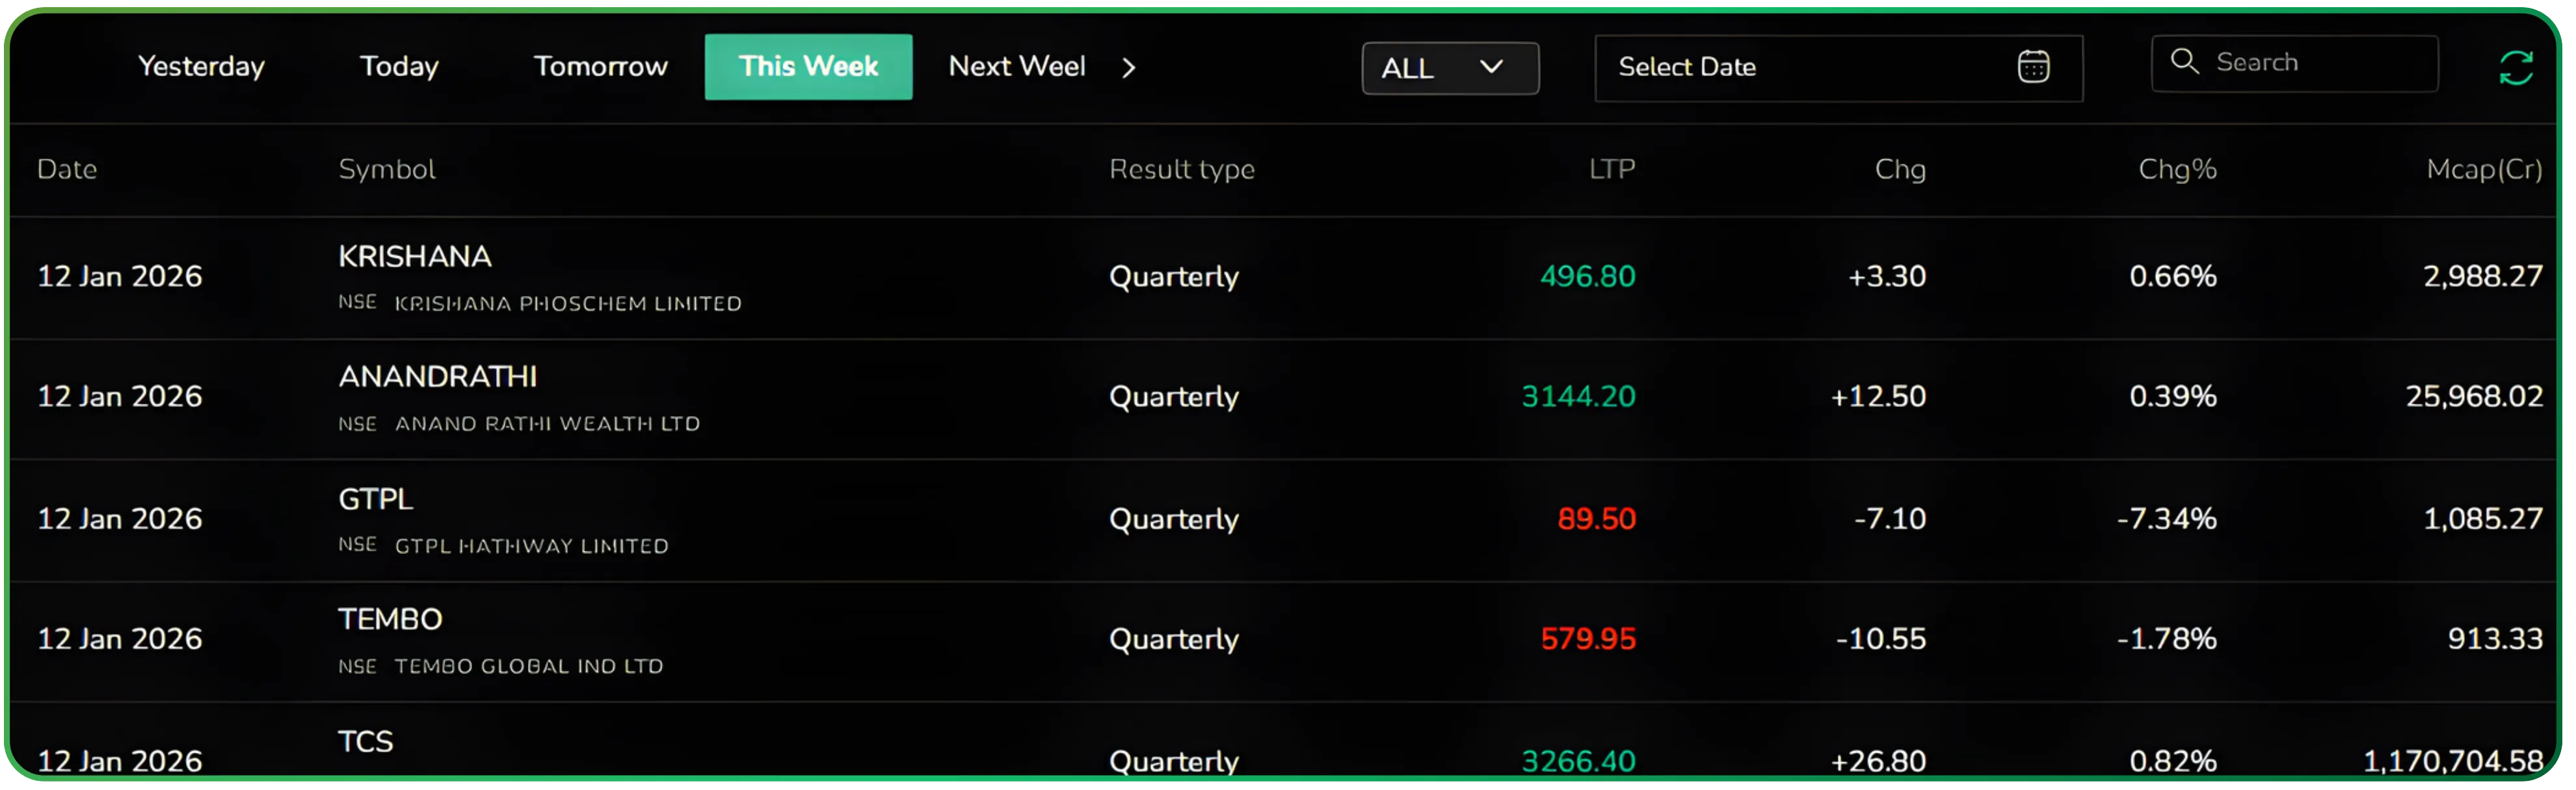
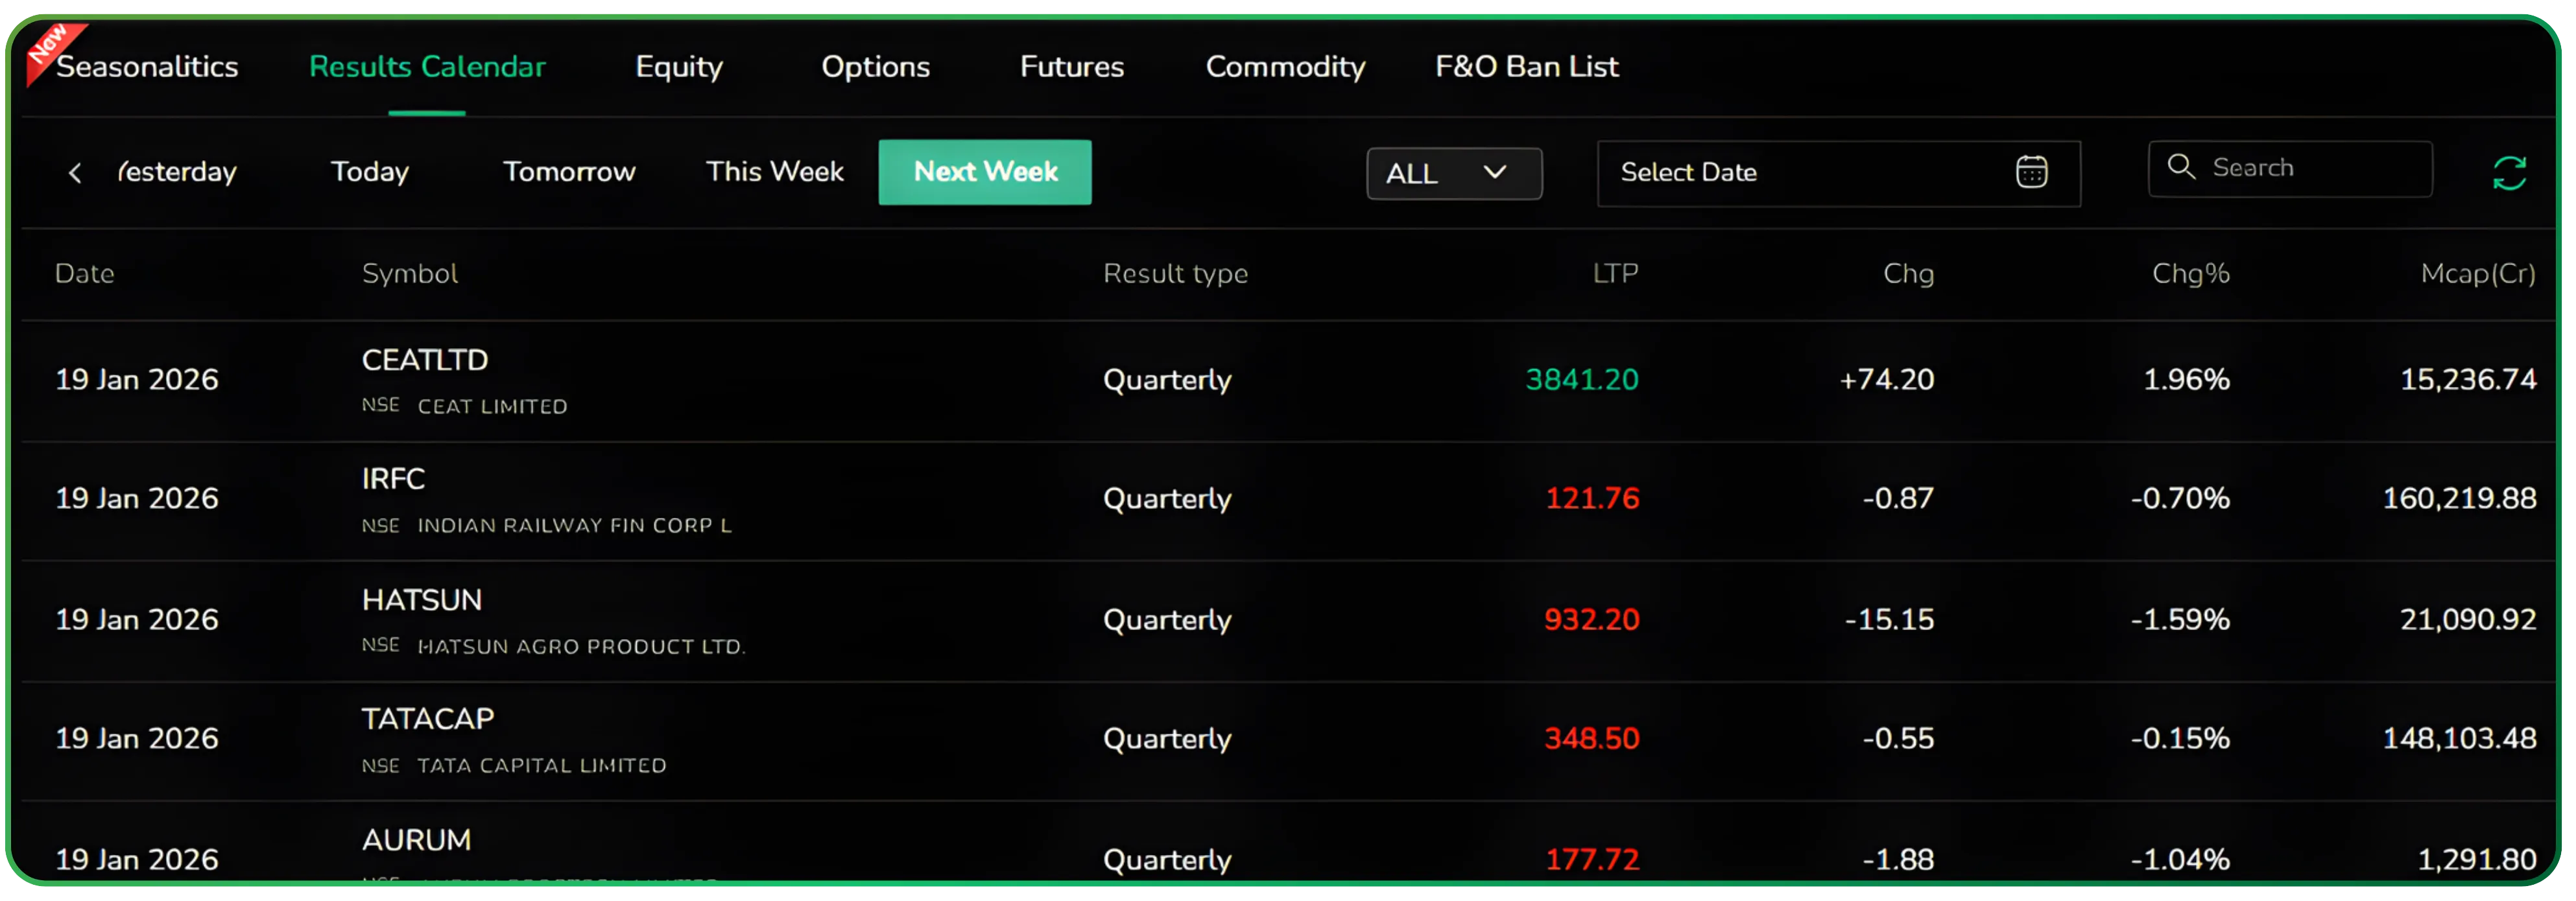
Yesterday helps you review post-result behaviour. Today is where active positions and intraday decisions come into play. Tomorrow and the weekly views are for preparation, spotting clusters of announcements, and thinking ahead about volatility or exposure. Switching between these views is instant, so you can move from review to planning without resetting filters.
If your approach leans toward trend trading, you may also find Understanding Heikin Ashi Candles for Trend Trading useful.
Viewing results by date range
Alongside the preset time views, the Results Calendar also lets you select a custom date range. This allows you to see which companies are scheduled to announce results and on which specific dates within that window.
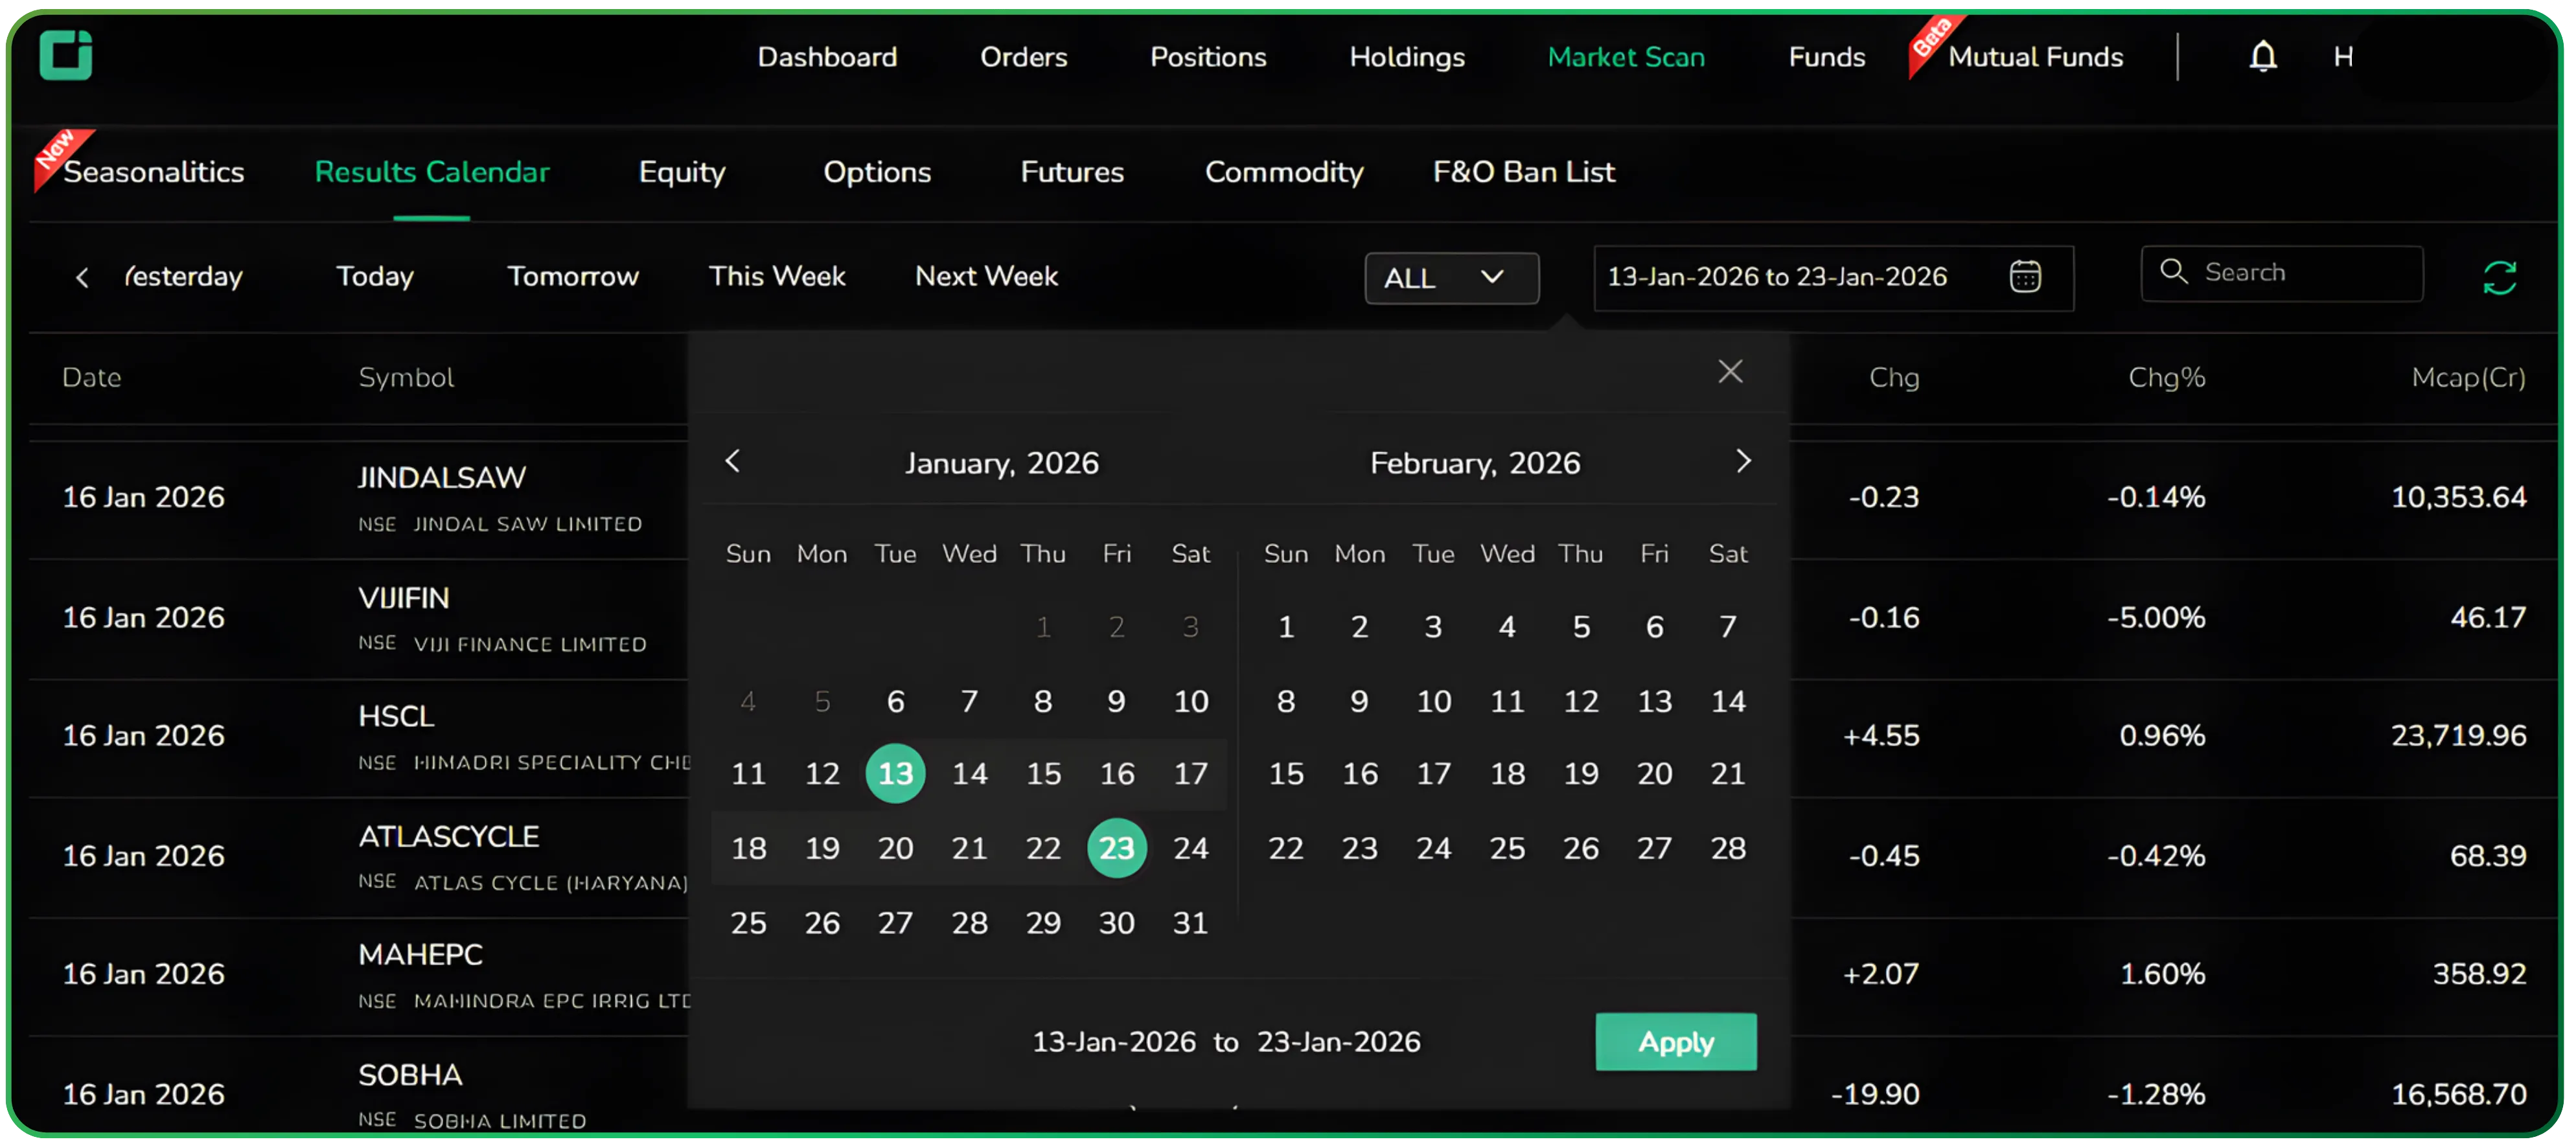
By choosing a start and end date, the calendar reorganises itself around that period, giving you a clear, chronological view of upcoming result announcements. It’s a simple way to plan ahead, whether you’re mapping portfolio reviews around earnings dates or preparing for a stretch of result-heavy sessions without relying on external calendars. For investors tracking multiple companies, this works well as a flexible quarterly results calendar in India.
Filtering for F&O relevance
Not all earnings are equally actionable, especially for derivatives traders. The ALL and F&O filter addresses this cleanly. Switching to F&O instantly limits the list to stocks where futures and options are available. In practice, this turns the feature into an efficient F&O stocks results scanner for derivatives-focused traders.
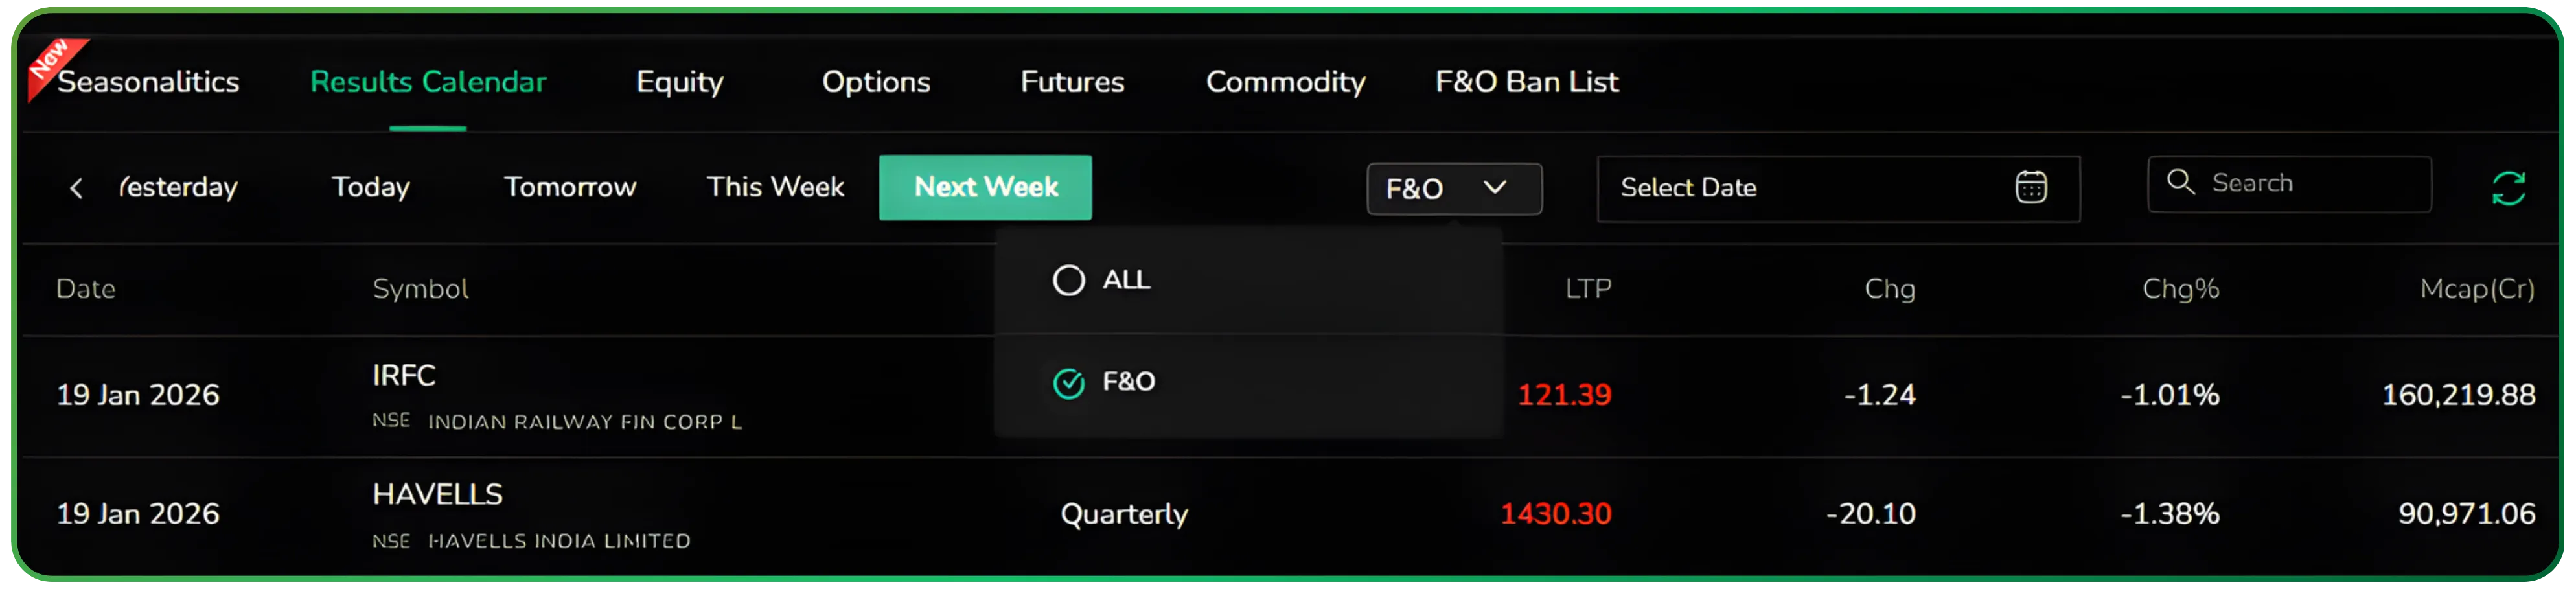
It’s a small control, but it removes mental clutter. You’re no longer scanning through names you can’t express a view on. The calendar becomes sharper, more tradable, and aligned with how options and futures traders actually operate.
Live context makes the calendar usable, not just informative
The real strength of the Results Calendar is that it stays live. As results are announced and the market reacts, price and percentage changes update on the same screen. This turns the calendar into a review tool during the day and a learning tool after the close.
You can quickly scan which stocks saw strong reactions, which barely moved, and how different market-cap segments responded to earnings. Over time, this builds intuition about where results truly matter and where expectations were already priced in. Over time, this view acts as a practical corporate earnings volatility tracker, highlighting where results actually move prices.
A utility that fits into real market workflows
The Results Calendar simply lays out what is happening, when it is happening, and how the market is responding. By placing earnings events, price reaction, tradability filters, and time-based views in one clean interface, CubePlus reduces friction during one of the busiest parts of the market cycle. It’s the kind of tool you open repeatedly during earnings season, not because it demands attention, but because it quietly makes everything else easier to manage. Used consistently, it also serves as a lightweight corporate earnings volatility tracker during peak reporting periods.
Start using CubePlus today and see how much smoother your order management can be.
Disclaimer: The information provided in our blogs is for informational purposes only and should not be construed as financial, investment, or trading advice. Trading and investing in the securities market carries risk. Always conduct your own research and consult with a qualified financial advisor before making any investment decisions. Past performance is not indicative of future results. Copyrighted and original content for your trading and investing needs.
© 2026 — Tradejini. All Rights Reserved.