


At its core, the Nxtoption IVR-IVP Scan is a volatility-regime selector that tells you whether option premiums are cheap or expensive relative to their own history. It does not prescribe fixed legs the way an iron condor or a butterfly does. Instead, it determines which type of strategy becomes optimal in the current environment. This makes it a practical volatility compass for traders using an IVR IVP options framework to decide between long vega and short vega approaches.
Also Read: The Difference Between Historical and Implied Volatility Explained
This scan uses four volatility signals:
IV (Implied Volatility): The market’s expectation of annualized movement priced into options.
IV Range (1Y): The lowest and highest IV the stock has experienced in the last 12 months.
IVP (Implied Volatility Percentile): Where today’s IV stands relative to the past year’s distribution. IVR (Implied Volatility Rank): Where today’s IV sits within the one-year high-low range.
Together, these metrics help you identify whether the market is overpricing or underpricing risk at this moment.
When both IVP and IVR are low, options become undervalued. When both are high, options become inflated. These dynamics directly support strategies built around implied volatility rank vs percentile strategies, especially for traders applying volatility mean reversion logic.
The scanner removes guesswork.
Cheap volatility → Buy options Expensive volatility → Sell options
The payoff of this framework doesn’t come from any single option structure. It comes from aligning strategy selection with the volatility cycle, something most retail traders completely ignore. The IVR–IVP scan forces discipline, prevents mismatch (like selling premium in cheap IV), and keeps you consistently on the mathematically favorable side of option pricing.
Understanding IVP and IVR
Before diving into the variations, readers must clearly understand the two key indicators: IVP and IVR. These are often misunderstood, yet they are the backbone of Nxtoption’s volatility logic, especially for traders identifying low IV environment buy options or high IV environment sell options opportunities.
1. IVP (Implied Volatility Percentile)
IVP tells you how cheap or expensive today’s IV is compared to every day in the past year. It answers the question:
“On how many days was IV lower than today?”
Example:
IVP = 15 → IV was lower on only 15% of the past year’s trading days.
IVP = 85 → IV was lower on 85% of the days, meaning today’s IV is very high.
Because IVP is distribution-based, it’s excellent at detecting whether volatility has spent long periods being low or high. It exposes how the market behaved across time rather than just its extremes.
Broad interpretation:
0–20: Volatility extremely cheap
20–40: Volatility cheap
40–60: Neutral
60–80: Expensive
80–100: Extremely expensive
2. IVR (Implied Volatility Rank)
IVR tells you where today’s IV sits inside the annual low–high range. It ignores distribution and looks at pure position:
IVR = (IV – IV_low) / (IV_high – IV_low) × 100
If the yearly range is 10% to 50%:
IV of 12% → IVR close to the low
IV of 48% → IVR close to the high
IVR is often smoother and more stable than IVP because it’s range-based. It helps traders avoid misreading distribution skew.
Broad interpretation:
Below 20: Near yearly lows
20–50: Lower half of range
50–80: Upper half of range
Above 80: Near yearly highs
Why both matter
- IVP tells you how often volatility was lower → distribution-focused.
- IVR tells you where volatility is right now vs extremes → range-focused.
Sometimes they disagree.
Example: If IV stayed low most of the year and spiked once:
IVR might be low (still near bottom)
IVP might be high (because IV was low for most days)
This is why Nxtoption displays both. You get a full 360° view of volatility quality, which directly supports traders using Nxtoption volatility regime selection techniques.
Strategy Variations (Based on Volatility Regime)
Because the scan is about identifying cheap vs expensive volatility, the variations are defined by volatility conditions, not by option legs.
Variation 1: Low-Volatility Zone Framework (Long Setup)
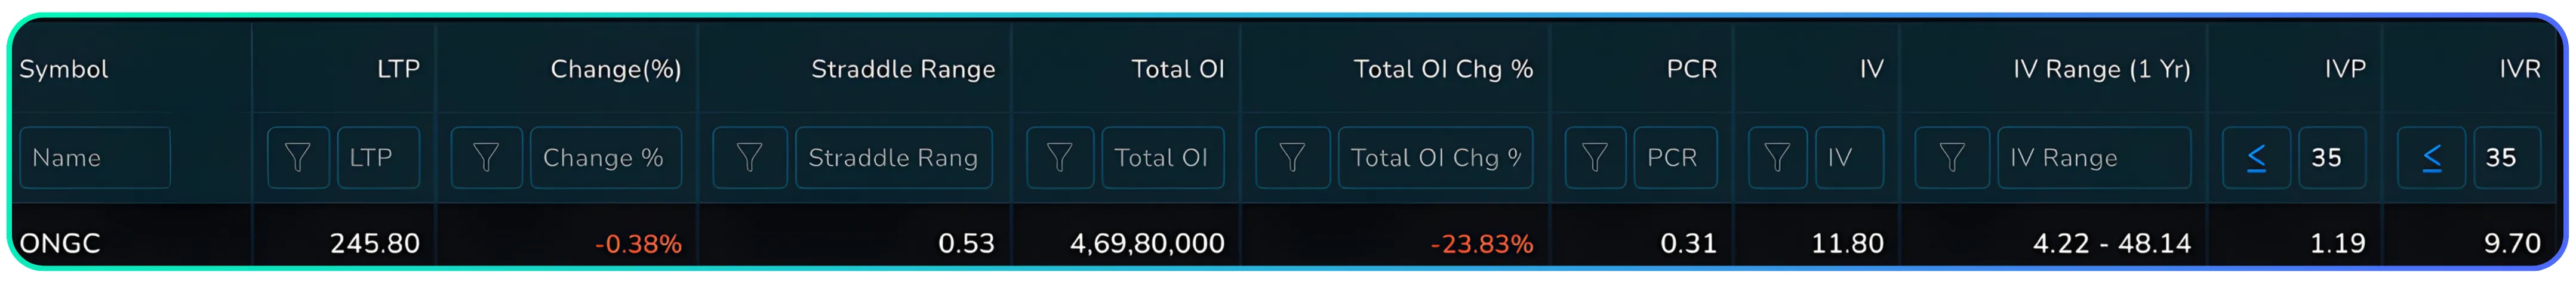
IVP < 35 AND IVR < 35
Net Debit. Long Vega. Cheap Optionality.
Low IV environments are counterintuitive for most traders. They see calmness and assume selling is safe. In reality, calmness is exactly what makes option premiums underpriced. When volatility returns, which it always does, buyers benefit disproportionately. This aligns strongly with reasoning behind low IV environment buy options setups.
Market View:
Expect a breakout or volatility expansion.
Position Structure:
Use long-vega setups such as:
- ATM/OTM call or put buys
- Debit vertical spreads
- Calendars and diagonals
- Backspreads for volatility surge setups
Net Position:
Always taken for a net debit.
Profit Driver:
Leverage cheap optionality and rising IV. Price movement plus volatility expansion creates a dual tailwind.
Example:
We can see here that ONGC is matching our long setup, thus a long strategy can be deployed using ATM/OTM call or put buys.
Also Read: Exploring the Long Calendar Spread Strategy
Variation 2: High-Volatility Zone Framework (Short Setup)
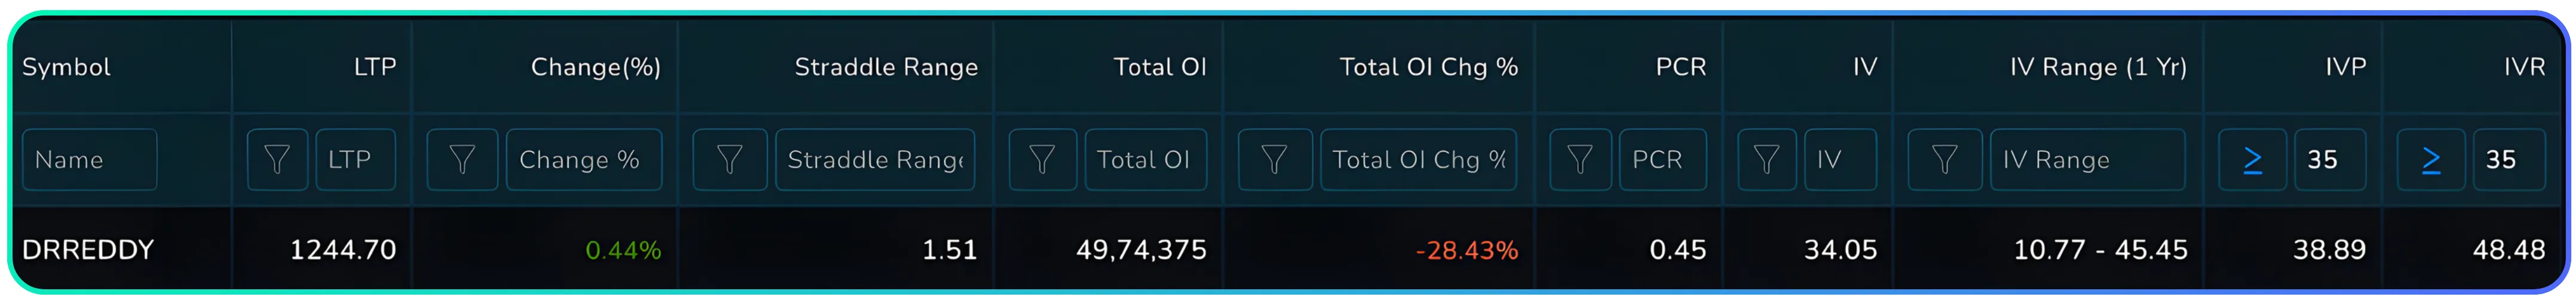
IVP > 35 AND IVR > 35
Net Credit. Short Vega. Expensive Optionality.
This regime is the exact opposite. High IV inflates option premiums well beyond reasonable future movement. Selling volatility becomes statistically favorable because IV mean-reverts far more often than it expands. This is the core of high IV environment sell options logic and closely linked to options trading volatility mean reversion.
Market View:
Expect consolidation, muted movement, or post-event IV crush.
Position Structure:
Use short-vega setups such as:
- Credit spreads
- Iron condors
- Short strangles (sized responsibly)
- Ratio spreads (sell-heavy)
- Covered calls or cash-secured puts
Net Position:
Always taken for a net credit.
Profit Driver:
Premium decay + IV collapse. Price can even drift slightly and sellers still win.
Example: As we can see here that DRREDDY matches are criteria for entering a short vega position. Therefore a credit spread can be deployed.
Also Read: The Iron Condor A Neutral Strategy for Sideways Markets
Deployment Conditions Table
| Condition | Low-IV Zone Framework (Buy-Side) | High-IV Zone Framework (Sell-Side) |
|---|---|---|
| Market View | Expect range expansion or breakout. | Expect consolidation or IV crush. |
| Implied Volatility | Best when IVP < 35 AND IVR < 35. | Best when IVP > 65 AND IVR > 65. |
| Use Case | Pre-breakout, pre-trend continuation, volatility pop setups. | Post-event, range-bound markets, elevated IV cycles. |
| Ideal Scenario | Price near technical levels + cheap premiums. | Price extended or crowded + inflated premiums. |
Risk Management
Low-Volatility Zone (Buy-Side)
The main danger is theta decay. If price doesn’t move or IV keeps falling, premiums bleed rapidly.
Mitigation Actions:
Strike selection: Favor ATM or slightly OTM strikes to limit decay.
Exit triggers:
If breakout doesn’t show up within your expected timeframe
If IV continues contracting
- Adjustments: Convert naked buy to debit spread to reduce decay
Roll to next expiry only if momentum is building slowly
- Position sizing: Keep risk small because long options can decay to zero.
Avoid When:
ATR compresses heavily, PCR flatlines, and the market shows clear indecision.
High-Volatility Zone (Sell-Side)
The main danger is a violent move beyond your sold strikes before IV collapses.
Mitigation Actions:
Strike selection: Choose far OTM strikes with technical confirmation.
Exit triggers:
If IV rises further instead of cooling
If price sharply penetrates your short strike region
- Adjustments:
Convert short strangle into iron condor when risk increases
Roll outwards to reduce gamma exposure while keeping credit
- Position sizing: Keep sizing conservative, especially for undefined-risk positions.
Avoid When:
Major news events, earnings, or macro announcements are due.
Strategic Positioning
The IVR-IVP Scan forces a shift in mindset. Instead of trading setups because they “look good,” you trade them because volatility conditions justify them. That discipline is what separates casual option traders from those who treat the market as a probabilistic system.
Low-IV variation demands decisiveness and timing. You’re betting that calm markets will not stay calm.
High-IV variation demands patience and risk control. You’re betting that fear and uncertainty are overpriced.
The framework is superior to guess-based approaches because every option strategy—debit spread, credit spread, condor, strangle—has an optimal volatility regime. The Nxtoption scan ensures you deploy the right tool in the right environment rather than fighting market structure, which is the core purpose of any refined Nxtoption volatility regime selection approach.
Conclusion
The Nxtoption IVR-IVP Scan is a volatility compass. It tells you whether to pay for optionality or get paid for assuming risk. The two variations, buy-side (low IV) and sell-side (high IV), are complementary tools, not competing ones.
Before taking any trade, ask:
- Are options cheap or expensive relative to their history?
- Am I aligning my strategy with the volatility regime?
- Is my edge coming from direction, volatility, or both?
Used with proper sizing and adjustments, this framework becomes a systematic way to avoid overpriced trades and seek favorable risk-reward environments. It simplifies decision-making and grounds your option selection in objective volatility logic rather than intuition.
Trade smarter with Nxtoption. Scan IVP and IVR instantly, spot mispriced options, and choose the right strategy every time. Start using volatility to your advantage today.
Disclaimer: The information provided in our blogs is for informational purposes only and should not be construed as financial, investment, or trading advice. Trading and investing in the securities market carries risk. Always conduct your own research and consult with a qualified financial advisor before making any investment decisions. Past performance is not indicative of future results. Copyrighted and original content for your trading and investing needs.
© 2025 — Tradejini. All Rights Reserved.