


When you open an option chain for the first time, the numbers can feel overwhelming. Strike prices, premiums, implied volatility, Greeks, and open interest. Everything seems complex and interconnected. But hidden inside that option chain is one of the most important concepts in options trading. volatility skew.
Understanding volatility skew in options trading, explained in terms, can give you an edge in making better trading decisions. This guide breaks down what volatility skew is, why it exists, and how traders use it through option chain analysis and implied volatility at different strikes prices to identify opportunities in the market.
Also Read: The role of NISM Certifications
Understanding the Basics
Imagine a seesaw in a playground. On one side is put options, which gain value when the market falls. On the other side sit call options, which gain value when the market rises. In theory, this seesaw should be balanced. Both sides should have similar characteristics. But in reality, the put side is usually heavier. This heaviness shows up as higher implied volatility in out-of-the-money put options relative to calls and at-the-money options. This imbalance across strikes is what we call volatility skew.
What is Volatility Skew?
Volatility skew refers to the pattern observed when implied volatility of options with the same expiration date but different strike prices is plotted on a graph. In equity markets, this usually means lower strike prices. Out-of-the-money puts show higher implied volatility than at-the-money options. This creates an asymmetric pattern in the volatility curve and explains implied volatility at different strike prices.
Consider a stock trading at ₹100. If the implied volatility for the ₹90 put option is higher than that of the ₹100 at-the-money options, you have a skew. This pattern tells you something important about market sentiment and investor expectations embedded in option pricing.
Reading the Option Chain
An option chain displays several data points for each strike price. The key elements include strike prices, call and put premiums, trading volume, open interest, and implied volatility. If markets were perfectly neutral, all options with the same expiry would show similar implied volatility across strikes.
But real markets are driven by emotions, particularly fear about downside risk, which means an asymmetric risk perception exists. This emotional component creates the volatility skew patterns we observe during option chain analysis.
Also Read: Understanding the Stock Settlement Cycle and Clearing Process
Why Volatility Skew Exists
Several factors contribute to the formation of volatility skew in option markets. Supply and demand imbalance directly influences implied volatility levels. When certain strike prices attract more trading activity, their implied volatility adjusts accordingly. In equity markets, this demand concentrates in put options, pushing their implied volatility higher and creating put skew.
Asymmetric risk perception causes traders to price upward and downward risks differently. Loss aversion means investors often overestimate the probability of negative outcomes. Assets prone to sudden upside spikes may show elevated call implied volatility instead.
Event risk amplifies volatility skew around anticipated announcements like earnings releases, policy decisions, or economic data. Traders adjust option prices to account for potential sharp moves, increasing implied volatility for strikes likely to be impacted by the event.
Historical price movements influence current pricing patterns. Assets with a history of sharp declines tend to show higher implied volatility for lower strike options. Conversely, assets prone to sudden spikes may show elevated implied volatility for higher strike calls.
Liquidity variations among different strike prices also create skew. Options with higher trading volumes have tighter bid-ask spreads and more reliable pricing. Illiquid options often show exaggerated implied volatility due to limited trading activity and wider spreads.
Three Types of Volatility Patterns
Understanding the various skew patterns enables you to interpret market sentiment more accurately. Each pattern reveals different market expectations and creates distinct trading opportunities.
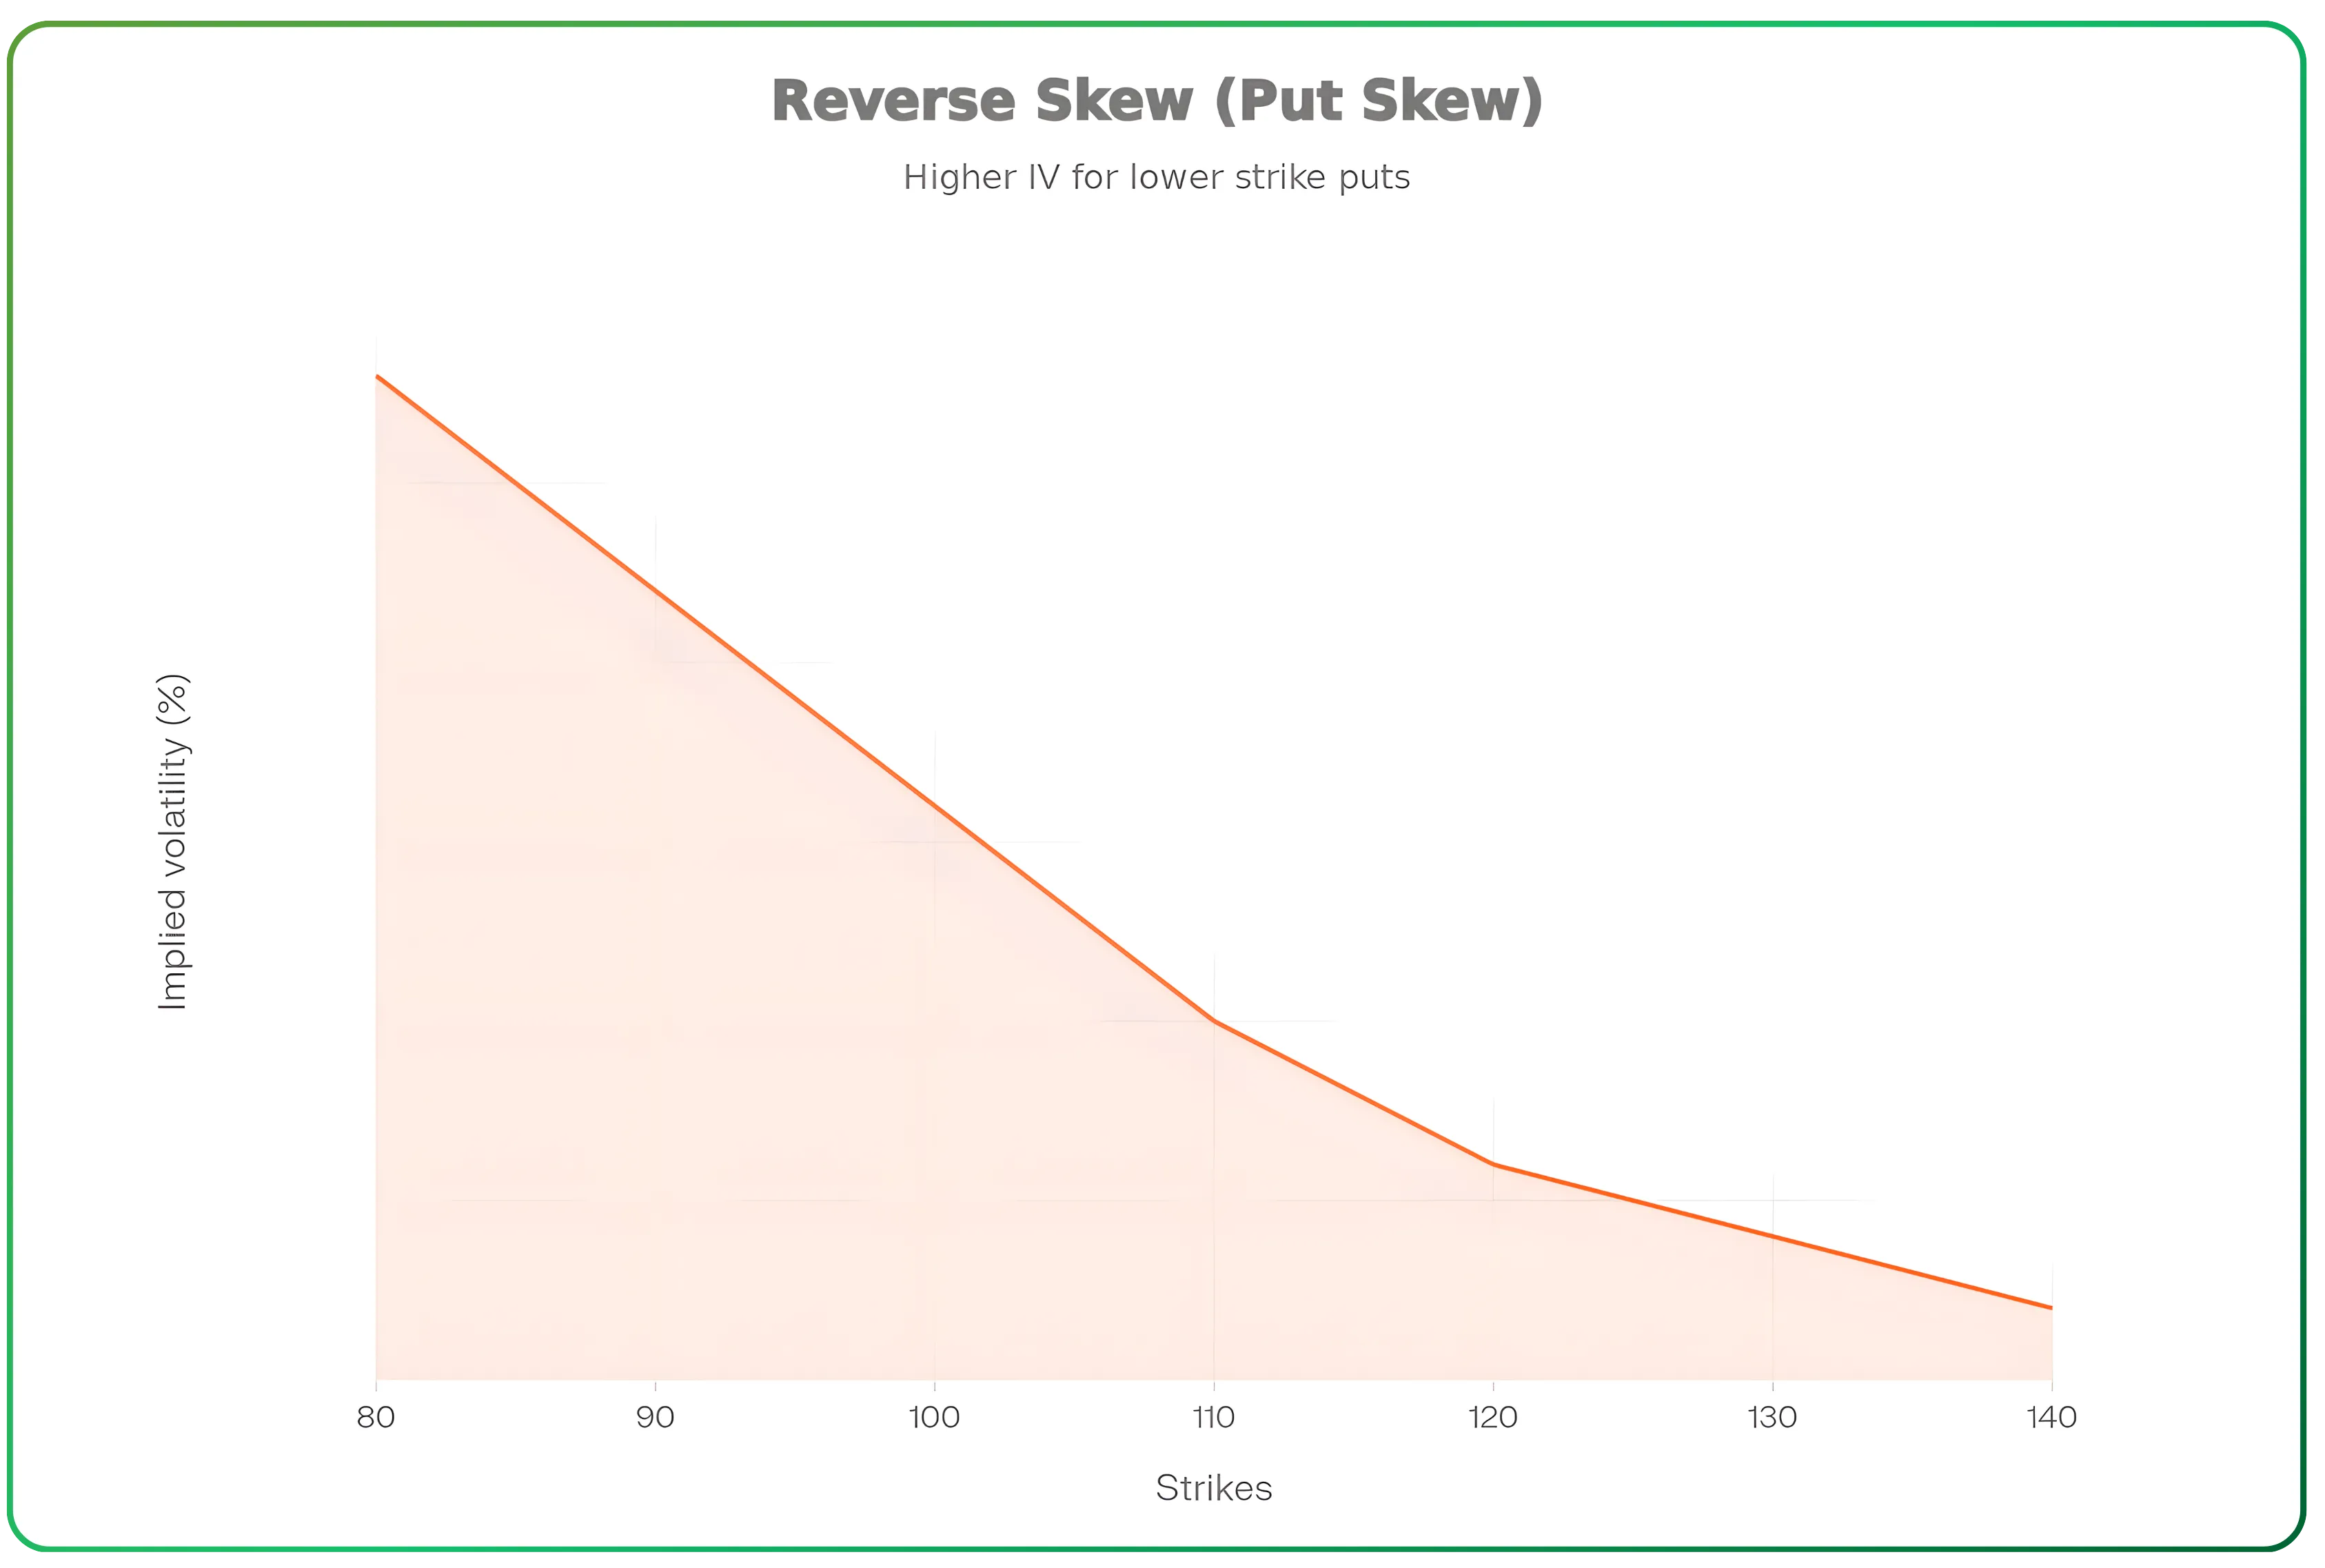
Put Skew (Reverse Skew)
Put skew occurs when out-of-the-money put options have higher implied volatility than out-of-the-money call options. When you plot implied volatility against strike prices, you see a curve that slopes downward from left to right. Lower strikes show progressively higher implied volatility. This reflects the market’s fear of sharp downside moves.
Most equity market participants fear sharp crashes more than they anticipate big rallies. Historical market behaviour reinforces this fear. Major market declines tend to be sudden and violent, while rallies usually unfold more gradually. Because of this asymmetry, out-of-the-money put options become expensive as traders bid up prices for downside protection.
Take a practical example from the Nifty options chain. For the April 2025 expiry, the 21700 put might show implied volatility of 25.25%, while the 22300 call shows only 21.85%. This difference reflects the market pricing downside risk more aggressively than upside potential.
Forward skew signals investor caution and greater demand for protective puts. This pattern creates opportunities for premium-selling strategies when you believe the market will remain stable or move higher, as the elevated put premiums decay faster when fear subsides.
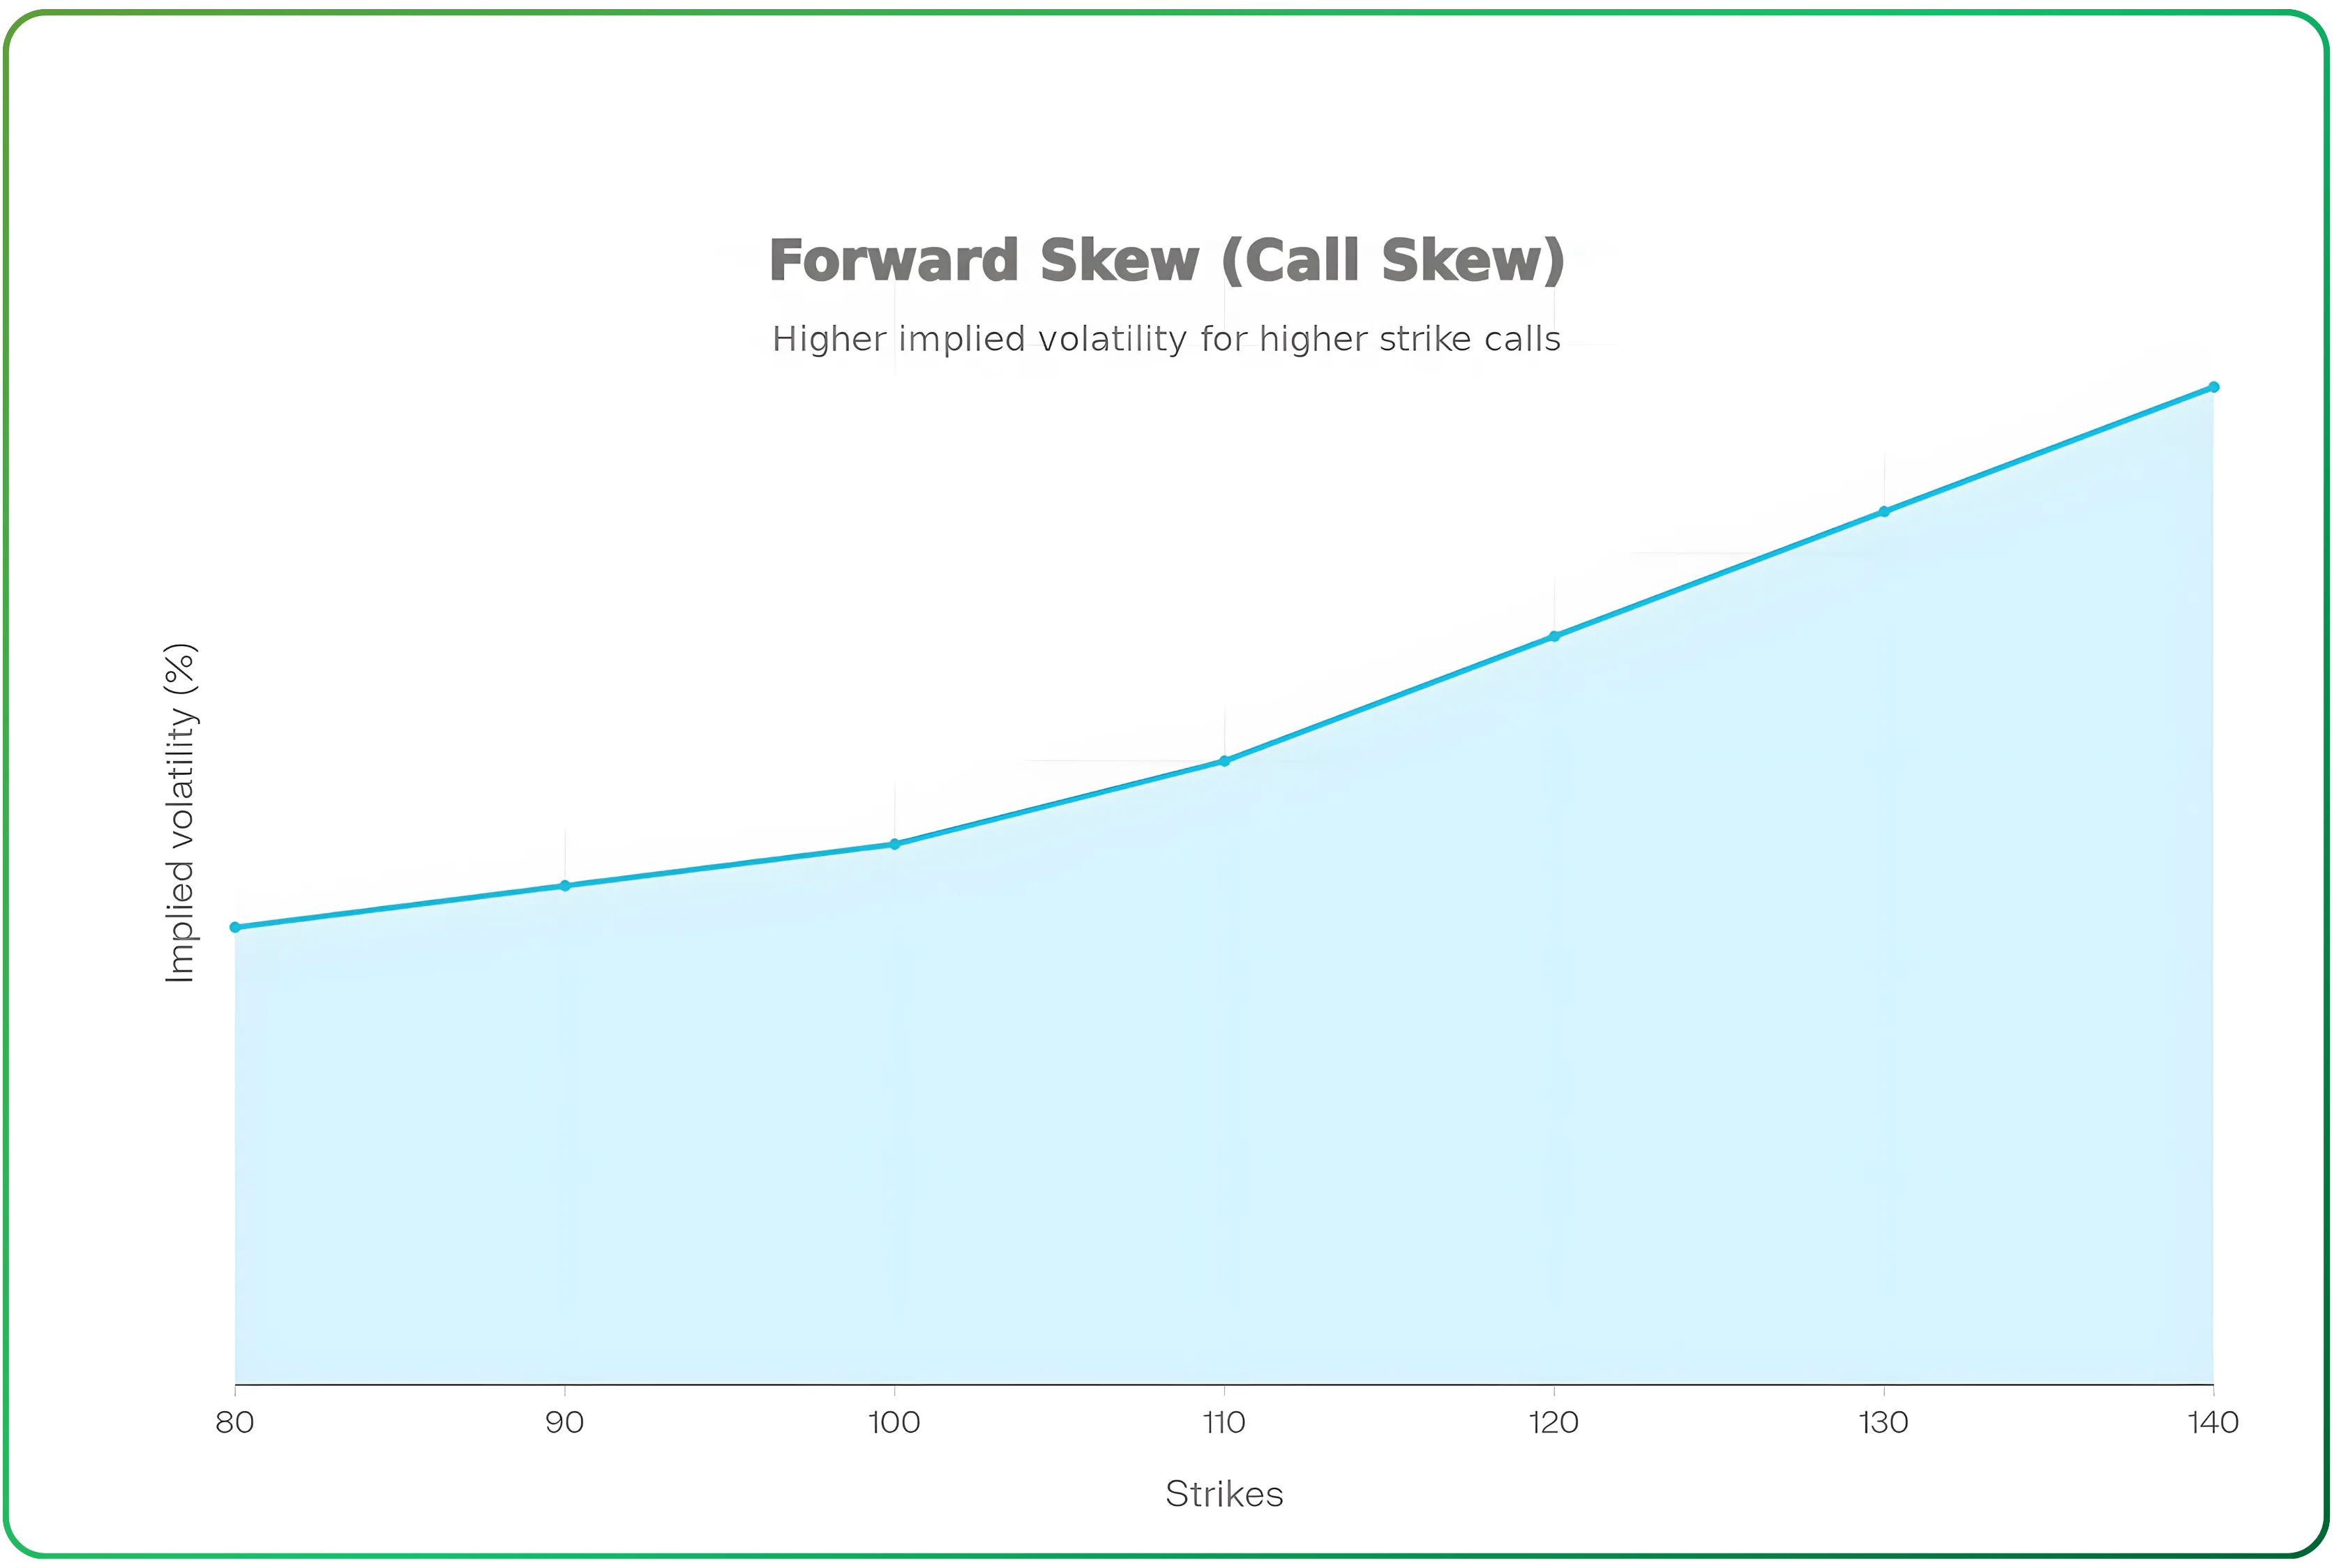
Call Skew (Forward Skew)
Reverse skew happens when out-of-the-money call options show higher implied volatility than out-of-the-money put options. The volatility curve slopes upward from left to right, with higher strikes showing progressively higher implied volatility.
This pattern is less common in equity indices but frequently appears in individual stocks and commodities. When supply concerns arise, prices can spike dramatically. Traders fear these sudden upward moves and bid up call option prices for protection or speculation.
Reverse skew can also appear in individual stocks ahead of potential positive catalysts like drug approvals, breakthrough product launches, or acquisition rumors. When the market anticipates potentially explosive upside with limited downside, call options command premium prices.
This pattern indicates expectations of explosive upside rather than downside risk. It creates opportunities to sell expensive calls when you believe the anticipated spike is overpriced or to buy cheaper puts for defined-risk bearish positions.
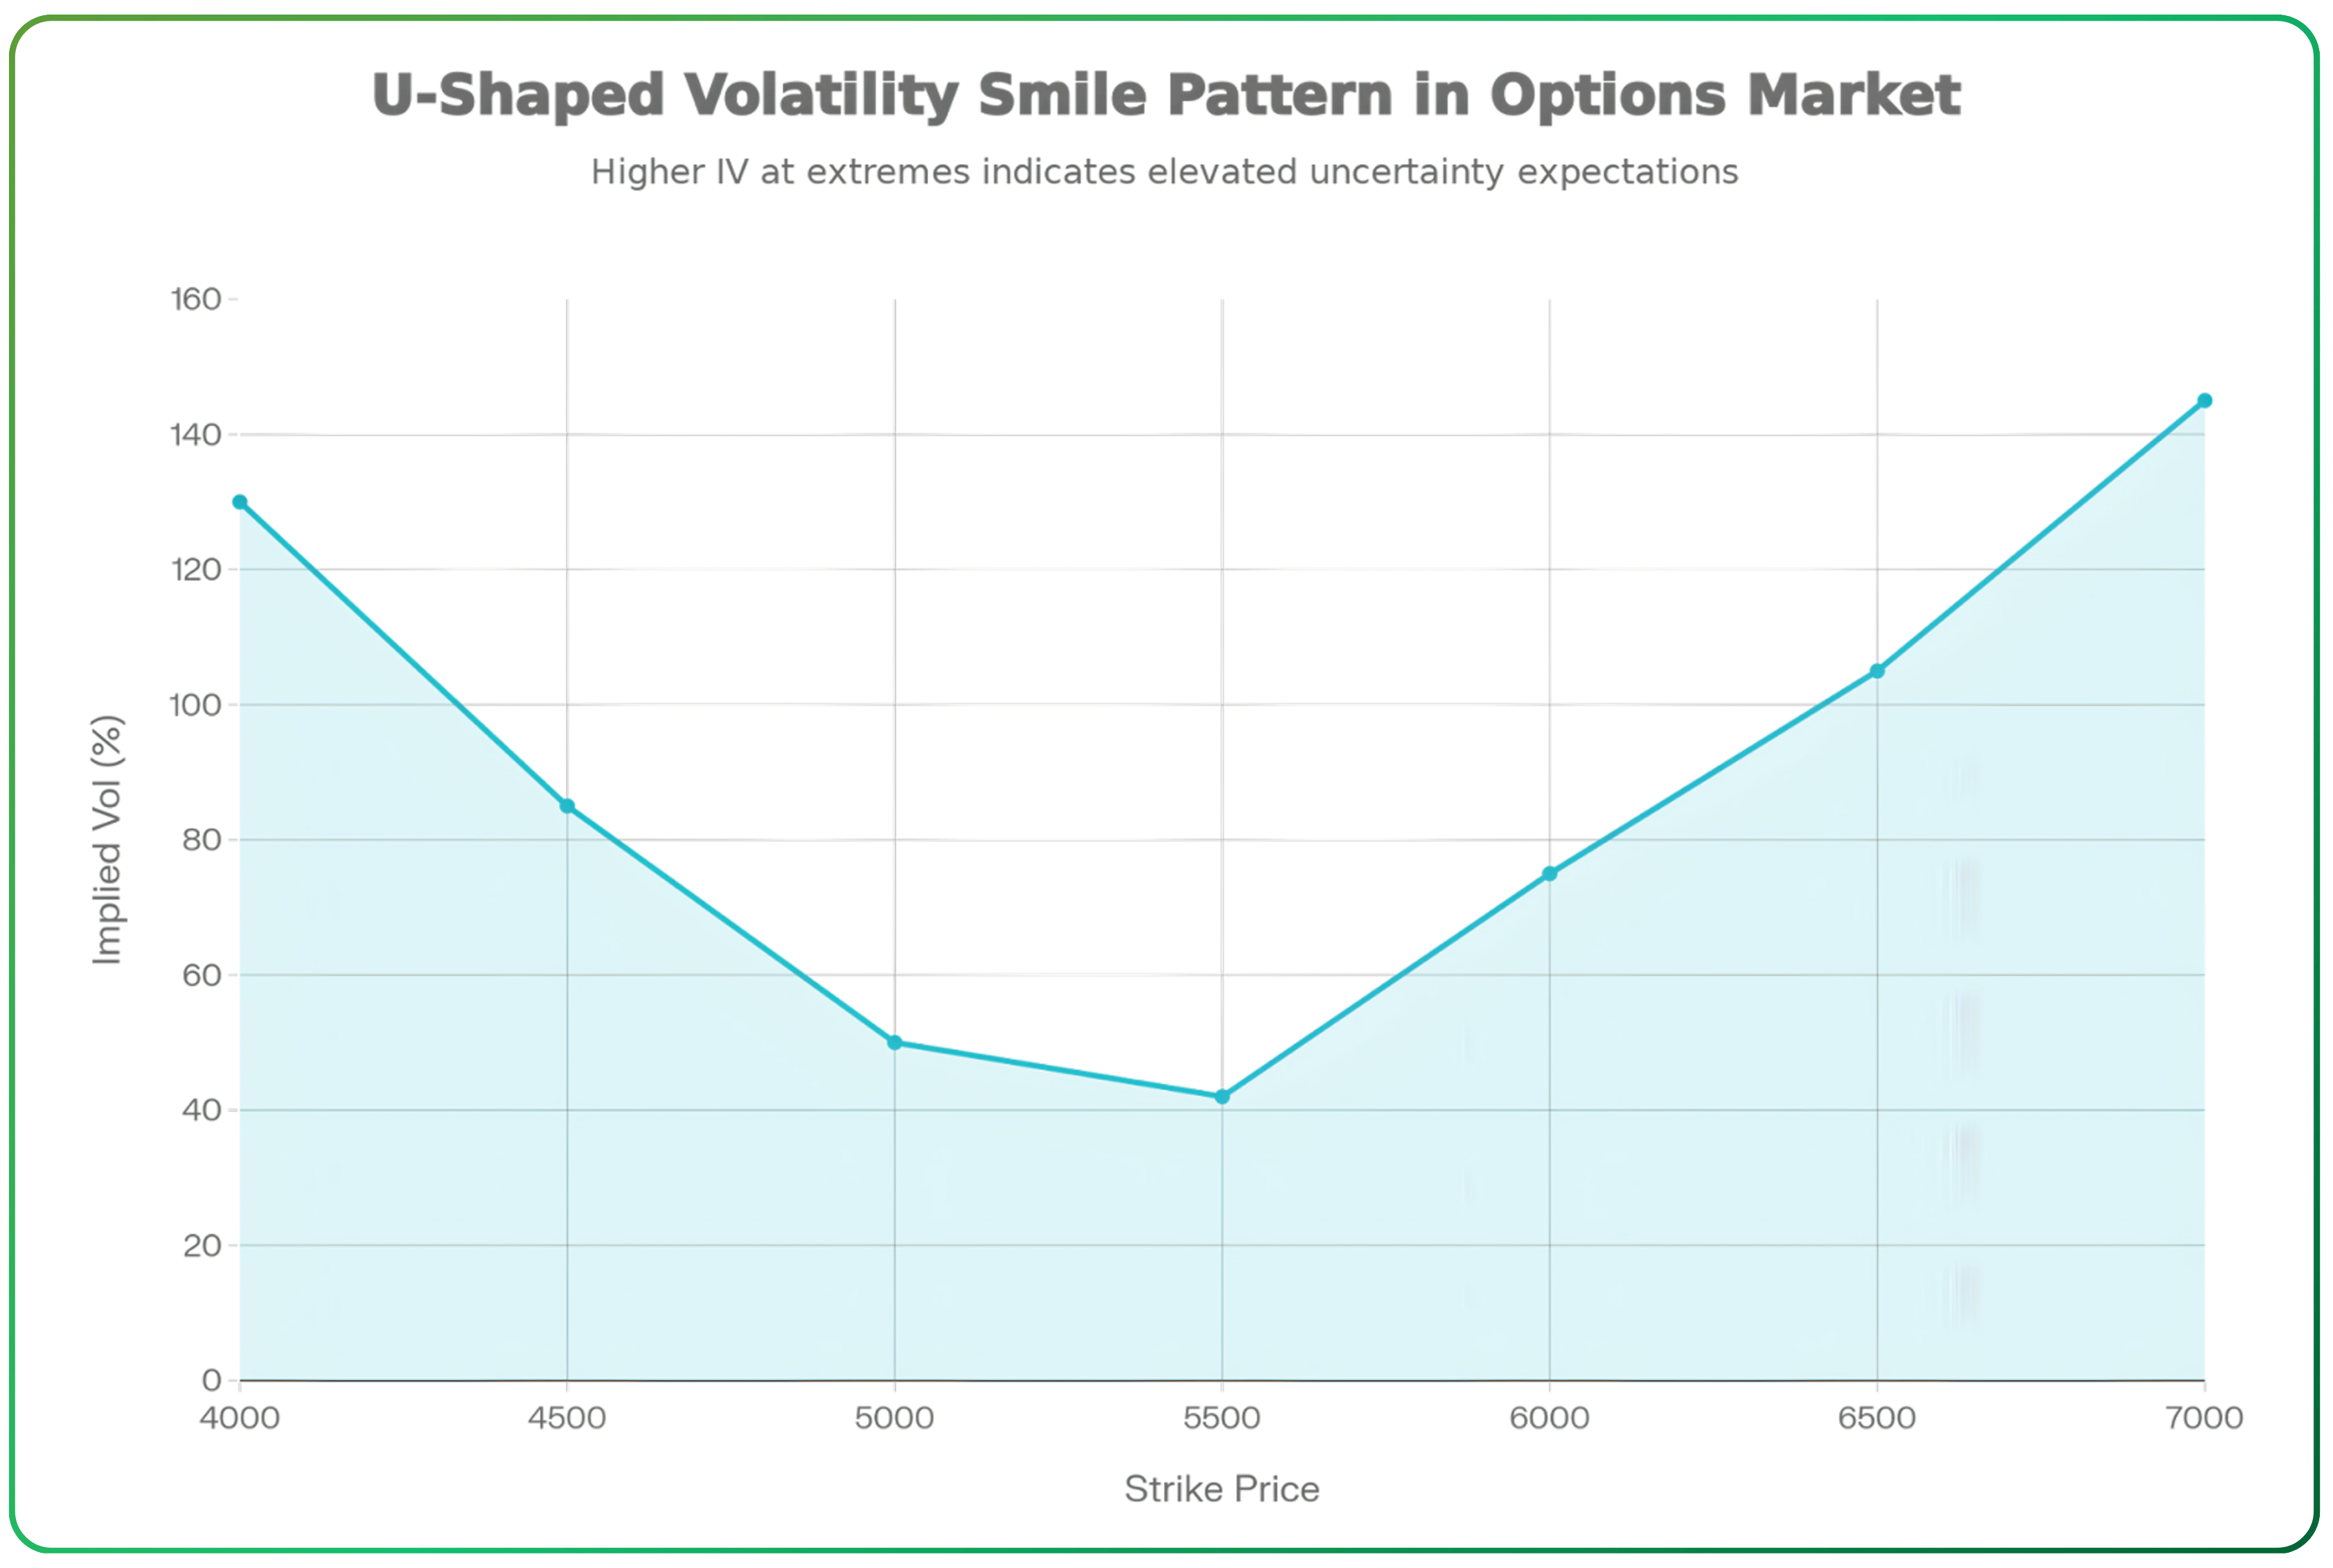
Volatility Smile
The volatility smile pattern in options describes a U-shaped curve where both out-of-the-money calls and puts have higher implied volatilities than at-the-money options. When plotted on a graph, the curve resembles a smile.
This pattern appears when the market expects extreme price movements but remains uncertain about the direction. Both tails of the distribution carry elevated implied volatility. At-the-money options show the lowest implied volatility, representing baseline expectations.
Volatility smiles are common in currency markets where central bank actions or geopolitical events could drive sharp moves in either direction. They also appear in equity markets during periods of high uncertainty, such as around major policy announcements or during crisis periods.
Consider a stock that has crashed sharply. Out-of-the-money puts show dramatically elevated implied volatility, sometimes reaching 110–150%, reflecting intense fear and demand for downside protection. Simultaneously, out-of-the-money calls may also show elevated implied volatility of 70–90%. This elevation reflects overall uncertainty and the possibility of sharp rebounds following severe declines.
The depth of the U-shape correlates with market fear and uncertainty. A deeper, more pronounced smile indicates greater expected volatility in both directions. This pattern creates opportunities for strategies that profit from volatility normalization once uncertainty resolves.
Also Read: A Deep dive into Trading Chart Terminal
Why Volatility Skew Matters
Volatility skew options trading explained through these patterns helps traders identify mispriced risk. When events like elections, policy announcements, or global news spike fear or excitement, the skew becomes exaggerated. Market participants pay inflated premiums for protection or speculation based on their directional bias.
Put skew reflects fear of declines. Call skew demonstrates the fear of missing upside. Volatility smiles reflect uncertainty in both directions. By reading skew correctly, traders can avoid overpaying for protection, identify overpriced optionality, and structure strategies that align with how risk is actually being priced rather than how price alone appears.
CubePlus lets you track implied volatility across strikes in real time and read how risk is actually being priced before the move shows up in price. If you want to move beyond guessing market sentiment and start reading it directly from options data, sign up on CubePlus and explore skew the way professional traders do.
Disclaimer: The information provided in our blogs is for informational purposes only and should not be construed as financial, investment, or trading advice. Trading and investing in the securities market carries risk. Always conduct your own research and consult with a qualified financial advisor before making any investment decisions. Past performance is not indicative of future results. Copyrighted and original content for your trading and investing needs.
© 2025 — Tradejini. All Rights Reserved.