


At its core, a Put Ladder is a three-legged options strategy that expands on the standard vertical put spread. By introducing a third leg, the trader alters the payoff structure to either reduce the trade’s entry cost or create multiple profit zones. Unlike a simple spread, the ladder shape creates asymmetric exposures where there is defined risk in some regions and potentially unlimited risk (or profit) in others. Mastering how put ladders work options trading strategy advanced techniques requires understanding both the put ladder net credit and debit structures and their distinct risk profiles.
Also Read: How call ladders work in different market conditions
Understanding how put ladders work requires comparing them against simpler vertical spreads. The additional leg can turn a limited-gain spread into one with broader payoff potential but with more complex risks to manage.
The strategy always involves three put options of the same expiry but at different strike prices. Whether you are net long or net short, the premium decides if you are building the trade for credit, debit, or volatility exposure.
Types of Put Ladders
The two primary variations of the put option ladder strategy serve opposite market conditions, making the analysis of greeks an essential part of consideration for a proper implementation.
A Bear put ladder: This strategy is deployed with a neutral-to-moderately bearish view. It works best if the underlying drifts lower, but not too sharply. Construct it by buying one ATM put and selling two OTM puts of increasing distance. This structure typically results in a net credit; you receive a premium upfront.. You make maximum profit if the underlying closes just at the first (higher strike) OTM put. If the stock stays flat or rises, you simply keep the initial credit, no harm done. However, if the stock collapses far below the lowest put strike, losses are theoretically unlimited due to the two short puts.
A Bull Put Ladder: The Bull Put Ladder is an options strategy that involves selling one ATM put and buying two OTM puts at progressively lower strikes. This is typically a net debit trade. Profit is made if the underlying stays above the sold put or falls sharply (where the long puts go deep ITM). If the stock drifts moderately downward (trading between the sold put and the long puts), the strategy can result in substantial losses. Gains below the lowest strike are unlimited.
The fundamental difference in the put options ladder strategy variations lies in their volatility exposure: the bear put ladder strategy operates as a short volatility options strategy, while the bull put ladder strategy functions as a long volatility put strategy.
When to deploy put ladders
Choosing the right moment to deploy a put ladder is just as important as building it correctly. The ideal market conditions for a Bull Put Ladder are the exact opposite of those for a Bear Put Ladder.
| Conditions | Bull Put Ladder | Bear Put Ladder |
|---|---|---|
| Market View | Neutral to mildly bullish – expect stability, but hedge for a sharp fall | Neutral to mildly bearish – expect a gentle decline, not a sharp crash |
| Implied Volatility (IV) | Preferably, low or rising IV – long puts are cheaper and benefit if IV expands | Preferably high IV – richer premiums from short puts |
| Use Case / Timing | Ahead of events likely to trigger volatility or sharp moves | After an event, when uncertainty is priced in and the market may fade |
Practical examples
These real-world examples demonstrate how put ladders work in practice, highlighting the naked option risk management considerations inherent in each approach.
Bull Put Ladder
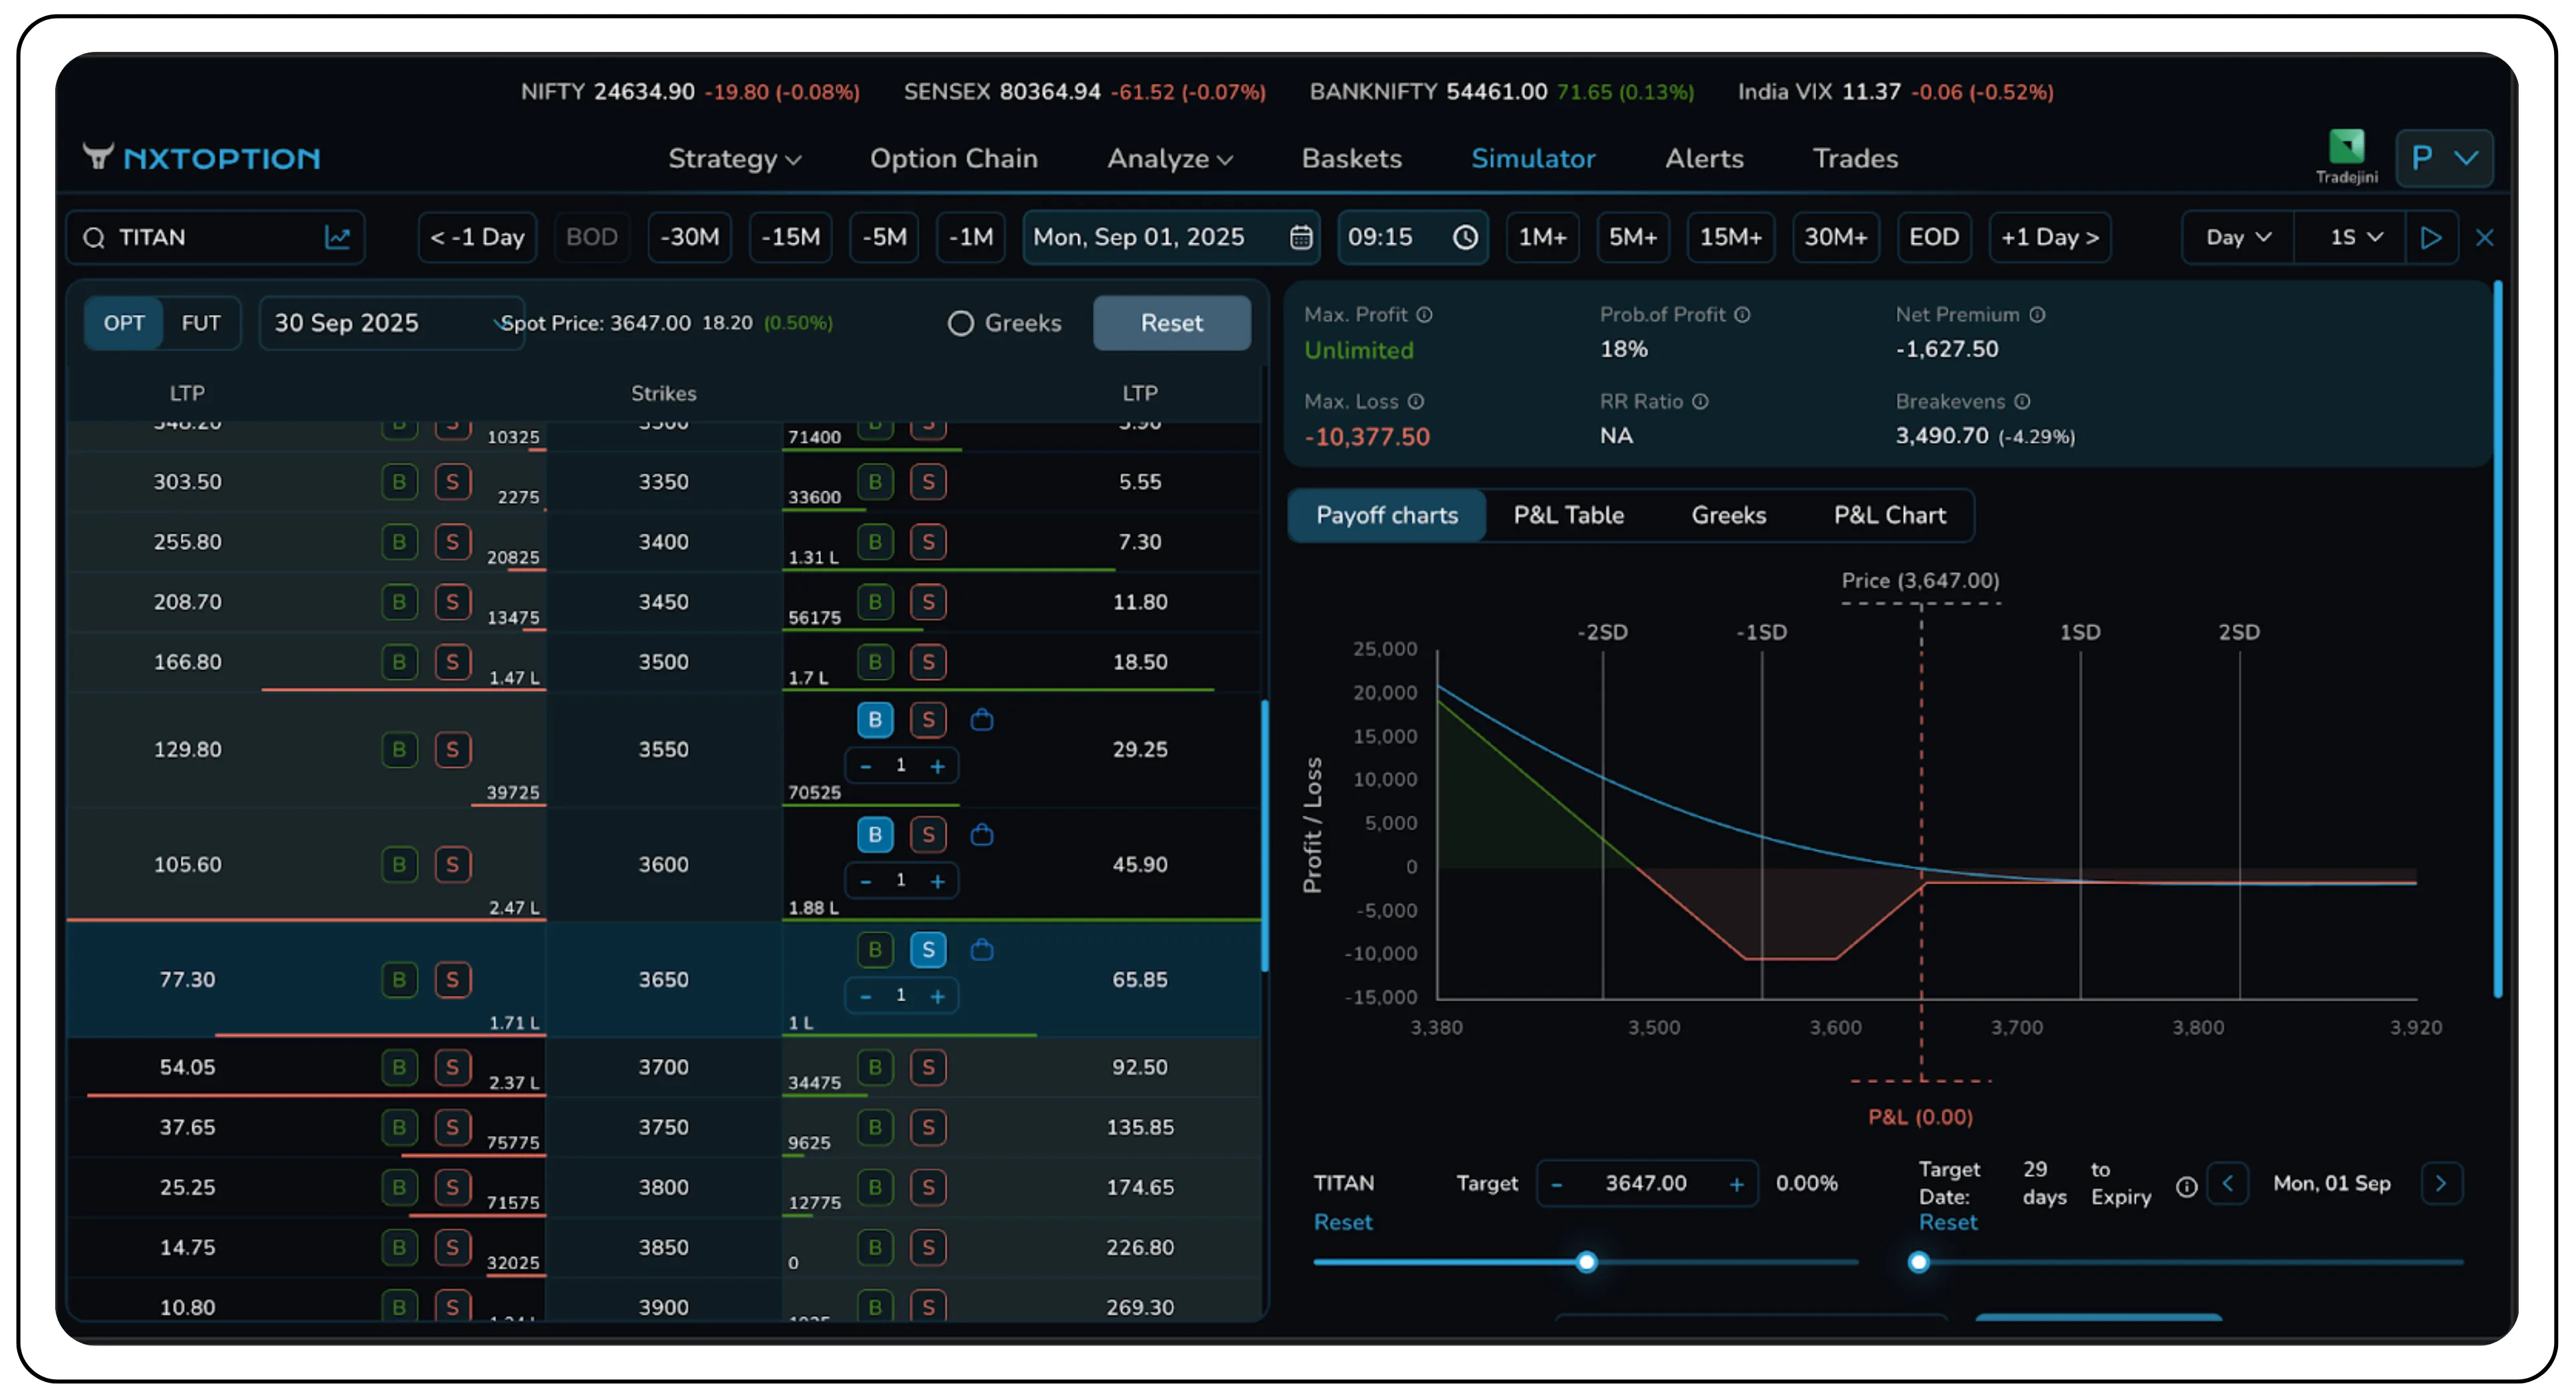
On 1st September 2025, a Bull Put Ladder was deployed on Titan, which was trading at ₹3647.
Legs of the strategy:
- Sell 3650 put at ₹65.65
- Buy 3600 put at ₹45.90
- Buy 3550 put at ₹ 129.25
The net premium paid was a debit of ₹28,437.50, which represents the maximum possible loss if Titan closes between ₹3650 and ₹3700 on expiry. This upfront debit is the cost of entering the trade. However, the profit potential is unlimited on the downside, since both long puts (3600 PE and 3550 PE) continue to gain value as Titan falls below the lowest strike.
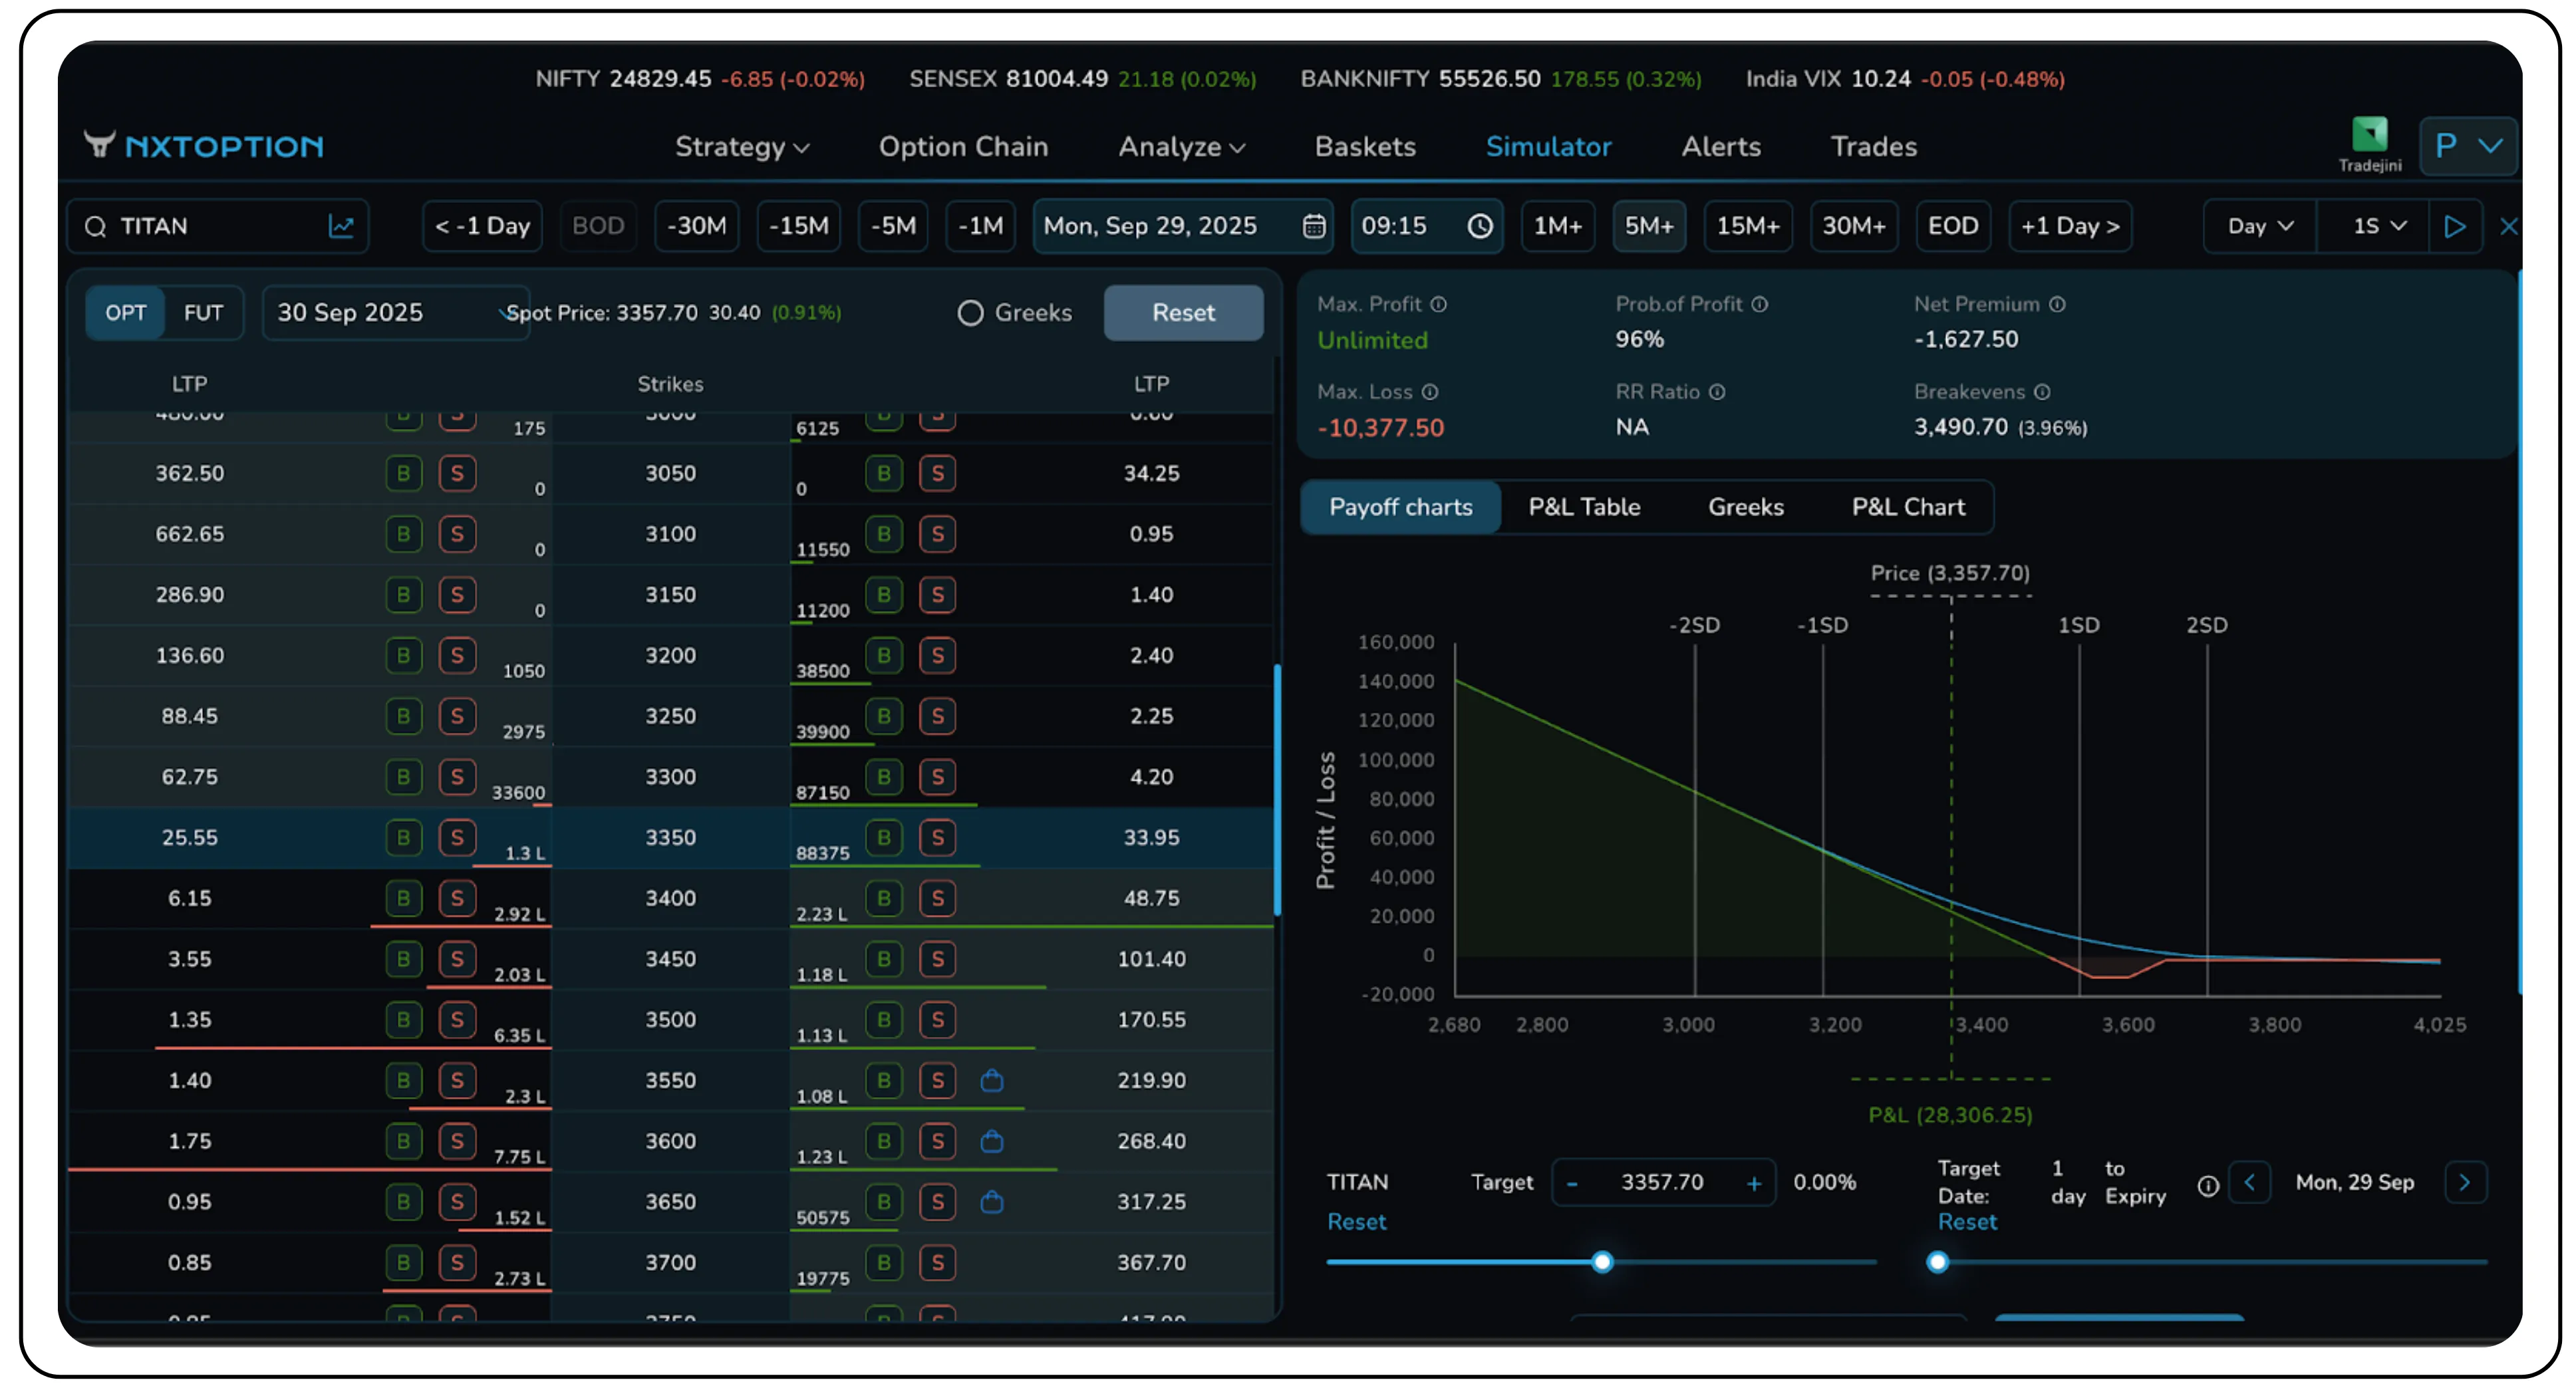
By expiry, Titan closed at ₹3,357. As the stock price moved significantly below the breakdown point, the two long puts (3650 PE and 3600 PE) gained substantial value. This also resulted in a net profit of ₹28,306.
Bear Put Ladder
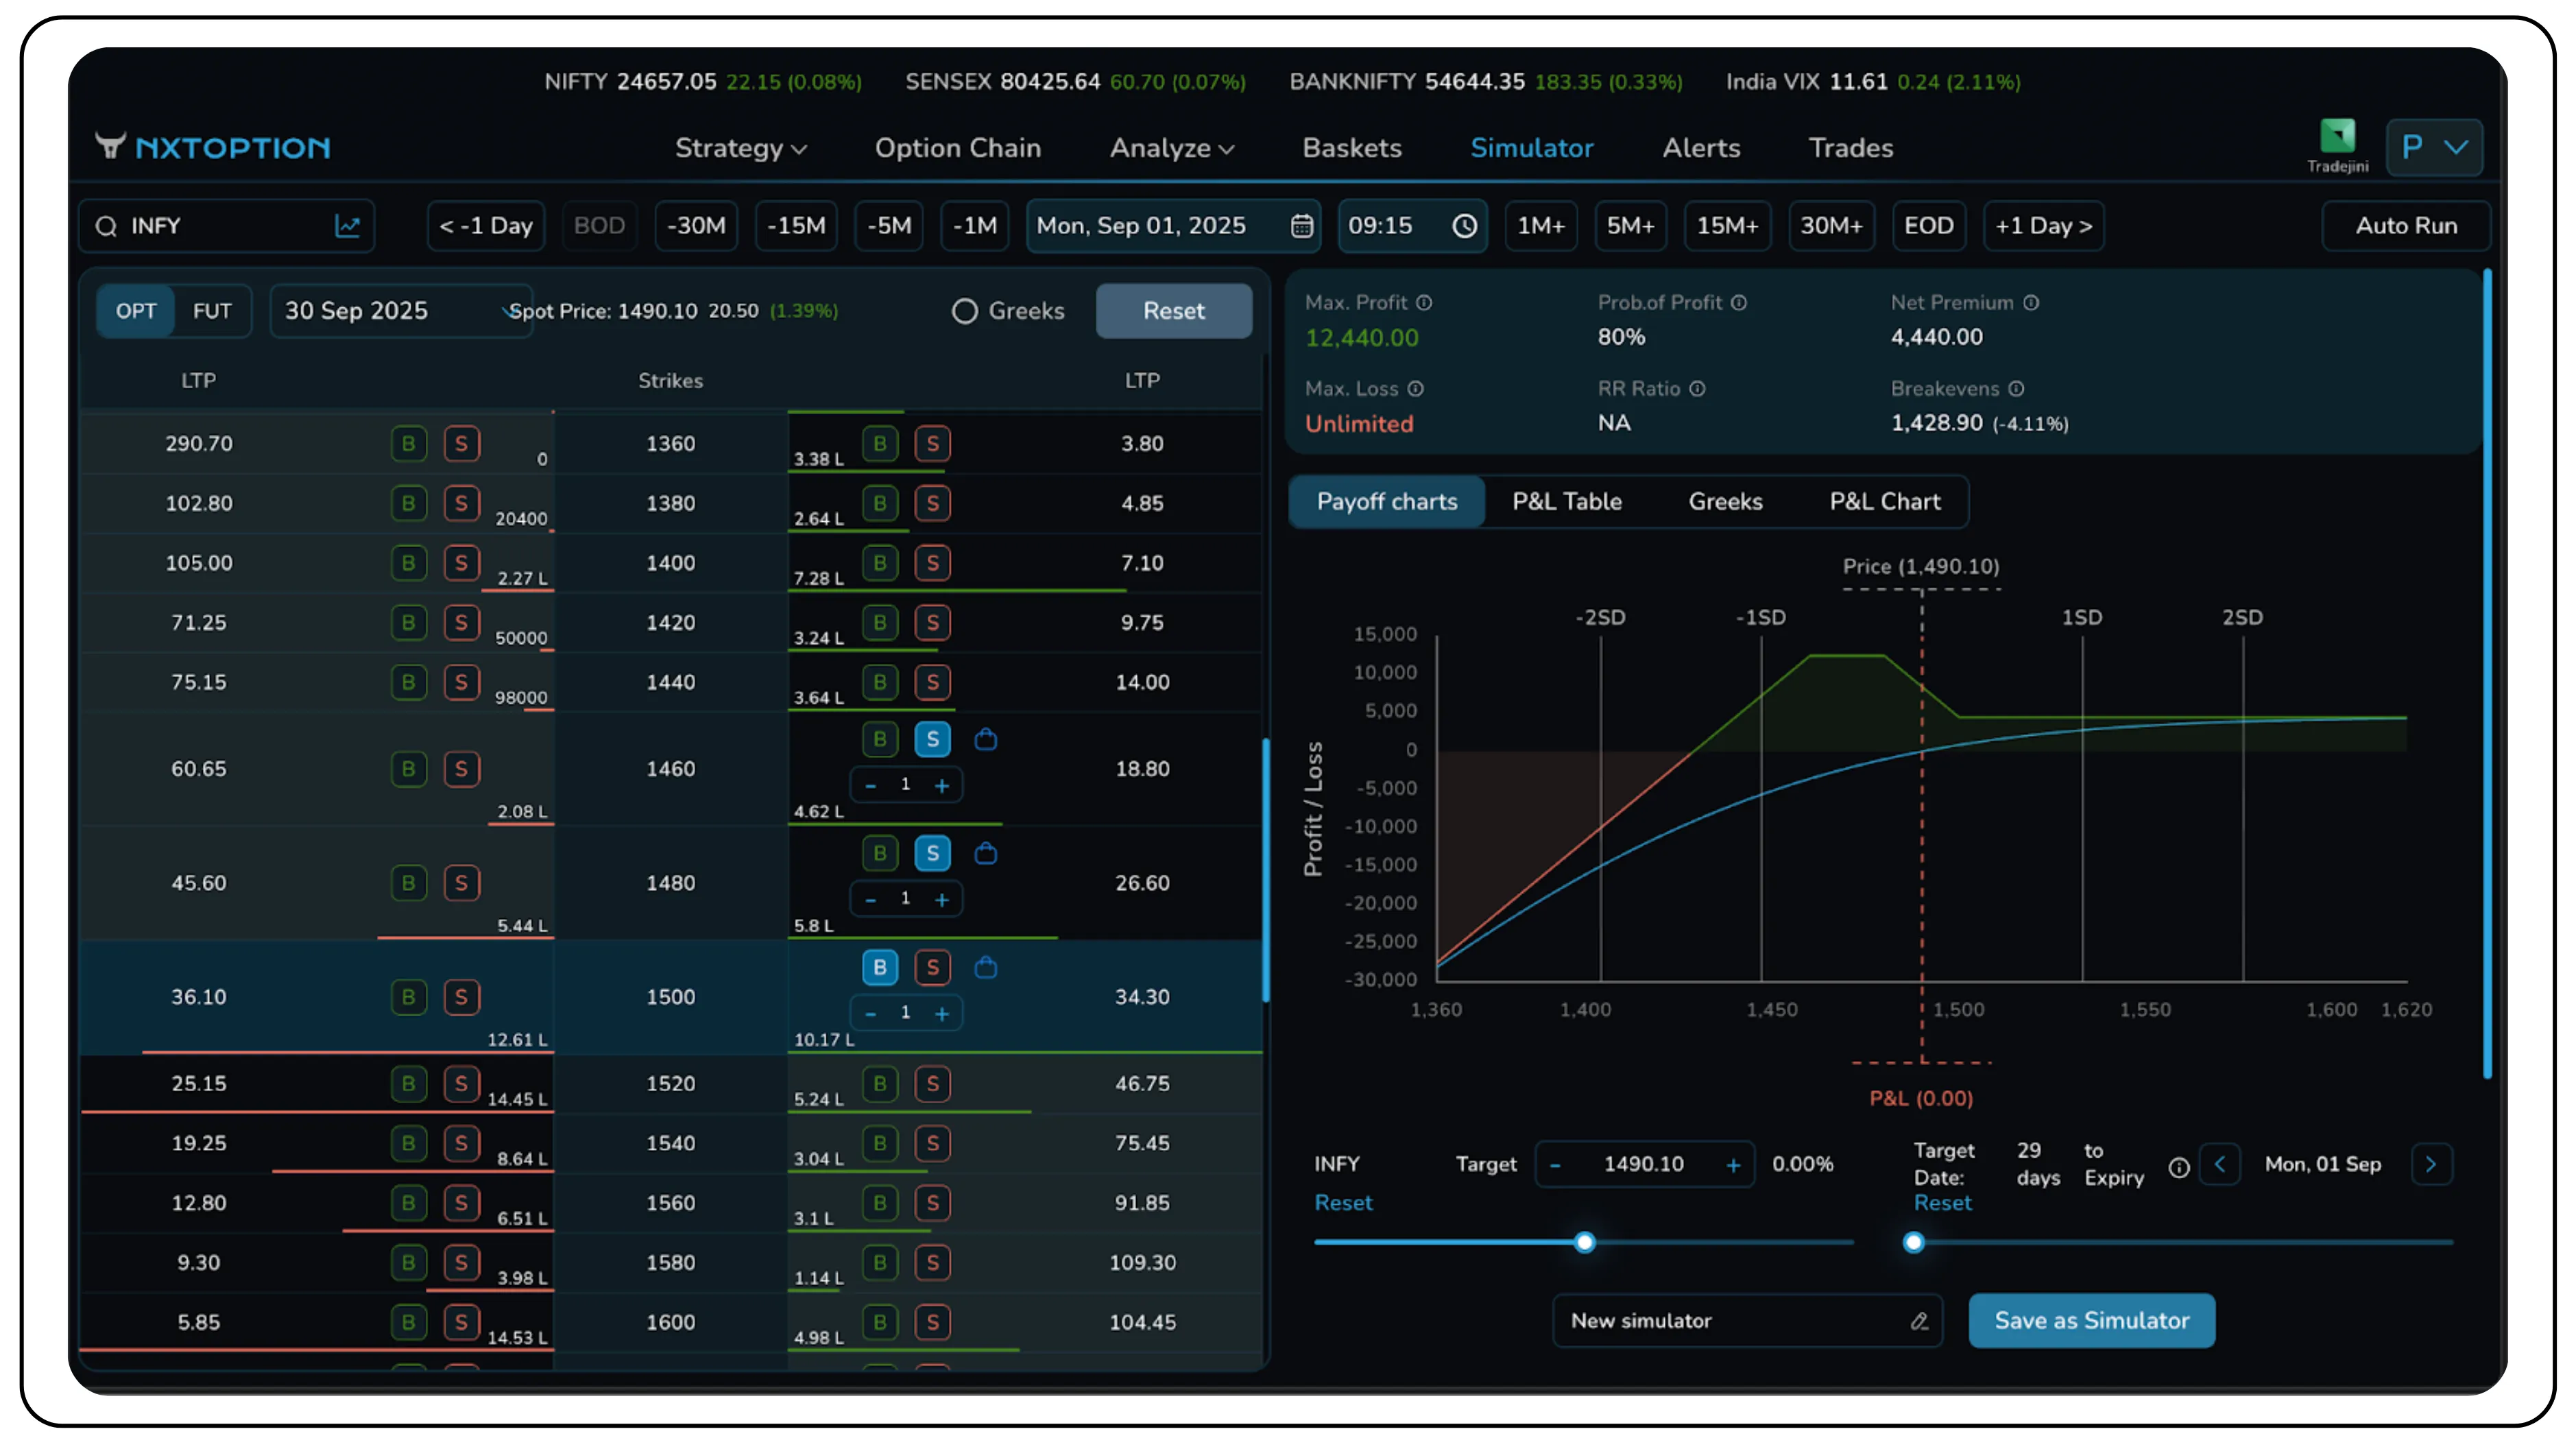
On September 1, 2025, a Bear Put Ladder was initiated on INFY, which was trading at ₹1,490. Legs of the strategy:
- Buy 1500 Put at ₹34.30
- Sell 1480 Put at ₹26.60
- Sell 1460 Put at ₹18.80
This position was established for a net credit of ₹4,440. The strategy is designed to be profitable if INFY remains above the breakeven point of ₹1428 at or near expiration, with the maximum profit of ₹12,440. Here, the maximum loss is unlimited due to the naked short put. The position becomes unprofitable when INFY falls below the ₹1,428 breakeven point, with losses accelerating as the price continues to fall.
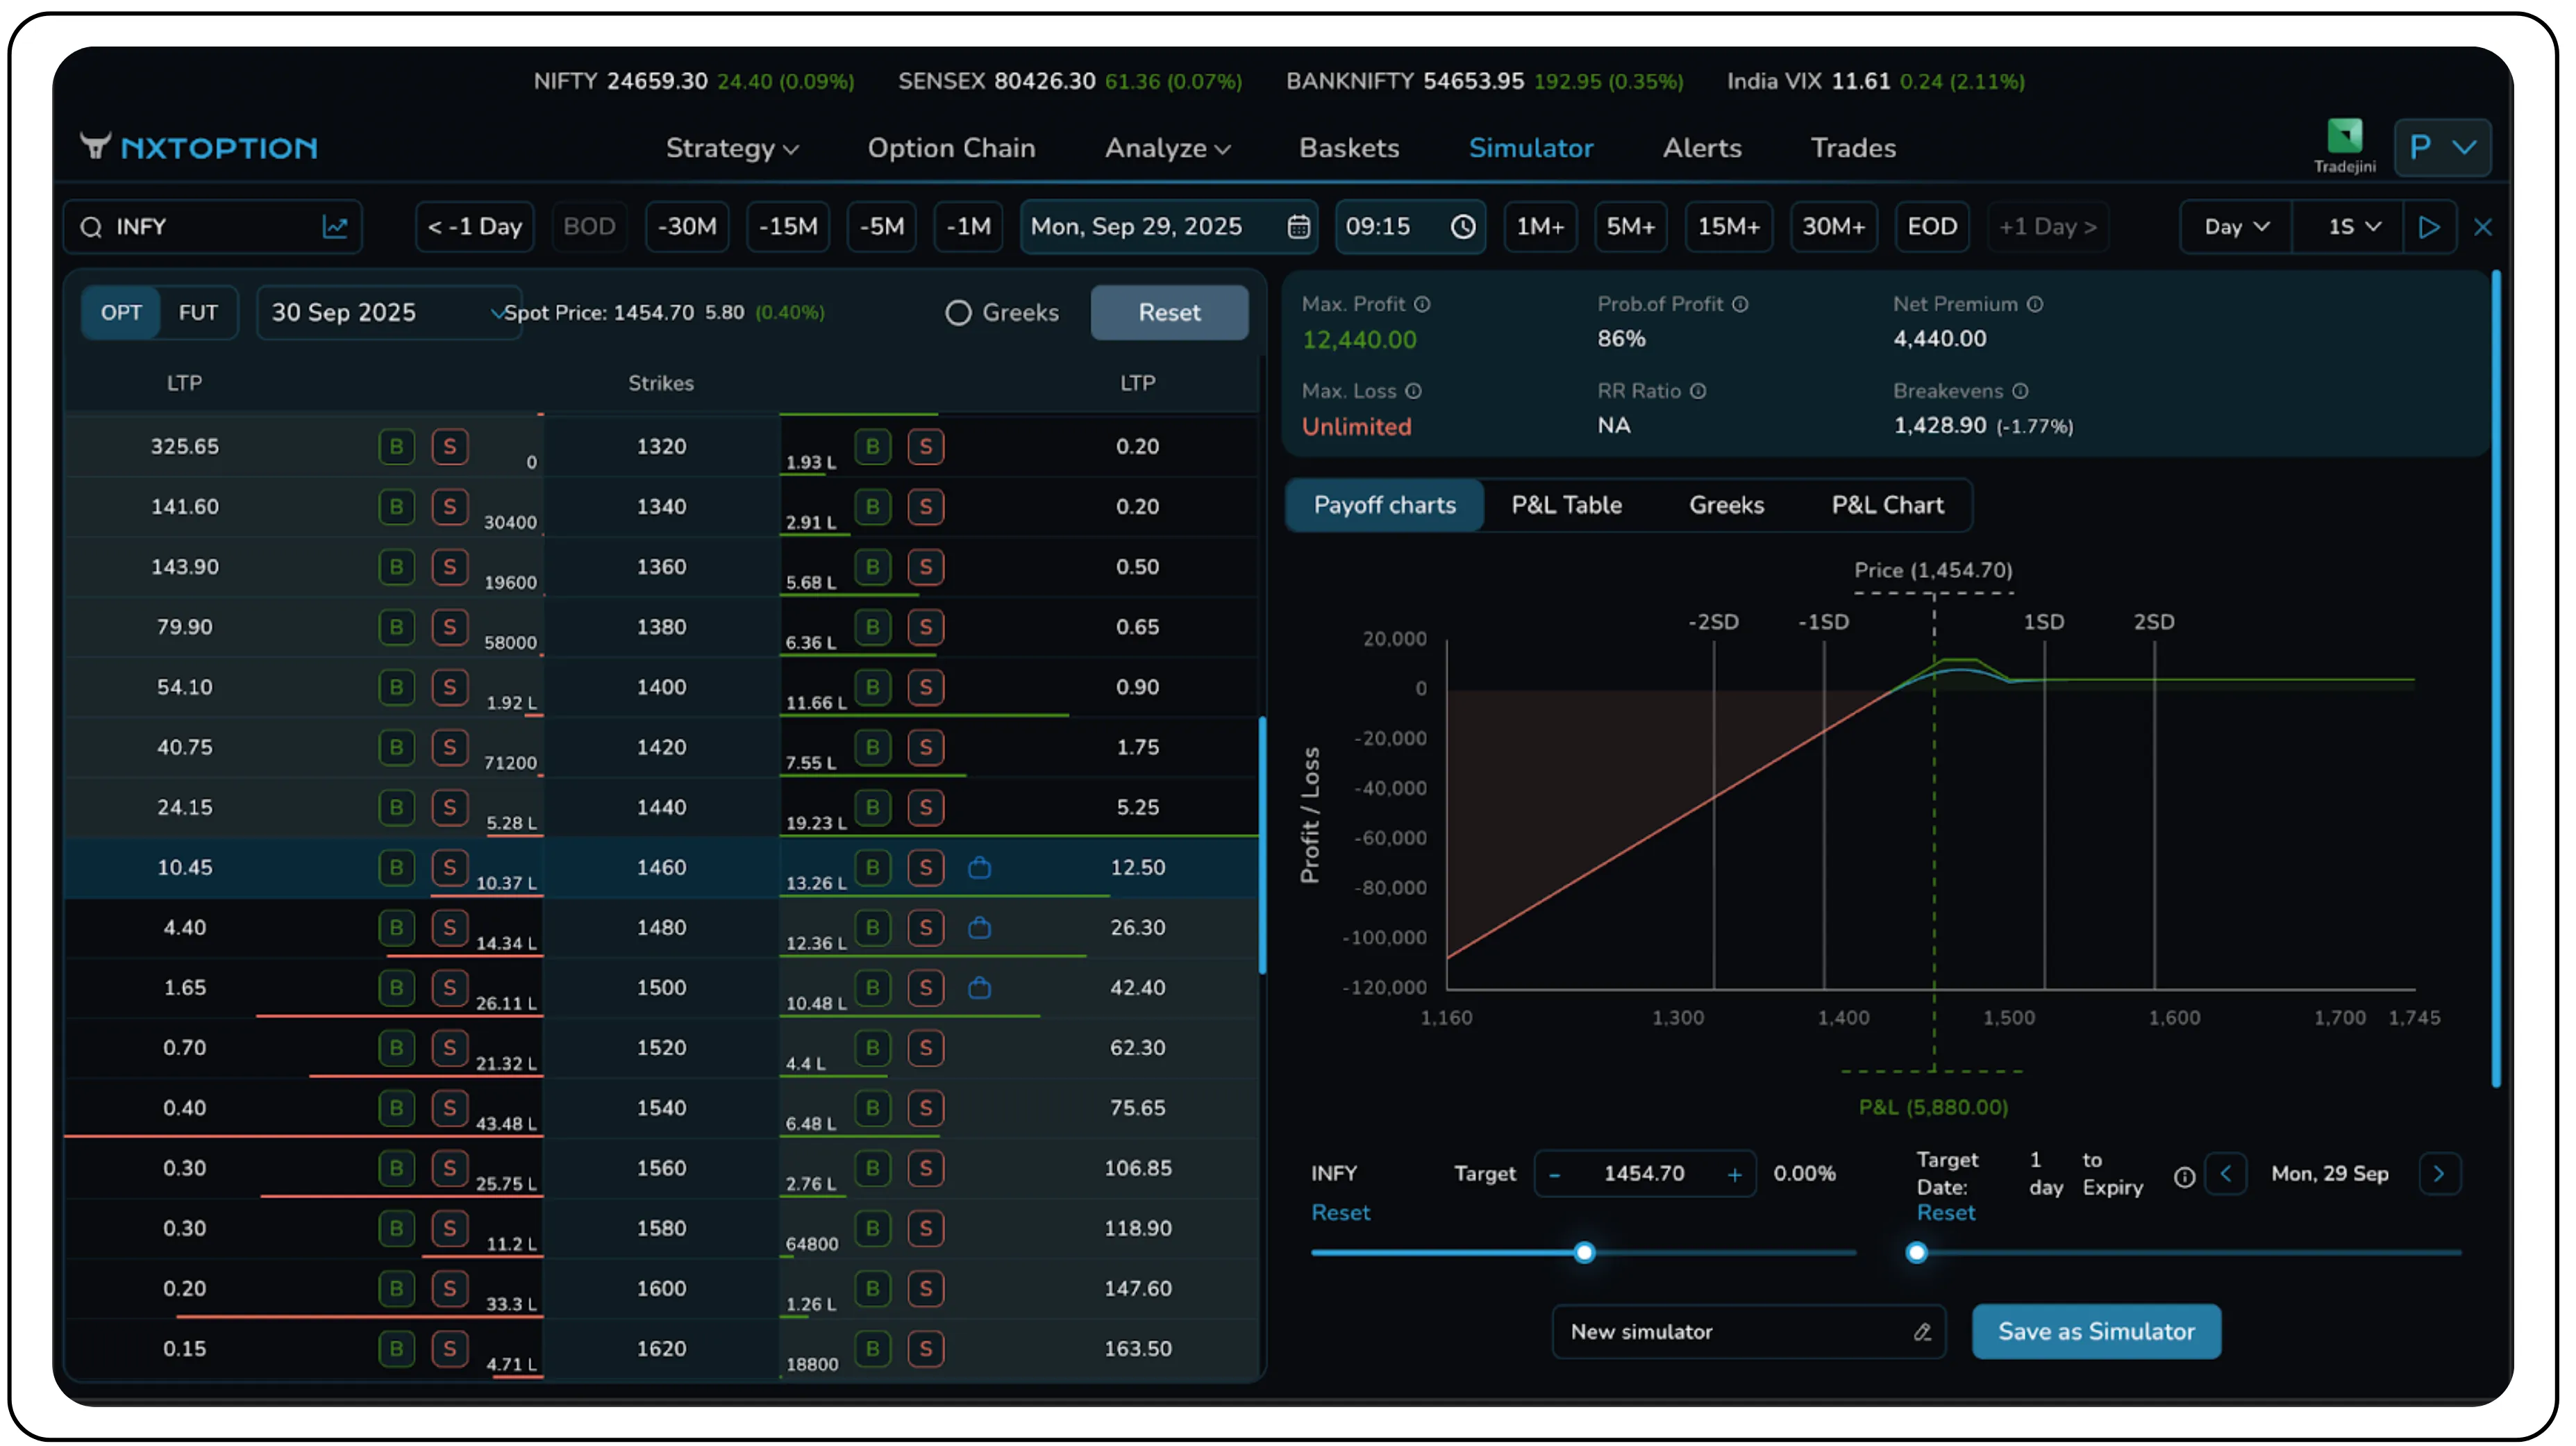
Nearing expiry, on 29th September, Infosys was trading at ₹1,454.70. Since this price was comfortably above the breakeven point of ₹1,428, the position was profitable, resulting in a net gain of ₹5,880. This was because the spot price settled just below the out-of-the-money (OTM) strike of ₹1,460.. In such a scenario, all legs of the strategy were profitable. The strategy performed as designed, capitalizing on the small downward move in the underlying stock.
Risk management
Effective put ladder risk management begins with understanding the naked put exposure inherent in the bear put ladder strategy and the negative theta impact in the bull put ladder strategy.
Bear Put Ladder
The main danger in a bear put ladder is a sudden and severe market crash. While the strategy profits from a controlled decline, once the price plummets far below the lowest OTM short put, losses can accelerate dramatically. Therefore, it is crucial to select OTM short strikes that are far enough to provide a buffer against sharp moves but close enough to generate a meaningful credit. Always define a stop-loss based on a technical level or a percentage of the premium received, and be ready to exit if the market shows signs of panic selling. You can also convert the position into a defined-risk spread by buying a further OTM put if the decline becomes more aggressive than expected. This effectively caps the otherwise unlimited downside losses. Therefore, the bear put ladder should only be used when you expect a gradual fade or range-bound action, not in a free-falling market.
Bull Put Ladder
The main danger in a bull put ladder is a slow, grinding decline that pins the underlying price at your long put strikes. While the strategy is designed for a massive, swift drop, if the stock instead bleeds down slowly, the position is exposed to its maximum loss. This occurs because the short put loses significant value while the long puts fail to gain enough value to compensate. Therefore, it is crucial to select your short strike at a strong technical level and ensure the long puts are spaced appropriately to manage this risk zone. Always define a stop-loss in case the price moves strongly against you or stagnates, causing time decay to erode your position. If the price stalls near your short strike, you can manage the trade by rolling the entire ladder down and out for a credit to a later expiration. This strategy should only be used when anticipating a sharp, high-momentum move, not in a slow-drifting market.
Greeks interpretation
Comprehensive put ladder Greeks analysis is essential for understanding how these strategies deliver asymmetric payoffs and how put spread expansion techniques can dynamically adjust positions, as detailed in the risk management section.
| Greek | Bear Put Ladder | Bull Put Ladder |
|---|---|---|
| Delta (Δ) | Has a slight negative delta, profiting from a moderate price decline. |
Typically has a slight positive delta at entry, giving it an initial bullish bias. |
| Theta (θ) | Theta-positive. As a net credit strategy, it profits from time decay. |
Theta-negative. As a net debit strategy, it loses value from time decay. |
| Gamma (Γ) | Negative gamma. Being net short an option, it is vulnerable to large, fast price drops. |
Positive gamma. Being net long an option, its profits accelerate during large, fast price drops. |
| Vega (ν) | Short volatility (negative vega). It profits when implied volatility goes down. |
Long volatility (positive vega). It profits when implied volatility goes up. |
Conclusion
Put ladders, in both their bearish and bullish sense, are sophisticated option strategies that provide a tactical way to express a market view beyond simple directional bets. As we have seen, they are not interchangeable; they are two distinct tools designed for fundamentally different market expectations and volatility environments.
The strategic value of put ladder strategies lies in their flexibility: traders can deploy the bear put ladder as a defined-risk income strategy, or the bull put ladder as a long volatility position for portfolio protection and convexity
The Bear Put Ladder is the trader’s choice for a market expected to fade or consolidate. It is a game of selling volatility, typically structured for net credit to profit from a steady decay of time and contracting volatility, often after a major market event. It rewards the trader who predicts a controlled, grinding decline or outright stability, turning a calming market into a source of income.
In stark contrast, the Bull Put Ladder is built for convexity and market shocks. This strategy is uniquely structured to provide a complete bearish exposure. It thrives on expanding volatility and accelerates its gains during sharp downward price swings, making it an excellent tool for traders looking to hedge a portfolio or position for a black swan event.
Ultimately, the choice between these strategies hinges on the trader’s answers to two questions: Are they betting on stability and volatility contraction, or are they positioning for momentum and volatility expansion? Do they want time decay to be an ally that earns a premium, or are they willing to pay a premium to bet on a major market dislocation?
Understanding the Greek profile of your chosen ladder is non-negotiable. These are not passive strategies; the presence of a naked option leg in the bear put ladder demands active risk management and a clear exit plan. When used correctly, however, put ladders provide a powerful and versatile method for generating asymmetric returns in a wide range of market scenarios.
Disclaimer: The information provided in our blogs is for informational purposes only and should not be construed as financial, investment, or trading advice. Trading and investing in the securities market carries risk. Always conduct your own research and consult with a qualified financial advisor before making any investment decisions. Past performance is not indicative of future results. Copyrighted and original content for your trading and investing needs.
© 2025 — Tradejini. All Rights Reserved.