Chop Zone is a colour strip under your chart that tells you one thing: is the price moving in a clear direction, or going sideways? Blue and green bars mean an uptrend, red and orange bars mean a downtrend, and yellow means the market has no clear direction. On Tradejini CubePlus you can add it to any chart in a few clicks.
Most trading strategies work well in only one type of market. A breakout or trend-following strategy makes money when prices move steadily in one direction, and loses small amounts again and again when prices go sideways. Traders call that sideways, back-and-forth phase "chop". The hard part is knowing which kind of market you are in today.
This guide explains what Chop Zone measures, how to add it on CubePlus, how to read it with two real charts (Mahindra & Mahindra and Power Grid), when it helps, when it misleads, and a few advanced ways to use it.
What Chop Zone measures
Chop Zone measures how steeply a 34-period moving average is rising or falling, and shows the answer as a colour. It does not predict anything. It only tells you the direction and steepness of the recent trend.
In plain words, it does three things on every bar:
- It draws a 34-period EMA (exponential moving average). This is an average of the last 34 closing prices that gives more weight to recent prices. On a daily chart, that is roughly the last seven weeks of trading.
- It measures the angle of that average from the previous bar to this one. A line climbing steeply has a large positive angle. A flat line has an angle near zero.
- It colours the bar according to that angle.
The angle is scaled using the high and low of the last 30 bars, so the same indicator works on a ₹100 stock and a ₹10,000 stock. Every bar in the strip is the same height. All the information is in the colour.
| Colour | Angle of the 34 EMA | What it tells you |
|---|---|---|
| Turquoise (light blue) | +5° or more | Strong uptrend: the average is rising steeply |
| Dark green | +3.57° to +5° | Uptrend, a little less steep |
| Pale green | +2.14° to +3.57° | Uptrend losing steepness |
| Lime | +0.71° to +2.14° | Weak rise, close to flat |
| Yellow | Between −0.71° and +0.71° | Flat: no clear direction. This is the "chop" |
| Light orange | −0.71° to −2.14° | Weak fall, close to flat |
| Orange | −2.14° to −3.57° | Downtrend losing steepness |
| Red | −3.57° to −5° | Downtrend |
| Dark red | −5° or less | Strong downtrend: the average is falling steeply |
A simple way to remember it: the cooler the colour (blue, green), the stronger the rise; the warmer the colour (orange, red), the stronger the fall; yellow sits in the middle and means "no direction".
Chop Zone is different from the Choppiness Index, which appears just above it in the CubePlus indicator list. The Choppiness Index gives a number from 0 to 100 that says how trendy or sideways the market is, but not which way. Chop Zone tells you both whether there is a trend and its direction.
How to add Chop Zone on Tradejini CubePlus
You can add Chop Zone to any chart on CubePlus in under a minute.
- Open the chart of the stock or index you want (for example, M&M) in CubePlus.
- Pick your timeframe from the toolbar: D for daily, or weekly if you hold positions for months.
- Click the fx (Indicators) button in the top toolbar.
- Type chop in the search box. Two results appear: Choppiness Index and Chop Zone.
- Click Chop Zone. A colour strip appears in a new panel below the price chart.
- Optional: click the star next to it to save it to your favourites, and keep Auto Save Layout ticked so it loads the next time you open a chart.
Chop Zone has no length or level settings to change. The 34-period average, the 30-bar range and the colour levels are fixed. In the indicator's settings you can only change how it looks, such as the colours.
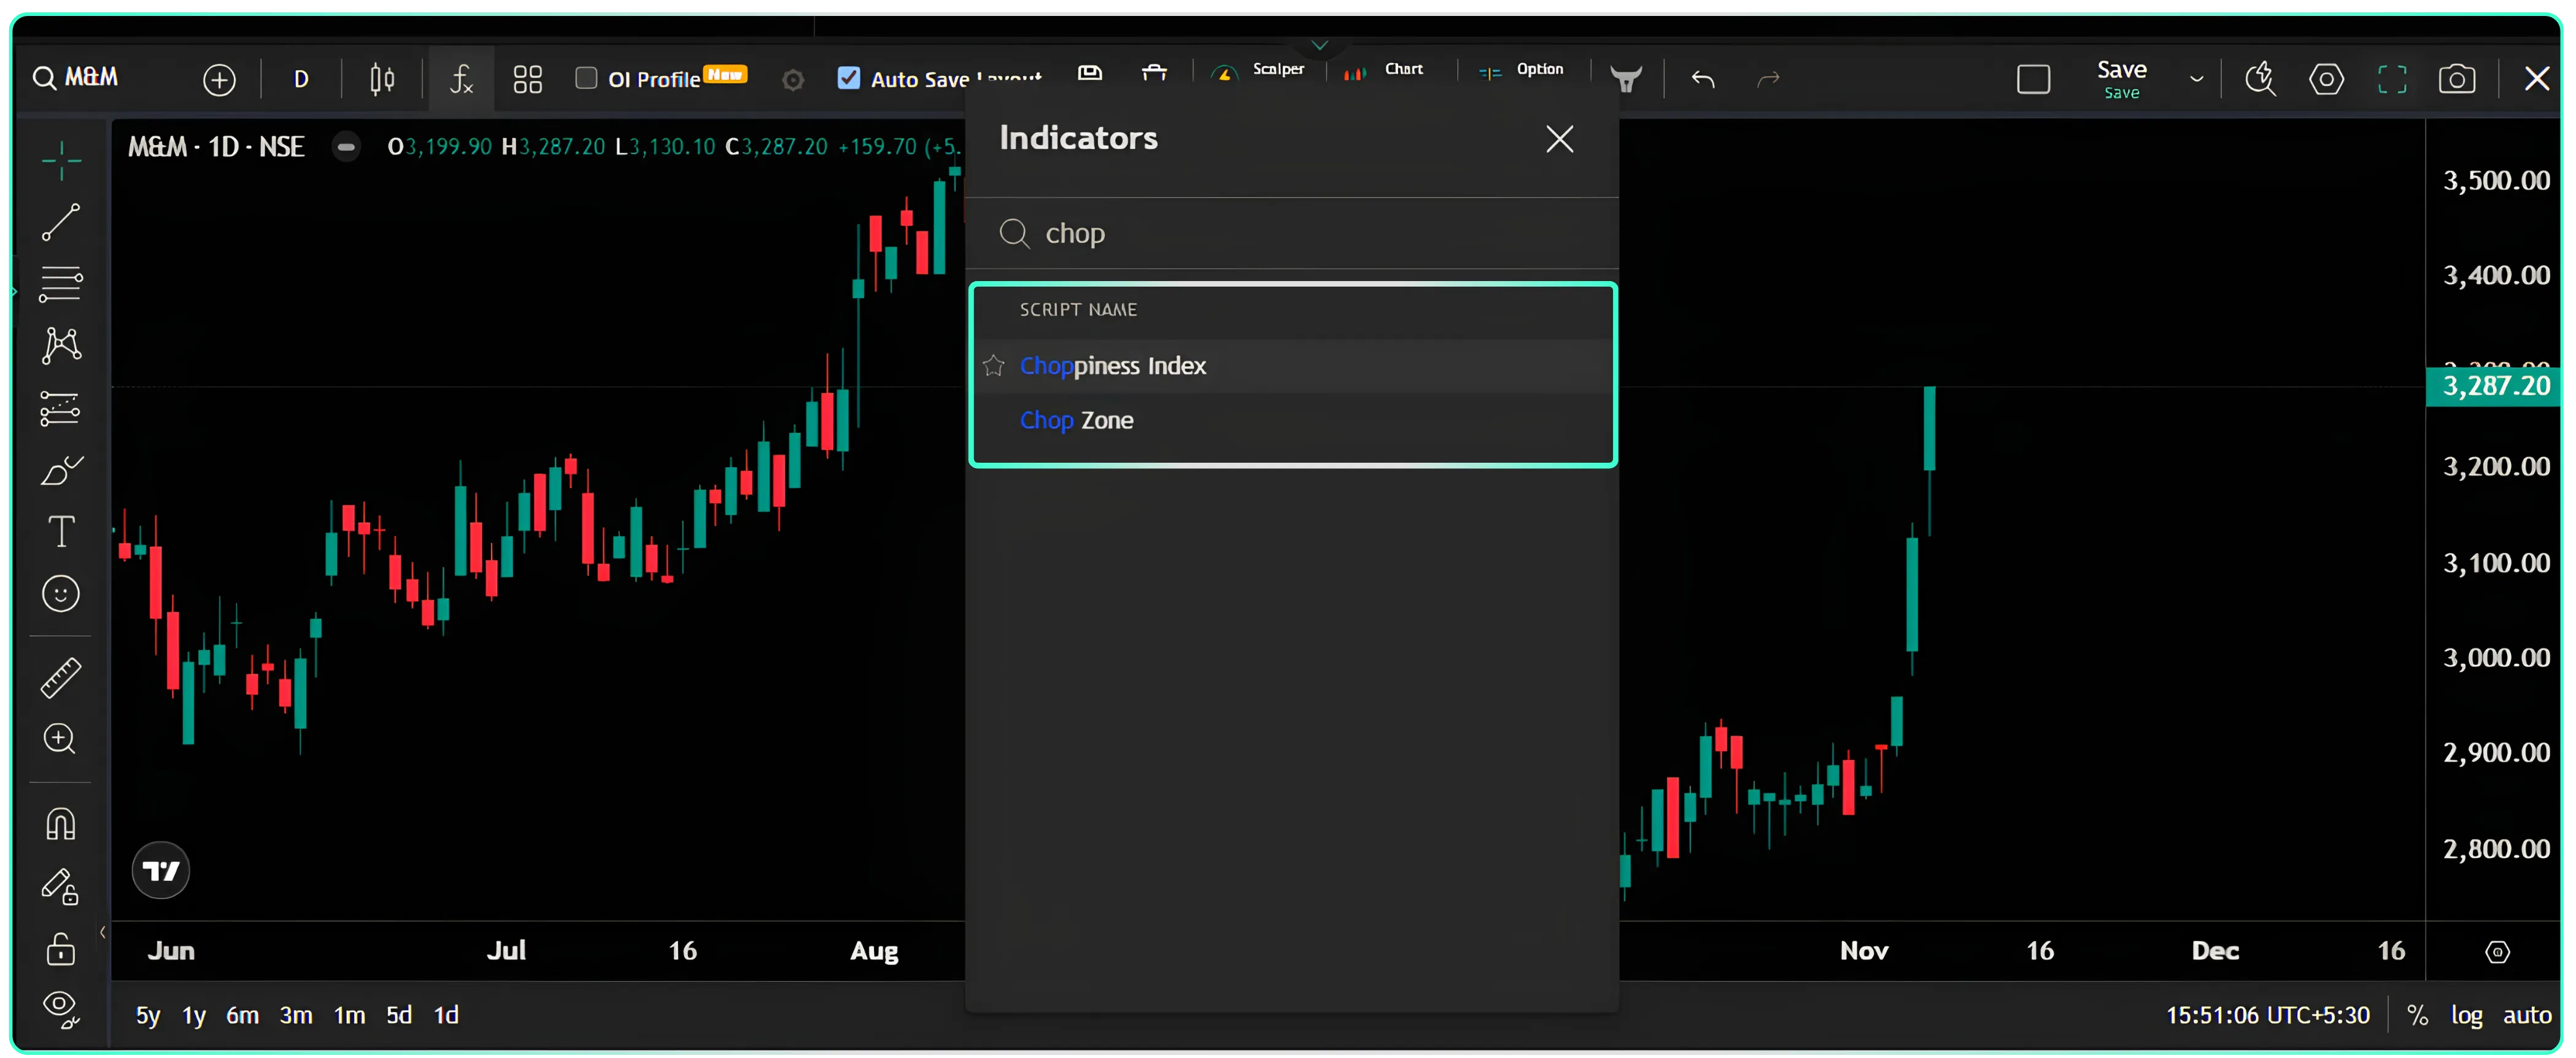
Caption: Search "chop" in the CubePlus Indicators panel and pick Chop Zone. Alt text: Tradejini CubePlus chart with the Indicators search panel open, listing Choppiness Index and Chop Zone.
How to read it: two real charts
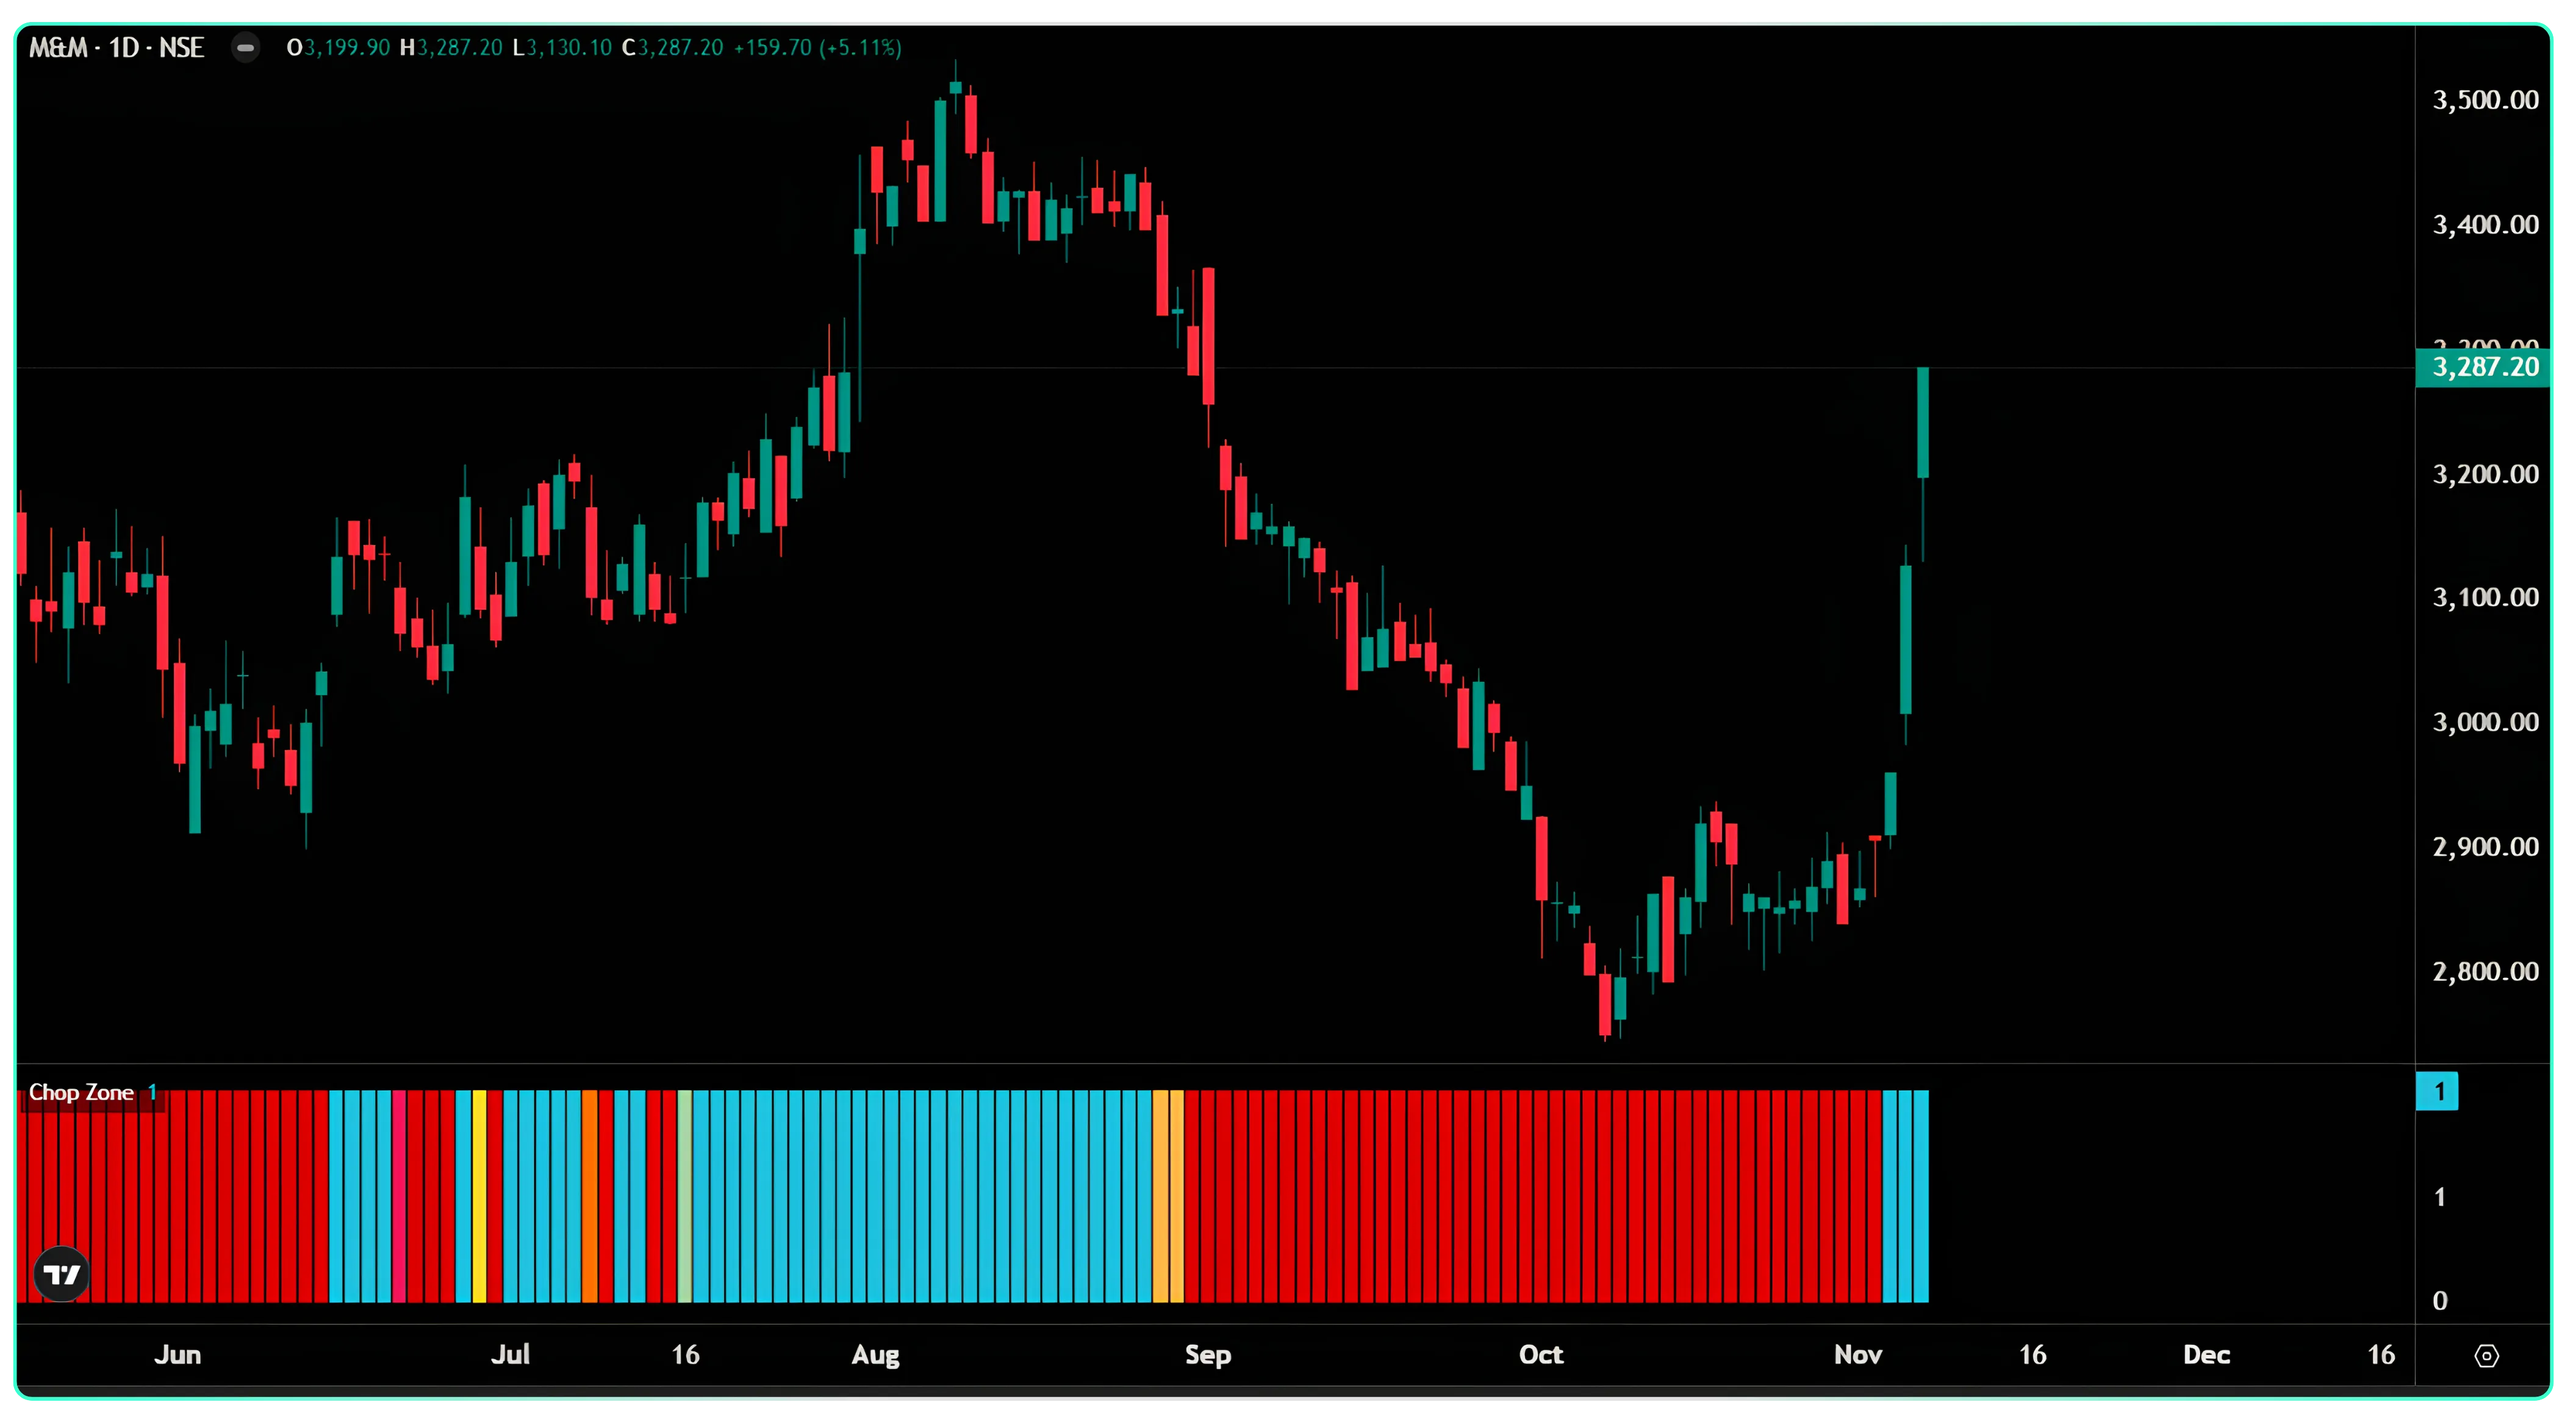
The best way to learn Chop Zone is to look at how the colours lined up with price. Here are two charts from CubePlus: Mahindra & Mahindra on a daily chart and Power Grid on a weekly chart. They show where it was useful, and where it was late.
Example 1: M&M, daily chart (June to November 2026)
| Period | What price did | What Chop Zone showed |
|---|---|---|
| June | Drifted lower from about ₹3,150 to ₹2,900 | Mostly red |
| Late June to mid-August | Climbed from about ₹3,000 to a peak near ₹3,530 | Turned turquoise and stayed turquoise |
| Late August | Stalled between ₹3,380 and ₹3,450 | Still turquoise, then a couple of orange bars |
| September to mid-October | Fell from about ₹3,400 to near ₹2,750 | Red throughout |
| Mid-October to early November | Moved sideways between ₹2,800 and ₹2,920 | Still red |
| Early November | Jumped to ₹3,287, including a 5.1% gain on the last day | Turned turquoise |
What this chart teaches:
- It caught both big moves. A trader who only bought while the strip was turquoise was in for most of the July–August rally. A trader who stayed away while it was red avoided most of the September fall.
- It was late at both turns. After the August peak, price had already fallen to around ₹3,330 before the strip turned red. At the October bottom, the strip stayed red for about a month while price was flat, and turned turquoise only after price had already moved about 5% off the base.
- It did not show the sideways phase as yellow. In late October the price was going nowhere, but the strip stayed red. This is because the 34-period average was still pointing down from the September fall. Chop Zone follows the average, not the latest candles.
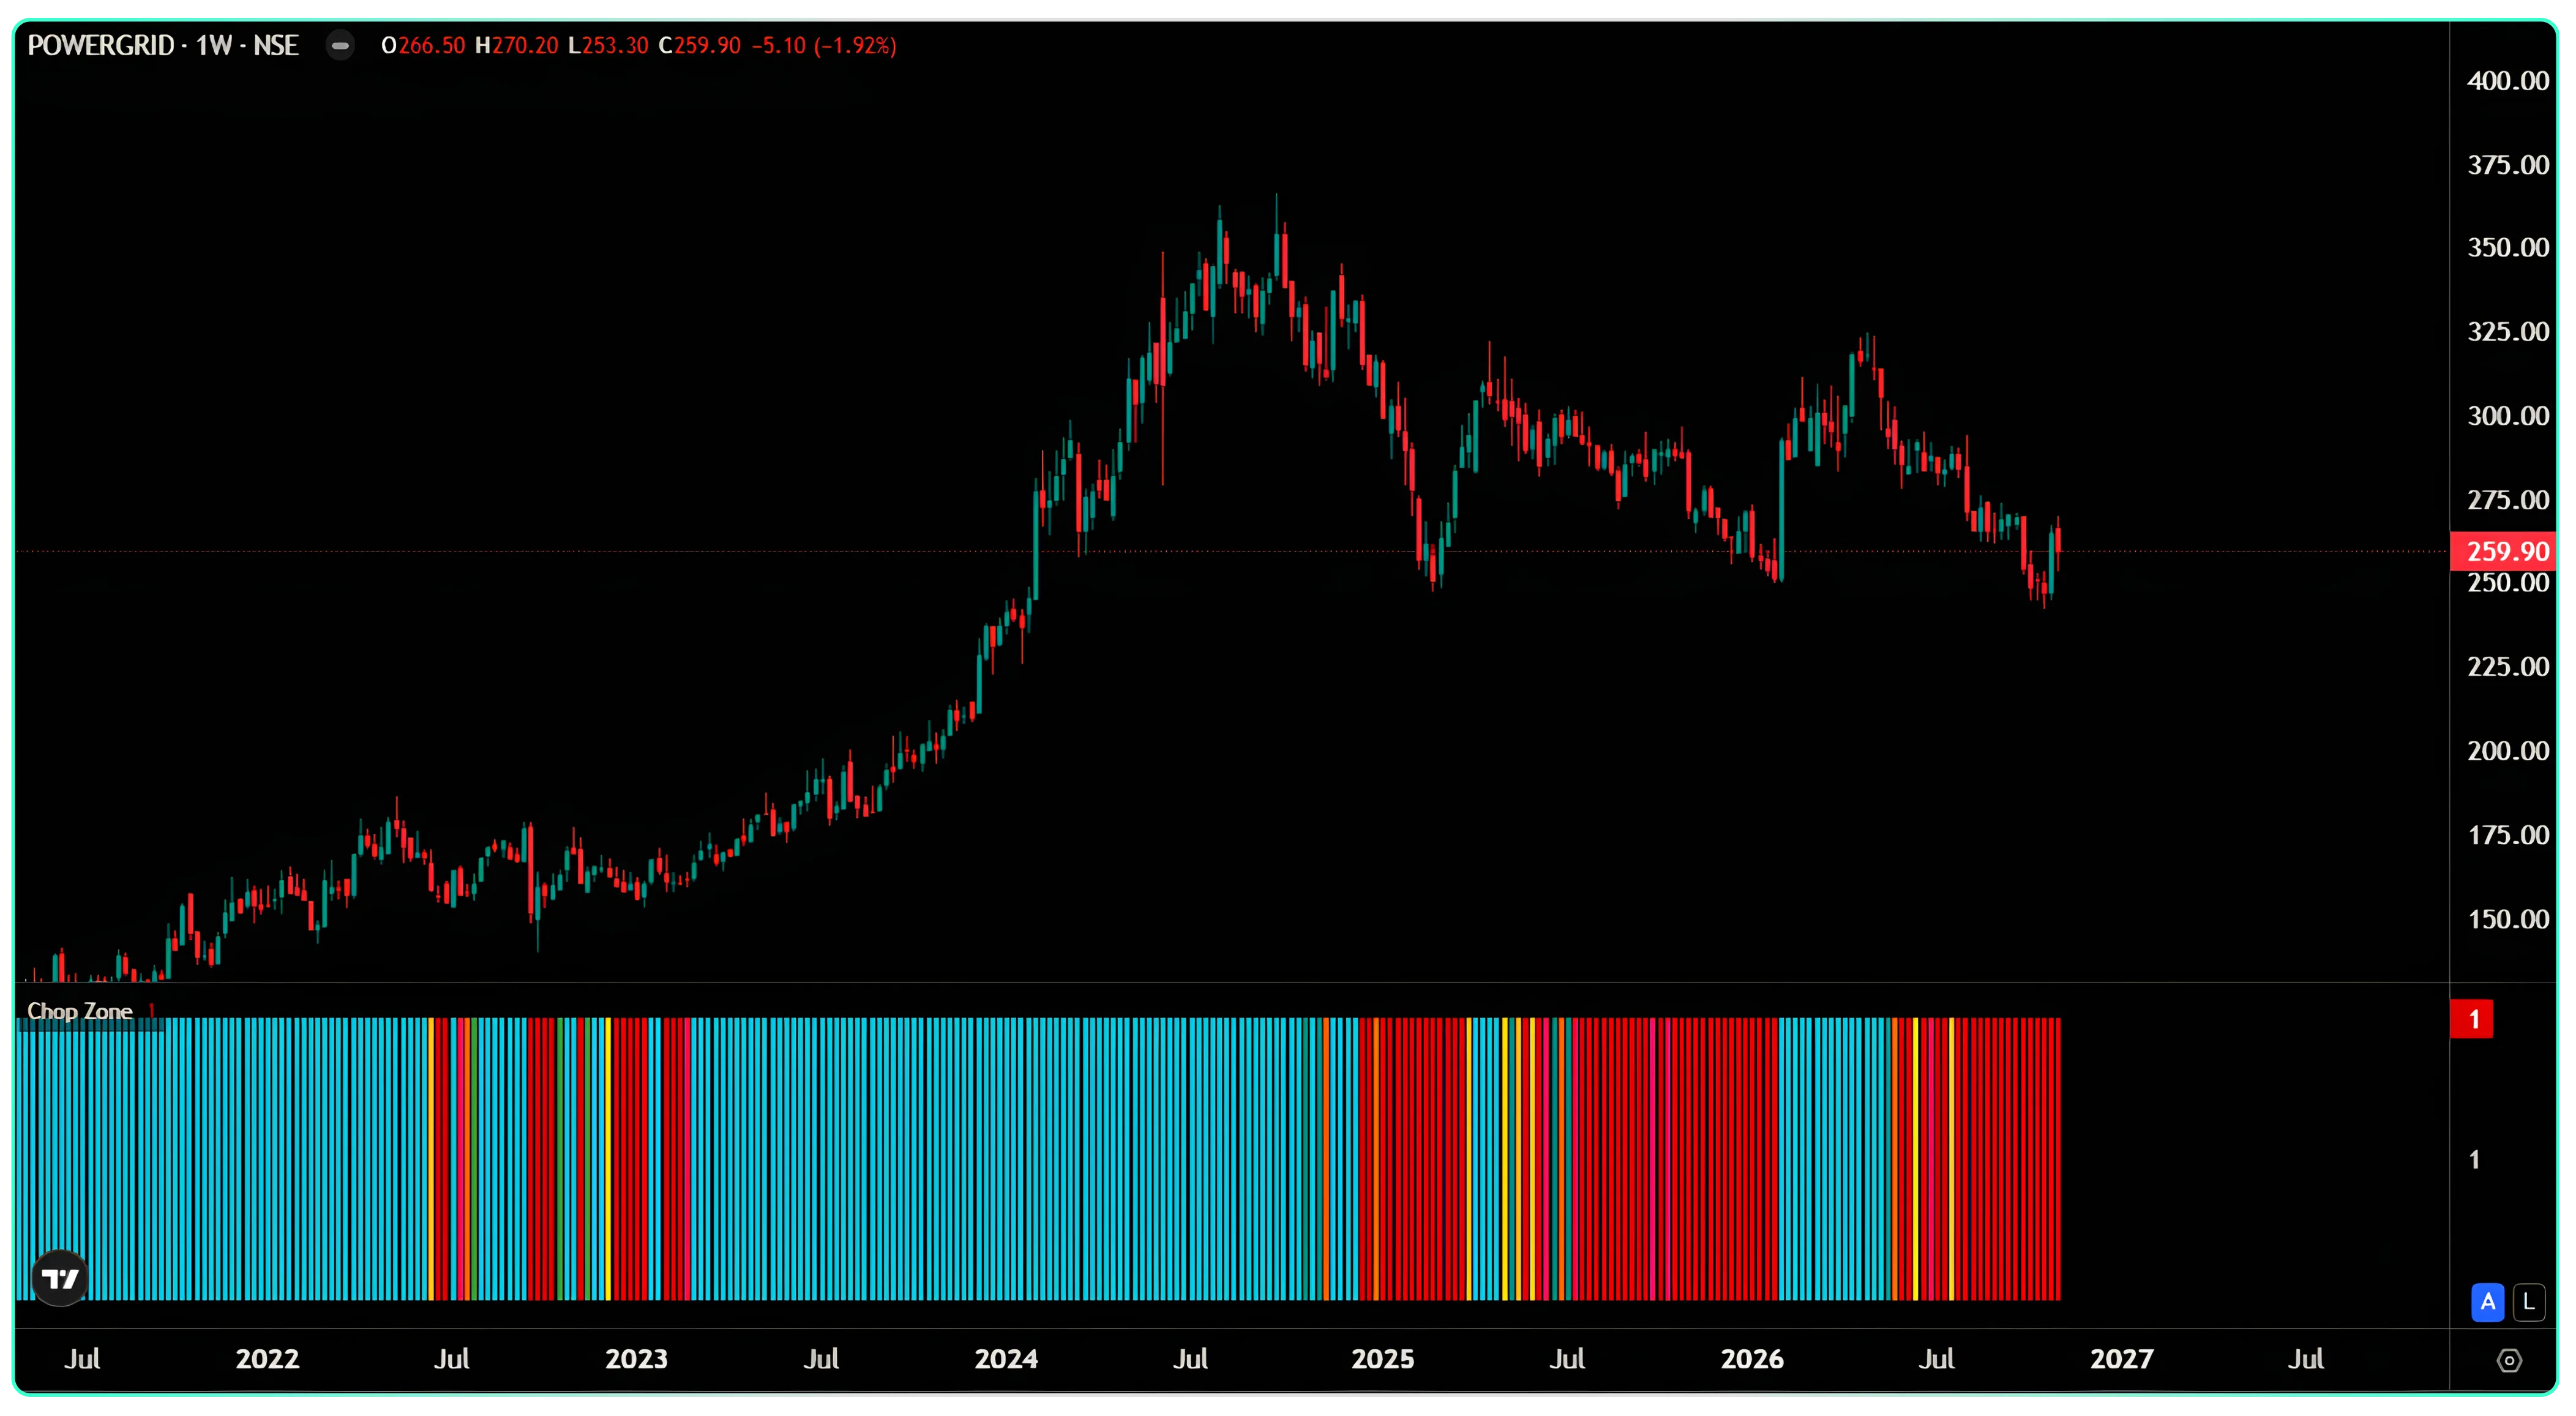
Example 2: Power Grid, weekly chart (2022 to November 2026)
| Period | What price did | What Chop Zone showed |
|---|---|---|
| 2022 to mid-2024 | Rose steadily from about ₹140 to about ₹365 | Almost all turquoise |
| Late 2024 to early 2025 | Fell from the peak to about ₹250 | Mostly red |
| 2025 to late 2026 | Moved in a wide range between about ₹250 and ₹330 | Switched between red and turquoise several times |
| November 2026 | Near ₹260 | Red |
What this chart teaches:
In a long, steady trend, the weekly strip is very helpful. For about two years the strip barely changed colour. It kept a long-term holder in the trade and away from selling on small dips.
In a range, it switches colour late and often. From 2025 onwards each colour change came after price had already moved a good part of the way across the range. A trader buying every turquoise flip and selling every red flip would have bought high and sold low several times.
Four ways traders use Chop Zone
Chop Zone works best as a filter: it tells you which kind of trade to look for, and your other tools tell you exactly when to enter. Here are four common uses.
1. As a trend filter: trade only in the direction of the colour
- Strip is turquoise or green: look only for buying setups, such as a breakout above a recent high or a bounce from support.
- Strip is red or orange: look only for selling setups, or simply stay out if you only buy.
- Strip is yellow or keeps changing colour: skip trend trades.
This one rule removes many trades that fight the main direction.
2. For timing an entry: wait for the colour to settle
A single turquoise bar after a long red phase is often a false start. Many traders wait for two or three bars of the same colour in a row before acting. You enter a little later, but you avoid many one-day flips. On the M&M chart, the first turquoise bar in November came on a big up day, and the next bars confirmed it.
3. For managing an open trade: watch the colour fade
The colour usually weakens before it flips. In an uptrend, a change from turquoise to dark green, pale green or lime tells you the rise is slowing. You can use this as a cue to tighten your stop-loss or book part of the profit, rather than waiting for the strip to turn red.
4. For staying out: no colour, no trade
When the strip shows yellow, or switches between red and green every few bars, the market has no clear direction. For a trend trader, the best trade in this phase is often no trade. Range traders (who buy near support and sell near resistance) prefer exactly these phases.
When Chop Zone works and when it fails
Chop Zone works when the market moves in long, steady swings, and fails when price moves sideways or reverses suddenly. Because it is built on a 34-period average, it always reacts after the price, never before.
| Situation | How Chop Zone behaves | What to do |
|---|---|---|
| Long, steady trend (Power Grid 2022–24, M&M July–August) | Stays one colour for weeks or months | Trust it: stay with the trend and ignore small dips |
| Trend on a higher timeframe (weekly), entries on a lower one (daily) | Weekly strip gives a stable direction | Use the weekly colour as the main filter |
| Liquid large-cap stocks and indices | Colours are steadier | Good place to start |
| Sideways range lasting months (Power Grid 2025–26) | Flips between red and turquoise, late each time | Do not trade every flip; mark the range on the price chart instead |
| Flat phase right after a big move (M&M late October) | Stays red or turquoise even though price is flat | Look at the candles, not only the strip |
| Sudden reversal on news or results (M&M early November) | Changes colour only after a large part of the move is done | Accept that you will miss the first part |
| Gap-up or gap-down openings | The jump enters the average late, so colour lags | Do not chase; wait for the colour to settle |
| Low-volume, illiquid stocks | Erratic colours | Avoid, or use a higher timeframe |
| Very short intraday charts (1–5 minutes) | Many colour changes from normal noise | Use with care; confirm on 15-minute or hourly |
The simplest summary: Chop Zone is good at keeping you in a trend, and slow at telling you a trend has started or ended.
Advanced uses of Chop Zone
Once you are comfortable with the basic colours, these ideas help you get more out of the strip.
1. Why you mostly see only blue and red
On most daily stock charts the strip is almost all turquoise or dark red, with few in-between colours. This is how the indicator is built. The 34-period average only has to move about one-third of one percent of the last 30 bars' high-low range in a single bar to count as a strong trend. For M&M, with a 30-day range of about 400 points, that is a move of roughly ₹1.5 a day in the average.
Two things follow:
- When you do see green, lime, orange or yellow, pay attention. It means the average has nearly flattened, which is rare.
- A turquoise or red strip only means the average is clearly sloping. It does not mean the move is large or strong.
2. Use two timeframes together
Check the weekly strip first for the main direction, then use the daily strip to time entries.
| Weekly colour | Daily colour | How to read it |
|---|---|---|
| Turquoise | Turquoise | Both agree: the cleanest setup for buying |
| Turquoise | Red | A dip inside a larger uptrend: wait for the daily to turn back |
| Red | Turquoise | A bounce inside a larger downtrend: be careful buying |
| Red | Red | Both agree on a downtrend: avoid buying |
| Flipping | Any | The larger trend is unclear: reduce position size or stay out |
There are no settings to make Chop Zone faster or slower on CubePlus. To change its speed, change the timeframe instead. An hourly chart reacts faster than a daily one, and a weekly chart is slower and steadier.
3. Pair it with the Choppiness Index
Add both indicators from the same "chop" search. The Choppiness Index runs from 0 to 100. Readings above about 61.8 usually mean a sideways market; readings below about 38.2 usually mean a trending one.
- Choppiness Index low and Chop Zone turquoise: a clear uptrend, confirmed twice.
- Choppiness Index high while Chop Zone stays red or turquoise: the average is still sloping, but price has gone sideways. This helps spot the late-October M&M situation, where Chop Zone alone stayed red.
- Choppiness Index high and Chop Zone flipping colours: a range. Skip trend trades.
4. Confirm with price and volume
Chop Zone says nothing about where to enter or where to place a stop. Use it alongside:
- Support and resistance: buy breakouts above resistance only when the strip is turquoise.
- Volume: a colour change on a day of high volume is more reliable than one on a quiet day.
- A stop-loss based on price, such as below the last swing low, not on the colour alone.
5. Notice how long a colour has lasted
The first colour change after a very long run, such as Power Grid's two-year turquoise phase, matters more than a change after a few bars. A long run that ends often marks a shift from trending to sideways or the start of a reversal.
Common mistakes to avoid
- Treating a colour change as a buy or sell signal on its own. It is a filter. Your entry, stop-loss and target should come from price levels.
- Acting on the first bar of a new colour. Wait for two or three bars to confirm.
- Expecting it to call tops and bottoms. It is built on a 34-period average, so it is always late at turning points.
- Using it on illiquid stocks or very short timeframes where normal noise keeps changing the colour.
- Ignoring the price chart. In the M&M example the strip stayed red while price had already gone flat. The candles told the story first.
A quick checklist before you trade
- ☐ Weekly strip: is the main direction clear?
- ☐ Daily strip: does it agree with the weekly?
- ☐ Has the colour held for at least two or three bars?
- ☐ Is price breaking a clear level (support or resistance) in the same direction?
- ☐ Is volume higher than usual on the move?
- ☐ Is the stop-loss set from price, and is the position size sized to that stop?
This article is for education only and is not investment advice. The stocks mentioned are used as examples, not recommendations. Trading involves risk; please do your own research or consult a registered adviser before trading.
Disclaimer: The information provided in our blogs is for informational purposes only and should not be construed as financial, investment, or trading advice. Trading and investing in the securities market carries risk. Always conduct your own research and consult with a qualified financial advisor before making any investment decisions. Past performance is not indicative of future results. Copyrighted and original content for your trading and investing needs.
© 2026 — Tradejini. All Rights Reserved.