In our earlier article, we covered how a line-break chart is built. A new line is added only when the price closes beyond the last line, and in a three-line break chart the trend reverses only when the close breaks past the last three lines.
This article takes the next step. Because every line follows a fixed rule, groups of lines form patterns that can be read the same way every time. Below are the main line-break patterns and what each one tells a trader.
Change of Line (COL)
A Change of Line is the most basic line-break pattern. It is simply the point where the colour of the lines changes.
• Bullish Change of Line: after a run of bearish lines, the price closes above the high of the last three lines and a bullish line appears. • Bearish Change of Line: after a run of bullish lines, the price closes below the low of the last three lines and a bearish line appears.
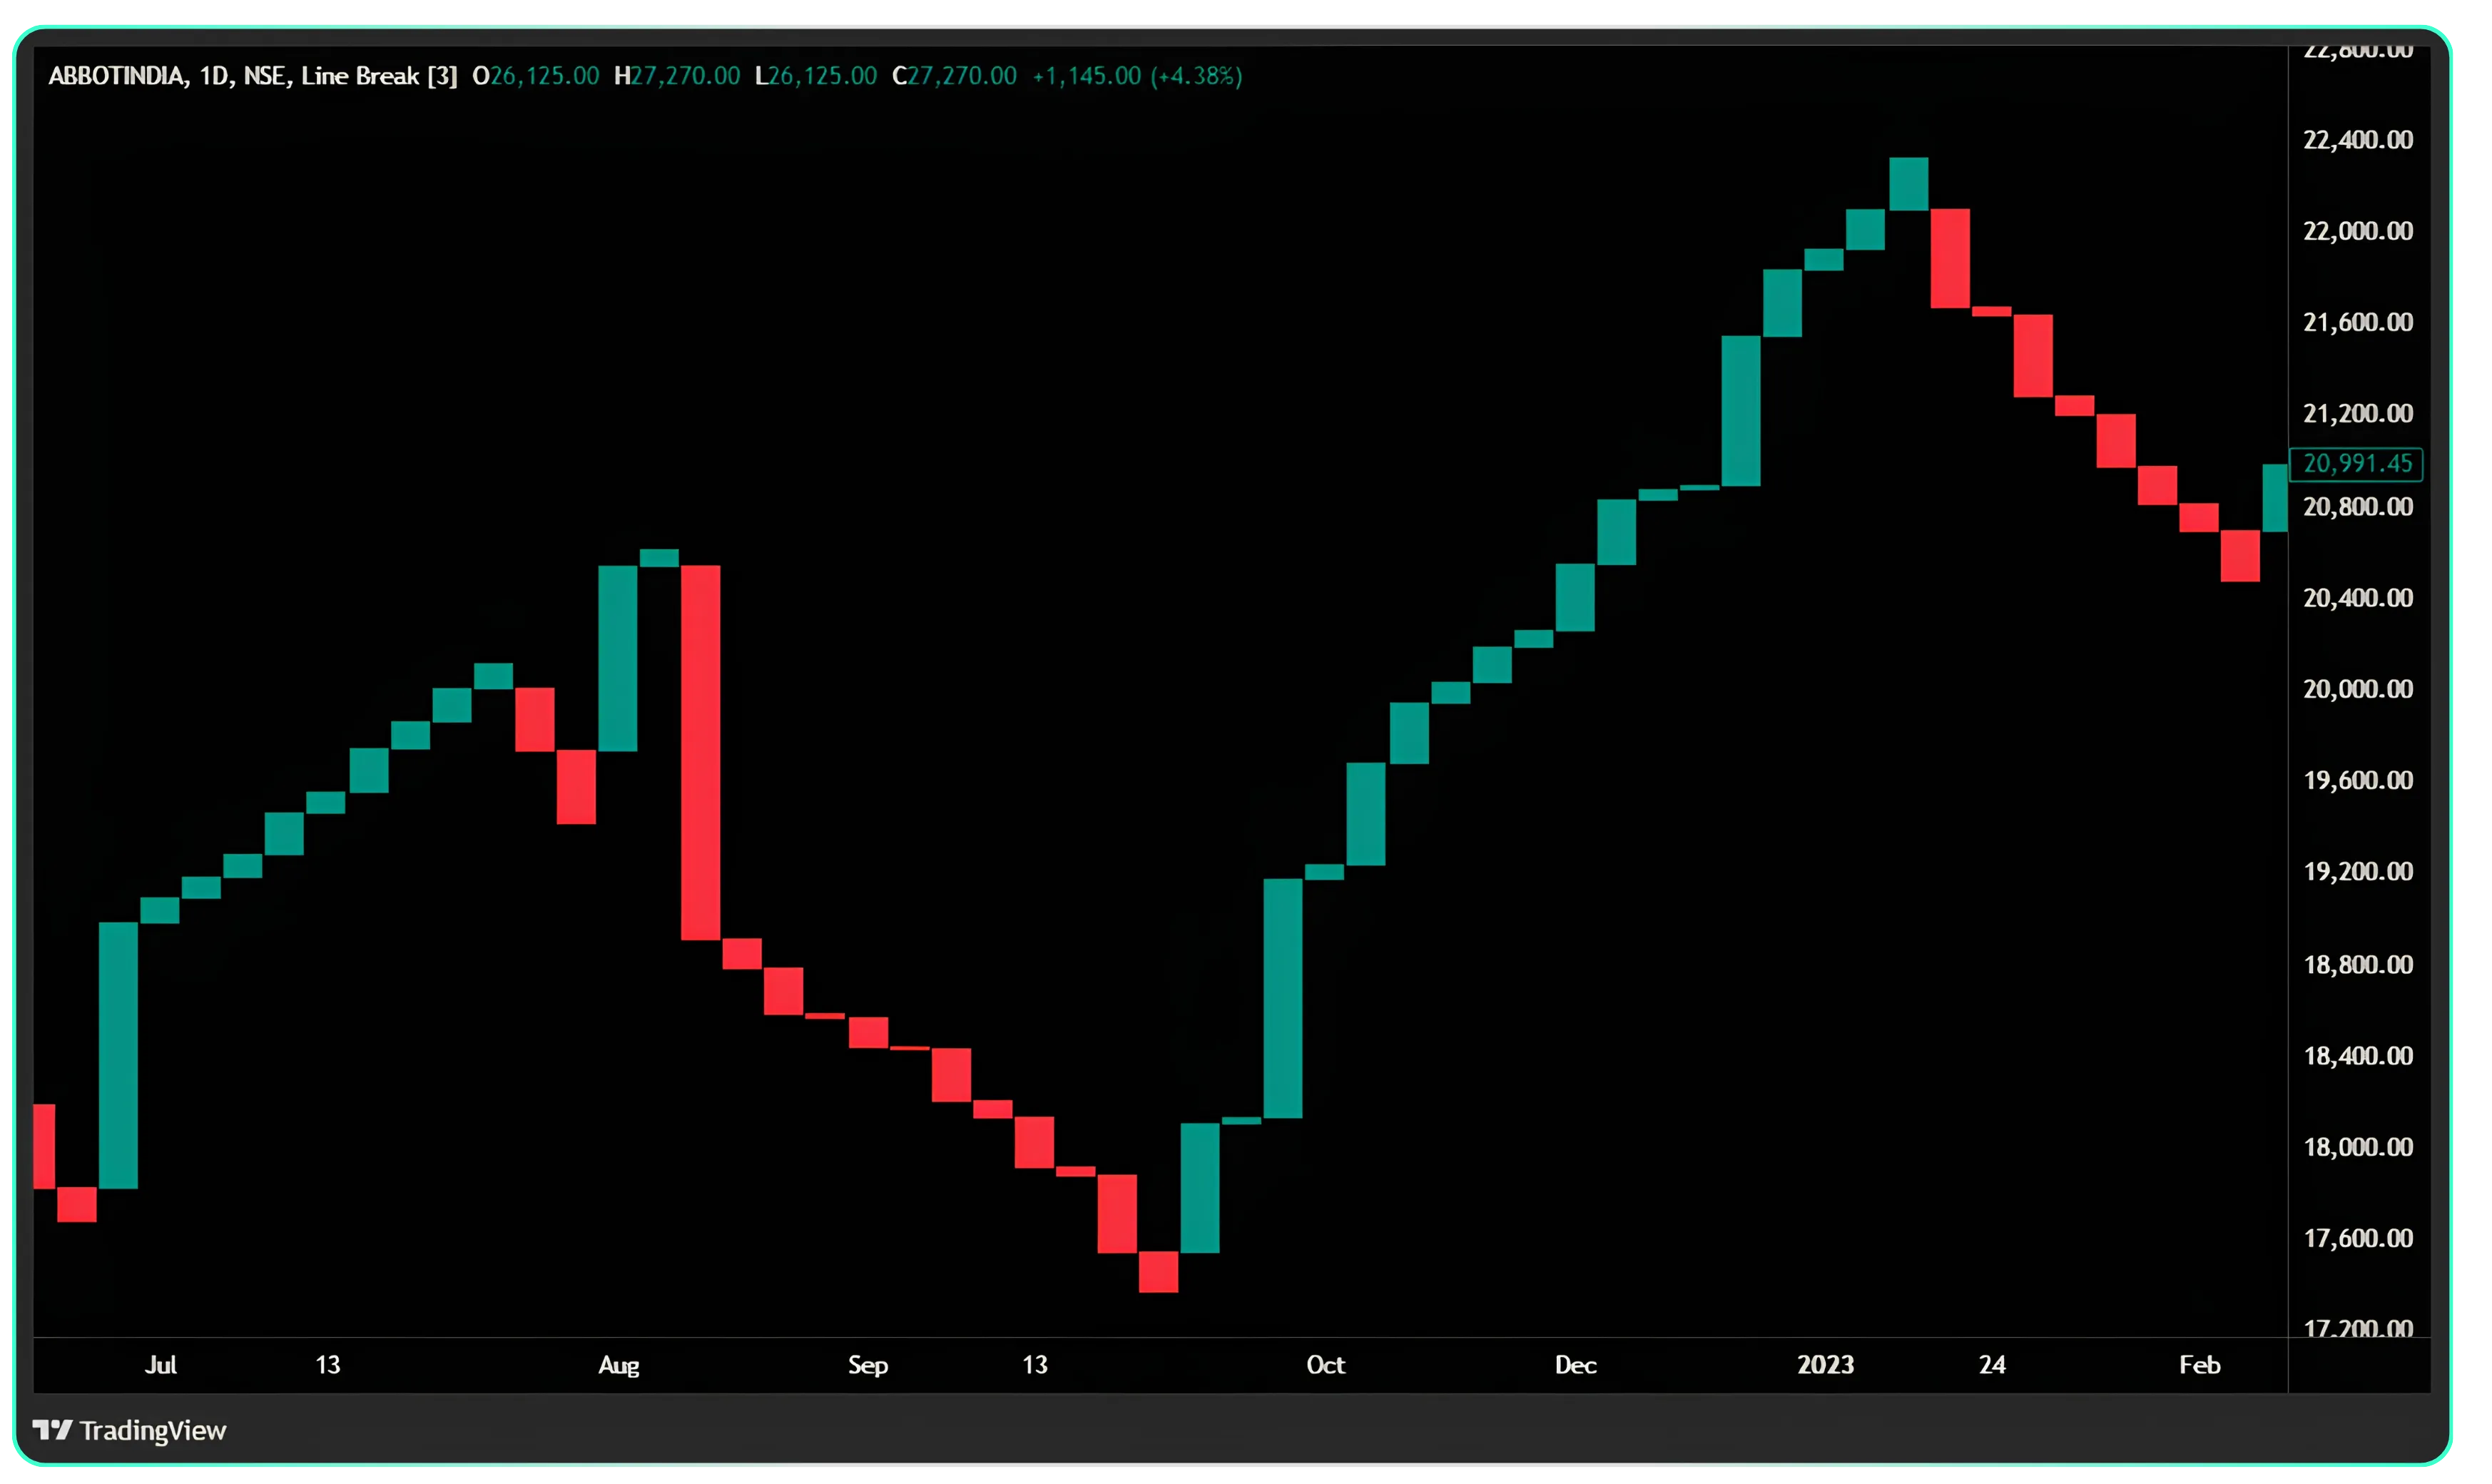
In the example above, the uptrend ends with a bearish COL. The downtrend that follows ends with a bullish COL, and the next uptrend begins.
Simple stop-and-reverse (SAR) rules
A COL can be used as a complete trading system, where the trader is always either long or short:
| Signal | Action |
|---|---|
| Bullish Change of Line | Buy |
| Bearish Change of Line | Exit long and go short |
| Next Bullish Change of Line | Cover short and buy again |
The main advantage is that the reversal price is known before it happens. The trader can see the high and low of the last three lines and place the stop-loss in advance.
The drawback is whipsaws. When the price moves in a narrow range, the lines keep changing colour, and the system takes several small losses in a row. The method works best when the market is trending.
The Four Reversal Patterns
In a three-line break chart, three lines set the reversal level and the fourth line breaks it. So every reversal can be read as a four-line pattern. Looking at how those four lines are arranged, reversals fall into four groups.
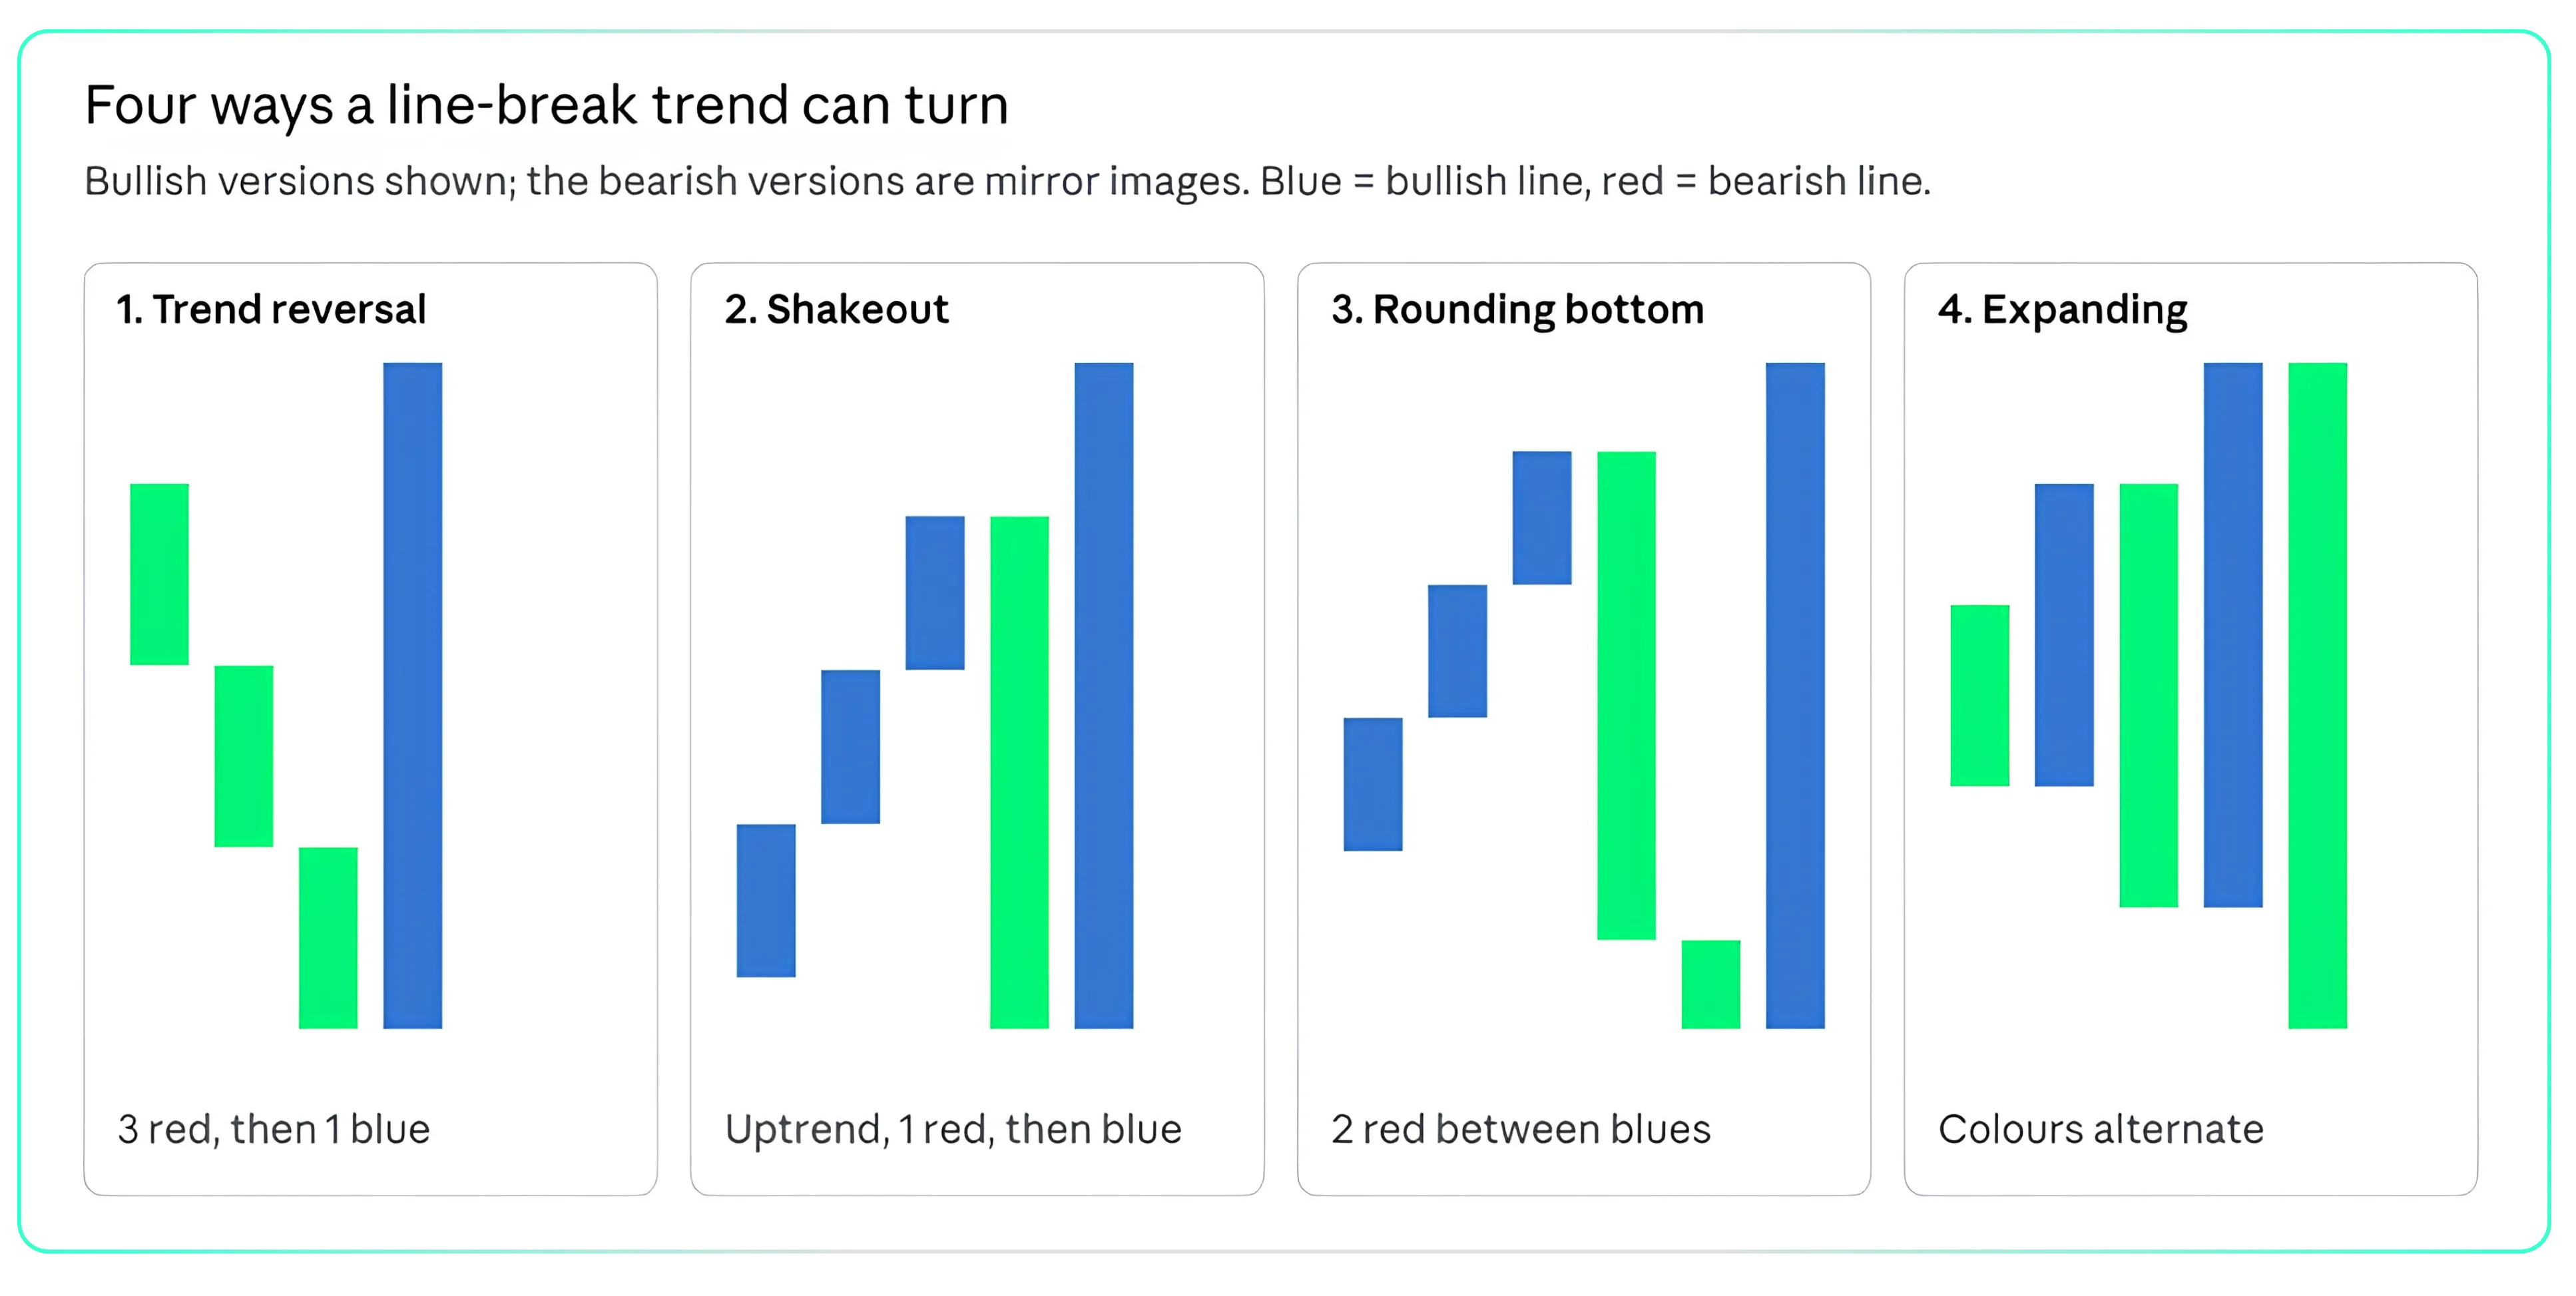
Illustrative prices, built with three-line break rules
1. Trend reversal
Three lines of one colour followed by one line of the opposite colour.
- Bullish: 3 bearish lines, then 1 bullish line.
- Bearish: 3 bullish lines, then 1 bearish line.
This is the most common type. In back-tests on Nifty data it accounts for about 70% of all reversals. It shows a clear change from one trend to the other.
2. Shakeout
A trend makes a single counter line, and the very next line goes back in the original direction.
- Bullish shakeout: uptrend, 1 bearish line, then 1 bullish line.
- Bearish shakeout: downtrend, 1 bullish line, then 1 bearish line.
The single counter line pushes out traders with weak conviction or tight stops. When the trend resumes, it often moves strongly. Shakeouts tend to work well in strong trends.
3. Rounding patterns
Two counter lines placed between lines of the main colour.
- Rounding bottom: 2 bearish lines between bullish lines. On a candlestick chart, this often looks like a V or a W bottom.
- Rounding top: 2 bullish lines between bearish lines. On a candlestick chart, this often looks like an M top.
4. Expanding pattern
The colours alternate: bullish, bearish, bullish, bearish. Each new line breaks the extreme of the earlier lines, so the swings keep getting wider.
This shows rising volatility and indecision. An expanding pattern often comes before a strong breakout, or at a major turning point in the market.
Higher Lows and Lower Highs
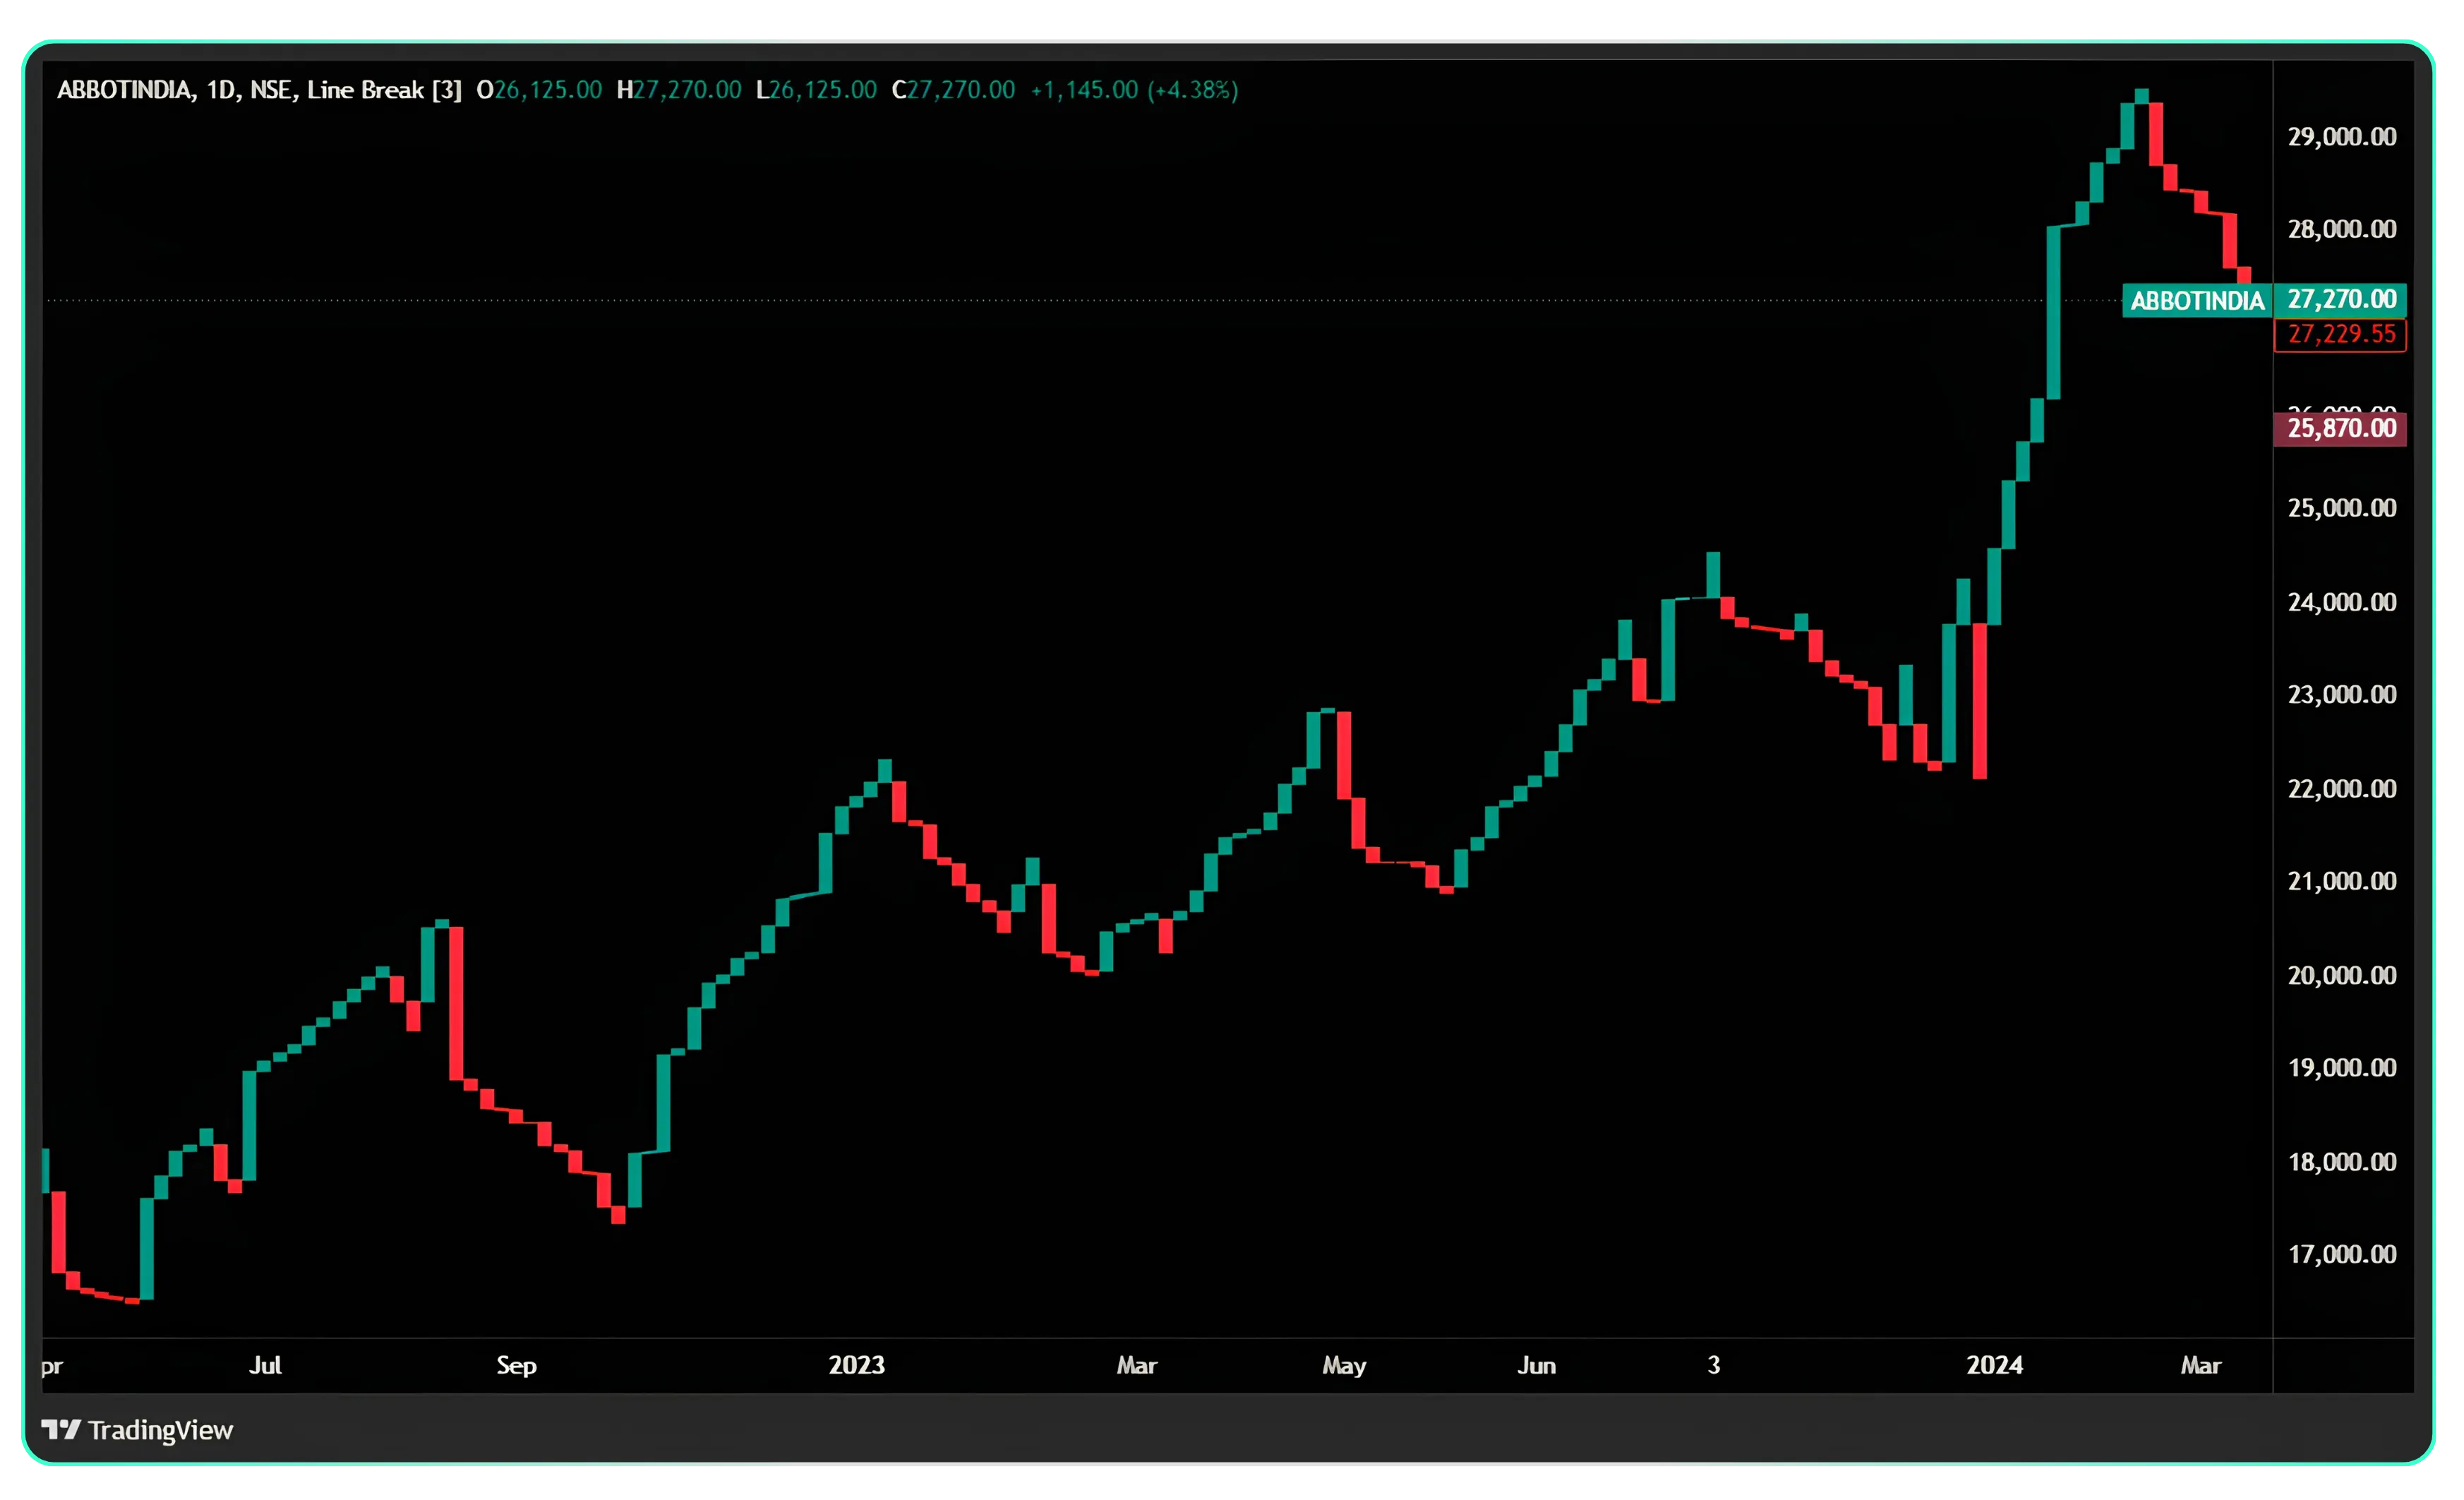
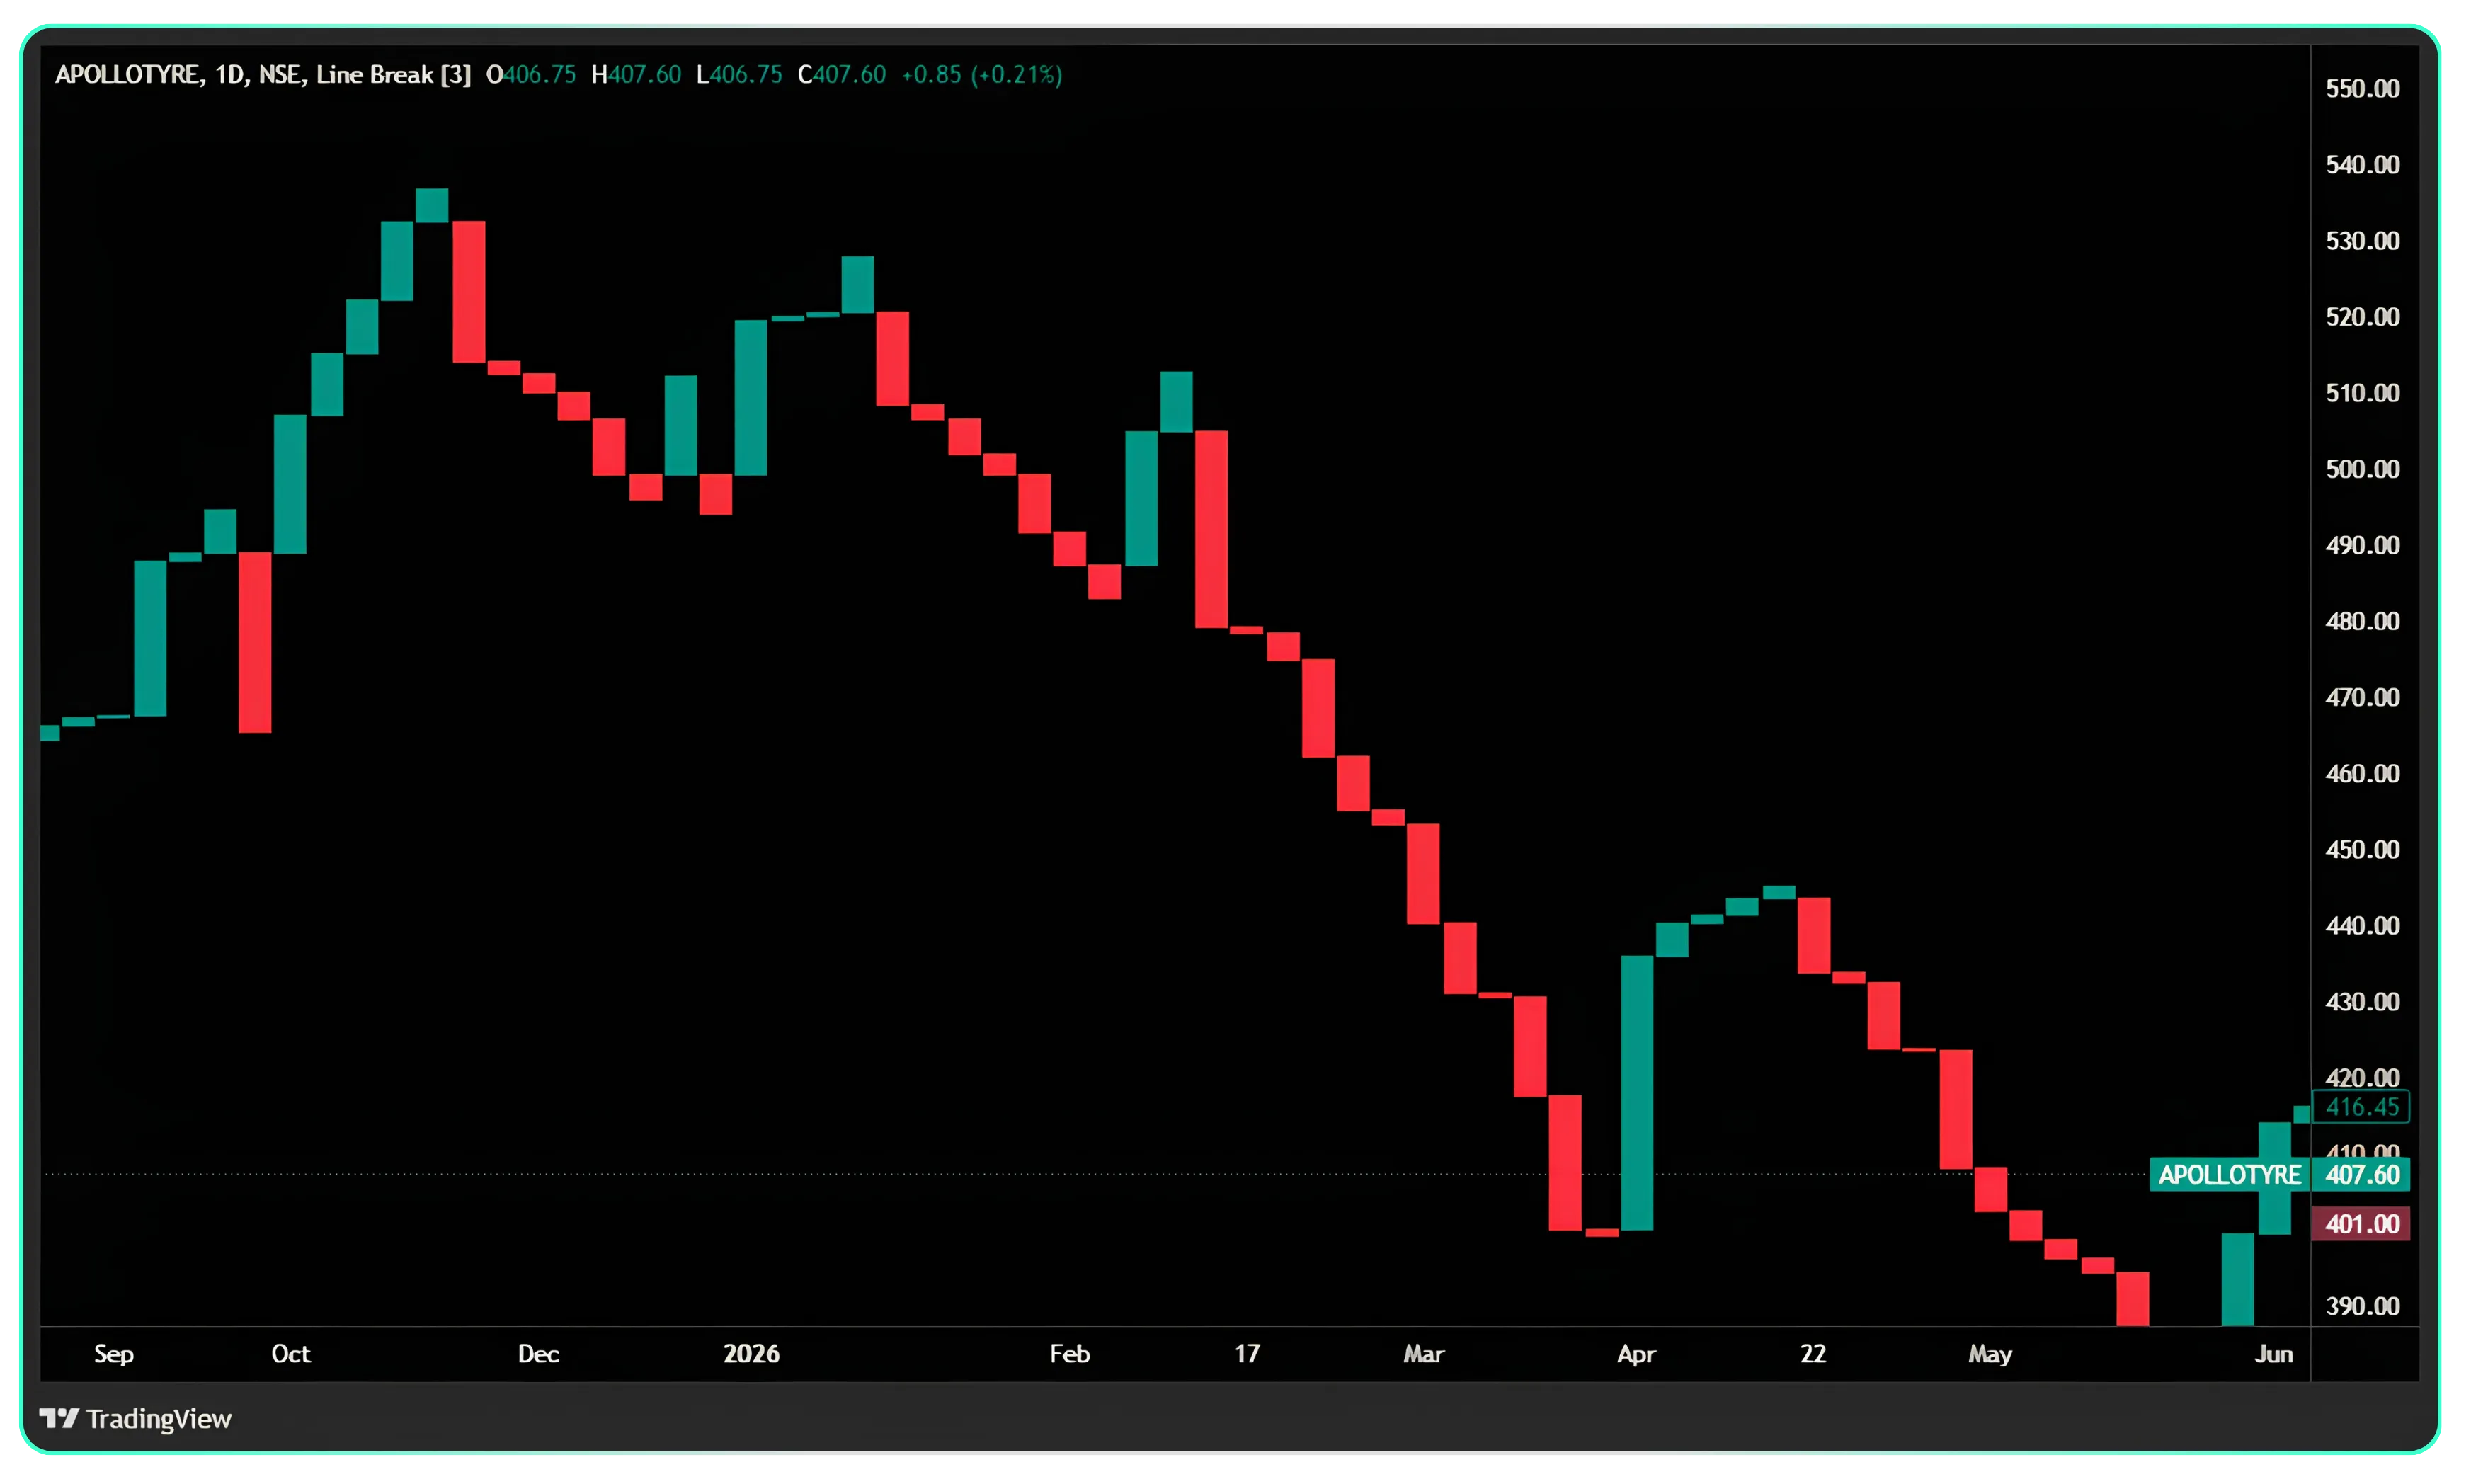
Comparing one Change of Line with the previous one shows whether the trend is getting stronger or weaker.
• Higher low: a bullish Change of Line that starts at a higher price than the previous bullish Change of Line. Buyers are stepping in earlier, which supports an uptrend.
• Lower high: a bearish Change of Line that starts at a lower price than the previous bearish Change of Line. Sellers are stepping in earlier, which supports a downtrend.
Summary
| Pattern | What it looks like | What it tells you |
|---|---|---|
| Change of Line | Line colour flips after breaking the last 3 lines | Trend has reversed; reversal price known in advance |
| Trend reversal | 3 lines of one colour, then 1 opposite | Clean change of trend; the most common reversal |
| Shakeout | 1 counter line inside a trend, then back to trend | Weak hands shaken out; trend likely to continue |
| Rounding | 2 counter lines between trend lines | V, W or M type turn |
| Expanding | Colours alternate, swings widen | Volatility rising; a big move may follow |
| Higher low / lower high | COL forms above (or below) the previous COL | Trend is getting stronger |
Line-break patterns follow fixed rules, so two traders looking at the same chart will see the same pattern. They work best in trending markets and give more false signals in tight ranges. As with any method, use a stop-loss and test the rules on past data before trading with real money.
Also read: Accumulation & Distribution | Reading Price and Volume
Disclaimer: The information provided in our blogs is for informational purposes only and should not be construed as financial, investment, or trading advice. Trading and investing in the securities market carries risk. Always conduct your own research and consult with a qualified financial advisor before making any investment decisions. Past performance is not indicative of future results. Copyrighted and original content for your trading and investing needs.
© 2026 — Tradejini. All Rights Reserved.