


Straddles are one of the easiest ways to understand what the market expects. Instead of checking call and put separately, a straddle chart analysis for Nifty and BankNifty shows the combined option premium and breakeven levels of both legs. This gives a clear picture of whether the market is expecting movement or staying quiet, and whether straddle premium rising or falling reflects volatility expectations.
NxtOption makes this even better with a dedicated NxtOption Straddle section for intraday trading that is simple to navigate and very useful for intraday traders.
Also Read: Understanding OI Breakdown in trading using NxtOption
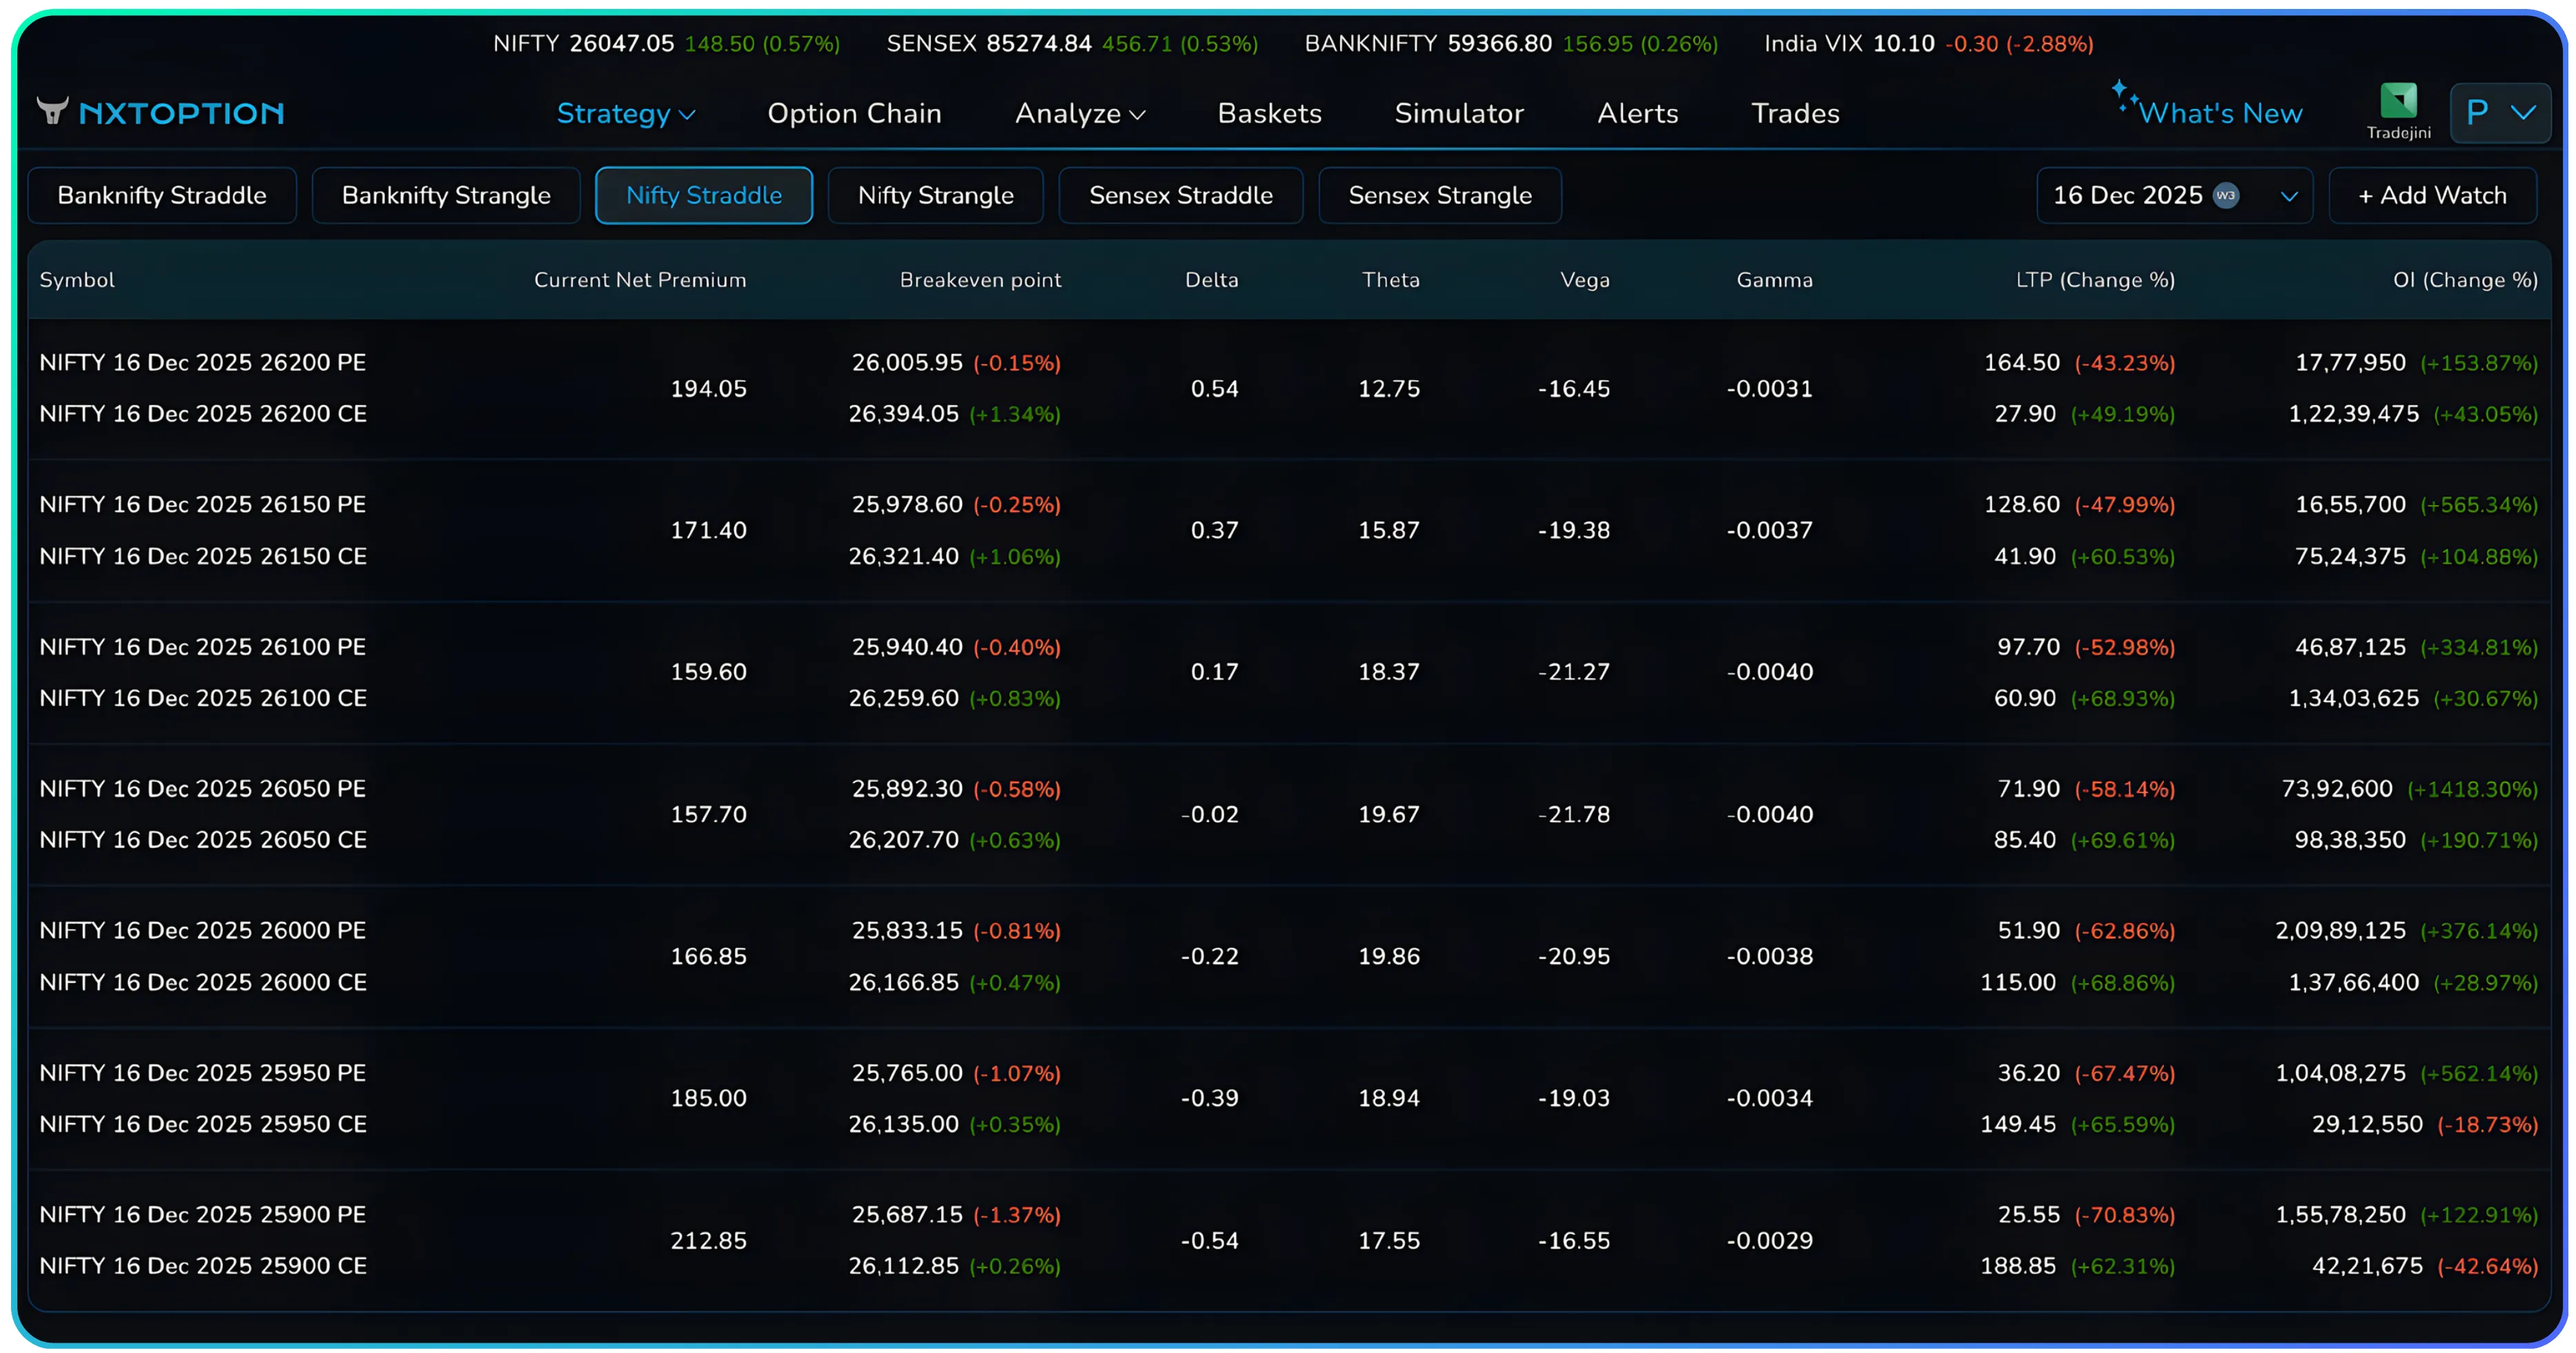
Where to Find Straddle Charts in NxtOption
Open the Strategy tab and select Nifty Straddle or BankNifty Straddle. You will see a table with the combined option premium breakeven levels, Greeks, LTP change and OI change for each strike. This unified view removes the need to check call and put chains separately.
Hovering over any of these strikes will open up multiple options and clicking the premium charts will open up a chart.
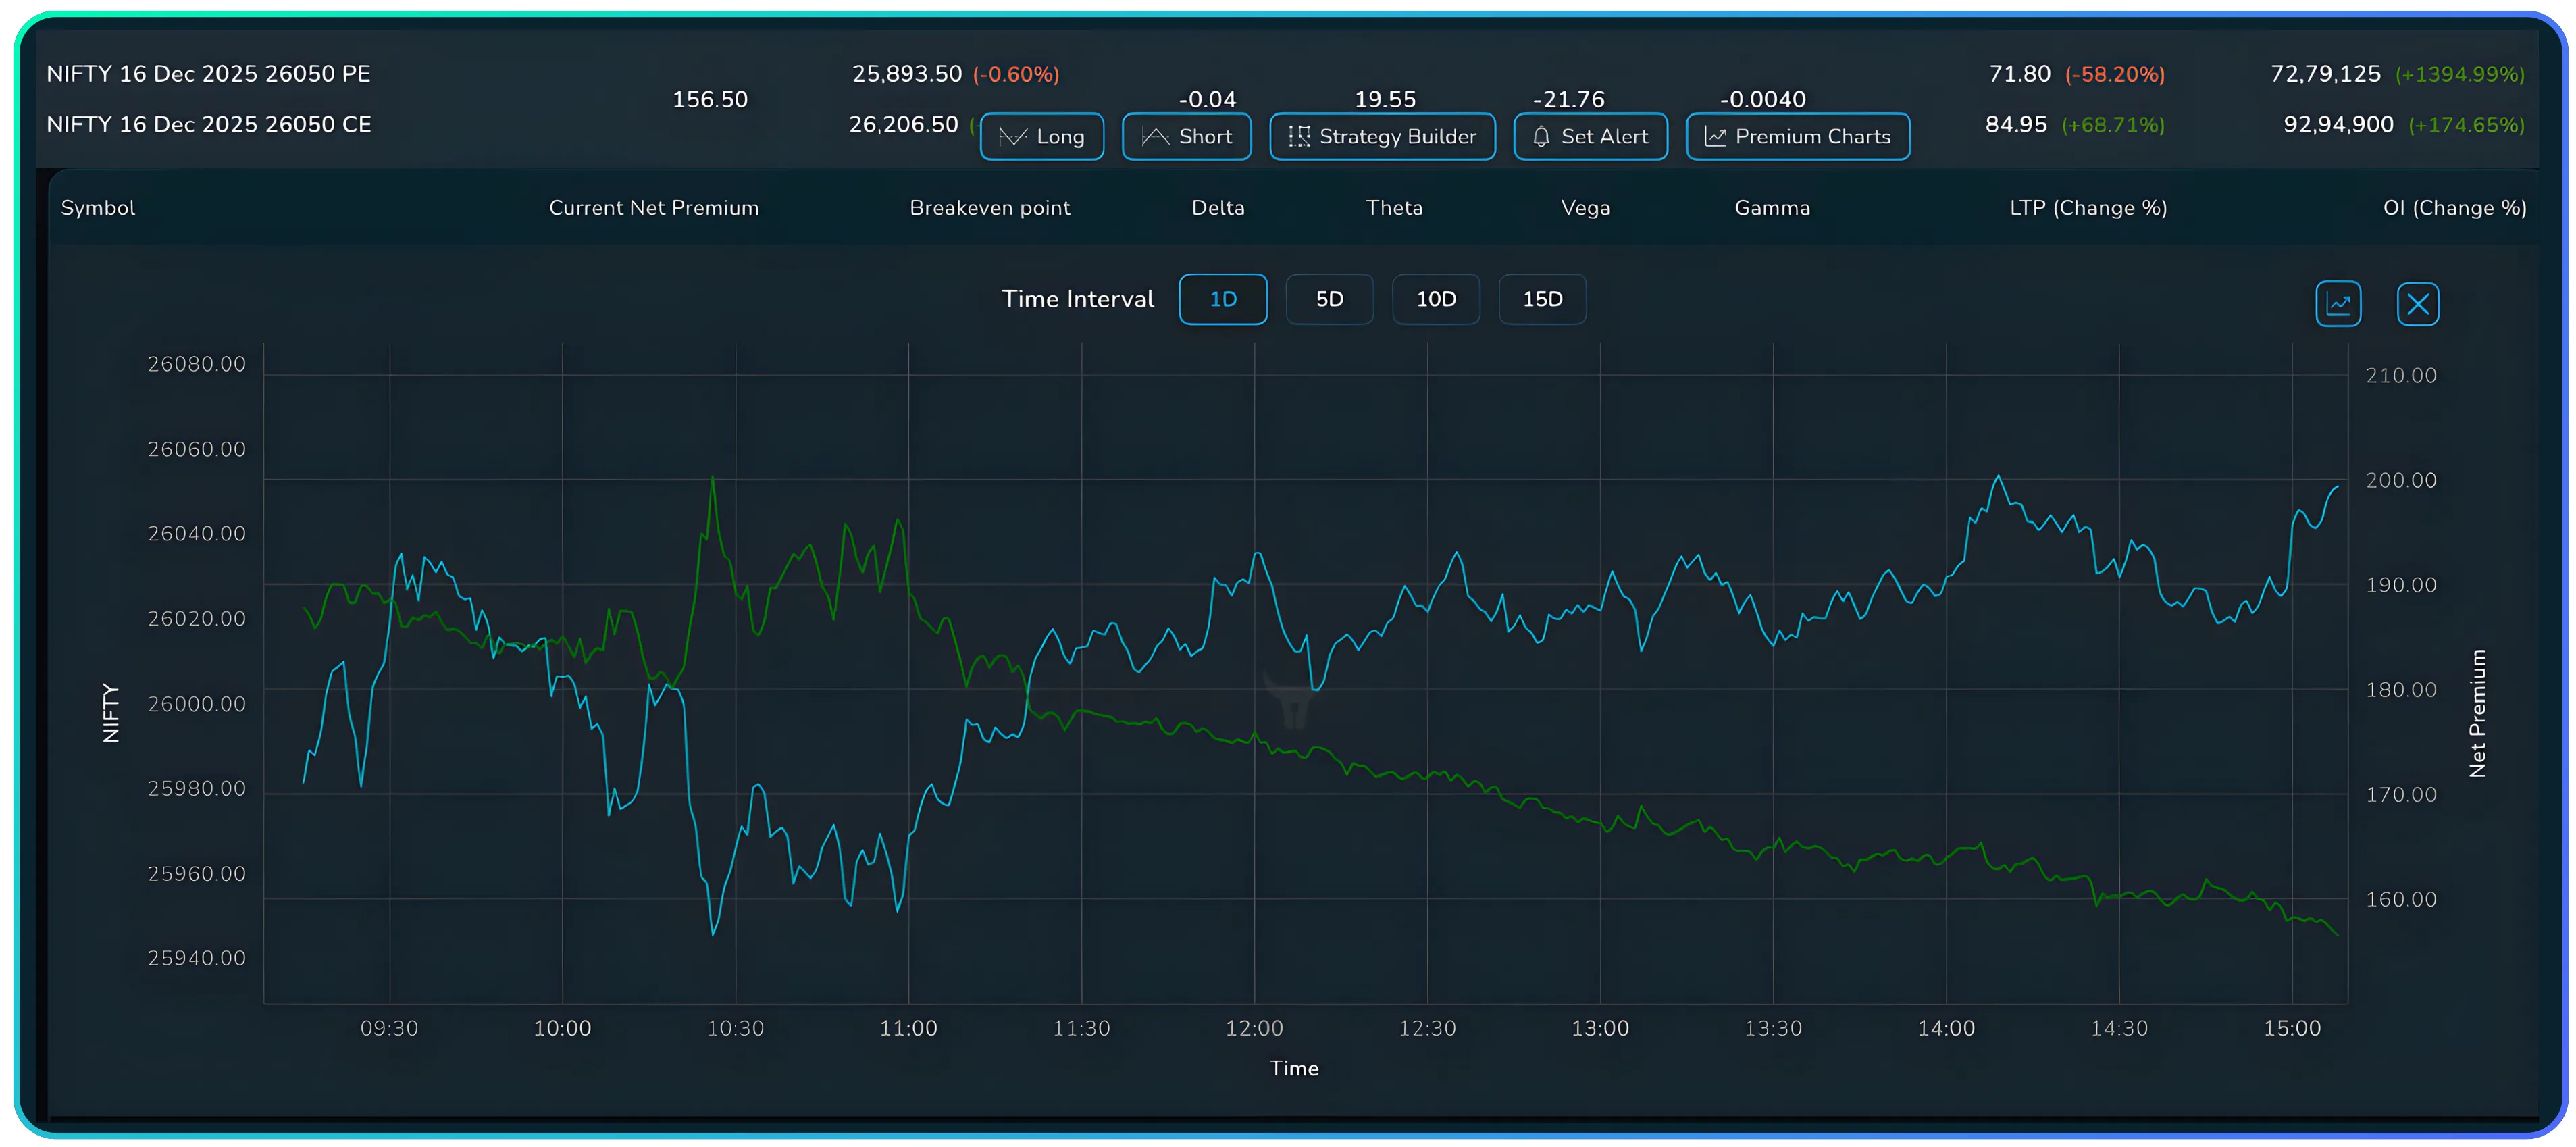
This chart shows how the total premium of CE and PE moves through the day. Instead of tracking two separate lines, you see one combined line that updates in real time. This line is shown in blue. There is one more line shown in green that shows the movement of the underlying over the day. The other visible buttons are for changing the time interval and opening the same premium chart in TradingView.
Why Straddle Charts Are Helpful
A straddle chart helps you watch total premium movement, straddle premium rising or falling with, volatility expansion or contraction, speed of decay, and market mood without looking at CE and PE separately.
If the straddle premium is rising, the market is building momentum. A rising premium suggests traders expect larger moves ahead. This often happens before breakouts or significant directional movements.
If the straddle premium is falling, the market is calm and option sellers dominate. Falling premium shows the market is rangebound and time decay is working faster than any volatility concerns.
Also Read: Volatility Insights that Sharpen Every Options Trade
How VWAP Adds Clarity
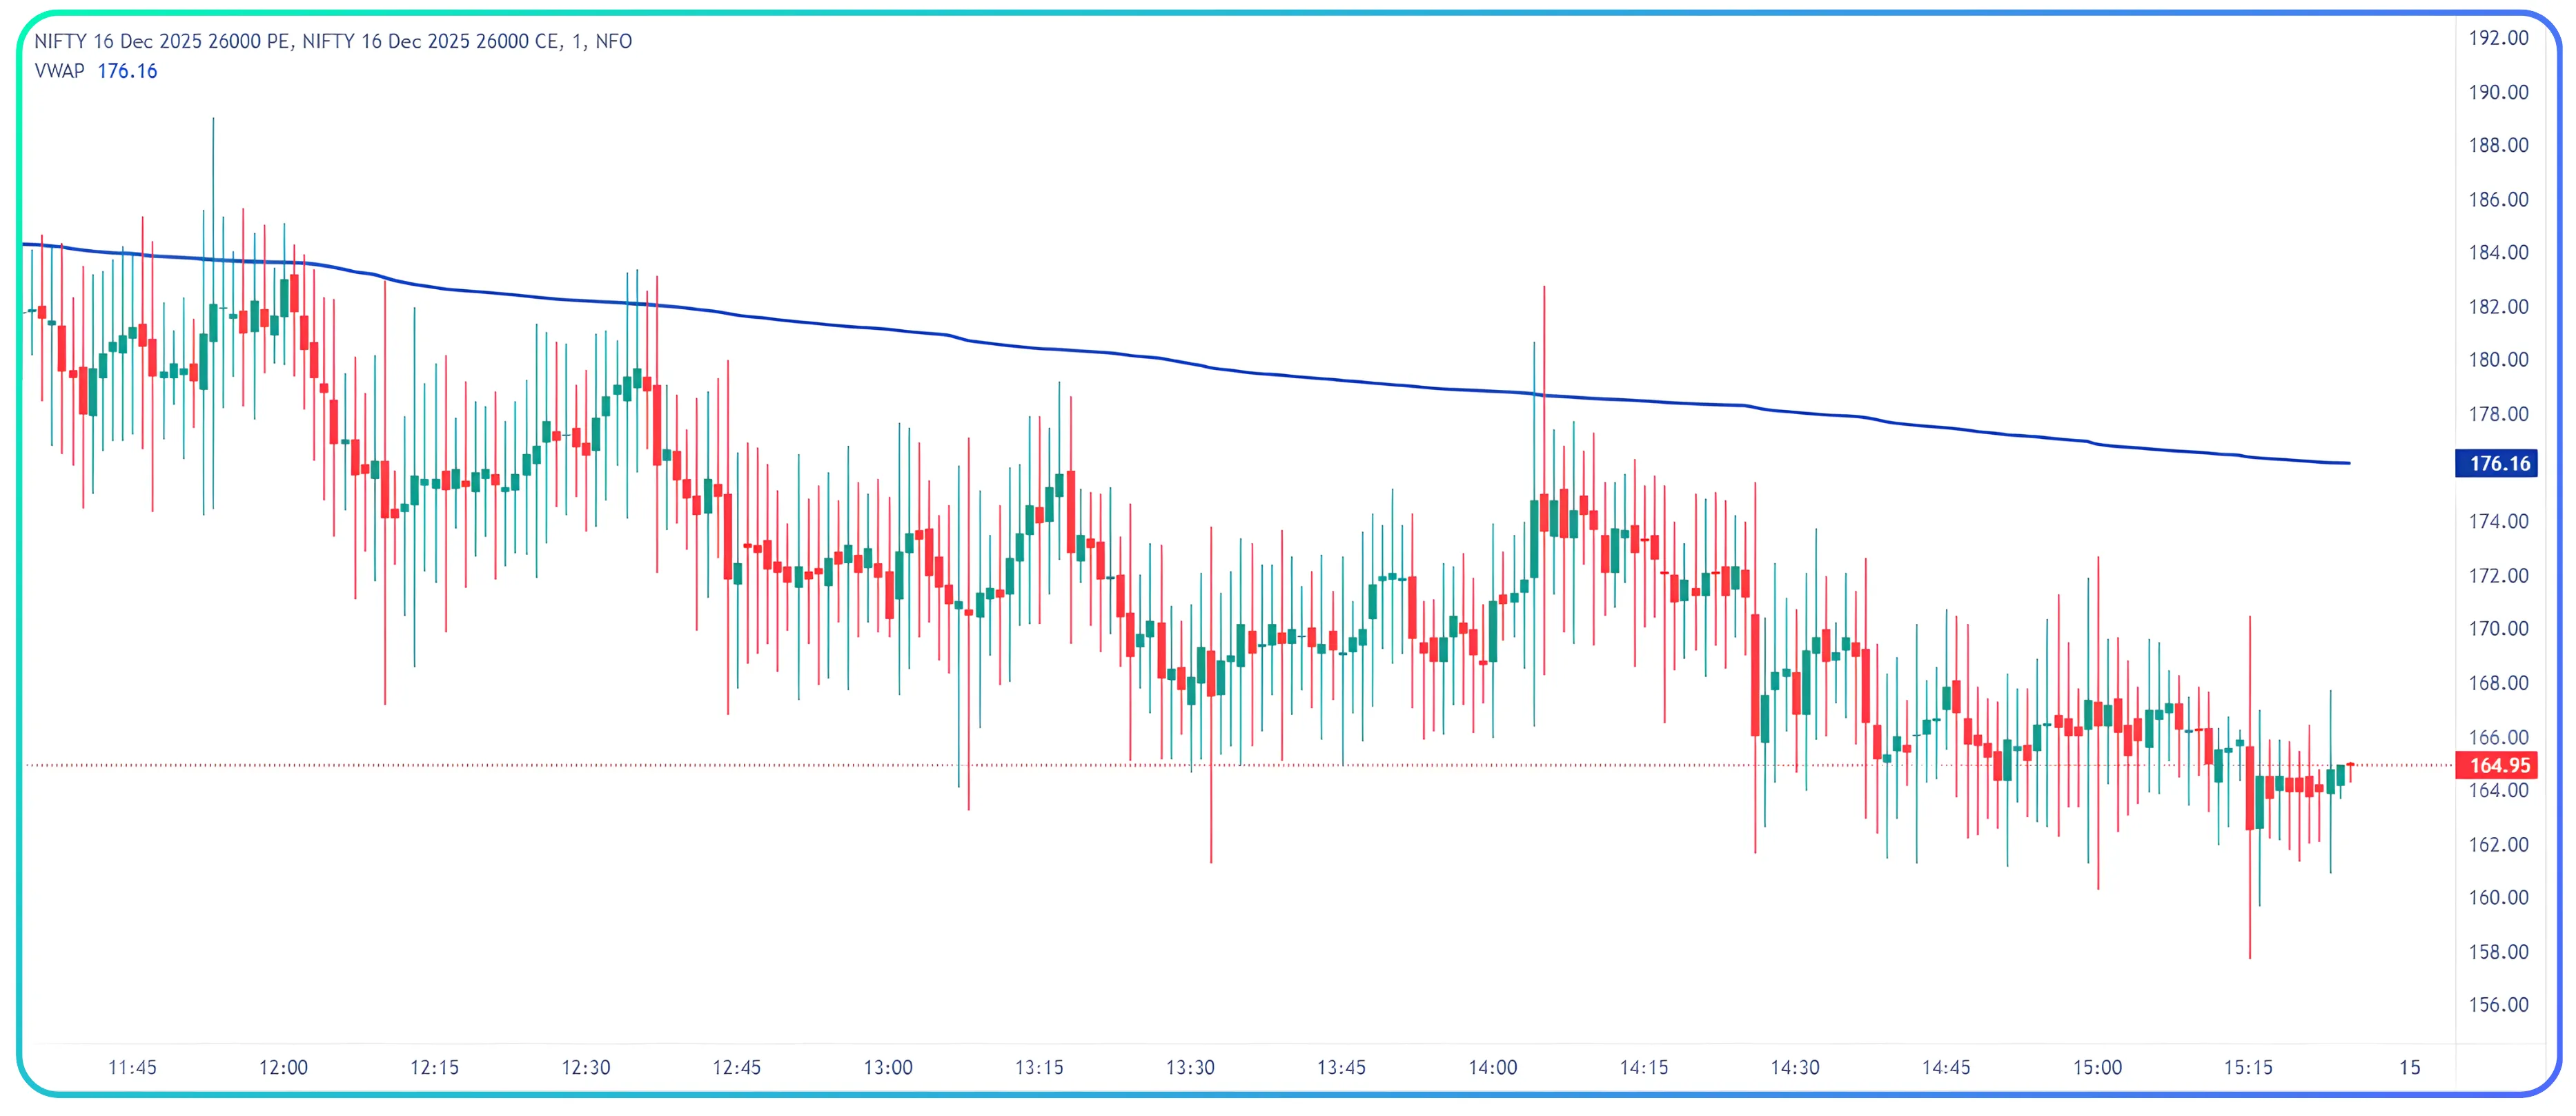
Clicking on the Open in TradingView button will open the following interface of the premium chart being shown in a 1-minute time frame. Here the trader can use the interface in a similar way as other TradingView charts, including but not limited to: changing timeframes, drawing on charts, and adding indicators. Using the VWAP indicator on straddle premium gives you a very clean read of intraday sentiment. VWAP serves as a reference level that shows the average price at which the straddle traded through the session.
When Premium Stays Above VWAP
This usually means the market is getting ready for a move or volatility is increasing. When premium holds above VWAP, traders are willing to pay above-average prices for options. This suggests they expect significant movement ahead.
Option buyers get better trades in such conditions. Entering long straddles when the premium stays above VWAP aligns with option buyers strategy above VWAP and growing market momentum. This pattern works well before events or during technical consolidation periods.
When Premium Stays Below VWAP
This shows a calm or sideways market. Premium trading below VWAP indicates options are cheaper than their session average. This happens when the market stays rangebound and traders will not pay elevated prices.
Option sellers benefit more because decay picks up speed. Selling straddles when the premium is below VWAP reflects an option sellers strategy below VWAP, where time decay works in your favour.
When Premium Crosses VWAP
This often marks a shift in intraday trend. When the premium crosses above VWAP, it signals growing demand and potential momentum building. When the premium crosses below VWAP, momentum is fading and the market returns to a calmer state.
It becomes a natural level for entries, exits and stop losses. VWAP makes the straddle chart easier to interpret because it provides an objective reference that updates continuously throughout the session.
Also Read: Plan Trades Better with NxtOption What If
How Traders Can Use This Setup
For Option Sellers
Sell straddles when the premium stays below VWAP. This indicates options are trading cheaply relative to their session average. Wait for the premium to stay below VWAP for at least thirty minutes to confirm the pattern.
Add small positions on VWAP rejections. When the premium tries to rise toward VWAP but falls back down, this confirms weak demand. These rejections provide good entry points for short straddles.
For Option Buyers
Look for premium crossing above VWAP with some volume. The crossover signals increasing demand, and volume confirms conviction behind the move. This pattern shows genuine strength rather than temporary fluctuation.
Avoid buying when the straddle stays below VWAP for most of the day. If premium trades below VWAP for hours, the market is not pricing in the movement that long straddles need. Buying in this environment means fighting market sentiment.
Wait for the premium to show strength relative to VWAP before entering. This captures the transition from low-premium to rising-premium environments.
For Event Trading
Watch if straddle premiums rise before the news. In the hours before known events, premiums typically increase as implied volatility rises. The chart with VWAP clearly shows this buildup.
After the news, check if premiums collapse. Following event resolution, implied volatility crashes as uncertainty disappears. This appears as a sharp decline in premium, often falling below VWAP quickly.
This helps you manage risk better. The straddle chart provides continuous feedback about position movement, enabling faster adjustments than waiting for profit and loss calculations.
Why the NxtOption Chart Is Useful
NxtOption gives you both the combined premium and each leg's details in one place. You can check Greeks, breakeven, OI changes and then jump into the chart with a single click.
The table provides all analytical data for initial screening. Delta shows directional exposure, Theta shows decay rate, Vega indicates volatility sensitivity, and Gamma shows how Delta will change. After reviewing these metrics, clicking any strike opens the chart immediately.
For quick intraday decisions, this removes a lot of friction. Traditional workflows require multiple windows and cross-referencing between different sources. NxtOption's unified interface eliminates these steps, allowing faster movement from analysis to execution.
During volatile periods when opportunities emerge quickly, this speed advantage becomes critical. You can identify setups in the table, confirm them visually in the chart, and execute trades without switching contexts.
Summary
Straddle charts help you see the market's expectations in a single line. Adding VWAP to this chart gives a simple way to understand trend, volatility and momentum. Together, they help traders make cleaner entries, faster exits and smarter risk decisions.
The combination of straddle charts and VWAP in NxtOption provides intraday traders with a practical tool that improves both the speed and quality of trading decisions in the options market.
Disclaimer: The information provided in our blogs is for informational purposes only and should not be construed as financial, investment, or trading advice. Trading and investing in the securities market carries risk. Always conduct your own research and consult with a qualified financial advisor before making any investment decisions. Past performance is not indicative of future results. Copyrighted and original content for your trading and investing needs.
© 2025 — Tradejini. All Rights Reserved.