Corporate actions can have an impact on a company's share price and are important to consider while analysing a stock. To make this information easier to access, CubePlus now displays corporate actions directly on the chart screen.
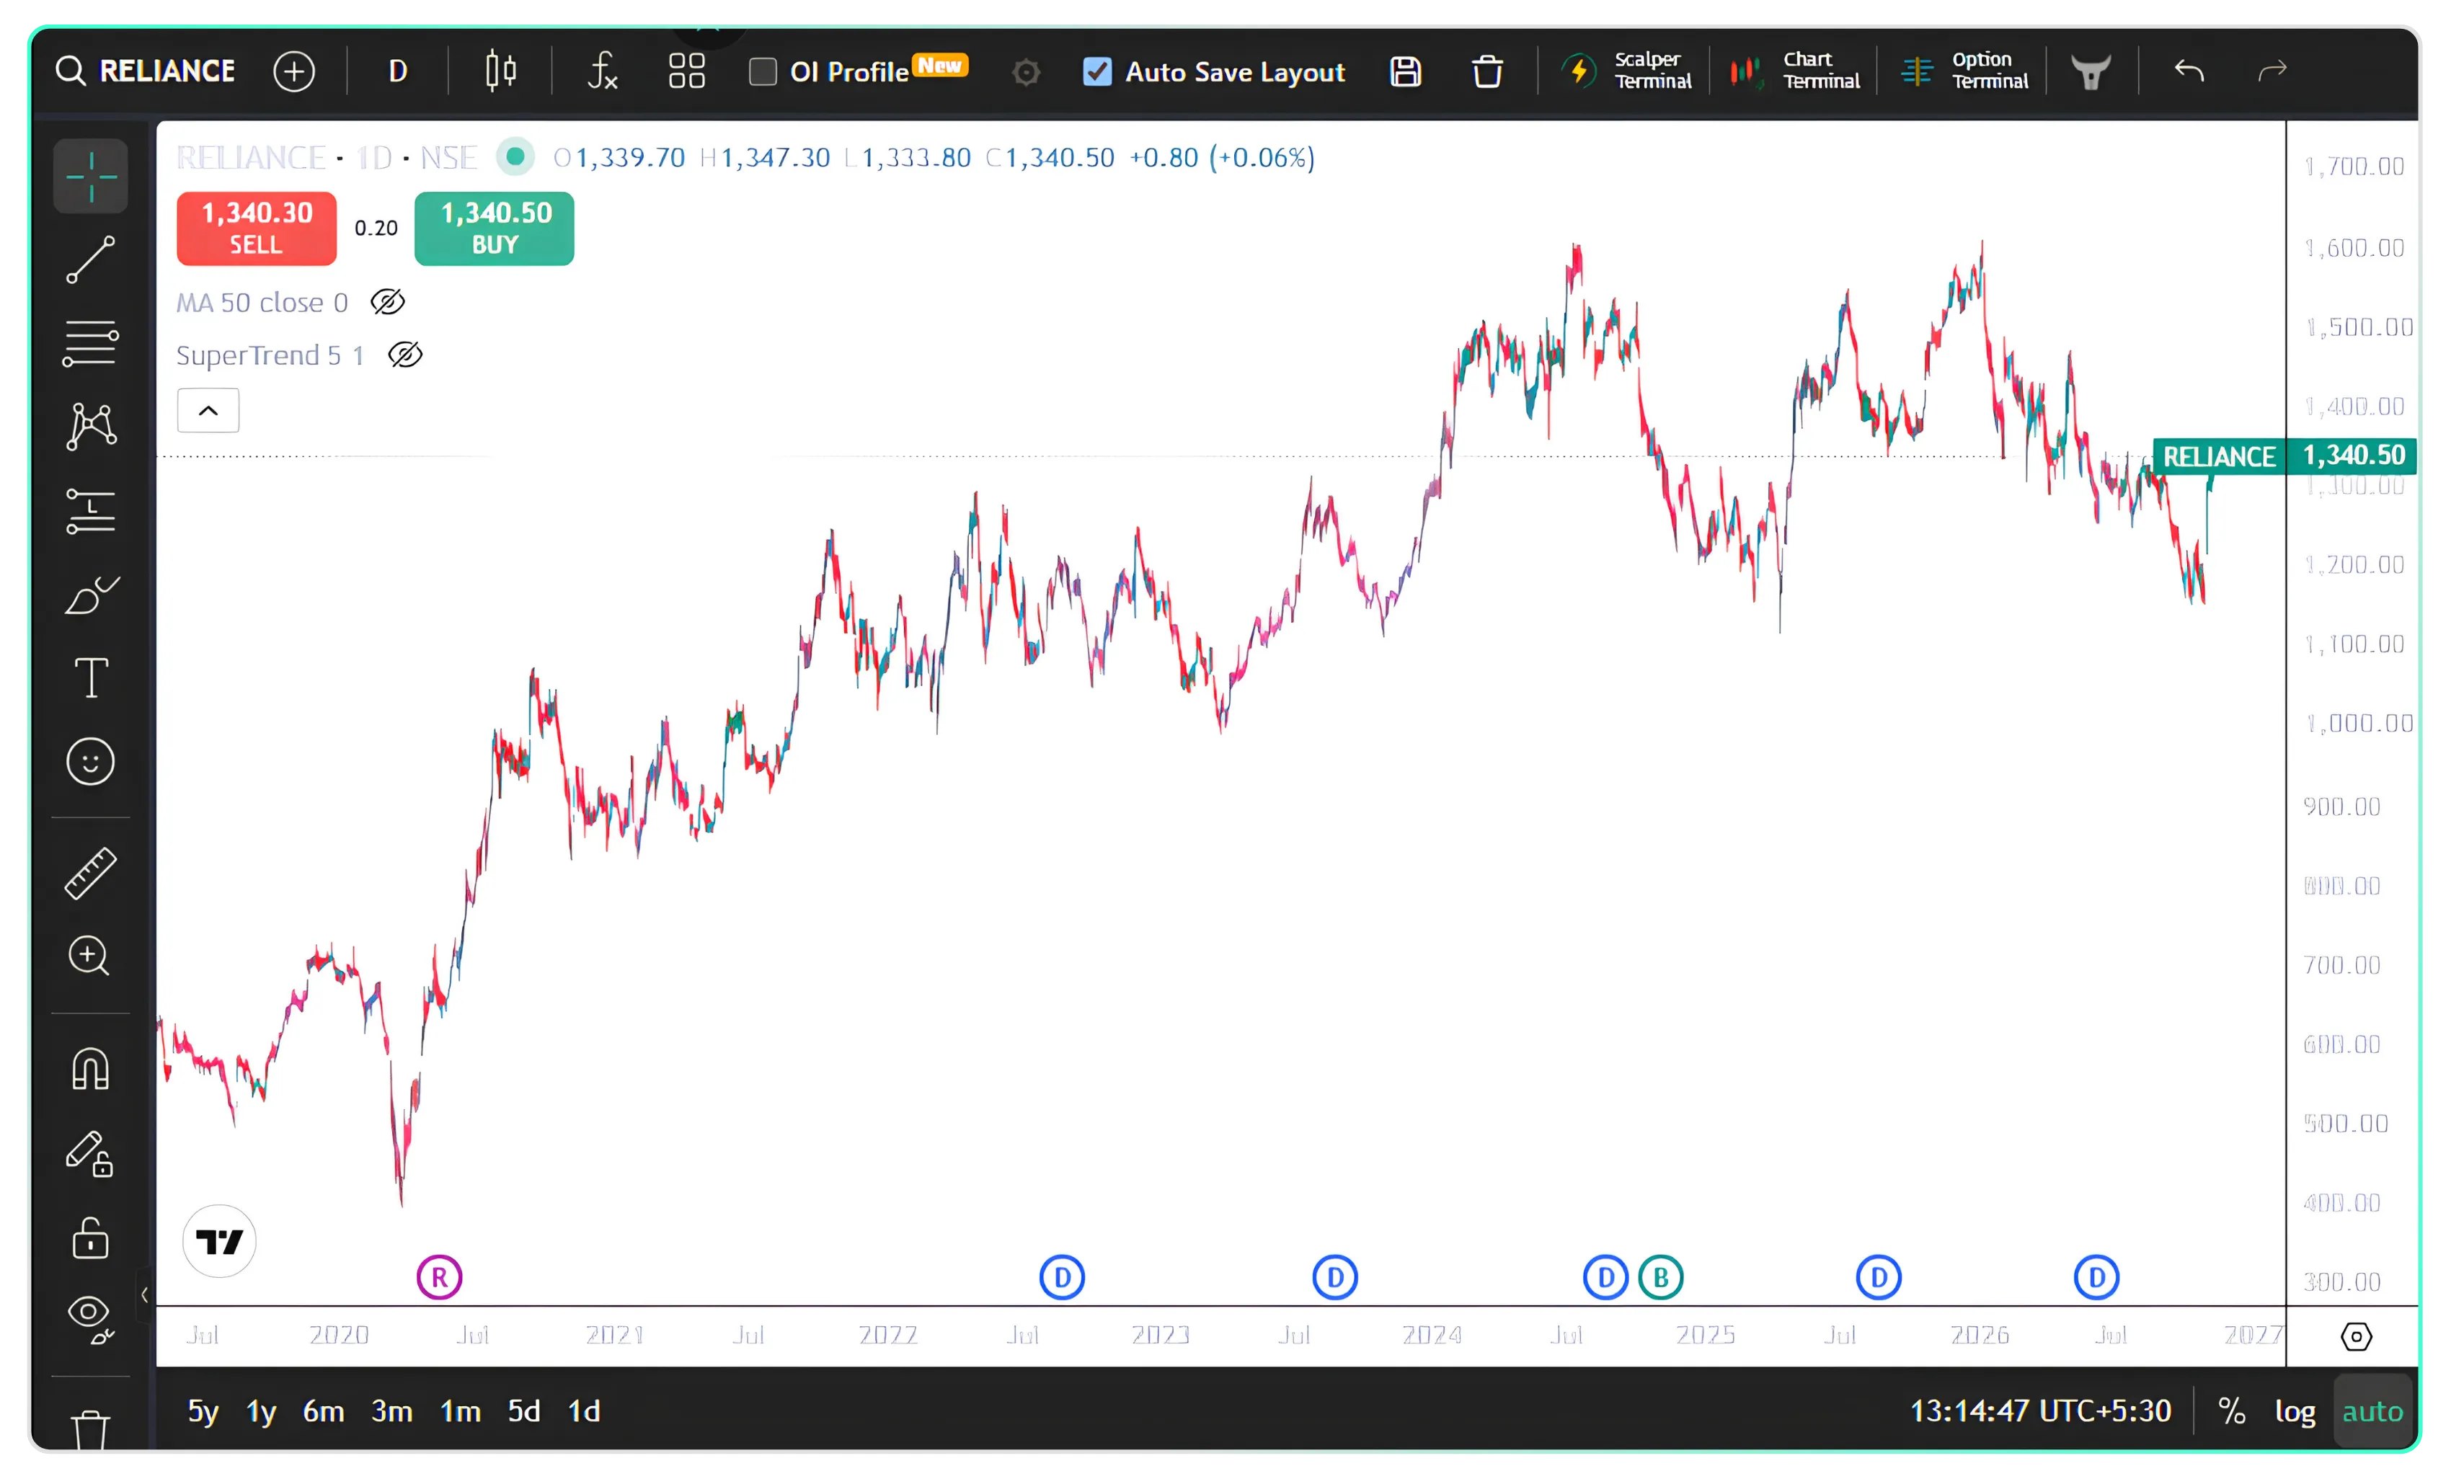
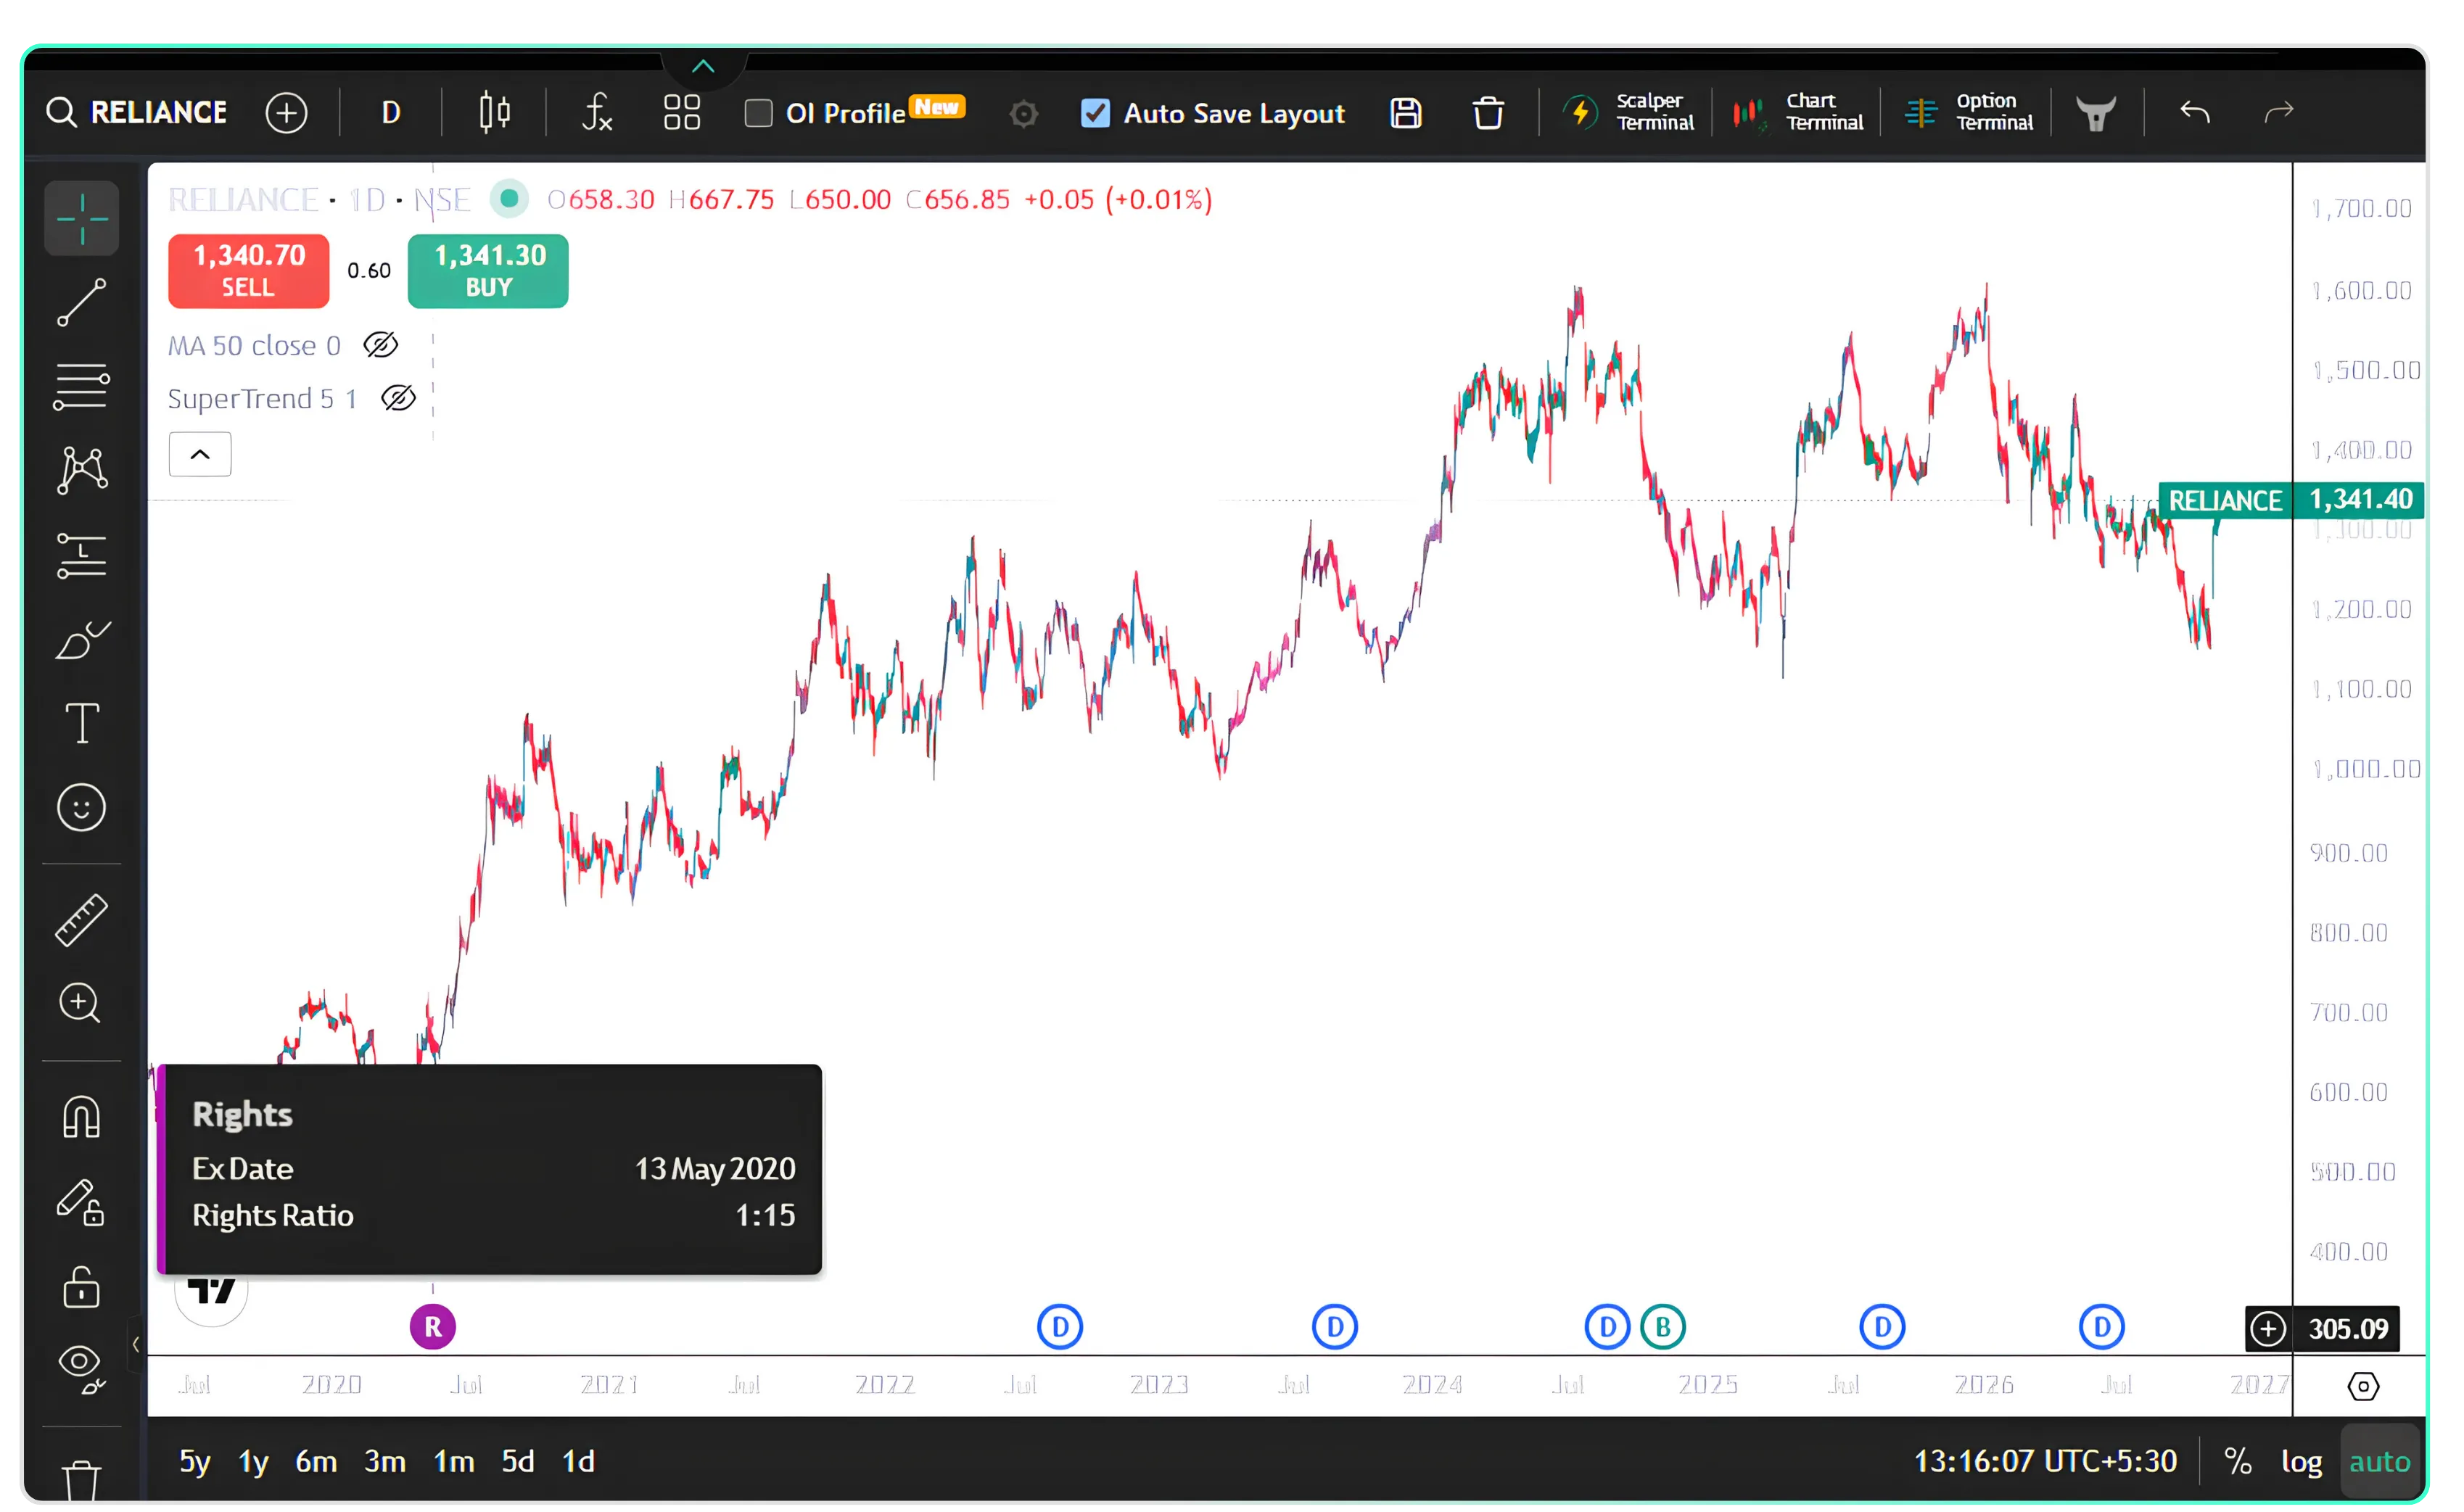
Users can view events such as Dividends, Stock Splits, Bonus Issues and Rights Issues through markers displayed along the chart timeline. By clicking on these markers, users can view the details of the respective corporate action without navigating away from the chart.
What Corporate Actions Are Displayed on CubePlus Charts?
CubePlus charts display markers for the following corporate actions:
- Dividends (D): Indicates a dividend-related corporate action.
- Stock Splits (S): Indicates a stock split.
- Bonus Issues (B): Indicates a bonus issue.
- Rights Issues (R): Indicates a rights issue.
These markers appear along the chart timeline, corresponding to the respective corporate action.
How to View Corporate Action Details on CubePlus
Follow these steps to view corporate action details:
- Open the required stock chart on CubePlus.
- Look for the corporate action markers displayed along the chart timeline.
- Identify the relevant marker, such as D, S, B or R.
- Click on the marker to view the details of the corporate action.
The details displayed may include relevant dates and other information related to the corporate action.
Why Is This Feature Useful?
Corporate actions are an important part of a company's history and can provide additional context when analysing its stock price.
With corporate action markers available directly on CubePlus charts, users can:
- Identify corporate actions along the stock's price timeline.
- View details of past dividends, splits, bonus issues and rights issues.
- Access corporate action information without leaving the chart screen.
- Refer to corporate action dates while analysing historical price movements.
Use Case: Understanding Price Movements Around Corporate Actions
Suppose you are analysing a stock that experienced a sudden price movement in the past. By checking the corporate action markers on the chart, you can identify whether an event such as a bonus issue or stock split occurred around that period.
For example, if a stock's price shows a significant adjustment around a particular date, checking the corresponding corporate action marker can help you understand whether the movement is associated with a stock split or bonus issue.
This provides additional context when studying historical price movements and helps avoid interpreting corporate action-related price adjustments as ordinary market movements.
Conclusion
The addition of corporate action markers makes it easier to access important company-related events while viewing stock charts on CubePlus. Users can simply click on the relevant marker to view its details, making corporate action information readily accessible during chart analysis.
Disclaimer: The information provided in our blogs is for informational purposes only and should not be construed as financial, investment, or trading advice. Trading and investing in the securities market carries risk. Always conduct your own research and consult with a qualified financial advisor before making any investment decisions. Past performance is not indicative of future results. Copyrighted and original content for your trading and investing needs.
© 2026 — Tradejini. All Rights Reserved.