


In intraday trading, where decisions are made quickly and volatility can shift sentiment within minutes, a structured approach becomes essential. Camarilla Pivots, introduced by bond trader Nick Scott in 1989, introduced a rule-based method to identify potential support and resistance levels grounded in mathematical calculations.
Today, using tools like Tradejini's CubePlus platform, traders can leverage Camarilla Pivots to navigate volatile markets with confidence.
Now, What Makes Camarilla Pivots Different?
Unlike traditional pivot points that emphasize R1 and S1 levels, Camarilla Pivots place critical importance on the third and fourth levels:
R3/R4 for resistance and S3/S4 for support. These levels are calculated using a unique multiplier (1.1) applied to the previous day's high-low range, creating tighter, more responsive zones that capture intraday price action with remarkable accuracy.
The core philosophy is mean reversion: prices tend to gravitate toward equilibrium. When they stretch too far beyond R4 or S4, a breakout or trend reversal becomes likely, opening opportunities to trade toward extended targets at R5/R6 or S5/S6.
But first, lets add Camarilla Pivots on Tradejini’s CubePlus
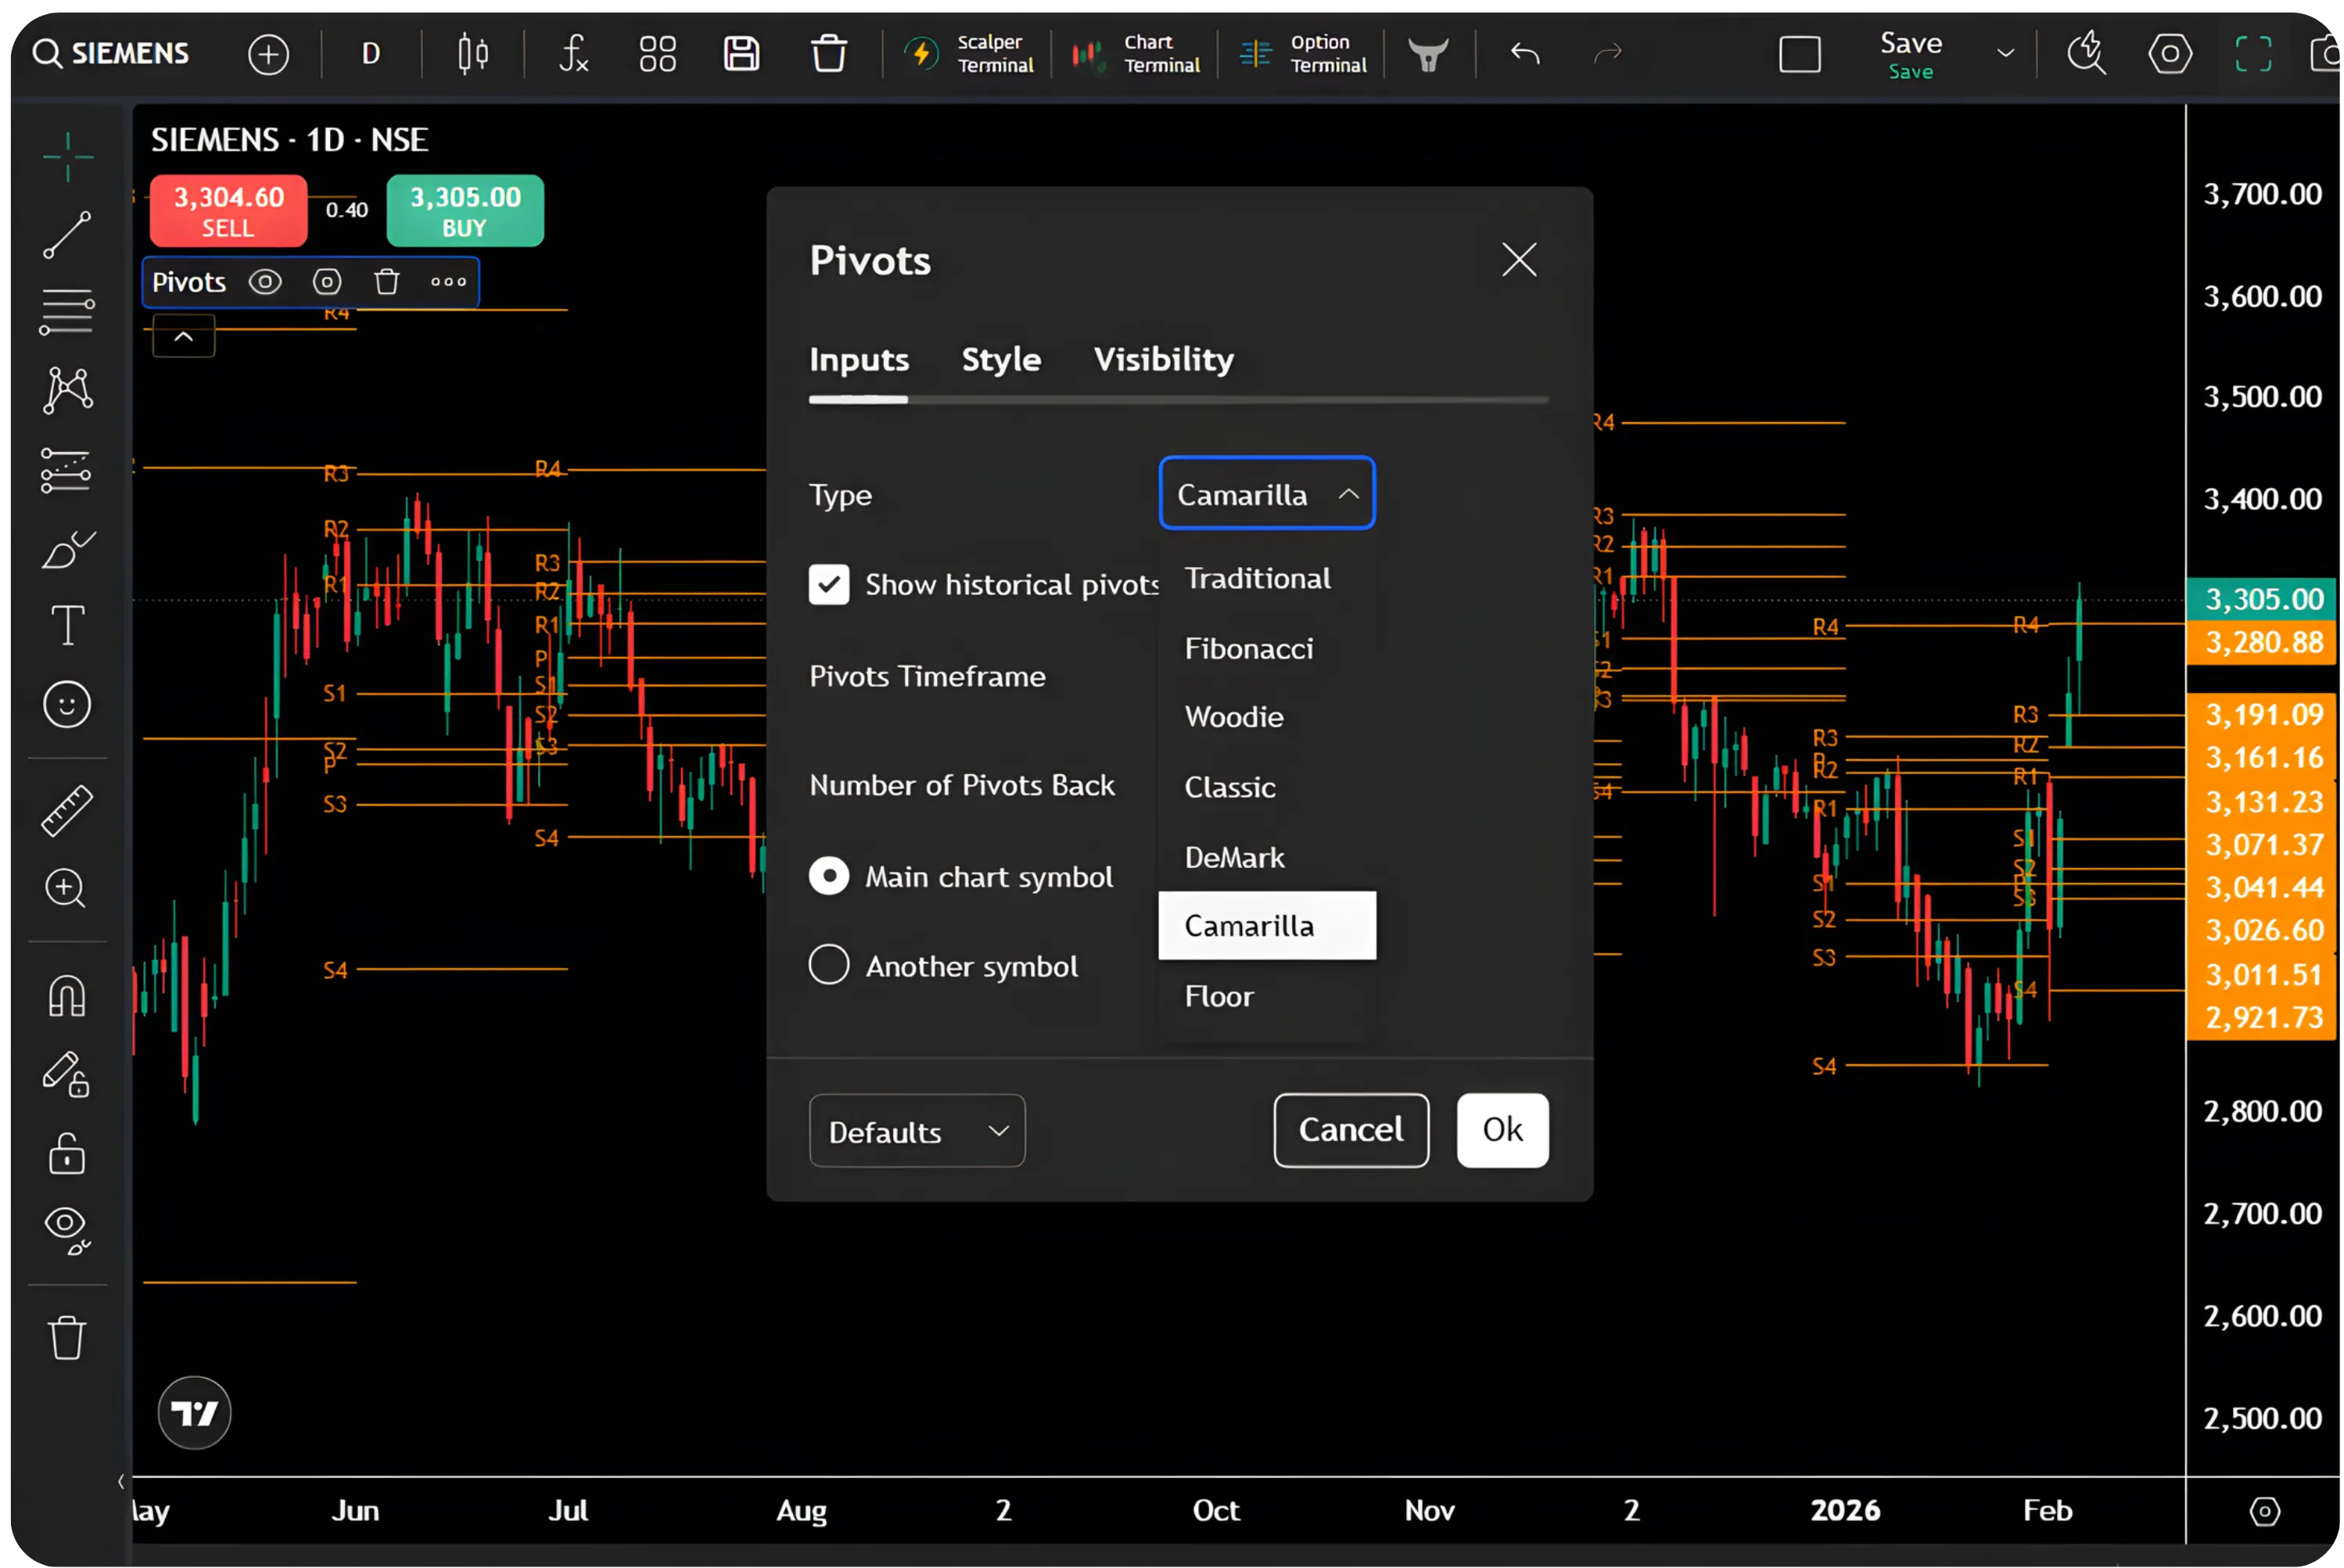
Before applying the strategy, it’s essential to set up Camarilla Pivots correctly on your charting platform. On Tradejini’s Cube Plus, the process is straightforward:
- Open any stock chart and navigate to the top navigation bar, then click on “Indicators.”
- In the search box, type “Pivot Points Standard” and add it to the chart.
- Once applied, open the indicator Settings, go to the Inputs tab, and select “Camarilla” from the Type dropdown menu.
- Keep all other parameters unchanged. The chart will instantly plot the full set of Camarilla levels (S1–S6 and R1–R6)
- To make the chart look clearer and less cluttered, you can display only P, S3/S4, and R3/R4 levels.
The Four Trading Scenarios
Camarilla trading is built around four distinct scenarios based on where the price opens relative to key levels:
Scenario 1: Open Between R3 and S3 (Range-Bound Trading)
This is the most common scenario, representing a neutral market opening within the previous day's expected range.
| Setup Type | Entry Condition | Entry Trigger | Stop-Loss | Target |
|---|---|---|---|---|
| Long Setup | Price dips below S3 | Buy when price rebounds above S3 |
Below S4 | R3 |
| Short Setup | Price moves above R3 | Sell when price falls back below R3 |
Above R4 | S3 |
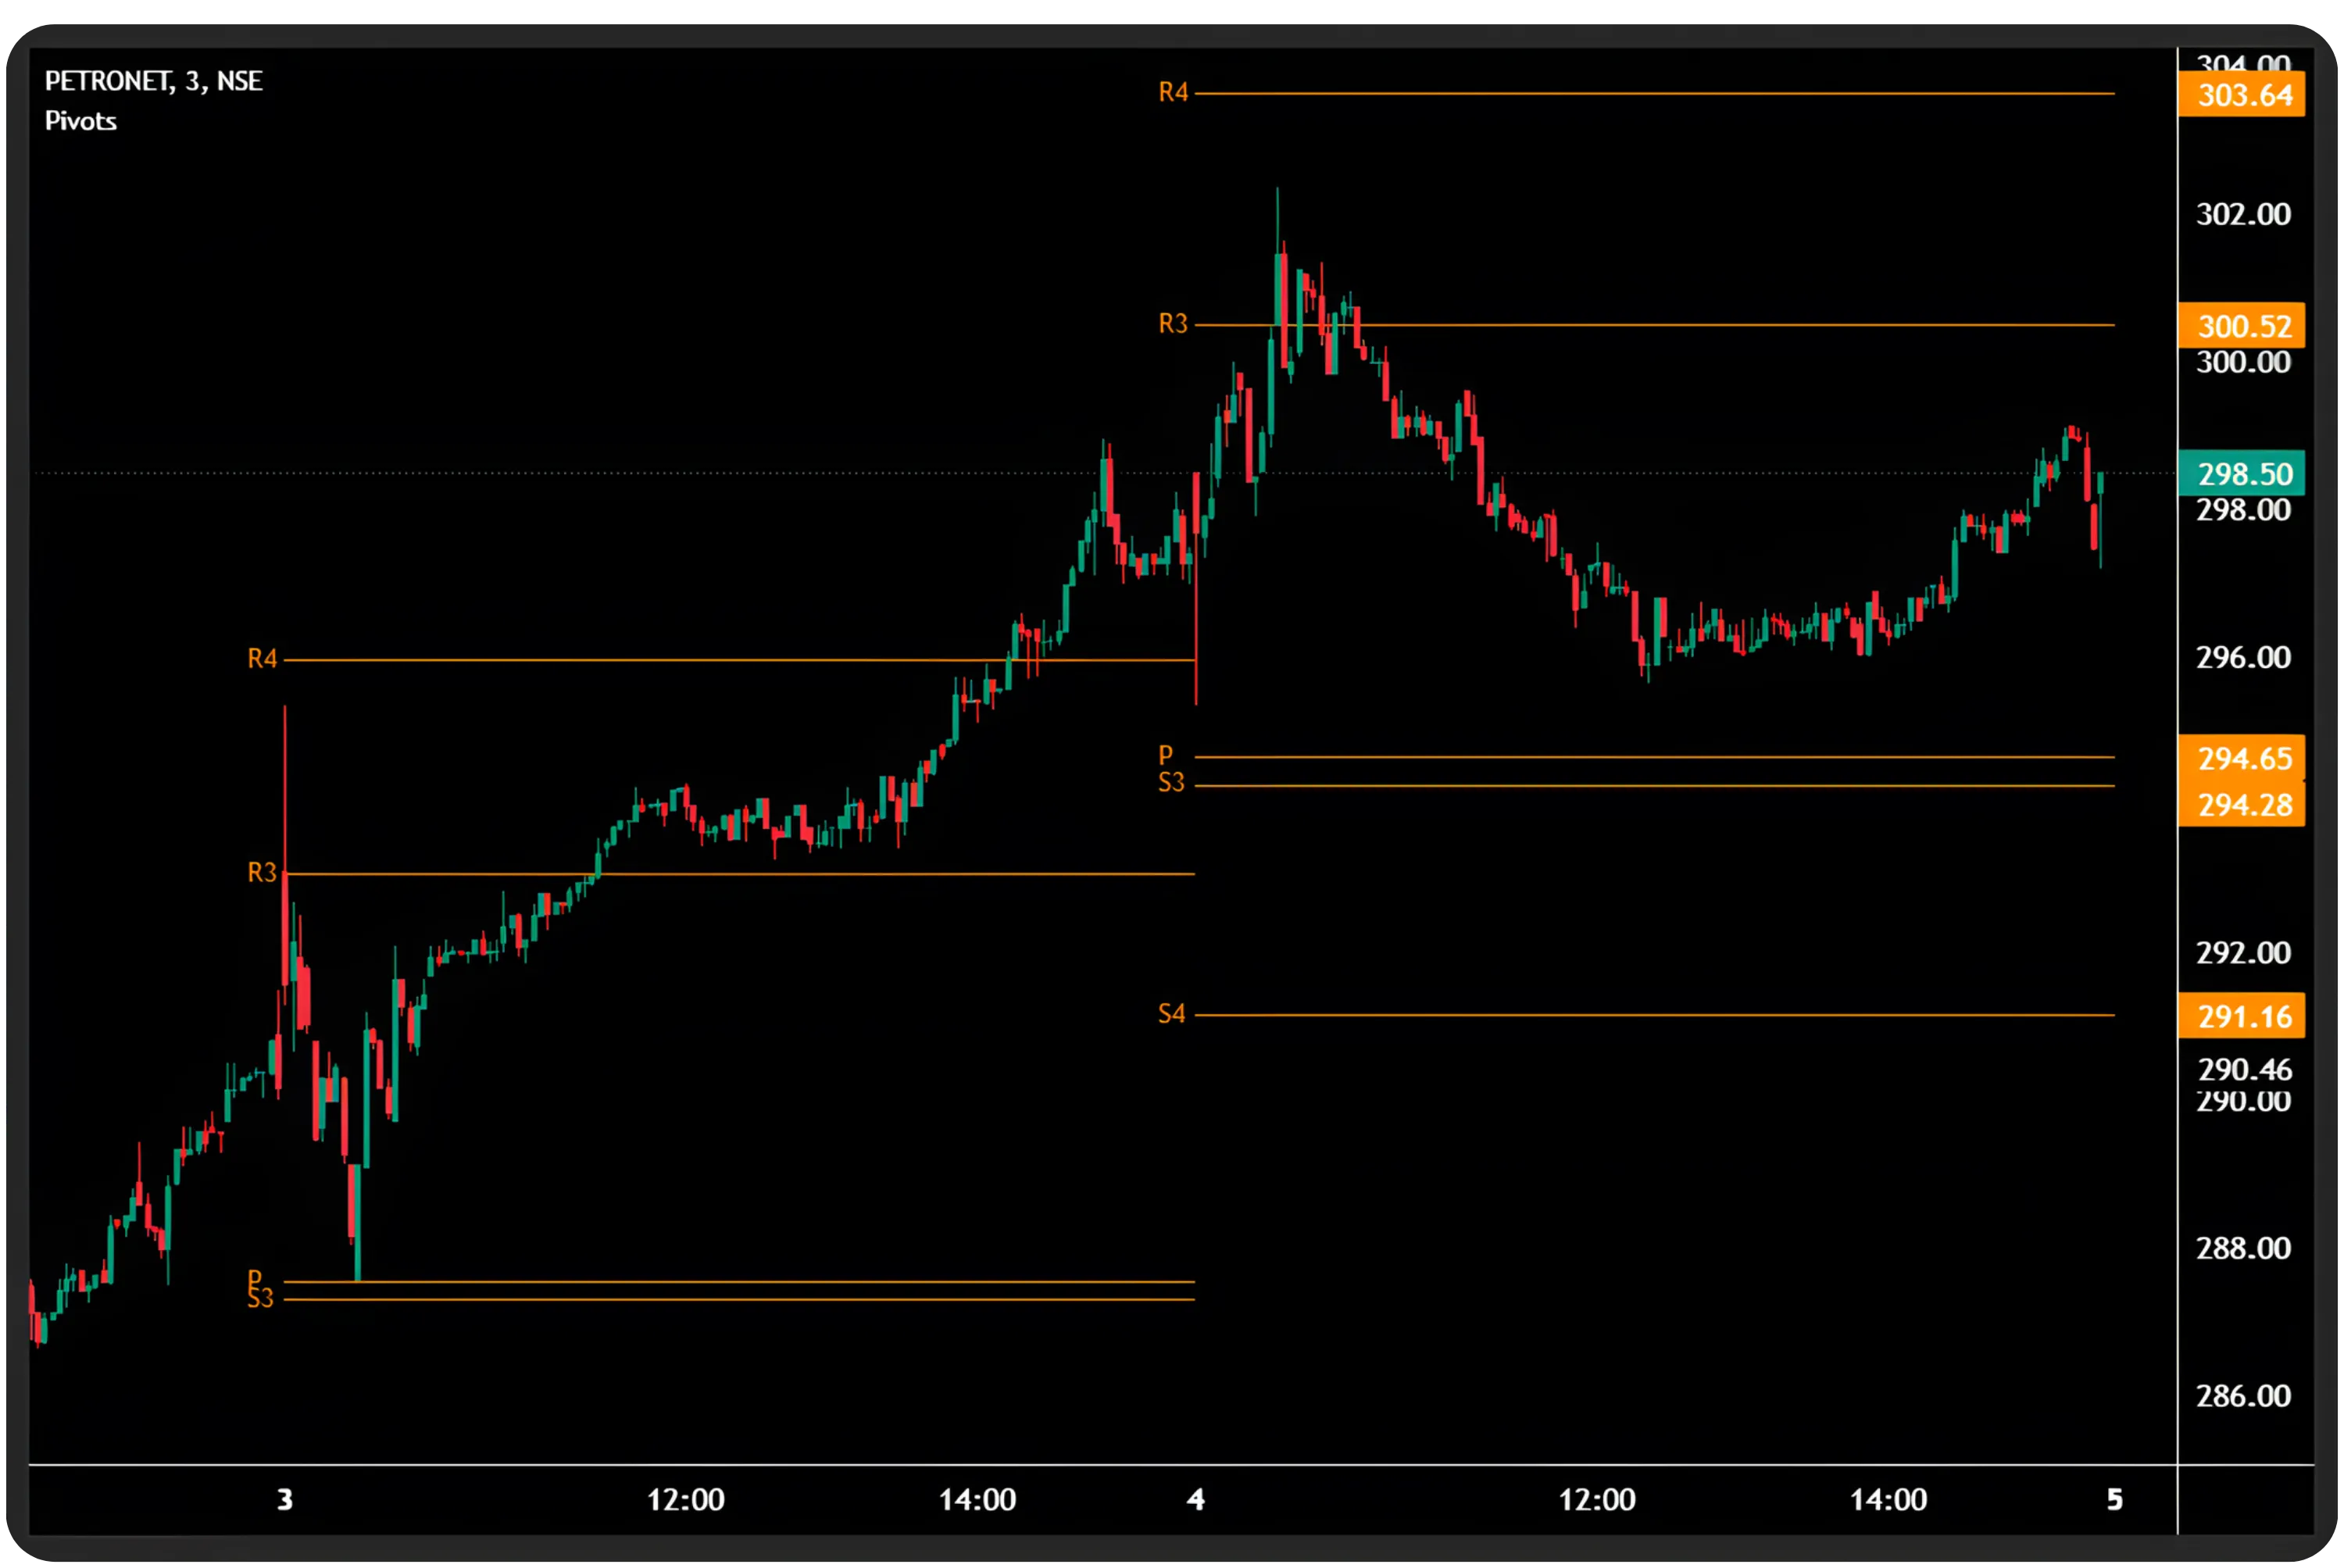
Example for short set up given below :Petronet
On 3rd February, the price crossed above S3 at 286 and rallied to 293 (R3), eventually moving past 297 (R4). Traders could have initiated long positions on the recovery above S3, with a stop-loss below S2, and trailed the position as price moved towards R3 and R4.
On 4th February, the price fell back below 300, which acted as R3, and declined to 296. This offered a short-selling opportunity on the breakdown below R3, with a stop-loss above R3/R4, while a trailing stop-loss would have helped in locking in profits even though S3 was not retested.
Scenario 2: Open Between R3 and R4 (Bullish Bias)
The stock opens with positive momentum, suggesting potential upside continuation.
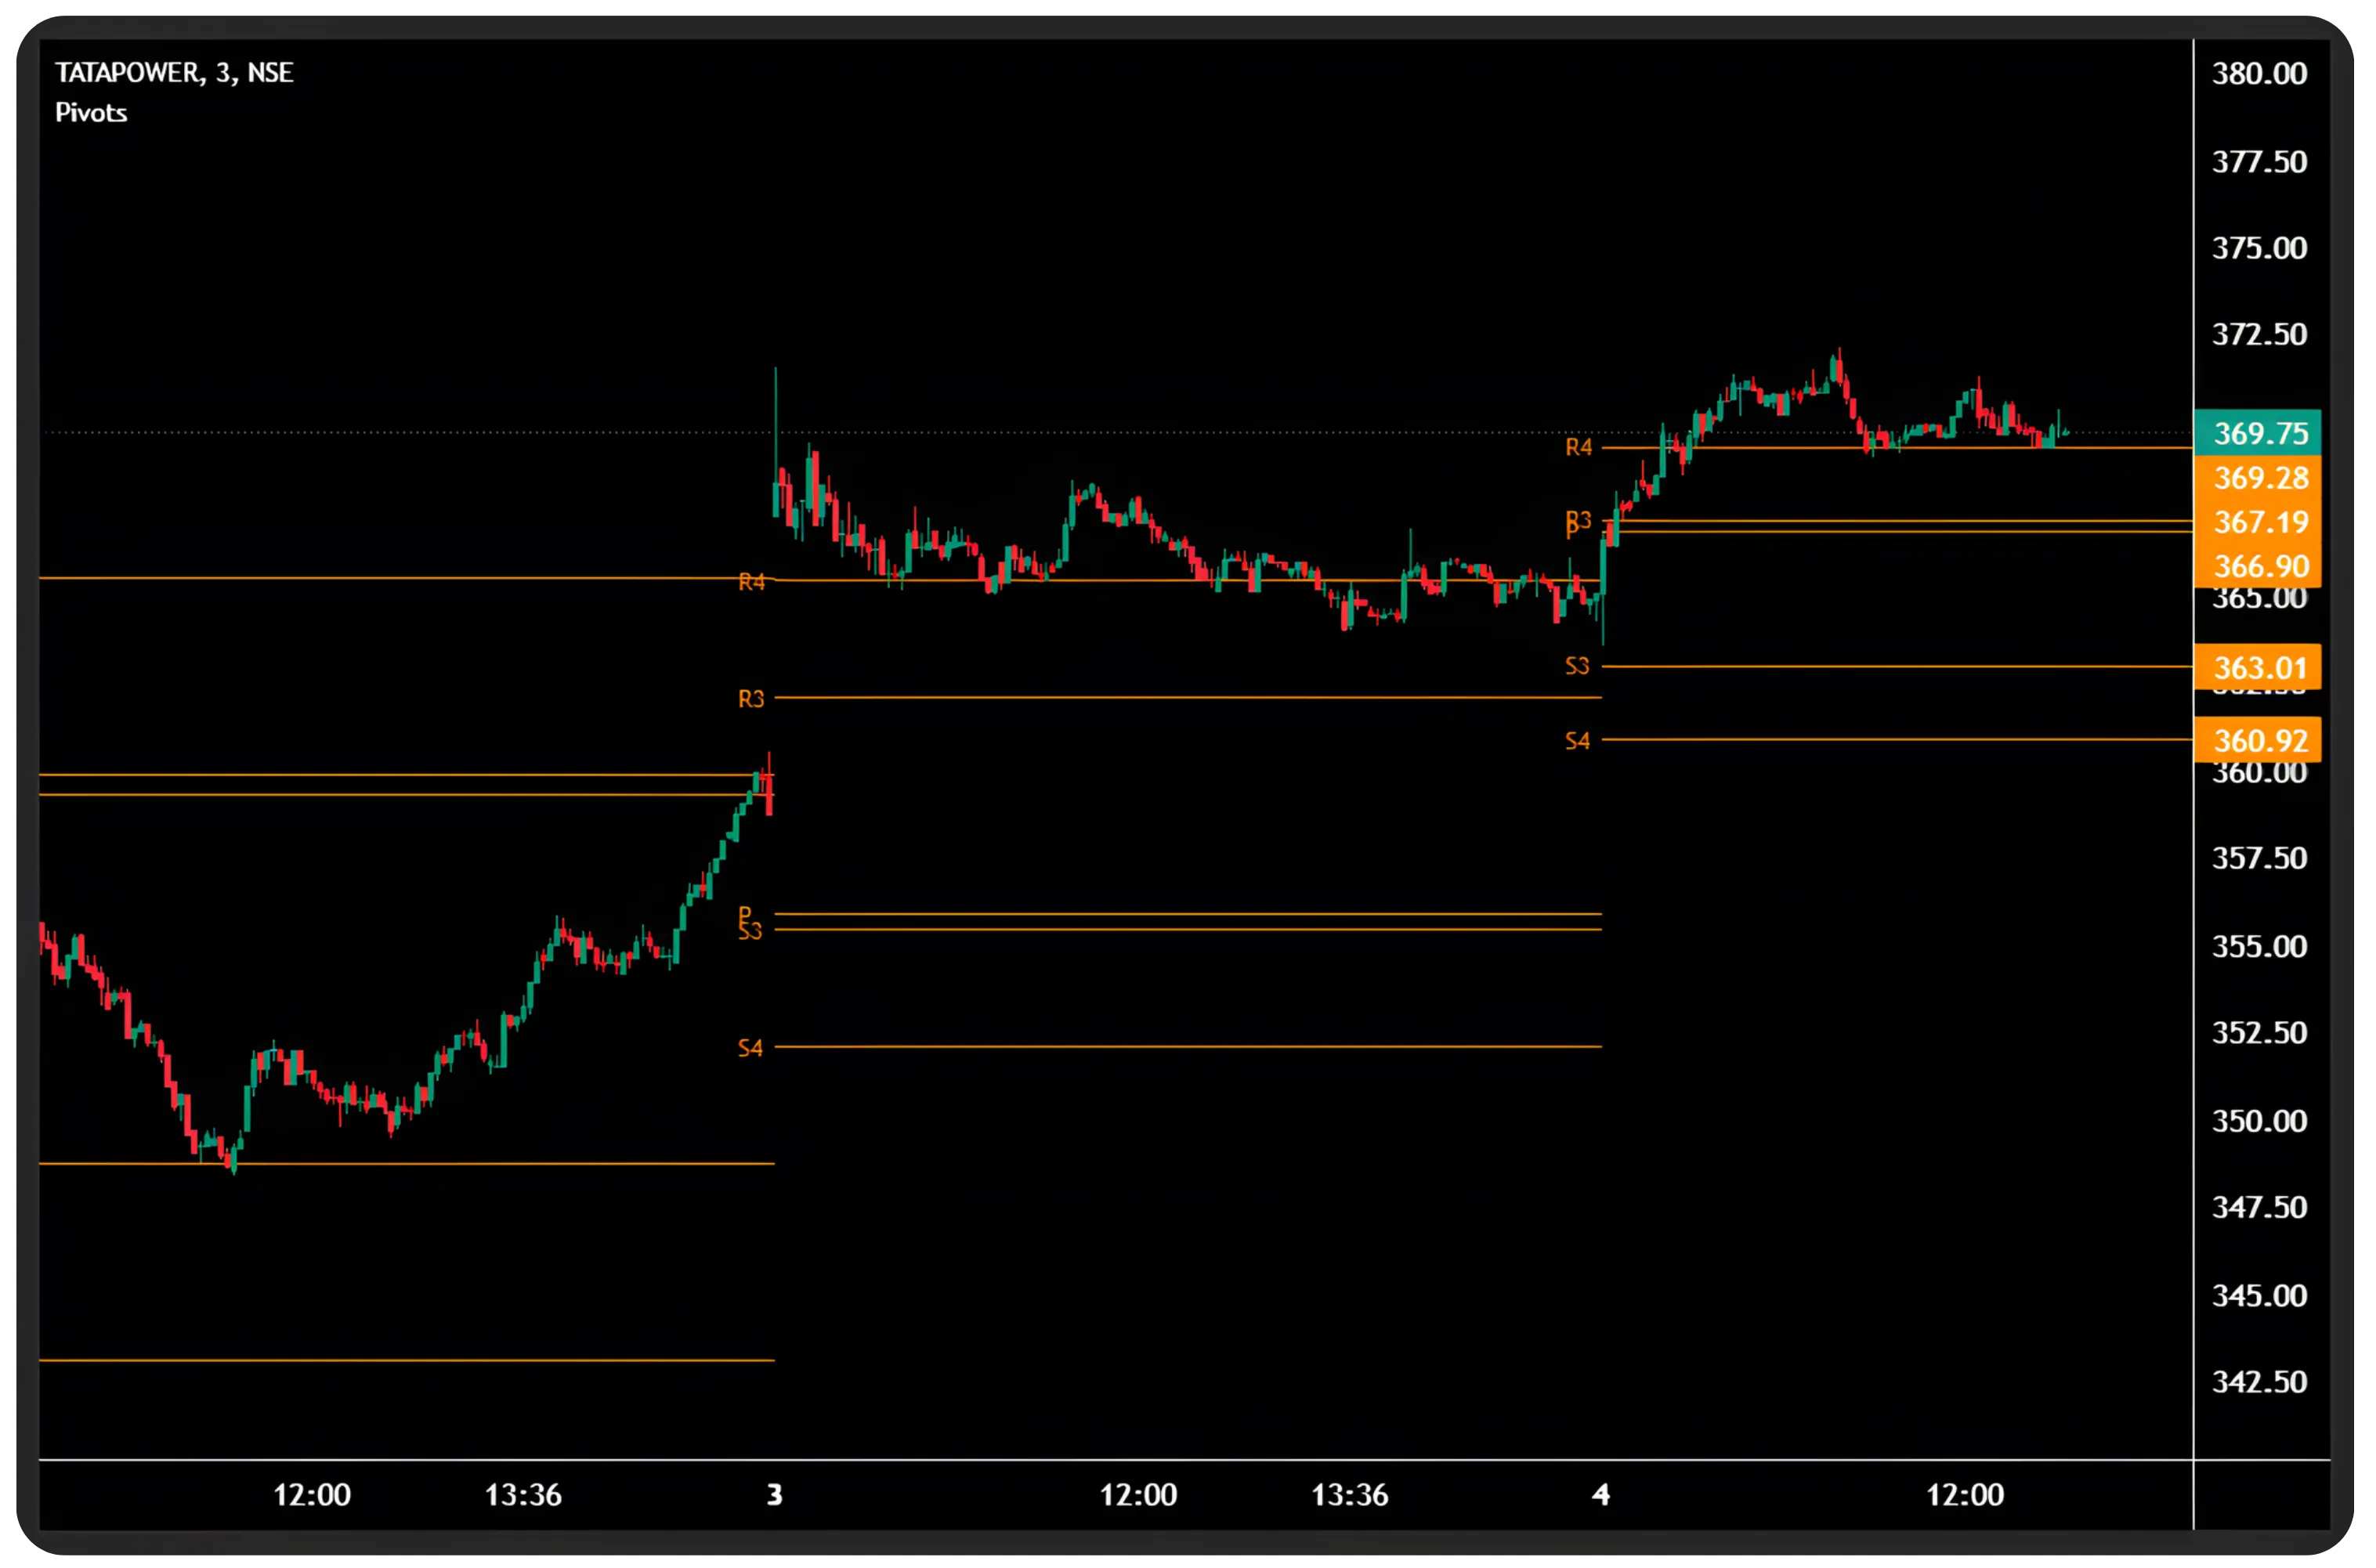
Example : Tatapower opened above R3 and rallied all way to R5 , partial profit booking can be done at R4 level and complete exit at R5
| Setup Type | Entry Condition | Entry Trigger | Stop-Loss | Target 1 |
|---|---|---|---|---|
| Long Setup | Price breaks above R3 | Buy above R3 | R2 | R4 / R5 |
| Short Setup | Price fails at R3 | Sell on drop below R3 |
R4 | S3 / S2 |
Scenario 3: Open Between S3 and S4 (Bearish Bias)
The stock opens weak, indicating potential downside pressure.
| Setup Type | Entry Condition | Entry Trigger | Stop-Loss | Target 1 |
|---|---|---|---|---|
| Long Setup | Price dips below S3 and recovers |
Buy when price moves back above S3 |
S4 | R1 |
| Short Setup | Price breaks below S4 | Sell on breakdown below S4 |
S3 | S5 |
Scenario 4: Open Outside R4/S4 (Gap Opening)
Exercise patience. Wait for price to return within the R4-S4 range before taking positions according to the relevant scenario.
Real Market Examples Using Tradejini’s CubePlus
Let's examine four live examples from the NSE to see how Camarilla Pivots perform in actual trading conditions.
Example 1: PowerIndia – Classic Range-Bound Reversal
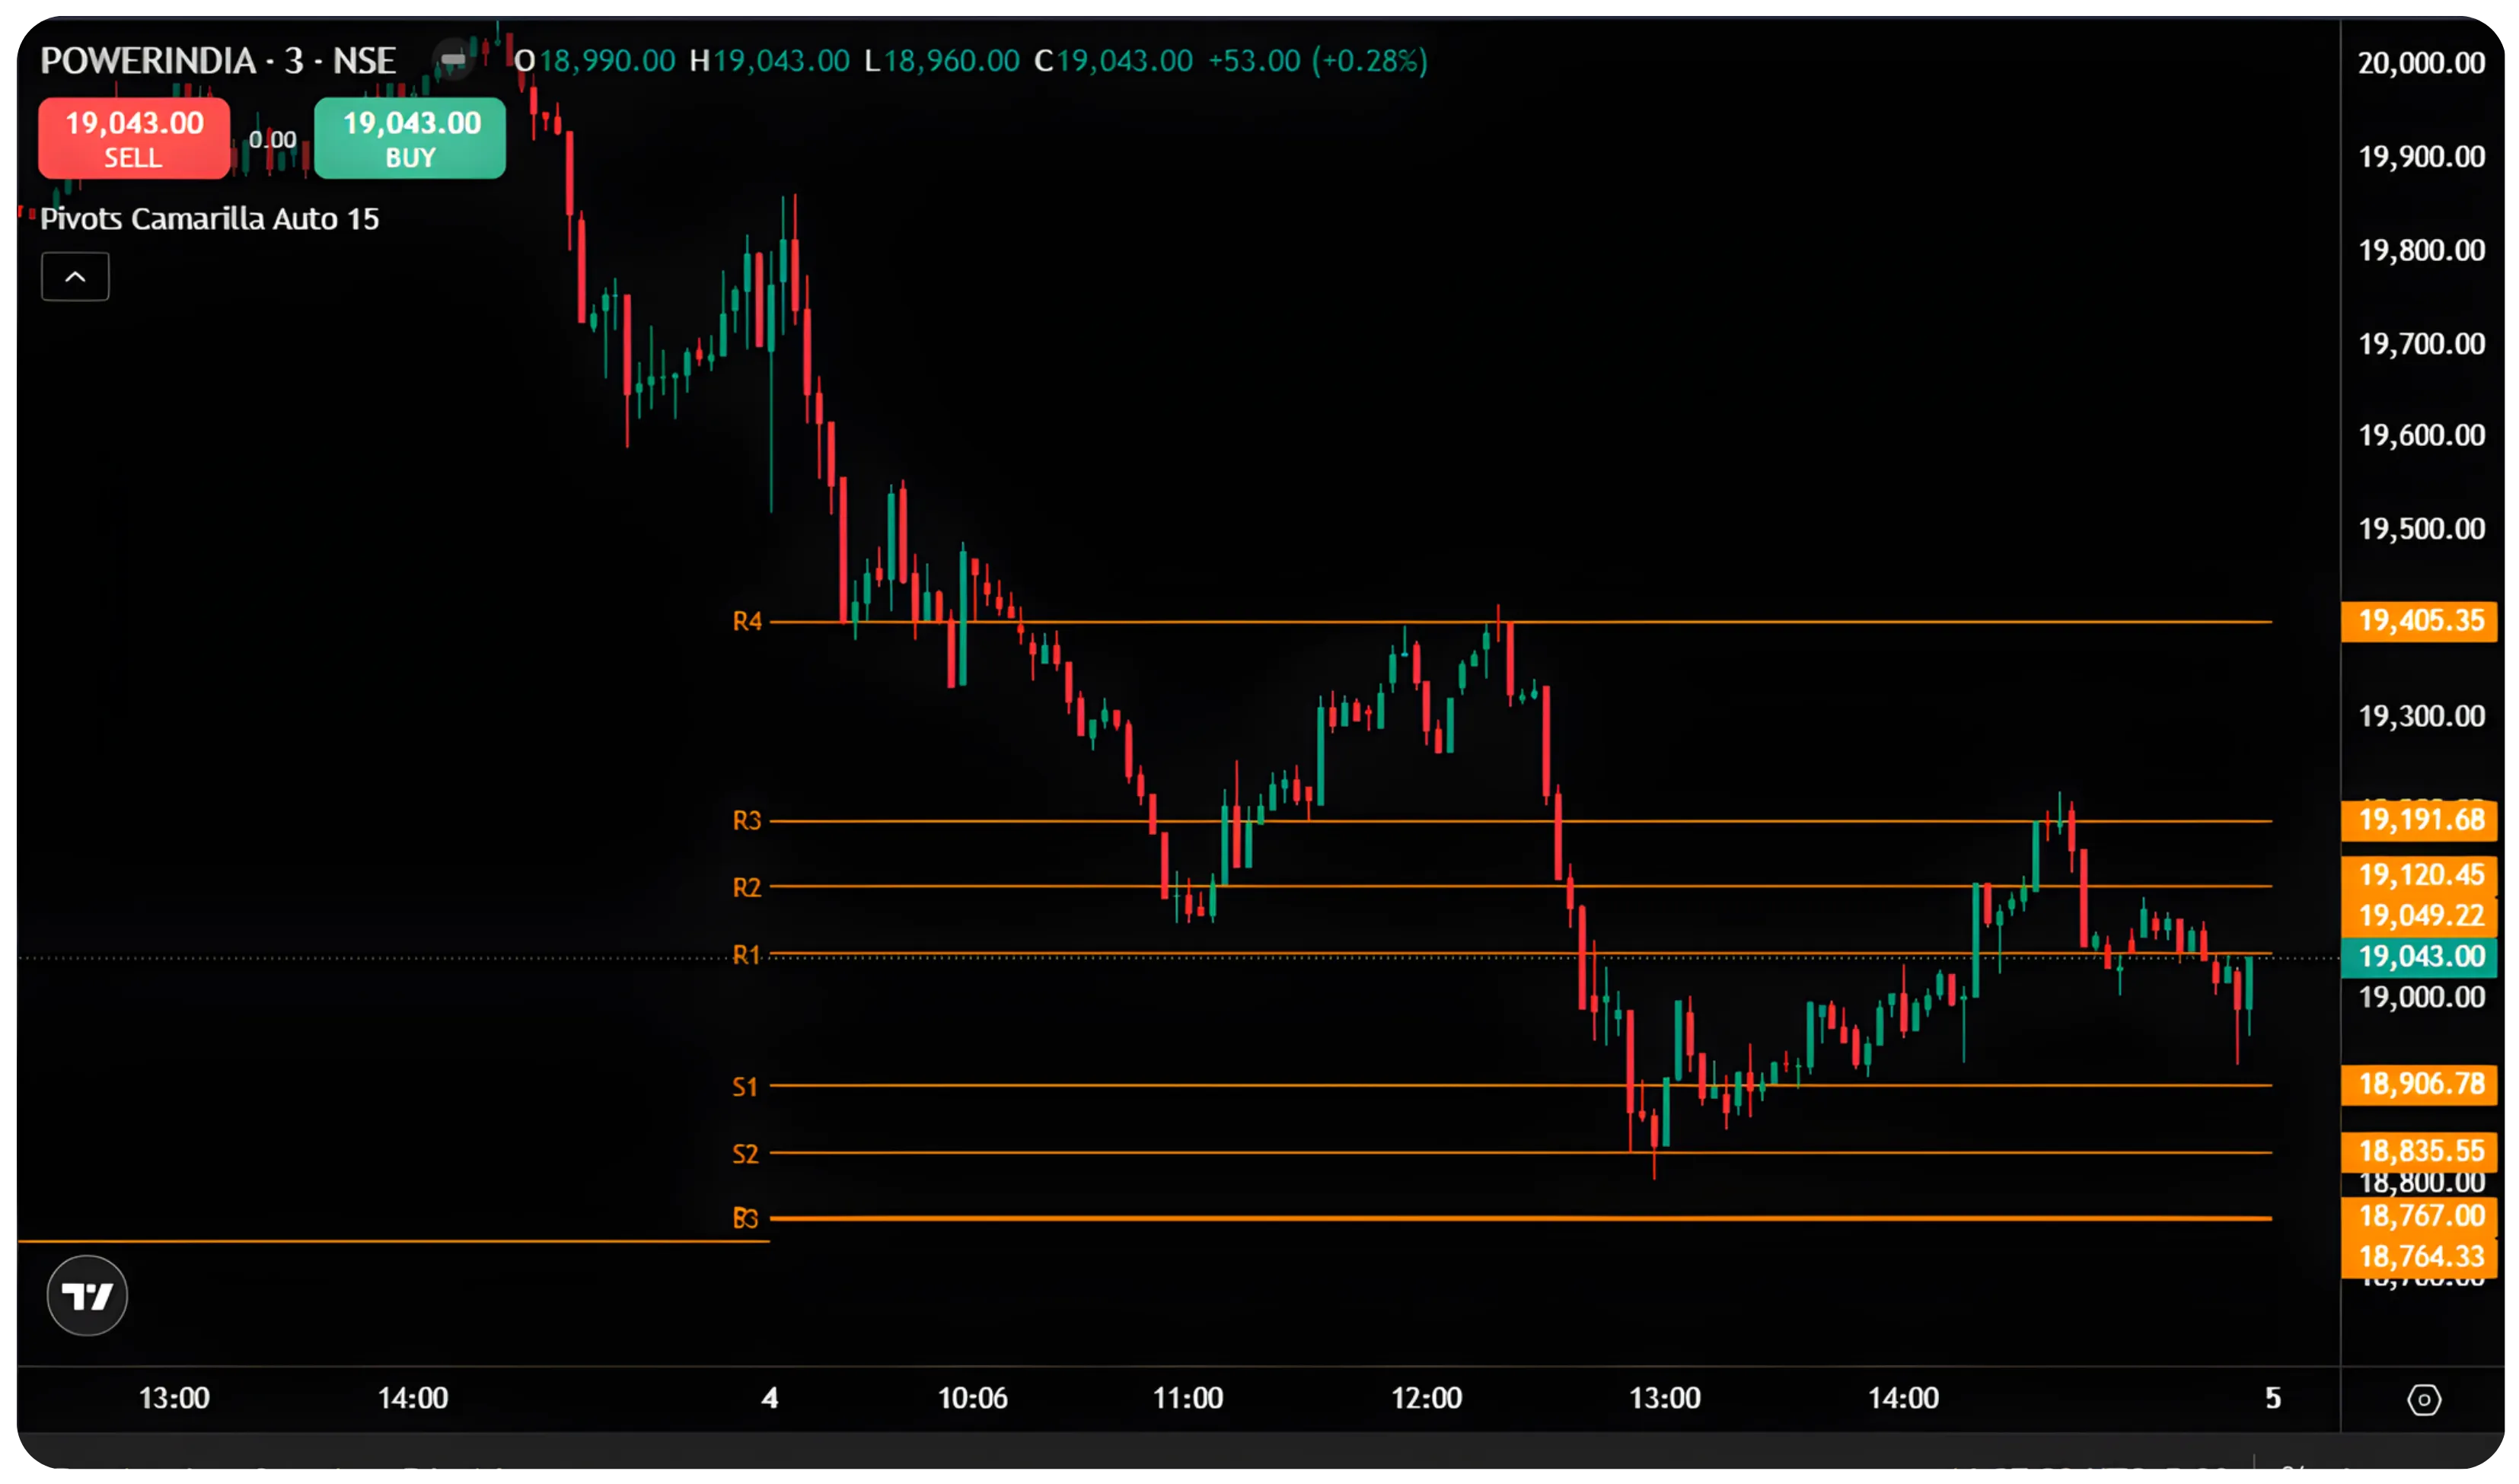
The Power India chart showcases textbook Scenario 1 behavior across multiple trading sessions. The stock opened above R4 (19,904), then declined toward R2 (19,120). It subsequently retraced back toward R4 (19,904), before declining again toward S2. Later, the price retraced to around 19,191 and finally closed at RA (19,043).
This price action provided multiple buying and selling opportunities for traders throughout the session.
Key Observation: Notice how price respected the S2 level (18835) as a hard floor. As the stock approached this zone, buyers stepped in aggressively, creating reversal opportunities. A long entry near S2 with a stop-loss below S3 would have yielded a profitable move back to the pivot and potentially R1.
The multi-day view also demonstrates how Camarilla levels recalibrate daily, providing fresh reference points. The R3 and R4 levels from earlier sessions (around 19,191 and 19,450) acted as resistance zones during upward moves, validating the strategy's predictive power.
Example 2: ITC – Retest of S2
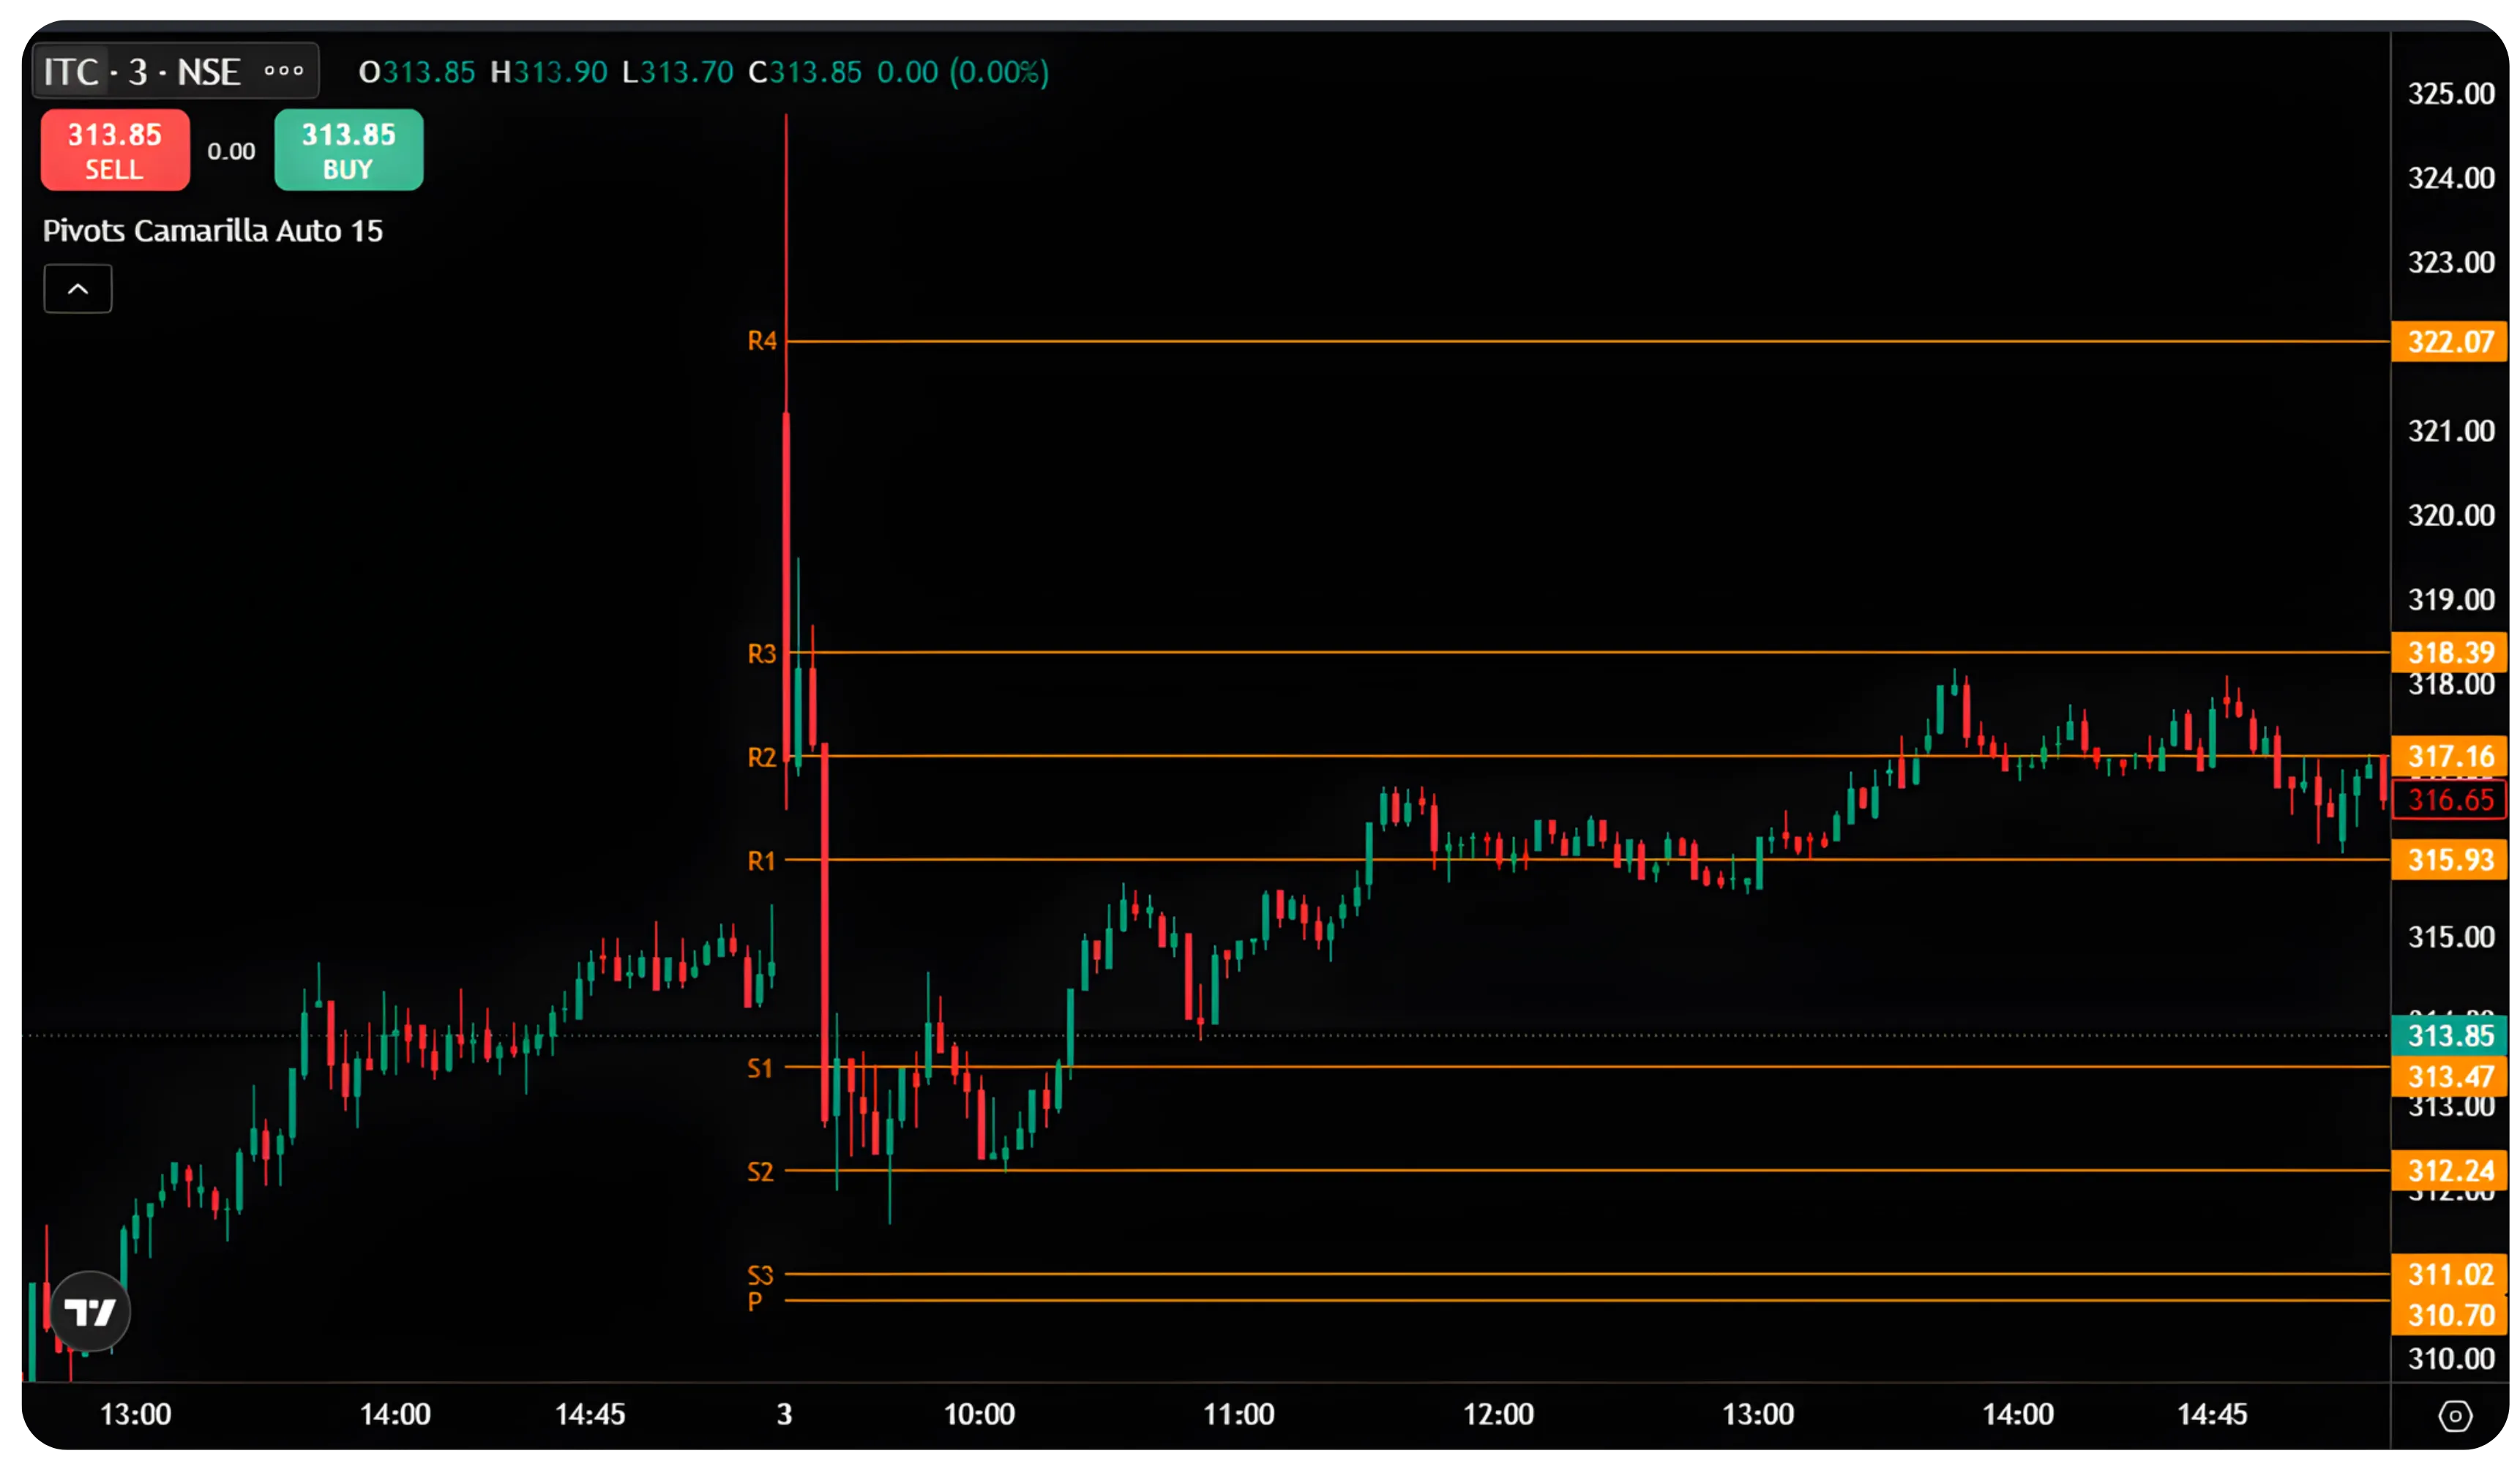
The ITC chart shows a textbook Camarilla setup with clear respect for price levels and multiple tradable opportunities. The stock opened above R3 at ₹321 and tested R4 quickly to get rejected, this indicates an exhaustion zone, where traders could initiate short positions near ₹317 (R2) with a stop above R4. Subsequently, price moved lower toward S2 at ₹312.24, a strong demand zone, where traders could cover shorts or attempt a cautious long with a stop below S3 at ₹311.02. The bounce from S2 carried the stock back toward the R1 ₹315, where partial profits could be booked as price entered the value area. The session ultimately ended near the R3= ₹318, confirming a range-bound, rotational market rather than a trend day.
Overall, the day rewarded level-to-level trading: selling near R3–R4, buying or covering near S2, and scalping in between, with strict stops placed just beyond the Camarilla levels.
Example 3: Tata Power – Reversal from R4 Resistance
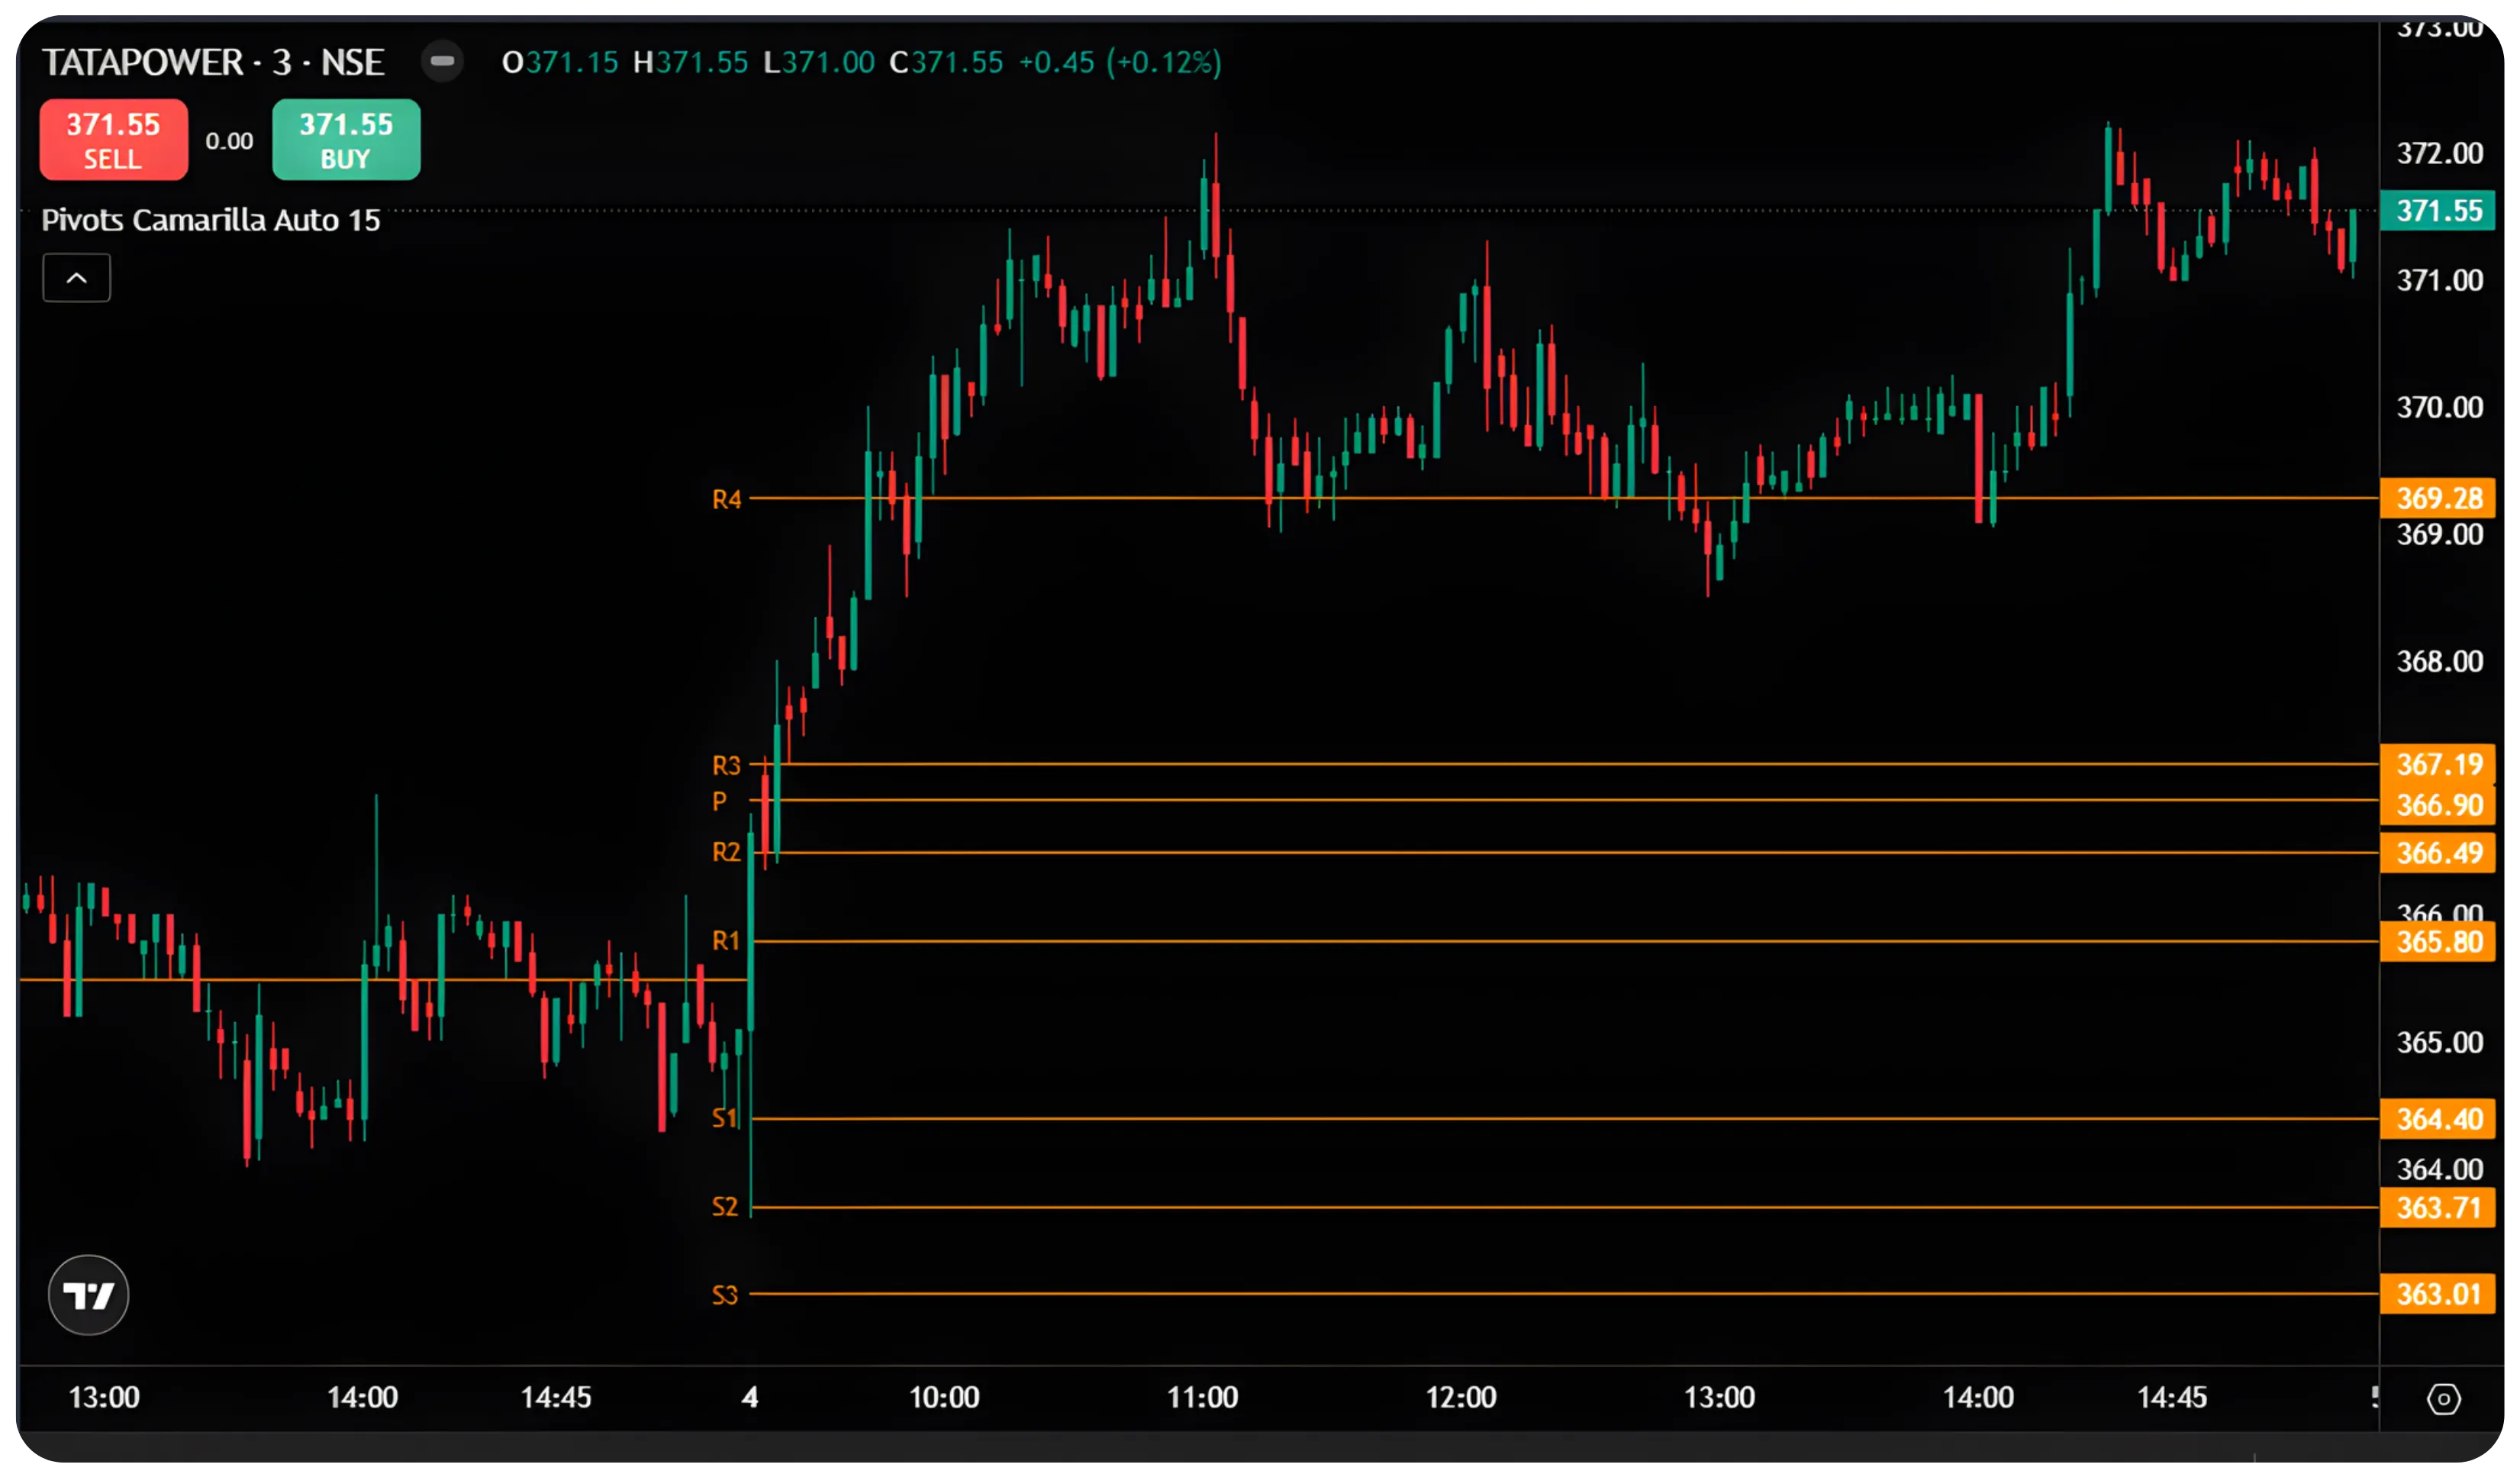
The Tata Power (3-minute) Camarilla chart reflects a strong trend-following day after an early range, with clear level-based trading opportunities. In the first half, price oscillated around the Pivot–R1 zone (₹365.80–₹366.49), indicating balance and low conviction. The decisive move came when price broke and held above R2 (₹366.90) and R3 (₹367.79), signaling acceptance above value. Traders could have entered long above R3 with a stop-loss below R2, as this transition often marks a shift from range to directional bias. Momentum carried the stock toward R4 (₹369.28), where partial profits were logical due to expected supply. After a brief consolidation above R4 confirming strength rather than rejection, price continued higher, offering buy-on-dips opportunities as long as pullbacks held above R3/R4. The session later saw price trade around ₹371–372, validating the breakout and rewarding trend riders who trailed stops below rising swing lows or below R4. Overall, the day favored breakout-and-hold longs above R3, avoided shorts (no rejection at R4), and emphasized riding strength rather than fading levels.
Why Camarilla Pivots Work?
Automated Daily Levels: Platforms like Tradejini CubePlus automatically calculate and display Camarilla levels every trading day, eliminating manual calculations and saving precious time.
Clear Risk Management: Every setup comes with predefined stop-losses and targets, taking the guesswork out of position sizing and risk control.
Multiple Profit Targets: The tiered target structure (R1, R2, R3 or S1, S2, S3) allows for partial profit booking, locking in gains while letting winners run.
Adaptable Across Markets: Whether you trade large-caps like Reliance or mid-caps like PowerIndia, Camarilla Pivots adapt to the volatility and range of each security.
Pro Tips for Success
Combine with Volume Analysis: A breakout above R4 or below S4 carries more conviction when accompanied by above-average volume. Weak volume signals potential false breakouts.
Layer in Technical Indicators: Adding a 20-period EMA or RSI can filter out low-probability trades. For instance, avoid long setups at R3 when RSI shows overbought conditions above 70.
Respect the First Hour: The first 15-30 minutes often produce false signals due to overnight gaps and early volatility. Wait for the dust to settle before committing capital.
Adapt or Die: Nick Scott's famous mantra still holds true. Market conditions change. Some days favor breakout trading (Scenario 2 and 3), while others reward mean reversion (Scenario 1). Stay flexible and let price action guide your approach.
Building Your Edge
Camarilla Pivots aren't a magic bullet, but they provide something equally valuable: structure. In the chaos of intraday price movement, having clearly defined levels transforms random speculation into calculated probability.
The examples from PowerIndia, ITC, Tata Power, and Reliance demonstrate that these levels aren't theoretical, they're battle-tested reference points where real money changes hands. Whether you're trading on Tradejini's CubePlus or any other platform offering Camarilla Pivots, the principles remain constant: patience, discipline, and relentless adaptation.
Start with small positions. Master one scenario before moving to the next. Track your win rate and average profit/loss at each level. Over time, you'll develop an intuitive feel for which setups work best in different market conditions. and that's when Camarilla Pivots truly become a competitive advantage.
Remember Nick Scott's wisdom: Do the same dance as everyone else, but learn to sit down before the music stops.
Disclaimer: The information provided in our blogs is for informational purposes only and should not be construed as financial, investment, or trading advice. Trading and investing in the securities market carries risk. Always conduct your own research and consult with a qualified financial advisor before making any investment decisions. Past performance is not indicative of future results. Copyrighted and original content for your trading and investing needs.
© 2026 — Tradejini. All Rights Reserved.