


Stock prices don’t always move smoothly. On some days, a stock may open at a price that’s significantly higher or lower than where it closed the previous day. This sudden shift creates what’s known as a price gap, a visible jump on the chart where no trading occurred between the two price points.
A gap occurs when the opening price of a stock is significantly higher or lower than the previous day's closing price. This creates a discontinuity in price, meaning the asset was not traded at certain levels in between. It can be surprising for traders when a stock closes at a certain price one day and opens at a noticeably different price the next. This sudden movement is referred to as a gap. In simpler terms, a gap happens when there is a noticeable ‘jump’ in the stock price from one trading session to the next. Candle patterns in stock market analysis often help traders understand these gaps better.
What exactly is a Gap?
Gaps can occur across any time frame, but they are most commonly observed on a daily time frame. In technical analysis, traders often say that gaps tend to be ‘filled,’ meaning the price eventually returns to the level where the gap occurred. This is where understanding support and resistance in stock market trends can help. However, this is not always guaranteed, as some gaps may never close depending on market conditions and the strength of the trend.
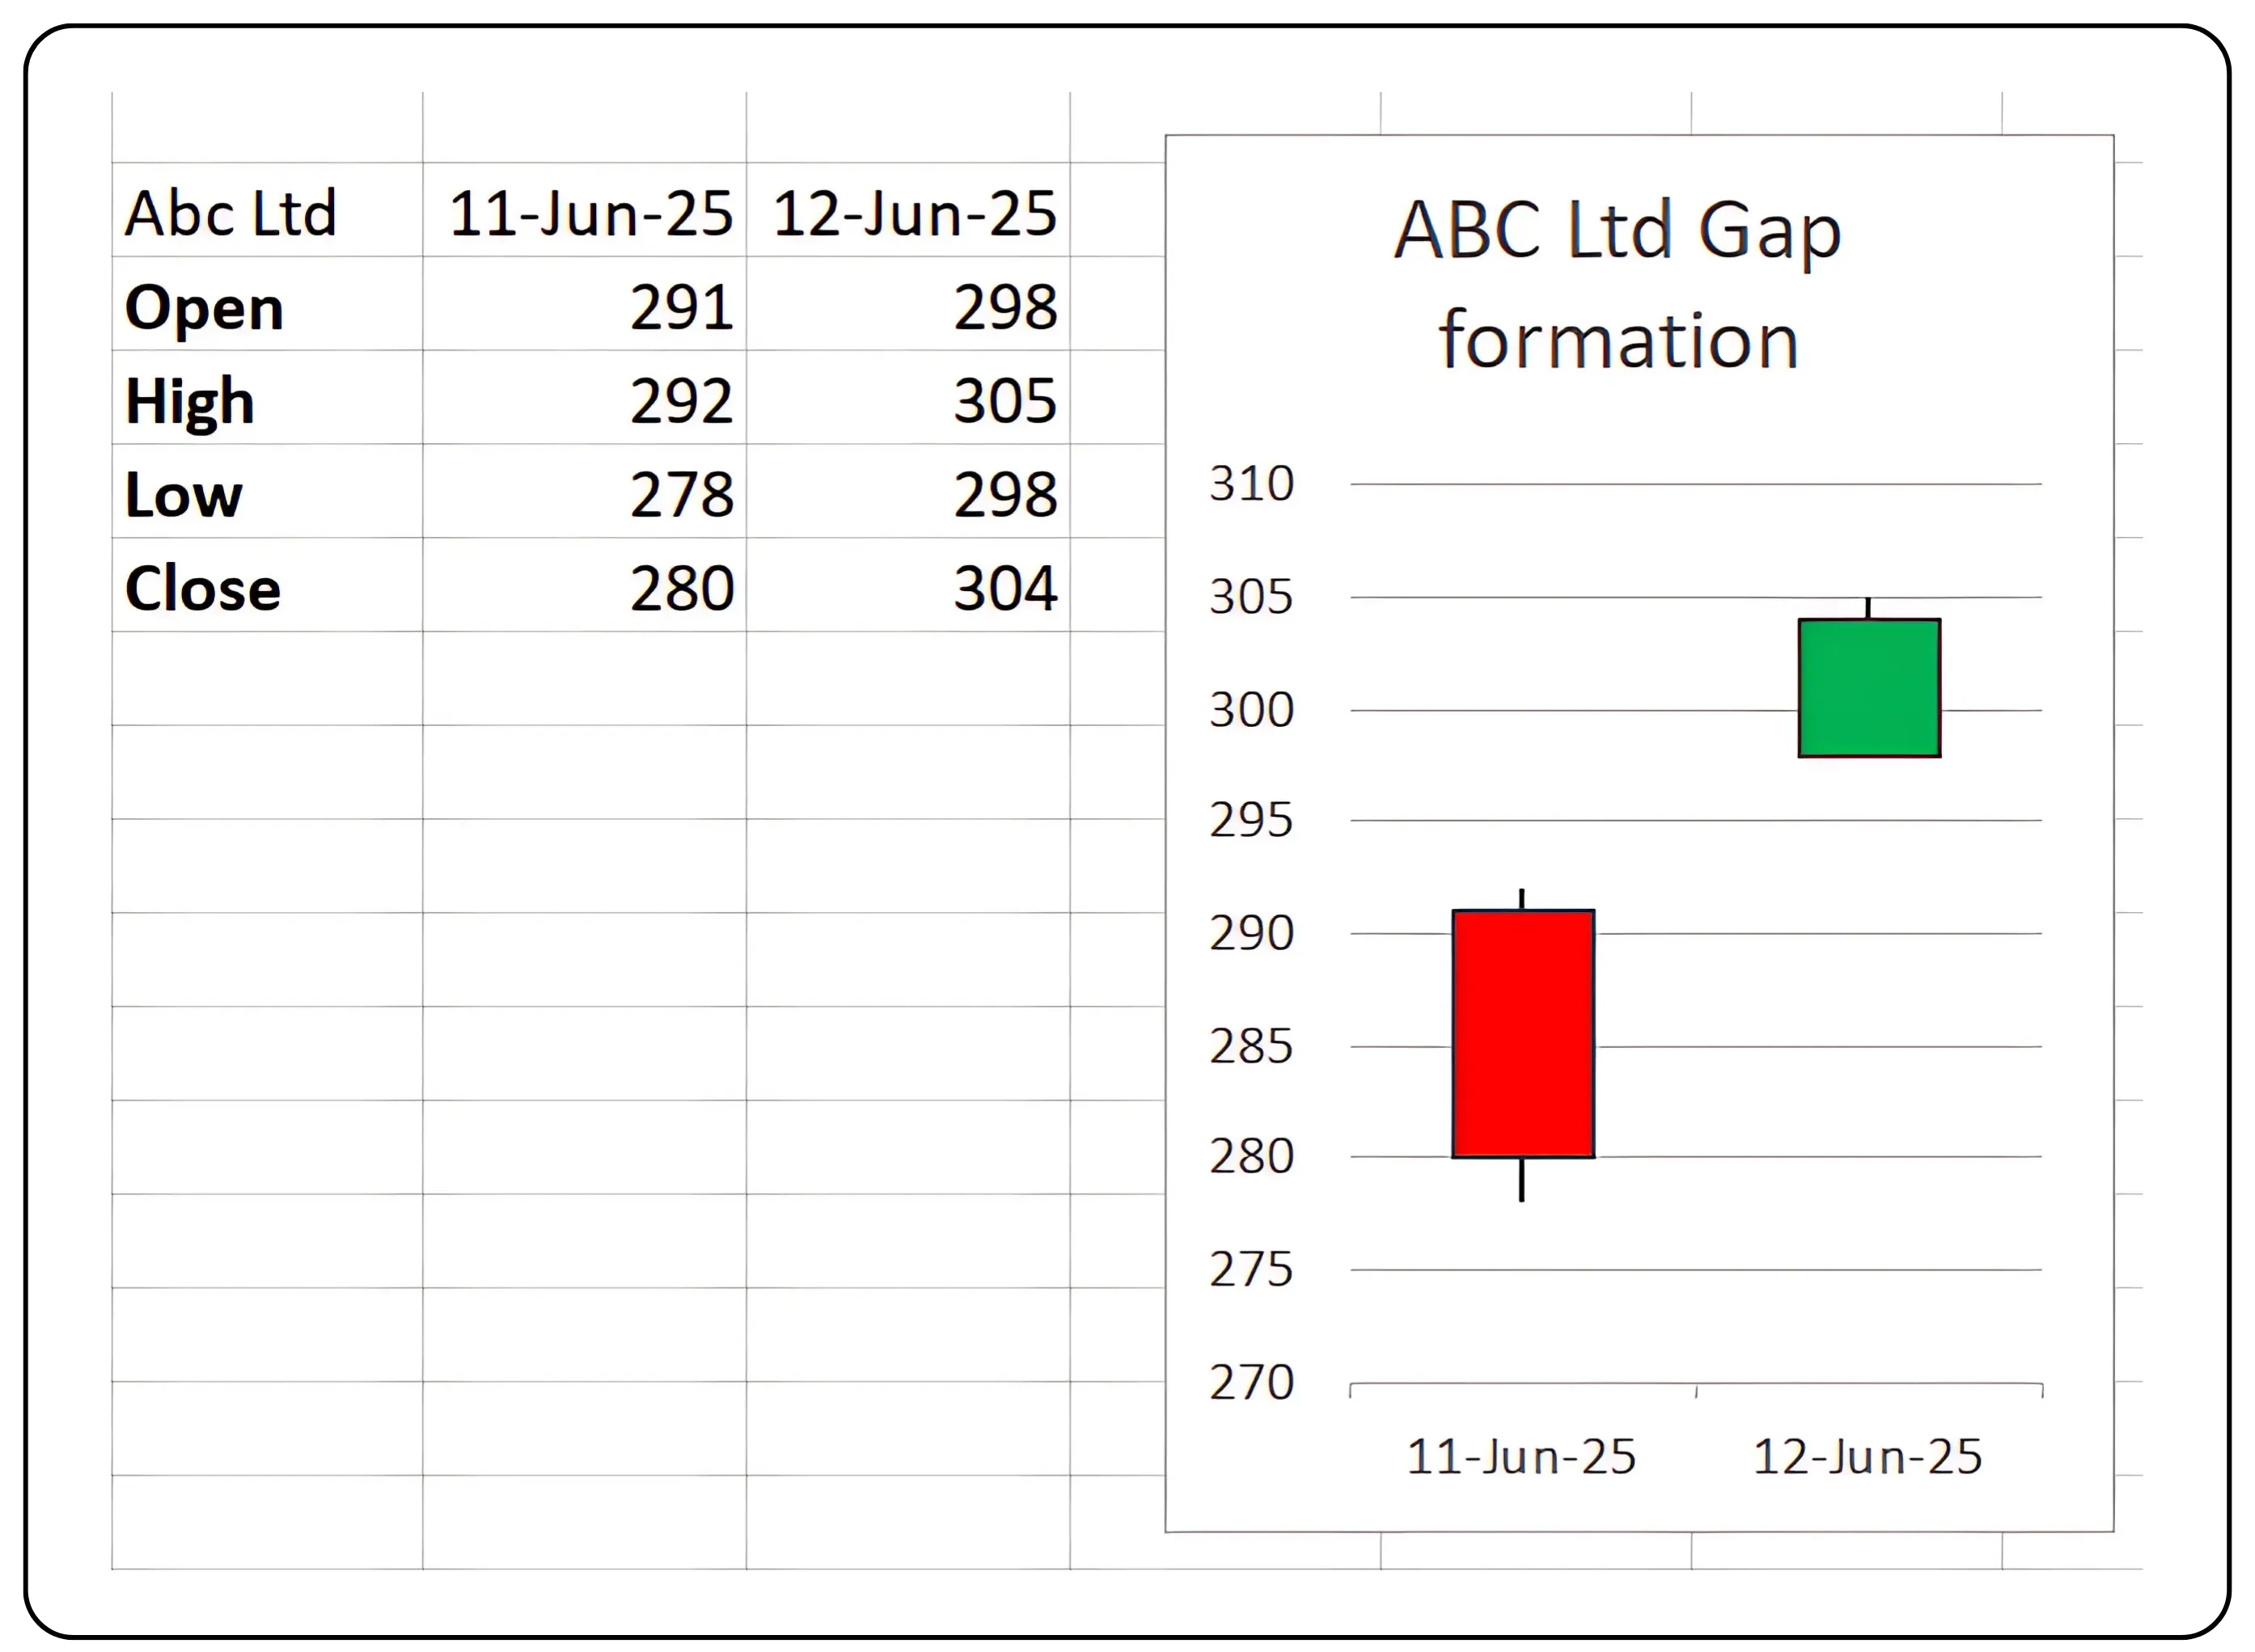
The stock of ABC Ltd. closed at ₹280 on 11th June 2025 and opened higher at ₹298 on 12th June 2025, creating a price gap.
The image below illustrates a gap down, where the price opens lower than the previous day's closing price.
The image below illustrates a gap up, where the price opens higher than the previous day's closing price.
On a daily basis, financial markets exhibit gaps, offering traders key insights into market sentiment and potential trend shifts.
Comparison of Gap Types in Trading
| Gap Type | Where It Appears | Volume | Trend Behavior | Gap Reaction | Trader Action |
|---|---|---|---|---|---|
| Area Gap | In sideways/range market | Low | No clear trend | Often gets filled quickly | Ignore or wait for breakout |
| Breakaway Gap | At the start of a new trend | High | Strong breakout from consolidation | Usually continues in breakout direction | Consider entry with confirmation |
| Continuation Gap | Midway in a strong trend | Moderate to High | Trend is strong and ongoing | Price continues to rise sharply after gap | Use it to measure potential targets |
| Exhaustion Gap | Near end of a trend | High, then declines | Final push before trend reverses or pauses | Reverses soon after gap | Warning to exit or avoid fresh entry |
There are four major Gaps as below
1. Area Gaps
Area gaps, sometimes called common gaps, usually pop up when the market is moving sideways. They can look dramatic at first glance, but they often close quickly, like someone changing their mind. You might see the price jump and then curl back within a couple of days, filling the gap. Traders often say these gaps “don’t go anywhere,” and that is a fair assessment.
Think of it like this: Area gaps are like mood swings, they look intense but settle down fast.
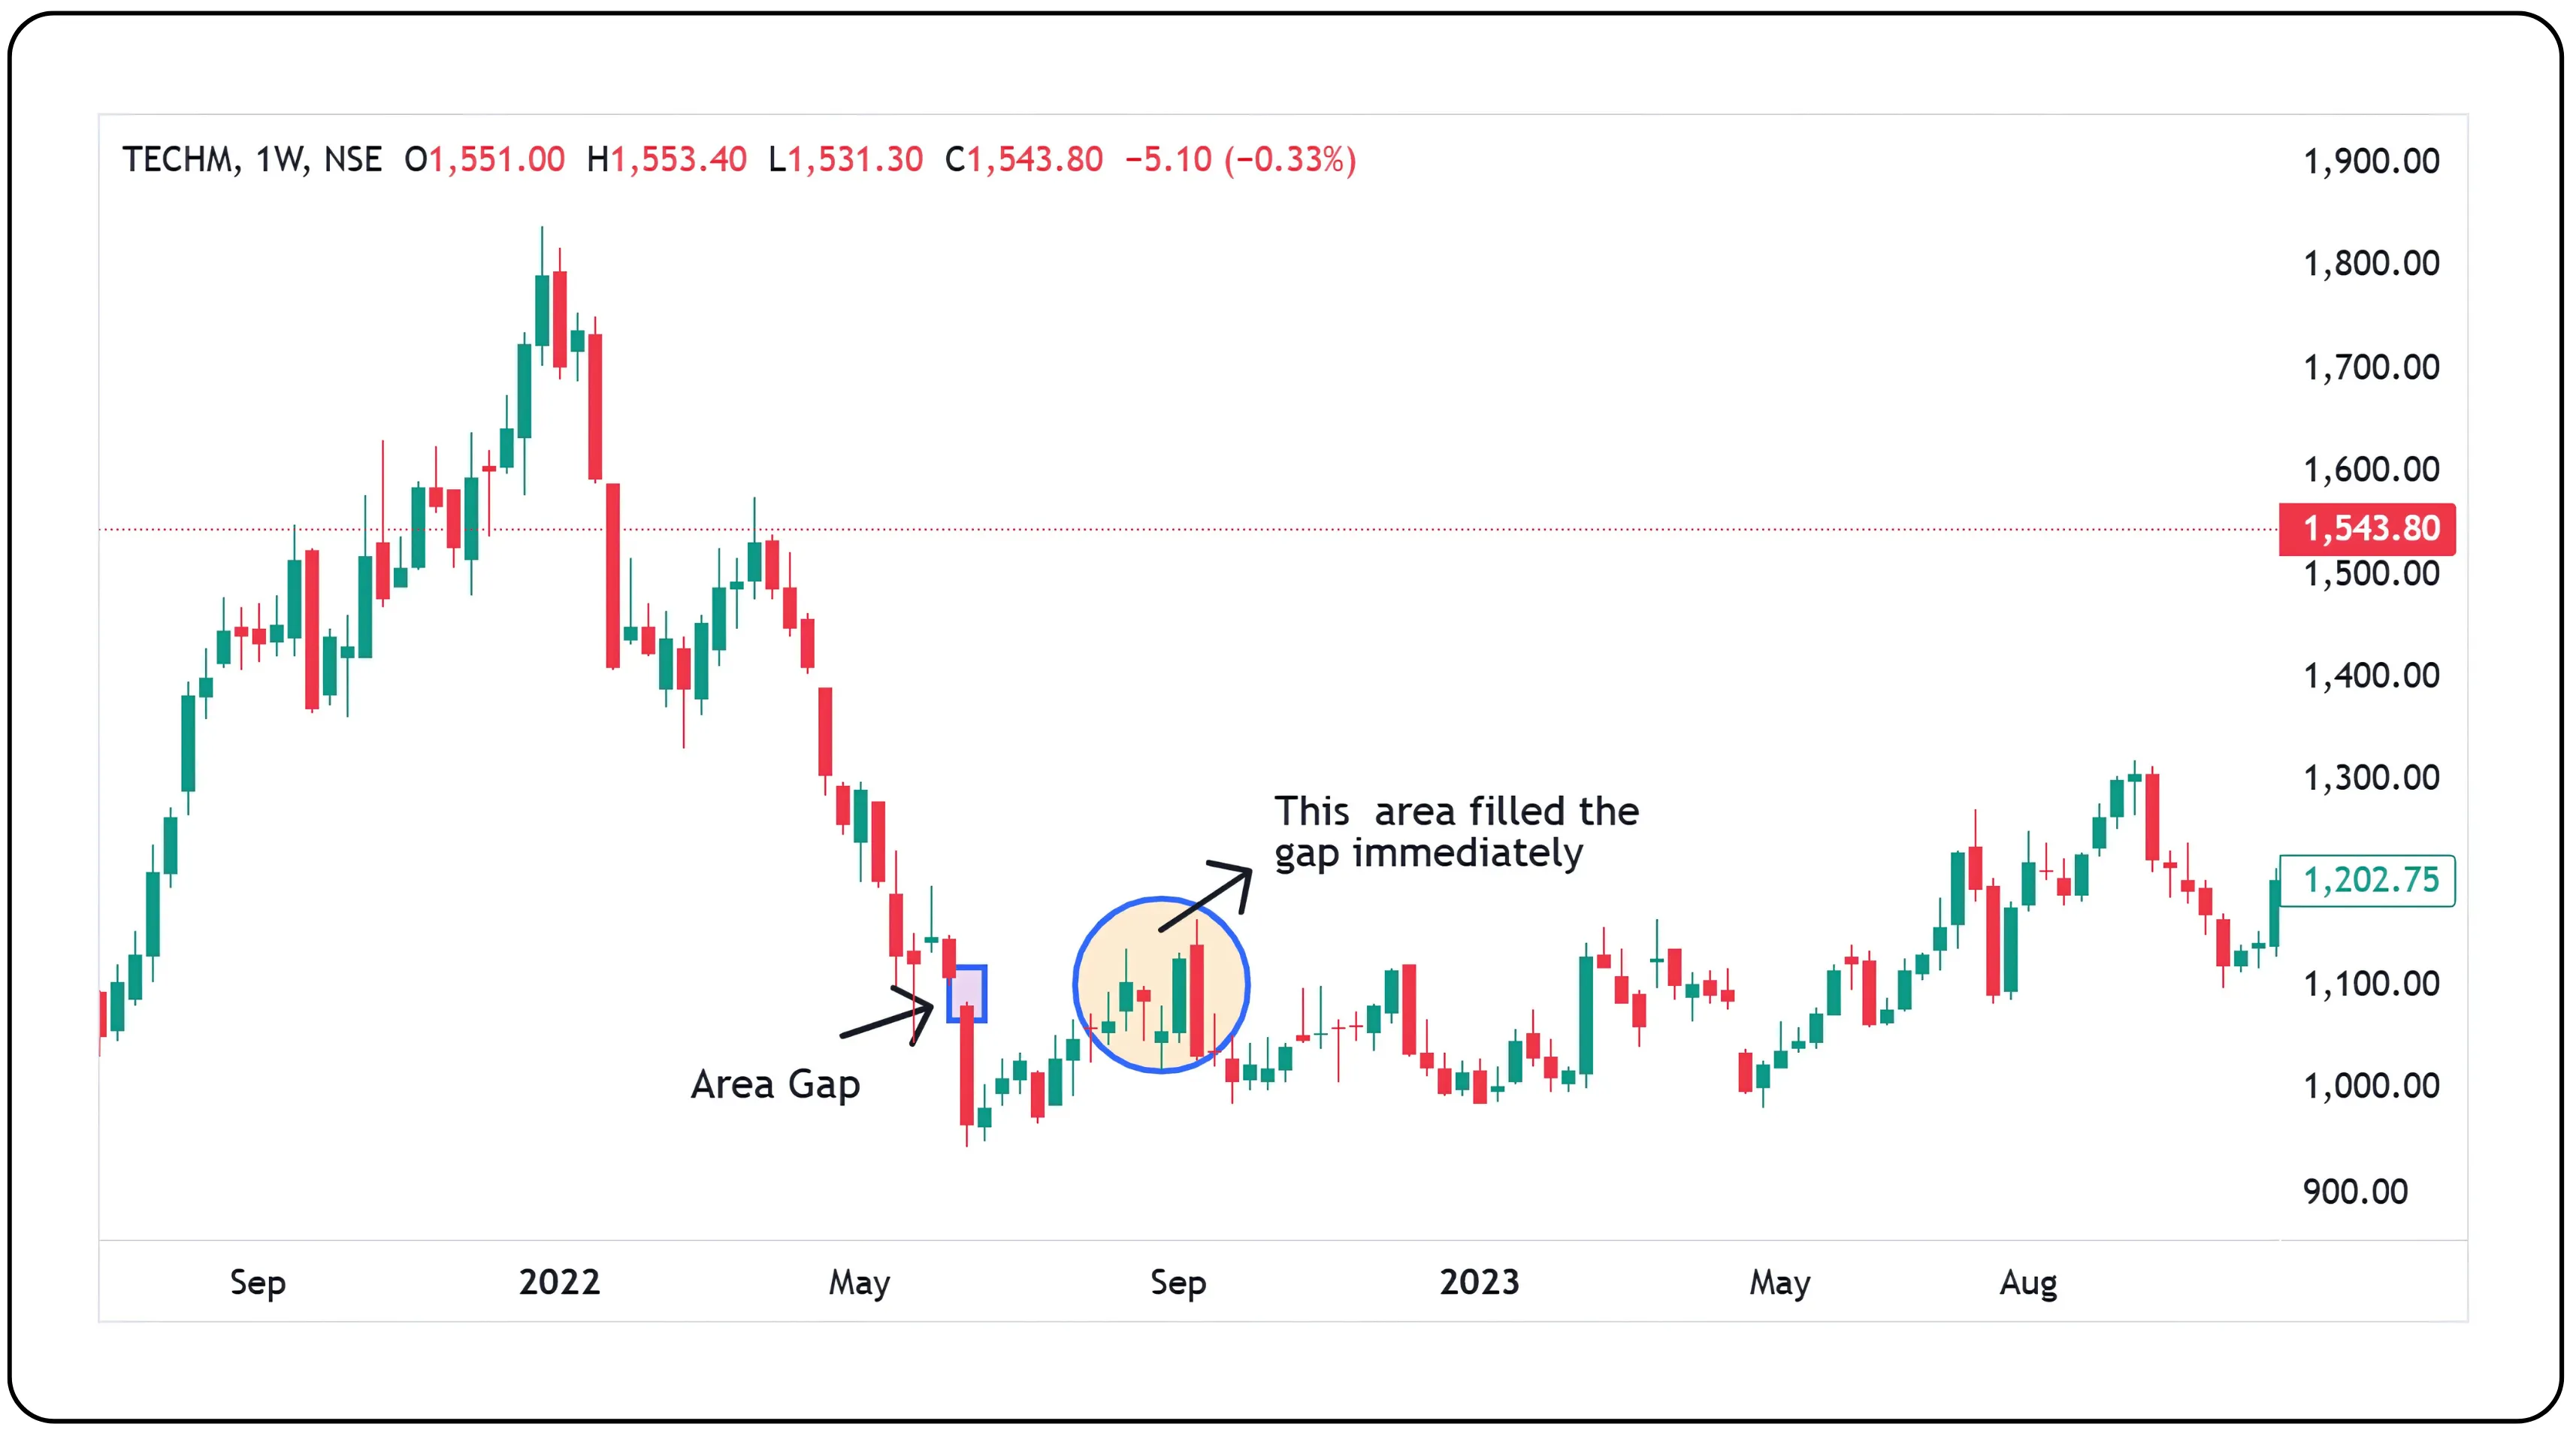
An area gap occurred on the Tech Mahindra chart during its downtrend in June 2022. The stock opened lower, creating a visible gap, but there was no major news or volume spike to support a strong move. Within a few candles, the price retraced and filled the gap, showing it was a short-term fluctuation rather than a trend-changing event. This kind of gap is typical during weak phases and often lacks lasting impact.
Also read: Stock Market Sentiment Drives Trading Decisions
2. Breakaway Gaps
These are the gaps you get excited about. A breakaway gap appears when the price bursts out of a tight consolidation area it is like a stock saying, ‘Enough waiting, I am moving!’ This kind of gap usually shows up on high volume, and the price often keeps climbing (or falling) for days, even weeks.
Spotting a breakaway gap early is like catching the bus just as it leaves the station and you are set for the ride.
In Adani Ports chart, the price was consolidating between 750 to 850 (sideways) , forming a consolidation zone. The post Gap , and the move gained momentum, resulting in a strong up move of 20% in a short span of time.
3. Continuation Gaps
These are rare but powerful. A continuation gap, also known as a runaway gap, shows up in the middle of an already strong trend, pushing the momentum further. Because of where they appear, not at the beginning and not at the end, they are also called measuring gaps. Traders often use them to estimate how far a price move might go.
If breakaway gaps are the launch, continuation gaps are the rocket’s second stage.
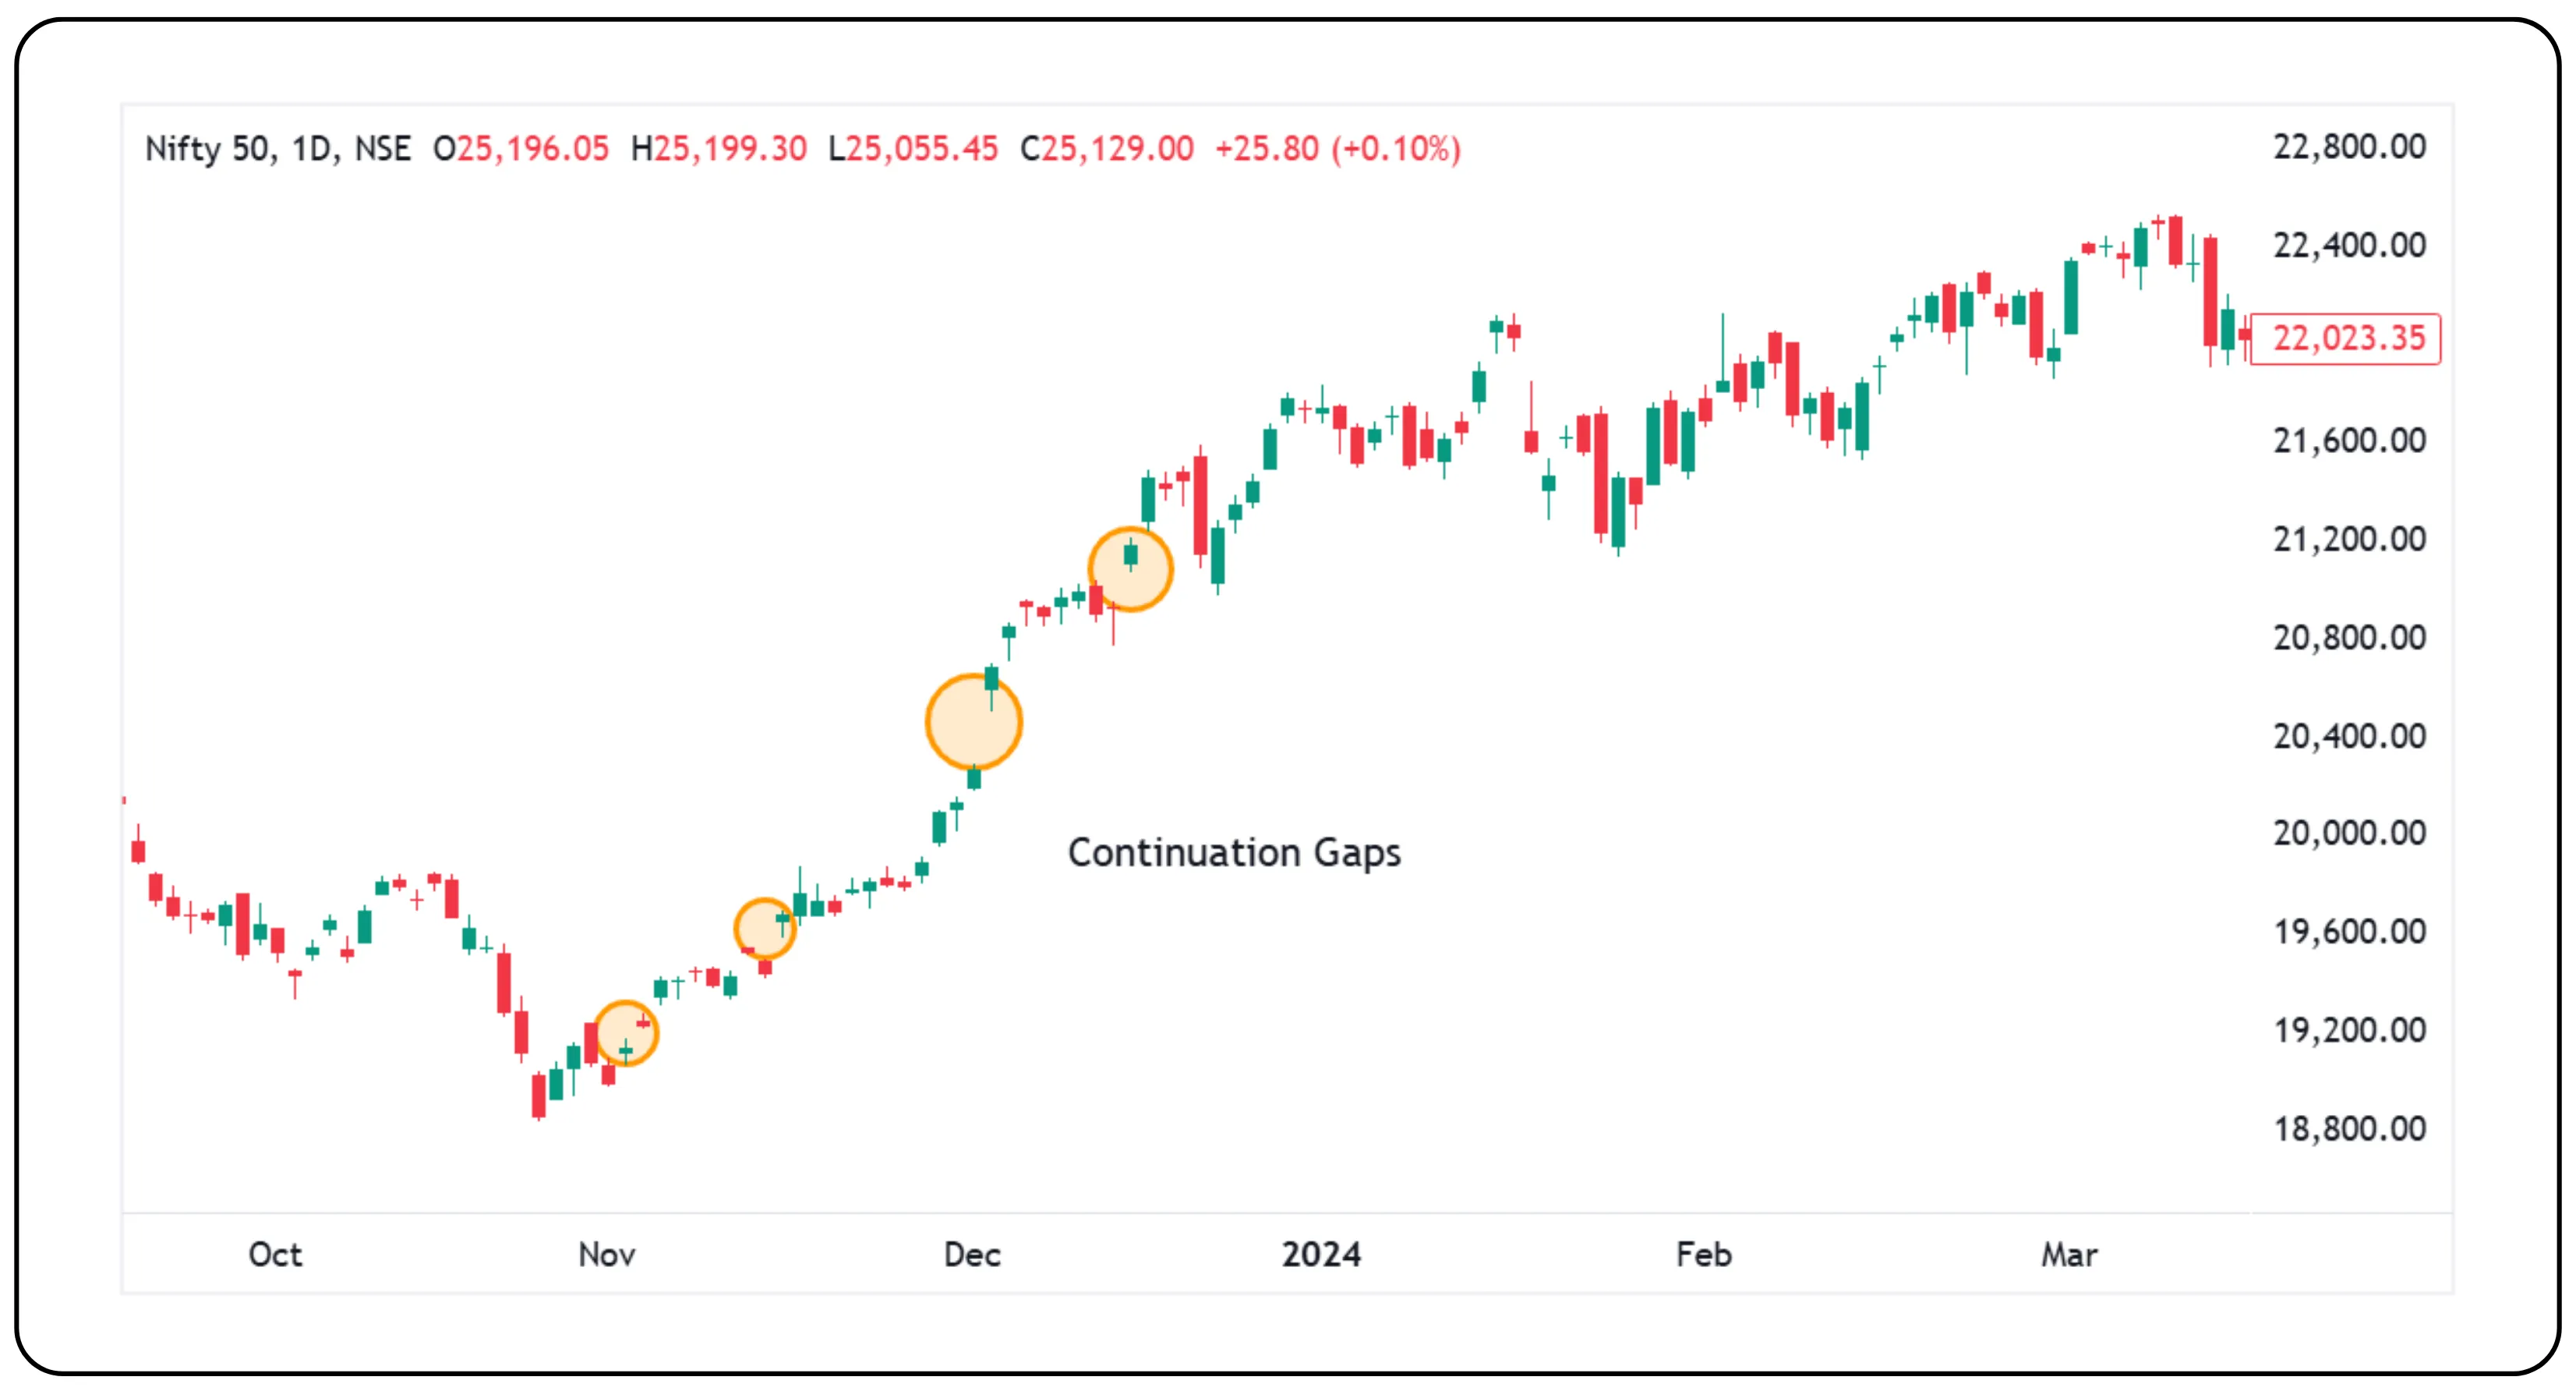
The Nifty 50 showed multiple continuation gaps during its strong uptrend, as seen in the chart. These gaps appeared midway through the rally, confirming strong momentum. Each gap was followed by further upward movement, signalling bullish confidence and helping traders estimate potential targets using these powerful trend-confirming price patterns. You can also use trendlines to judge the trend and strengthen your analysis when such gaps appear.
4. Exhaustion Gaps
Ever watched a stock race ahead, then suddenly drop? That might be an exhaustion gap. These happen at the end of a trend, when everyone has already jumped on the bandwagon. Prices gap up (or down) and then reverse quickly. That reversal is often sharp but short-lived. Smart traders take this as a signal to get out, not get in.
One way to spot them? If the gap is unusually large, and the price stalls or reverses quickly afterwards, you might be looking at an exhaustion gap.
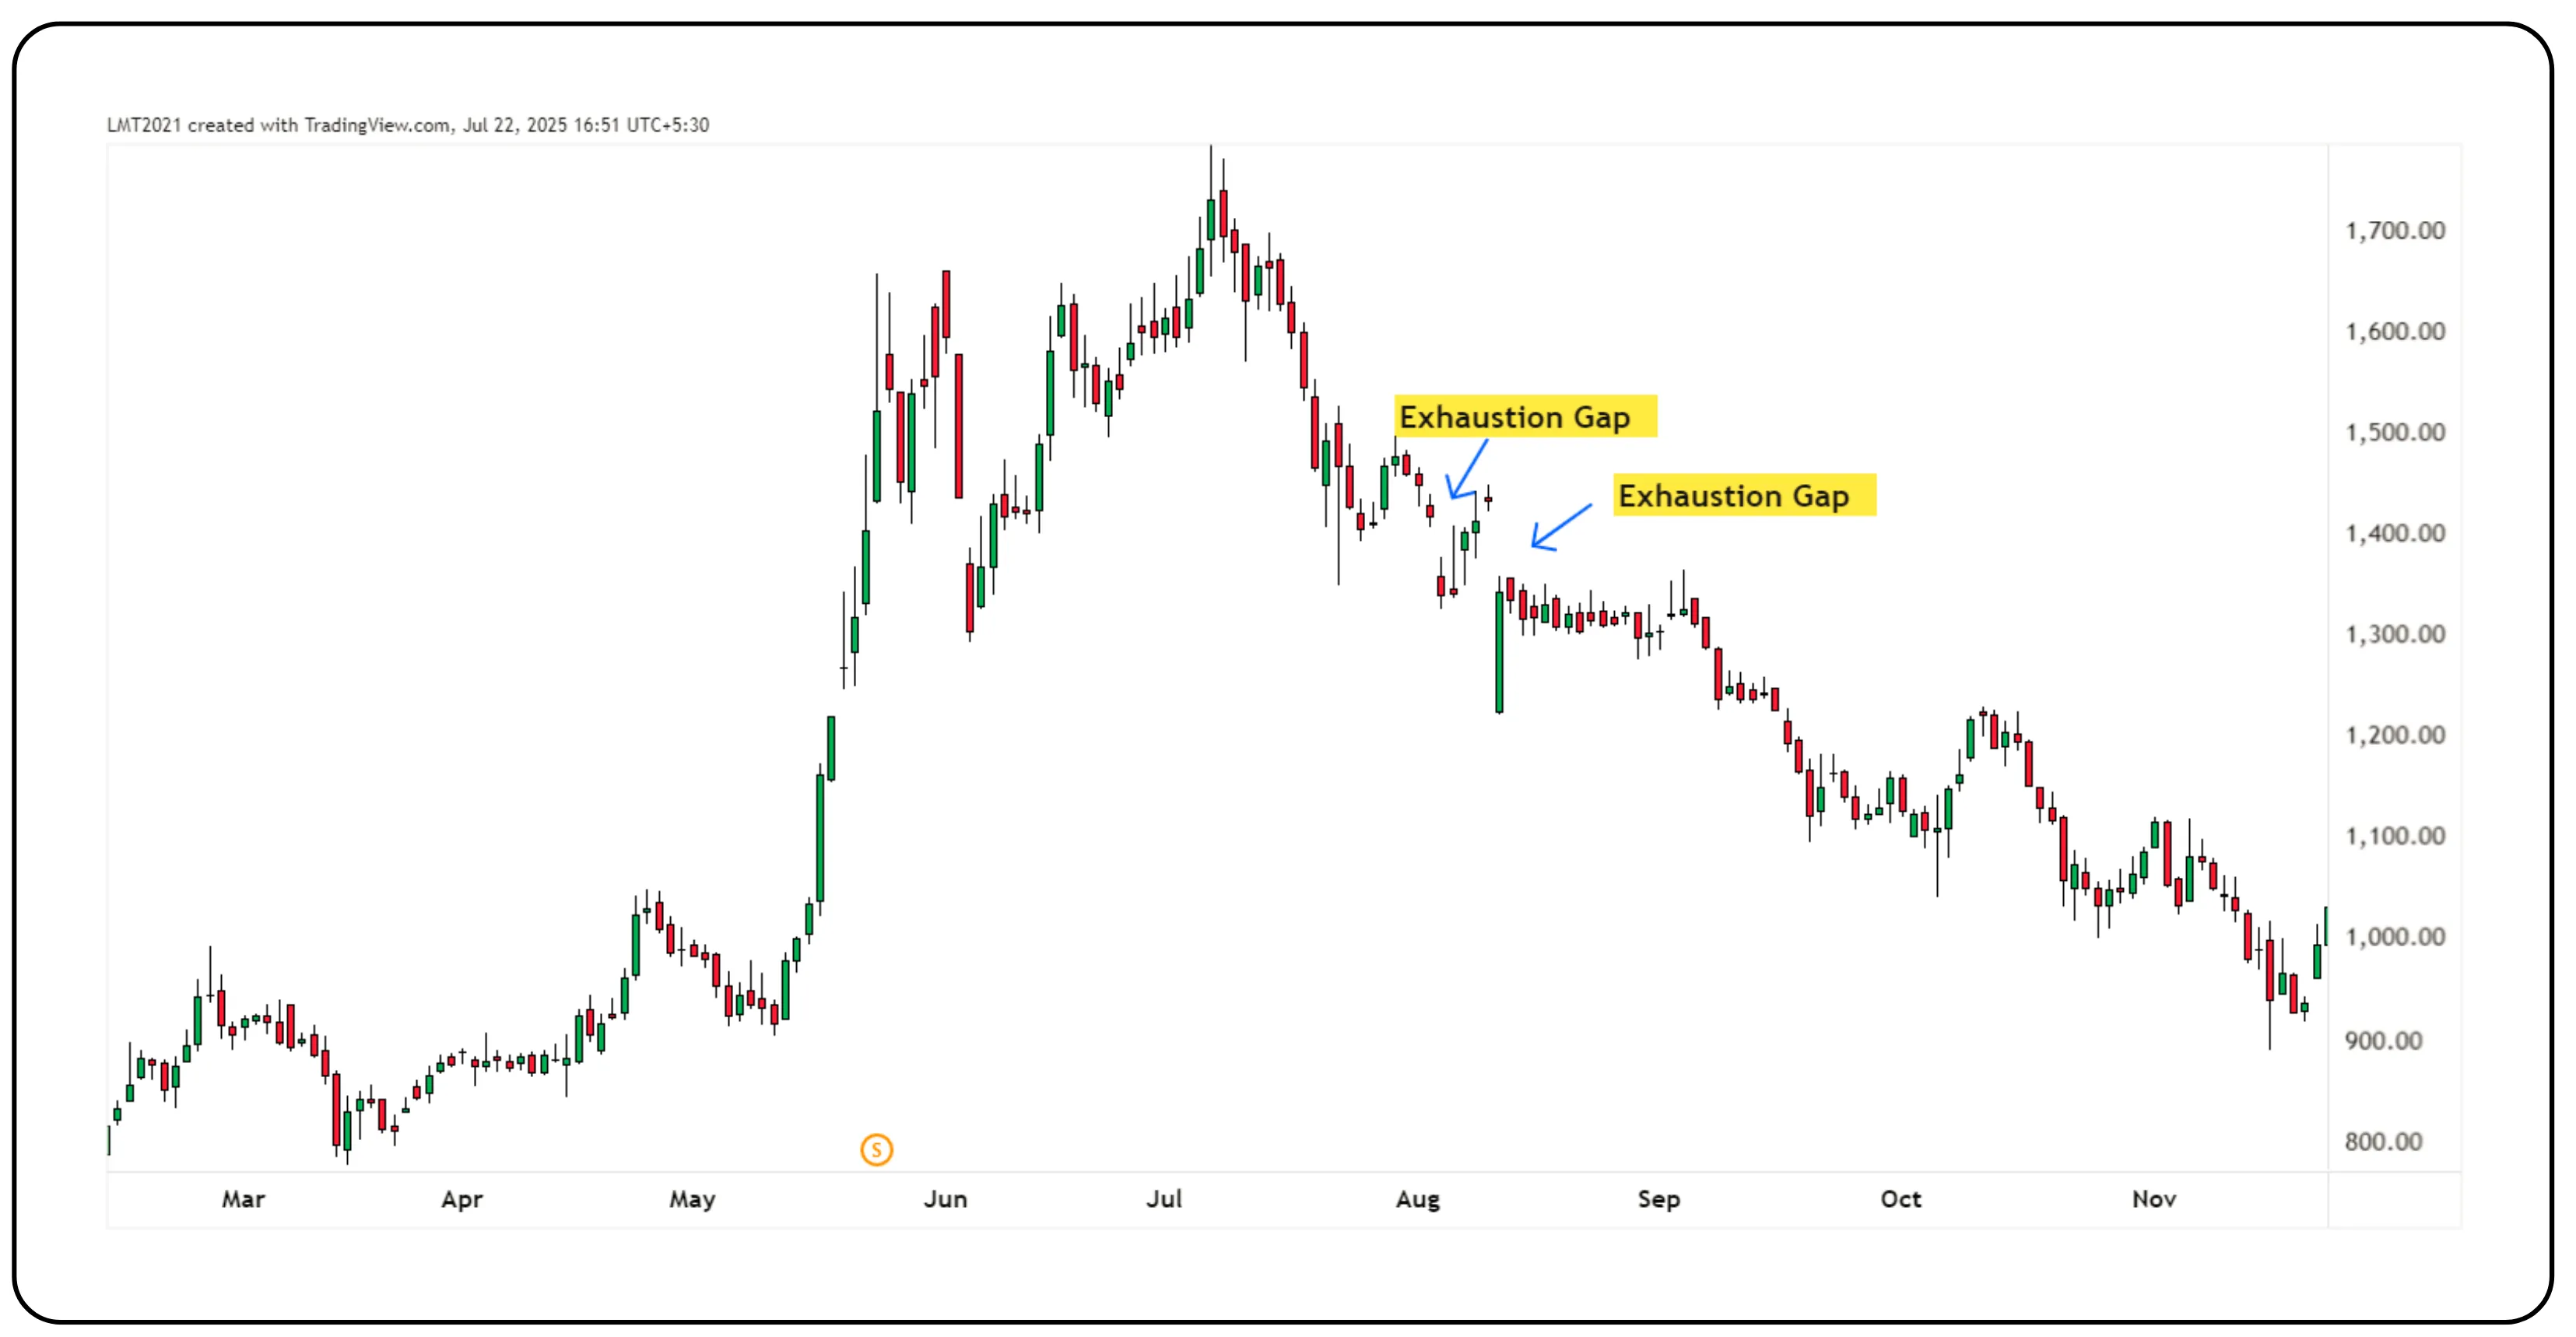
In the BDL chart, you can spot two back-to-back gaps during a downtrend, both forming red candles after a gap-up. This is a typical sign of an exhaustion gap. The price tried to rise but could not hold the momentum. Sellers quickly took over, pushing the stock lower soon after. These gaps signaled that the buying strength was fading, and a short-term bounce was losing steam.
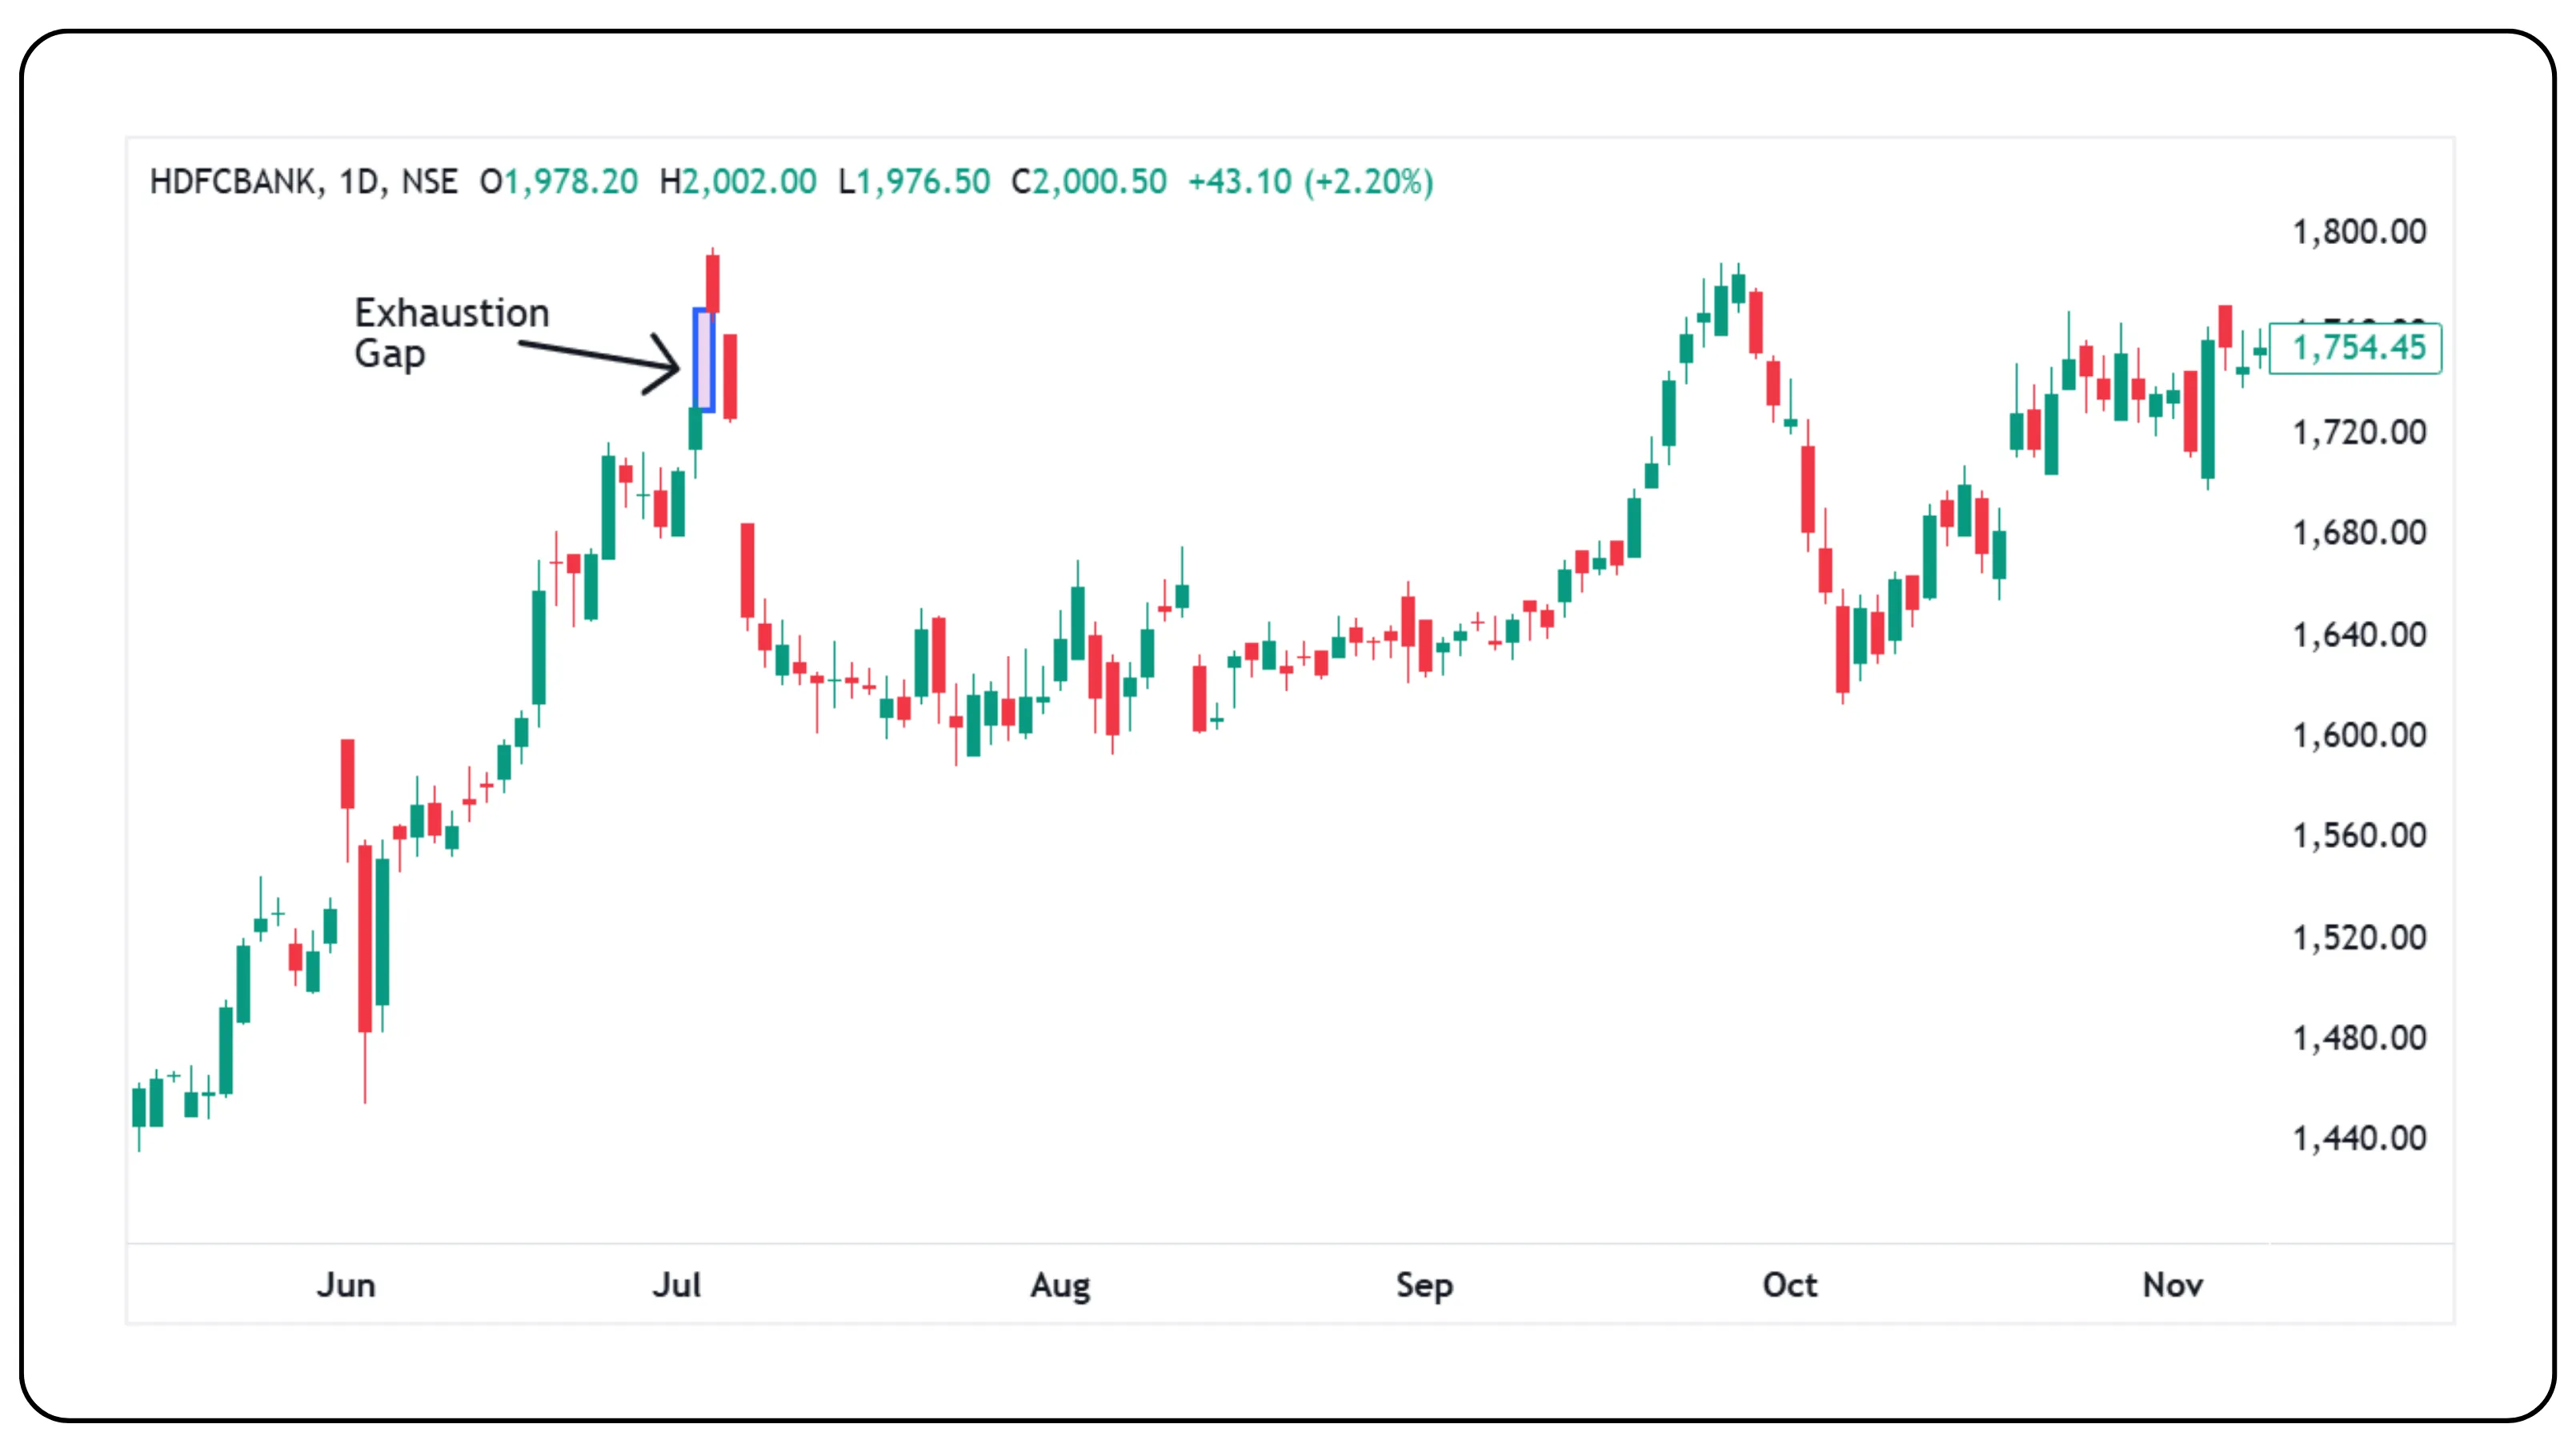
HDFC Bank experienced an exhaustion gap during a sharp uptrend, where the price gapped up but formed a red candle, signaling potential buyer fatigue. The gap failed to attract sustained momentum, and the stock reversed soon after. This marked the start of a short-term correction, confirming the exhaustion nature of the gap.
Also read: Different Trading Styles to Empower Your Investments
How to use this knowledge
If you are a day trader, you might ignore most of these except the opening gap. But if you are looking to swing trade stocks, understanding gap types can help you time your entries and exits better, because knowing the swing trading meaning is all about holding positions for a few days to capture price swings.
For example:
A breakaway gap might be a buy signal.
An area gap that fills quickly? Time to exit.
A continuation gap could help you estimate your price target.
And an exhaustion gap? A loud warning bell.
Wait for confirmation. One or two price bars after the gap can reveal the truth. If the gap holds and volume supports it, it might be worth trading. If it fizzles out quickly, walk away.
How to trade Gaps
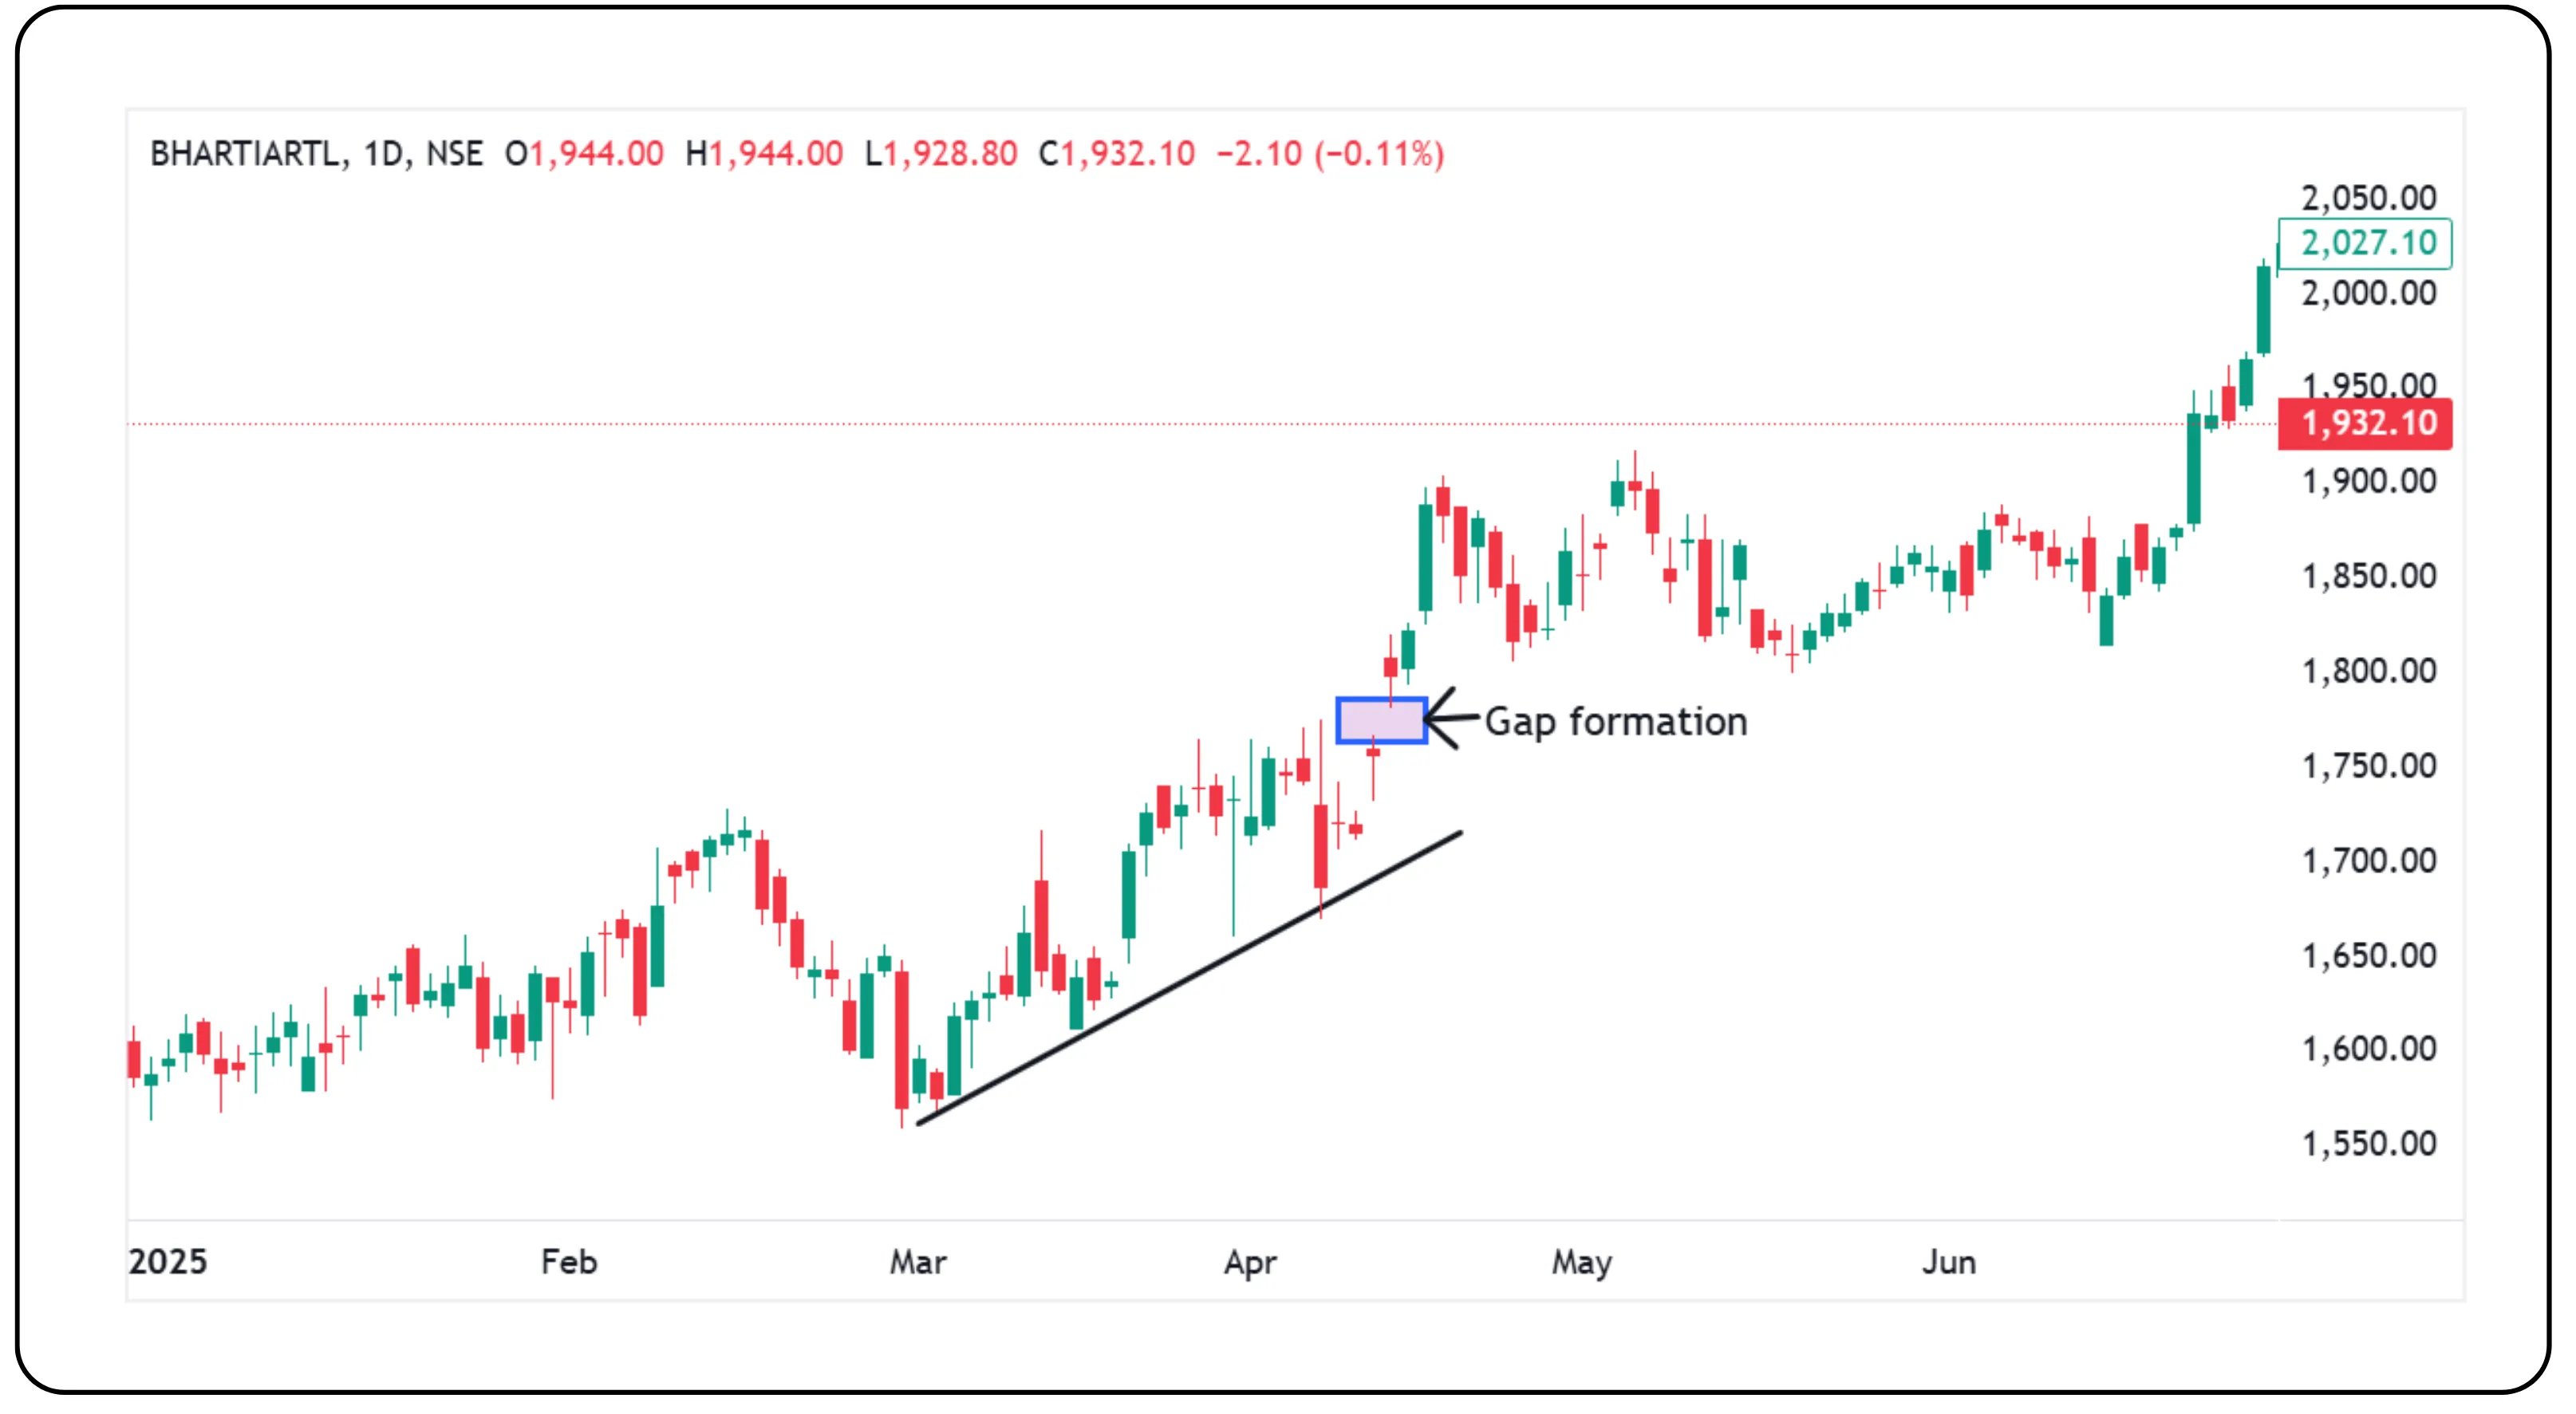
In this Bharti Airtel chart, you can see that the stock is moving up strongly over a longer period. The gap marked on 15th April 2025 shows up right in the middle of this steady upward move. This is a sign that buyers are still active and the uptrend has more strength left, so this is called a continuation gap.
If you look just before the gap, you will notice that the price moved sideways from 21st March 2025 to 11th April 2025, formed a small block. The gap jumps out of this block and pushes prices higher, which also makes it work like a breakaway gap. So in this case, the same gap can be treated as both.
How to trade this gap:
Entry:
- Enter when the price moves above the high of the gap-up candle, which means the entry gets triggered on 16th April.
Target:
Set a target with a 1:2 reward-to-risk ratio.
Or aim for the next visible resistance level on the chart.
Stop loss:
Place the stop loss just below the bottom of the gap area.
If the price closes below the gap zone, exit the trade.
Gaps are signals, not guarantees
Gaps reveal market psychology in real-time along with excitement, hesitation, conviction, or fatigue. But like all price action, they need context. Not every gap is worth trading. Use volume, follow-through, and chart structure to separate meaningful gaps from noise. Let gaps guide your decisions, not dictate them.
Disclaimer: The information provided in our blogs is for informational purposes only and should not be construed as financial, investment, or trading advice. Trading and investing in the securities market carries risk. Always conduct your own research and consult with a qualified financial advisor before making any investment decisions. Past performance is not indicative of future results. Copyrighted and original content for your trading and investing needs.
© 2025 — Tradejini. All Rights Reserved.


