


In the previous article, we discussed how to build a macro view of the market, a broad outlook that helps investors understand the overall direction and long-term sentiment. But when it comes to short-term trading, we need something more focused: a Nifty positional view trading strategy.
Read our Fundamental Analysis Part 1
A positional view acts like your daily trading plan, helping you prepare for the immediate session and decide how to position your trades for the next day.
Let’s understand how to build one, step by step.
1. Start with the Index
Every analysis begins with the broader market. Traders typically look at either the Nifty 50 or Sensex, with most derivatives traders preferring Nifty.
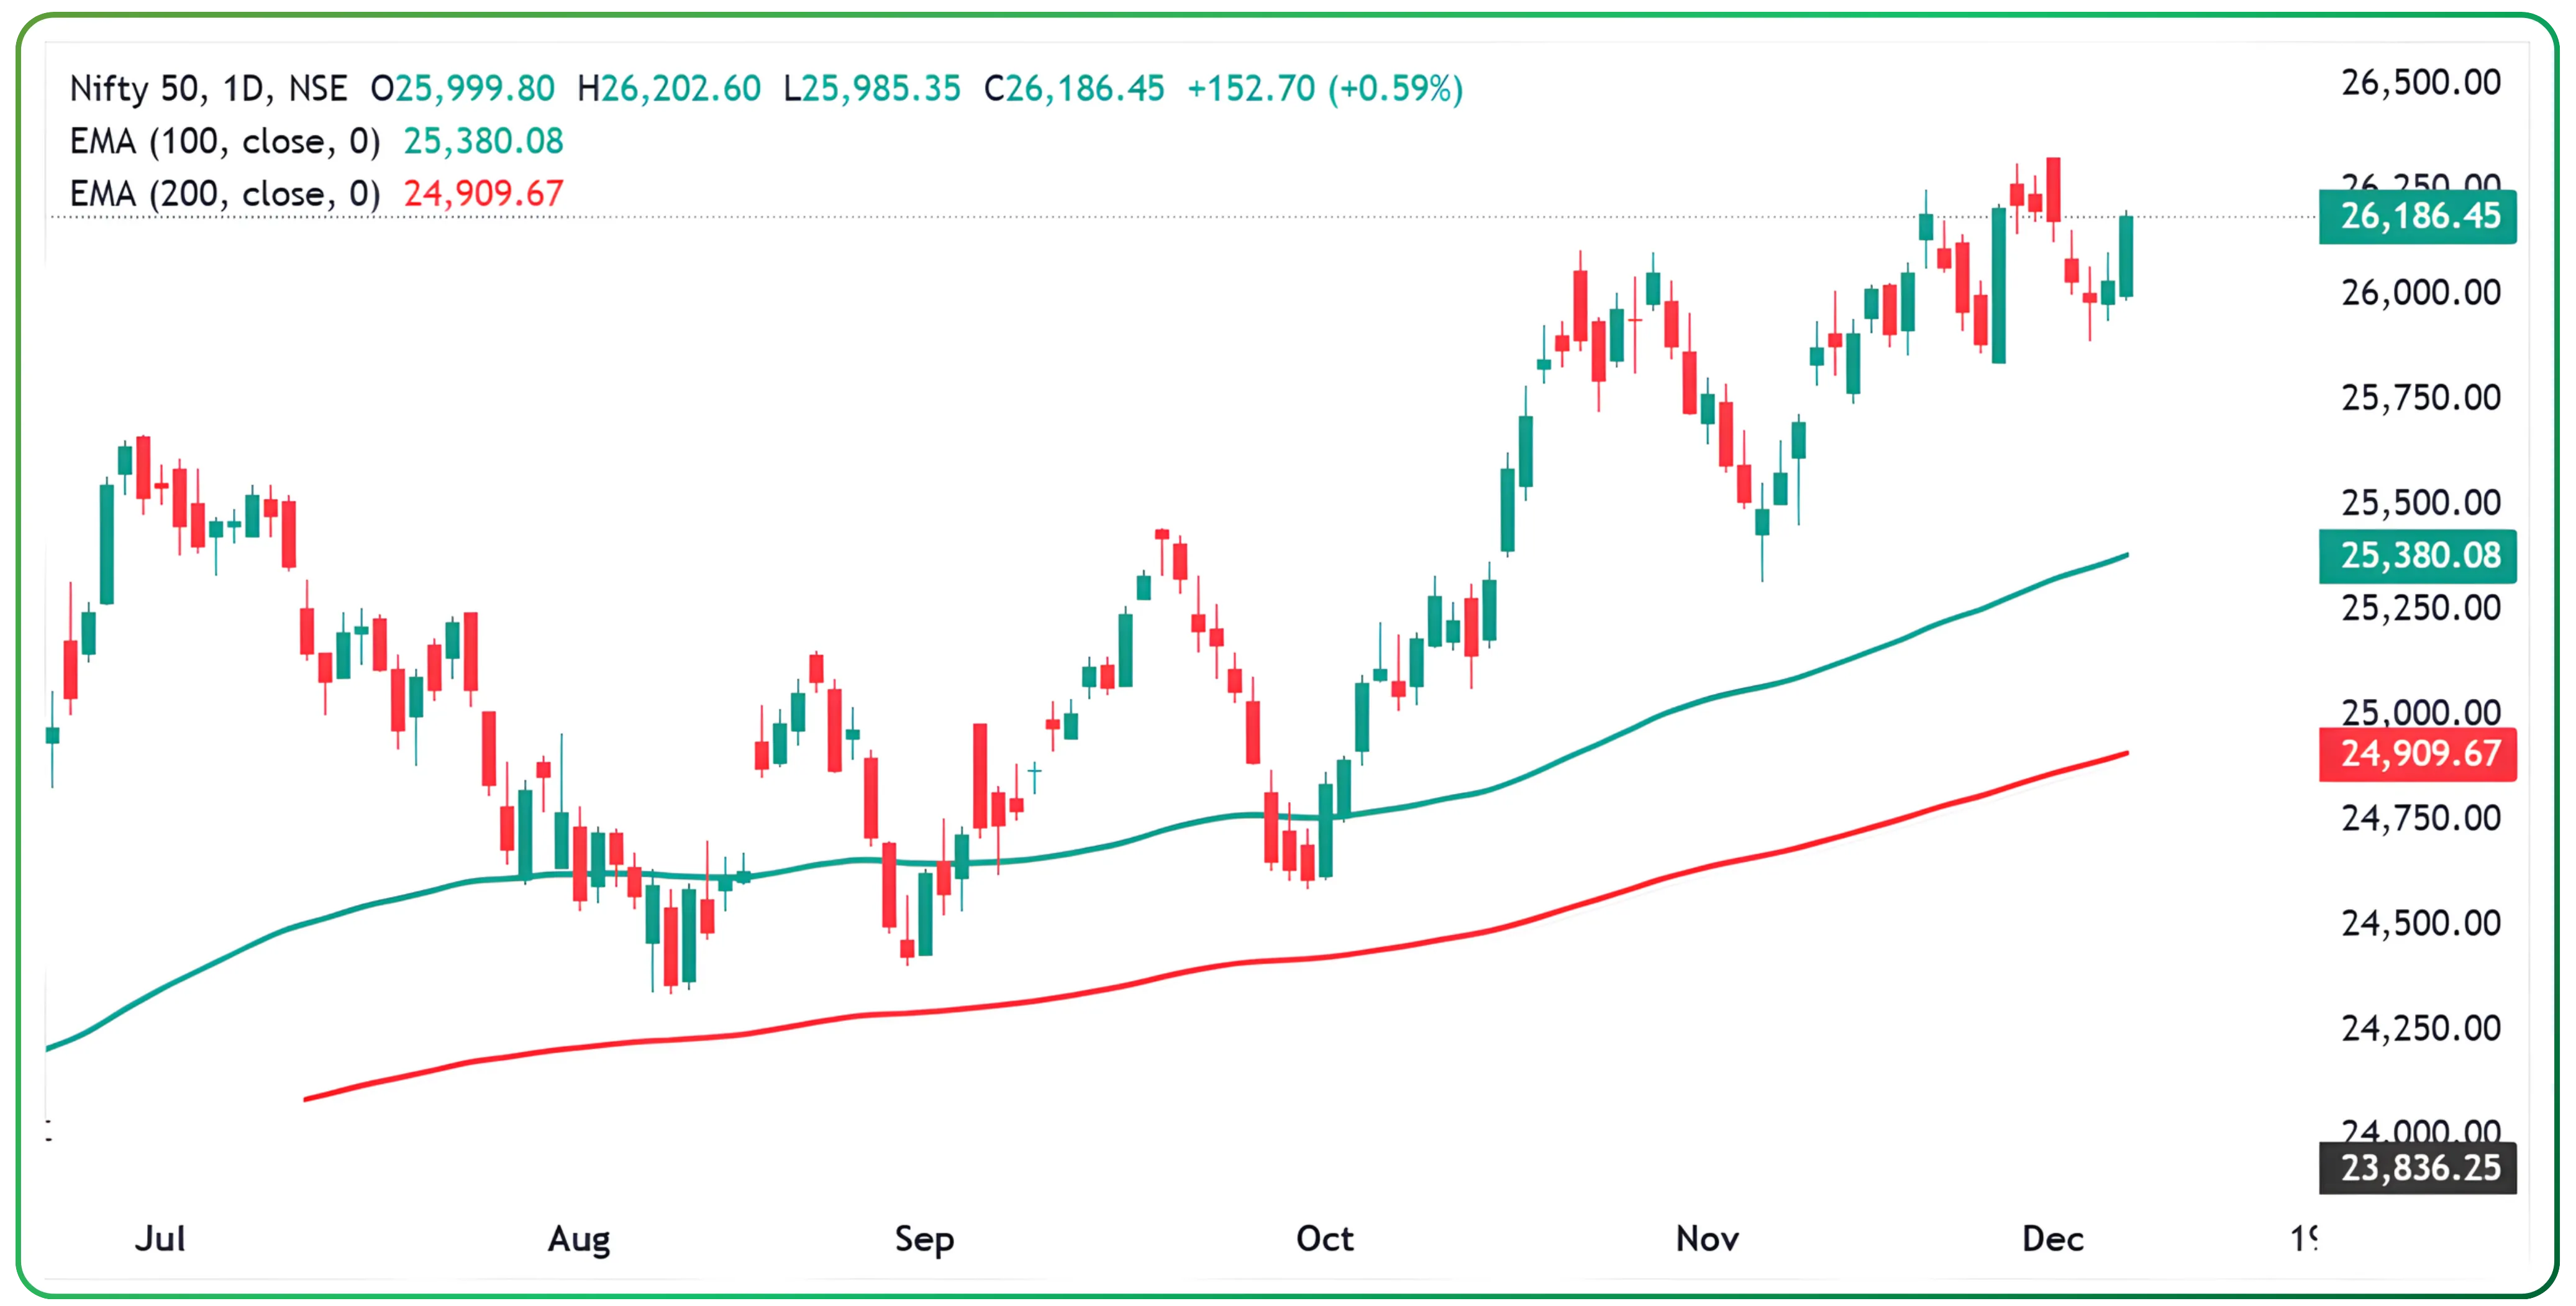
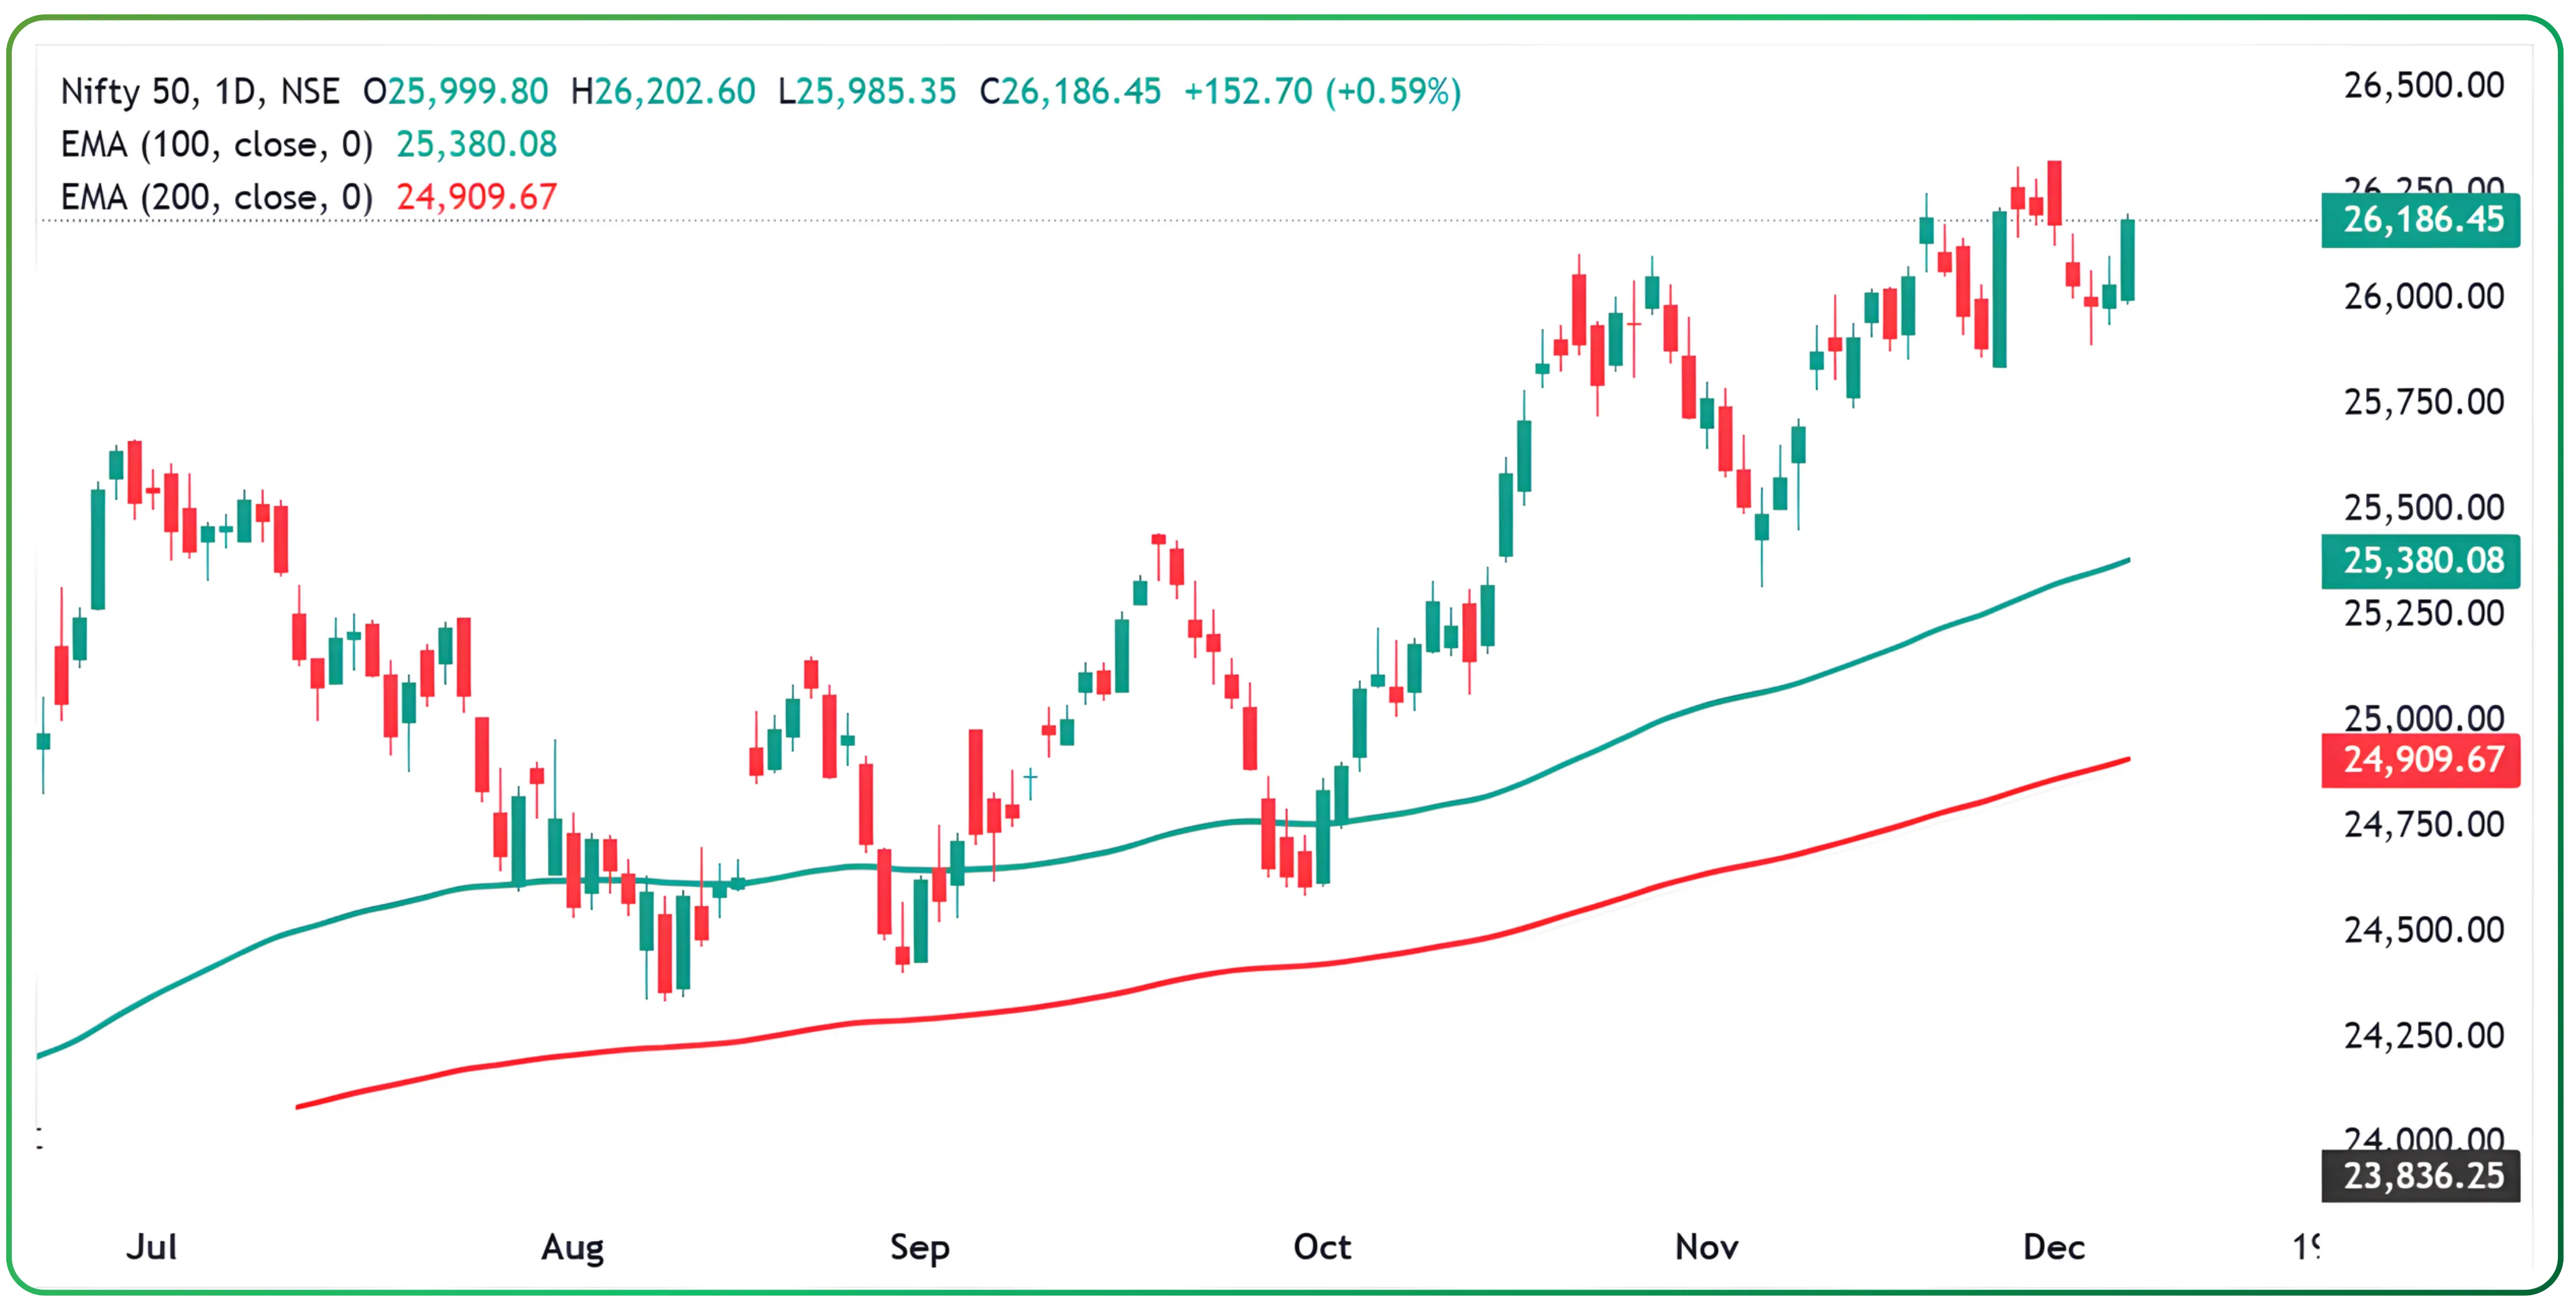
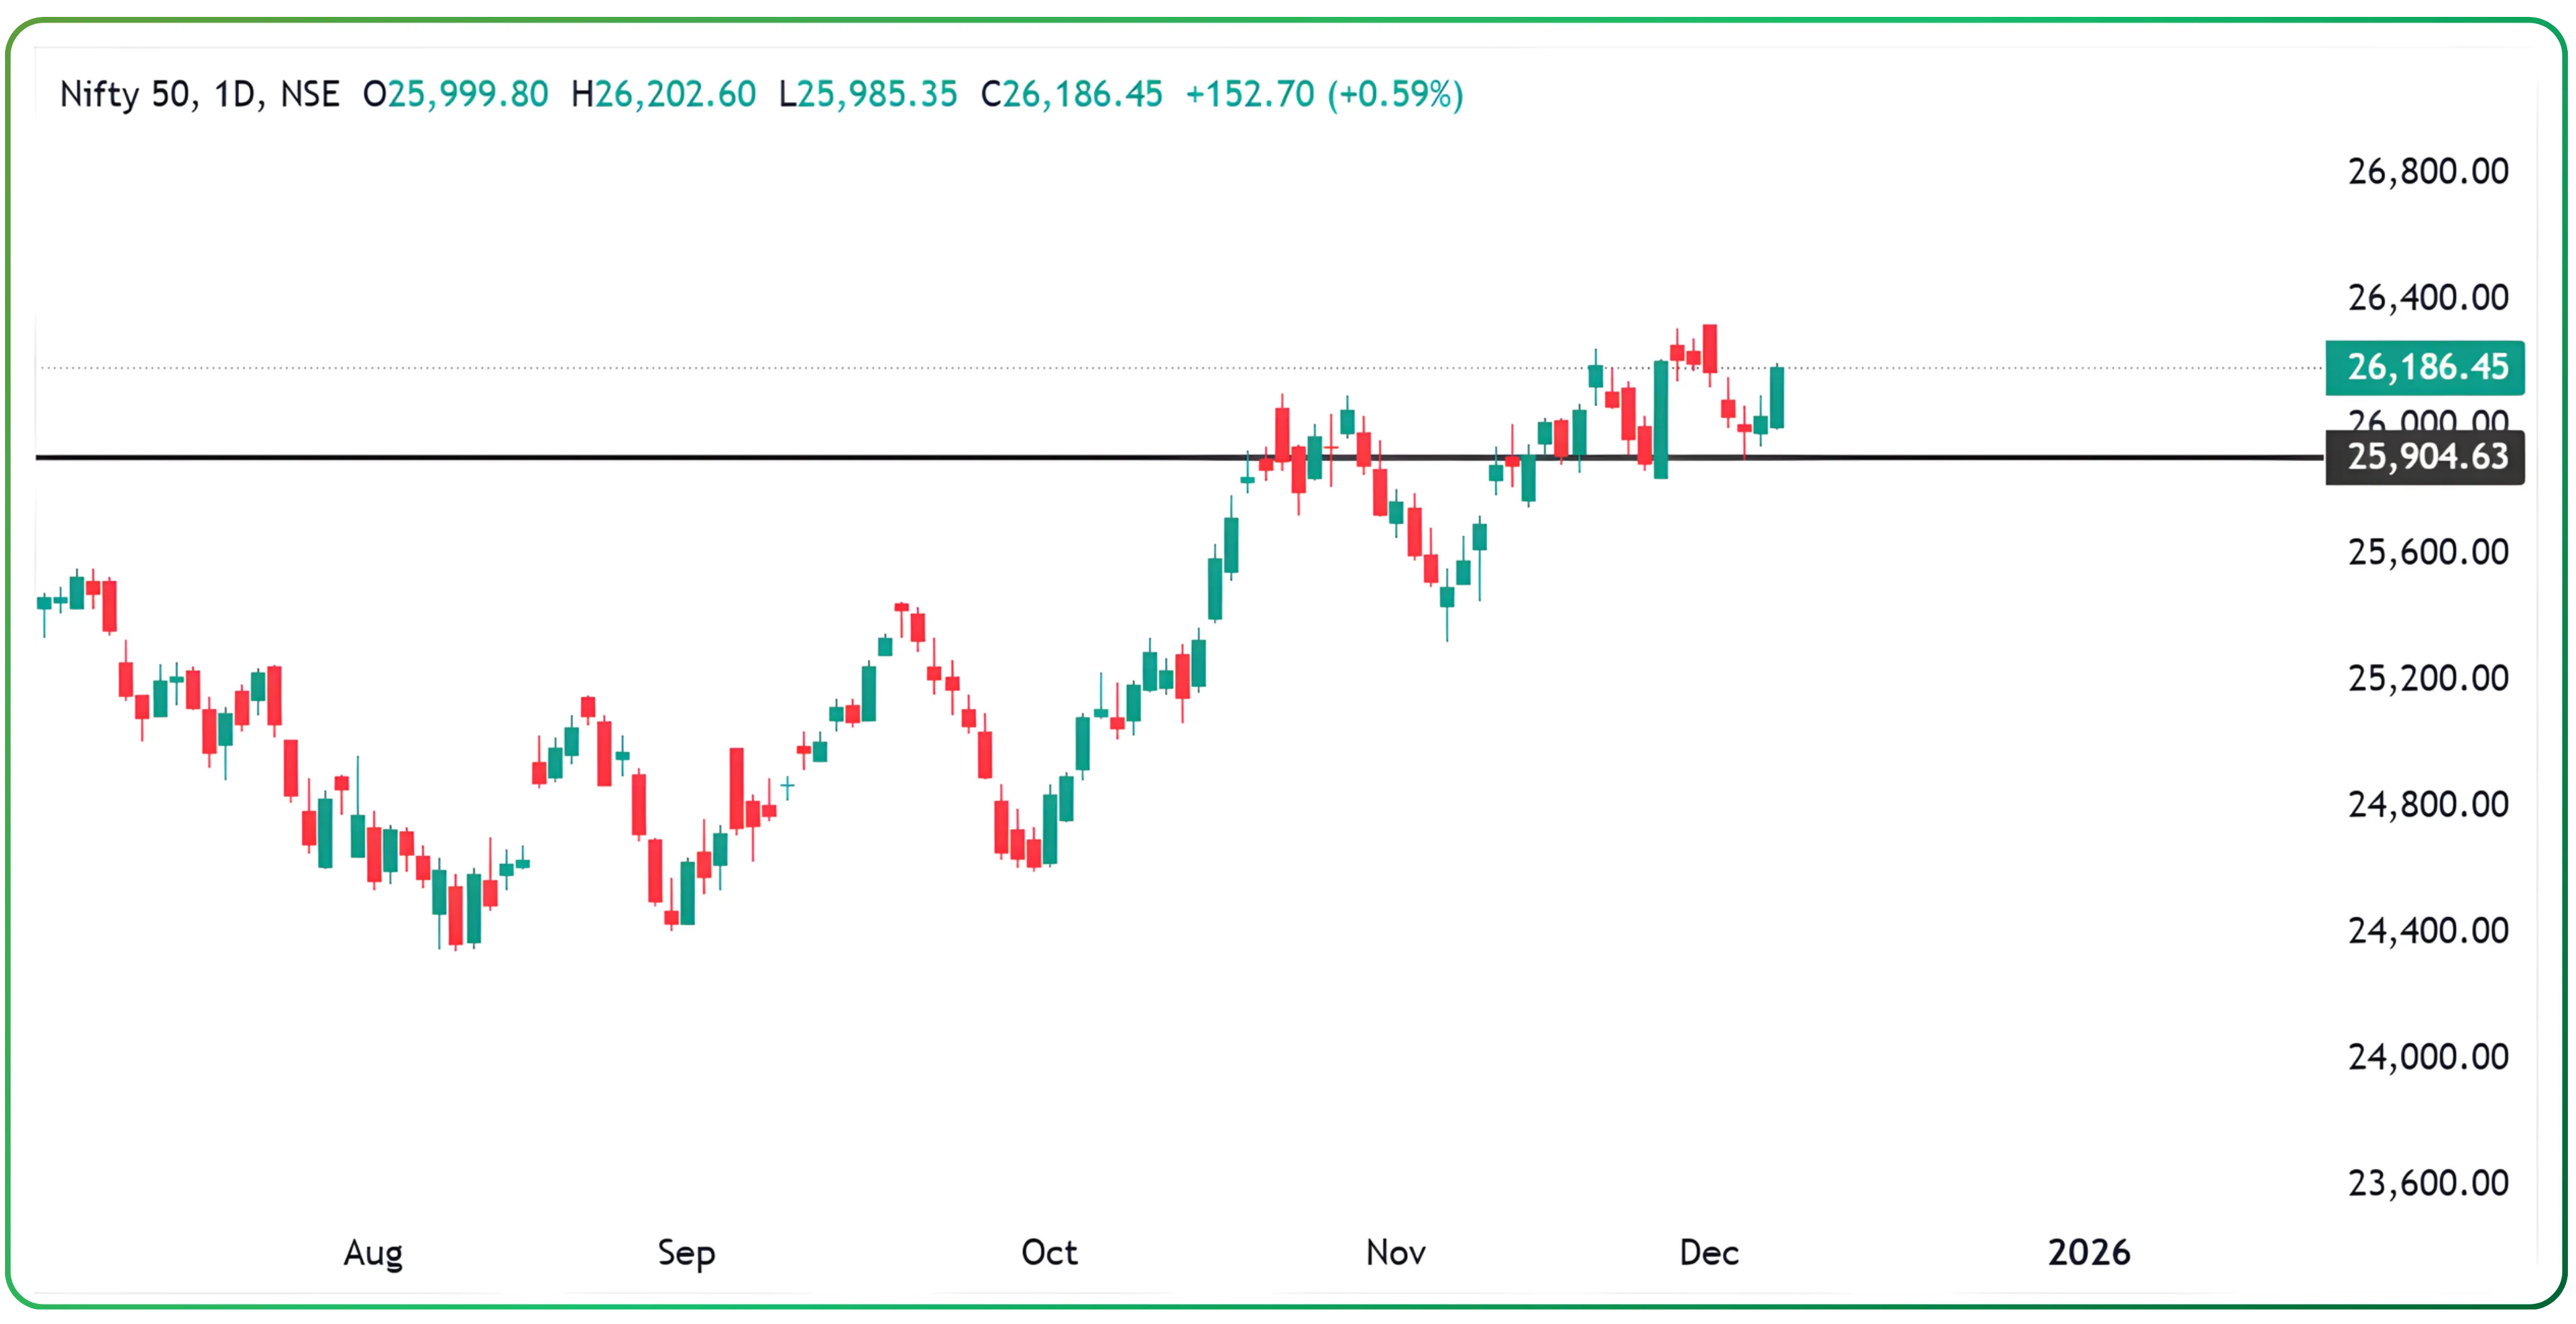
To gauge the trend, observe the long-term momentum using the Nifty 50 EMA 200-day and 100-day analysis.
When the 100-day EMA crosses above the 200-day EMA, it signals bullish momentum. Similarly, when prices take support near the 200-day EMA and bounce, it often suggests continued strength.
As of Dec 1, 2025, Nifty is trading around 26,280–26,290, which is comfortably above its long-term averages, indicating bullish control.
2. Observe the Short-Term EMAs
After understanding the long-term context, shift to momentum signals like the Nifty 9-day 21-day EMA crossover.
If the 9-day EMA has recently crossed above the 21-day EMA, it shows strength returning after a dip. When prices stay above both, traders can lean more confidently toward long positions.
Currently, Nifty is trading above all key moving averages, including the 200-day average, which sits near 25,906.
3. Check Market Breadth
To ensure the rally is broad based and not driven by a few heavyweights, monitor the Advance-Decline ratio market breadth check. A healthy ratio (like 35:15 on Nifty 50 stocks) signals wider participation, supporting a bullish view.
Enhance your technical analysis workflow, read the full article
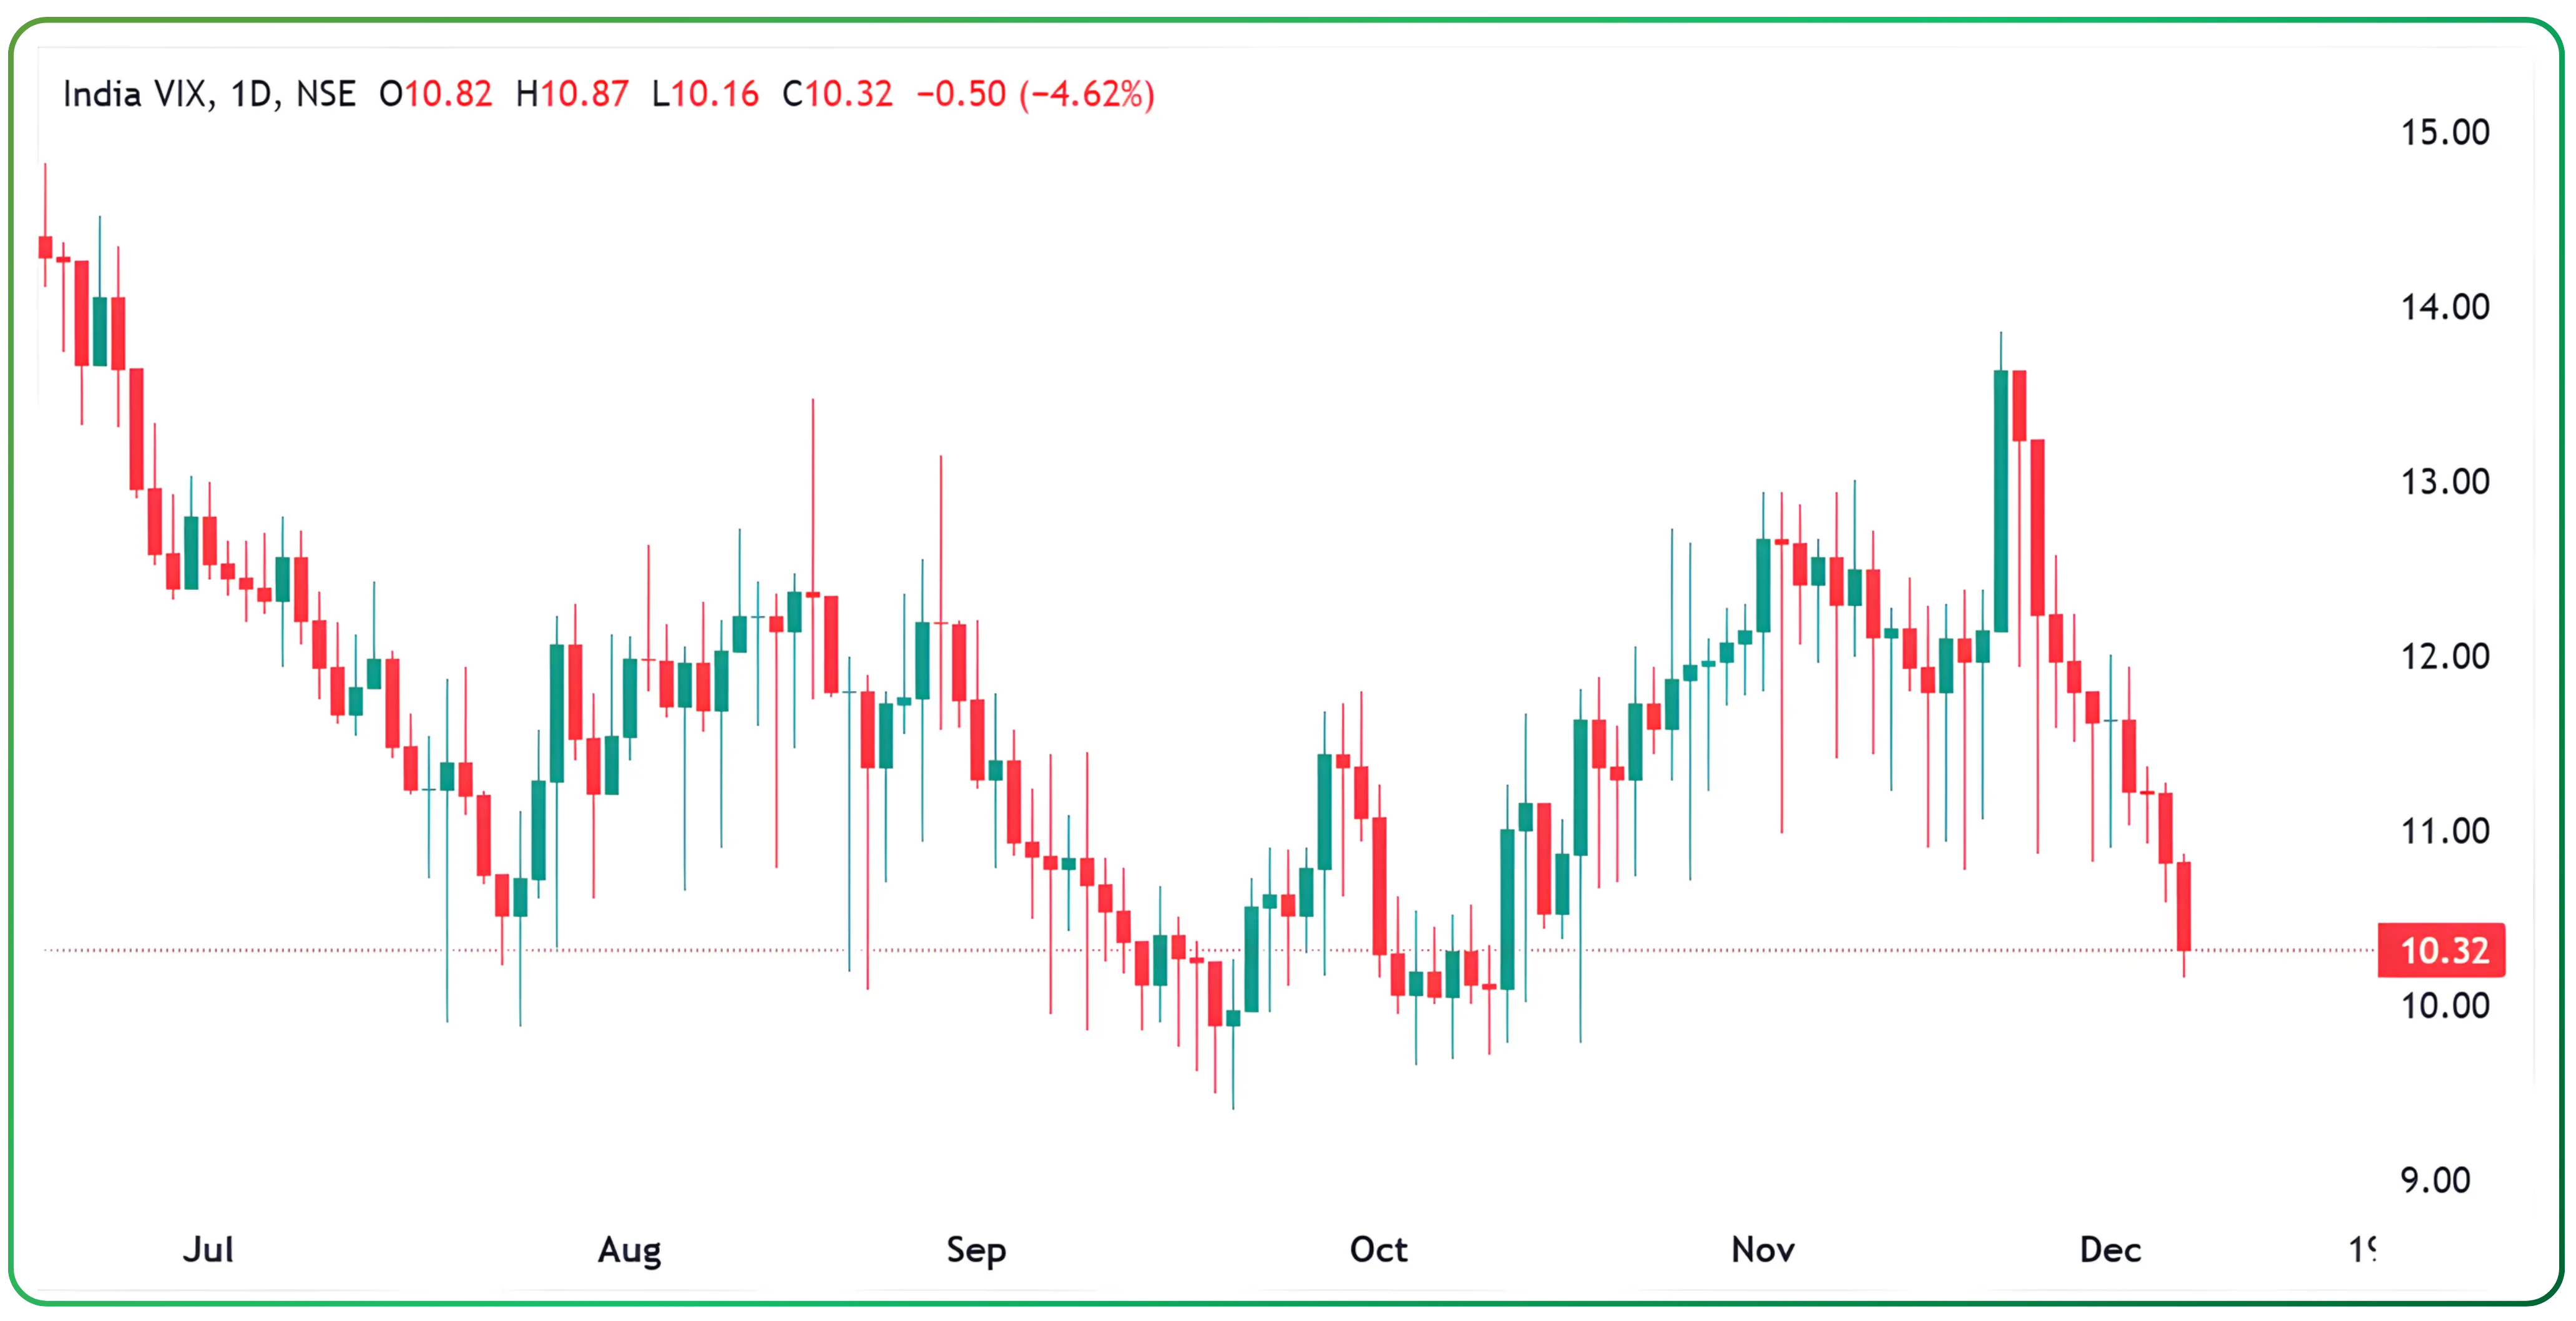
4. Watch India VIX
The India VIX 11.7 stable market environment indicates calmer conditions and controlled risk. VIX should support your view but not be the only deciding factor.
5. Identify Support and Resistance Zones
Support and resistance are price zones, not single figures. With the current market structure, a practical Nifty support zone is around 25,900–26,050, and the resistance zone lies near 26,500–26,800.
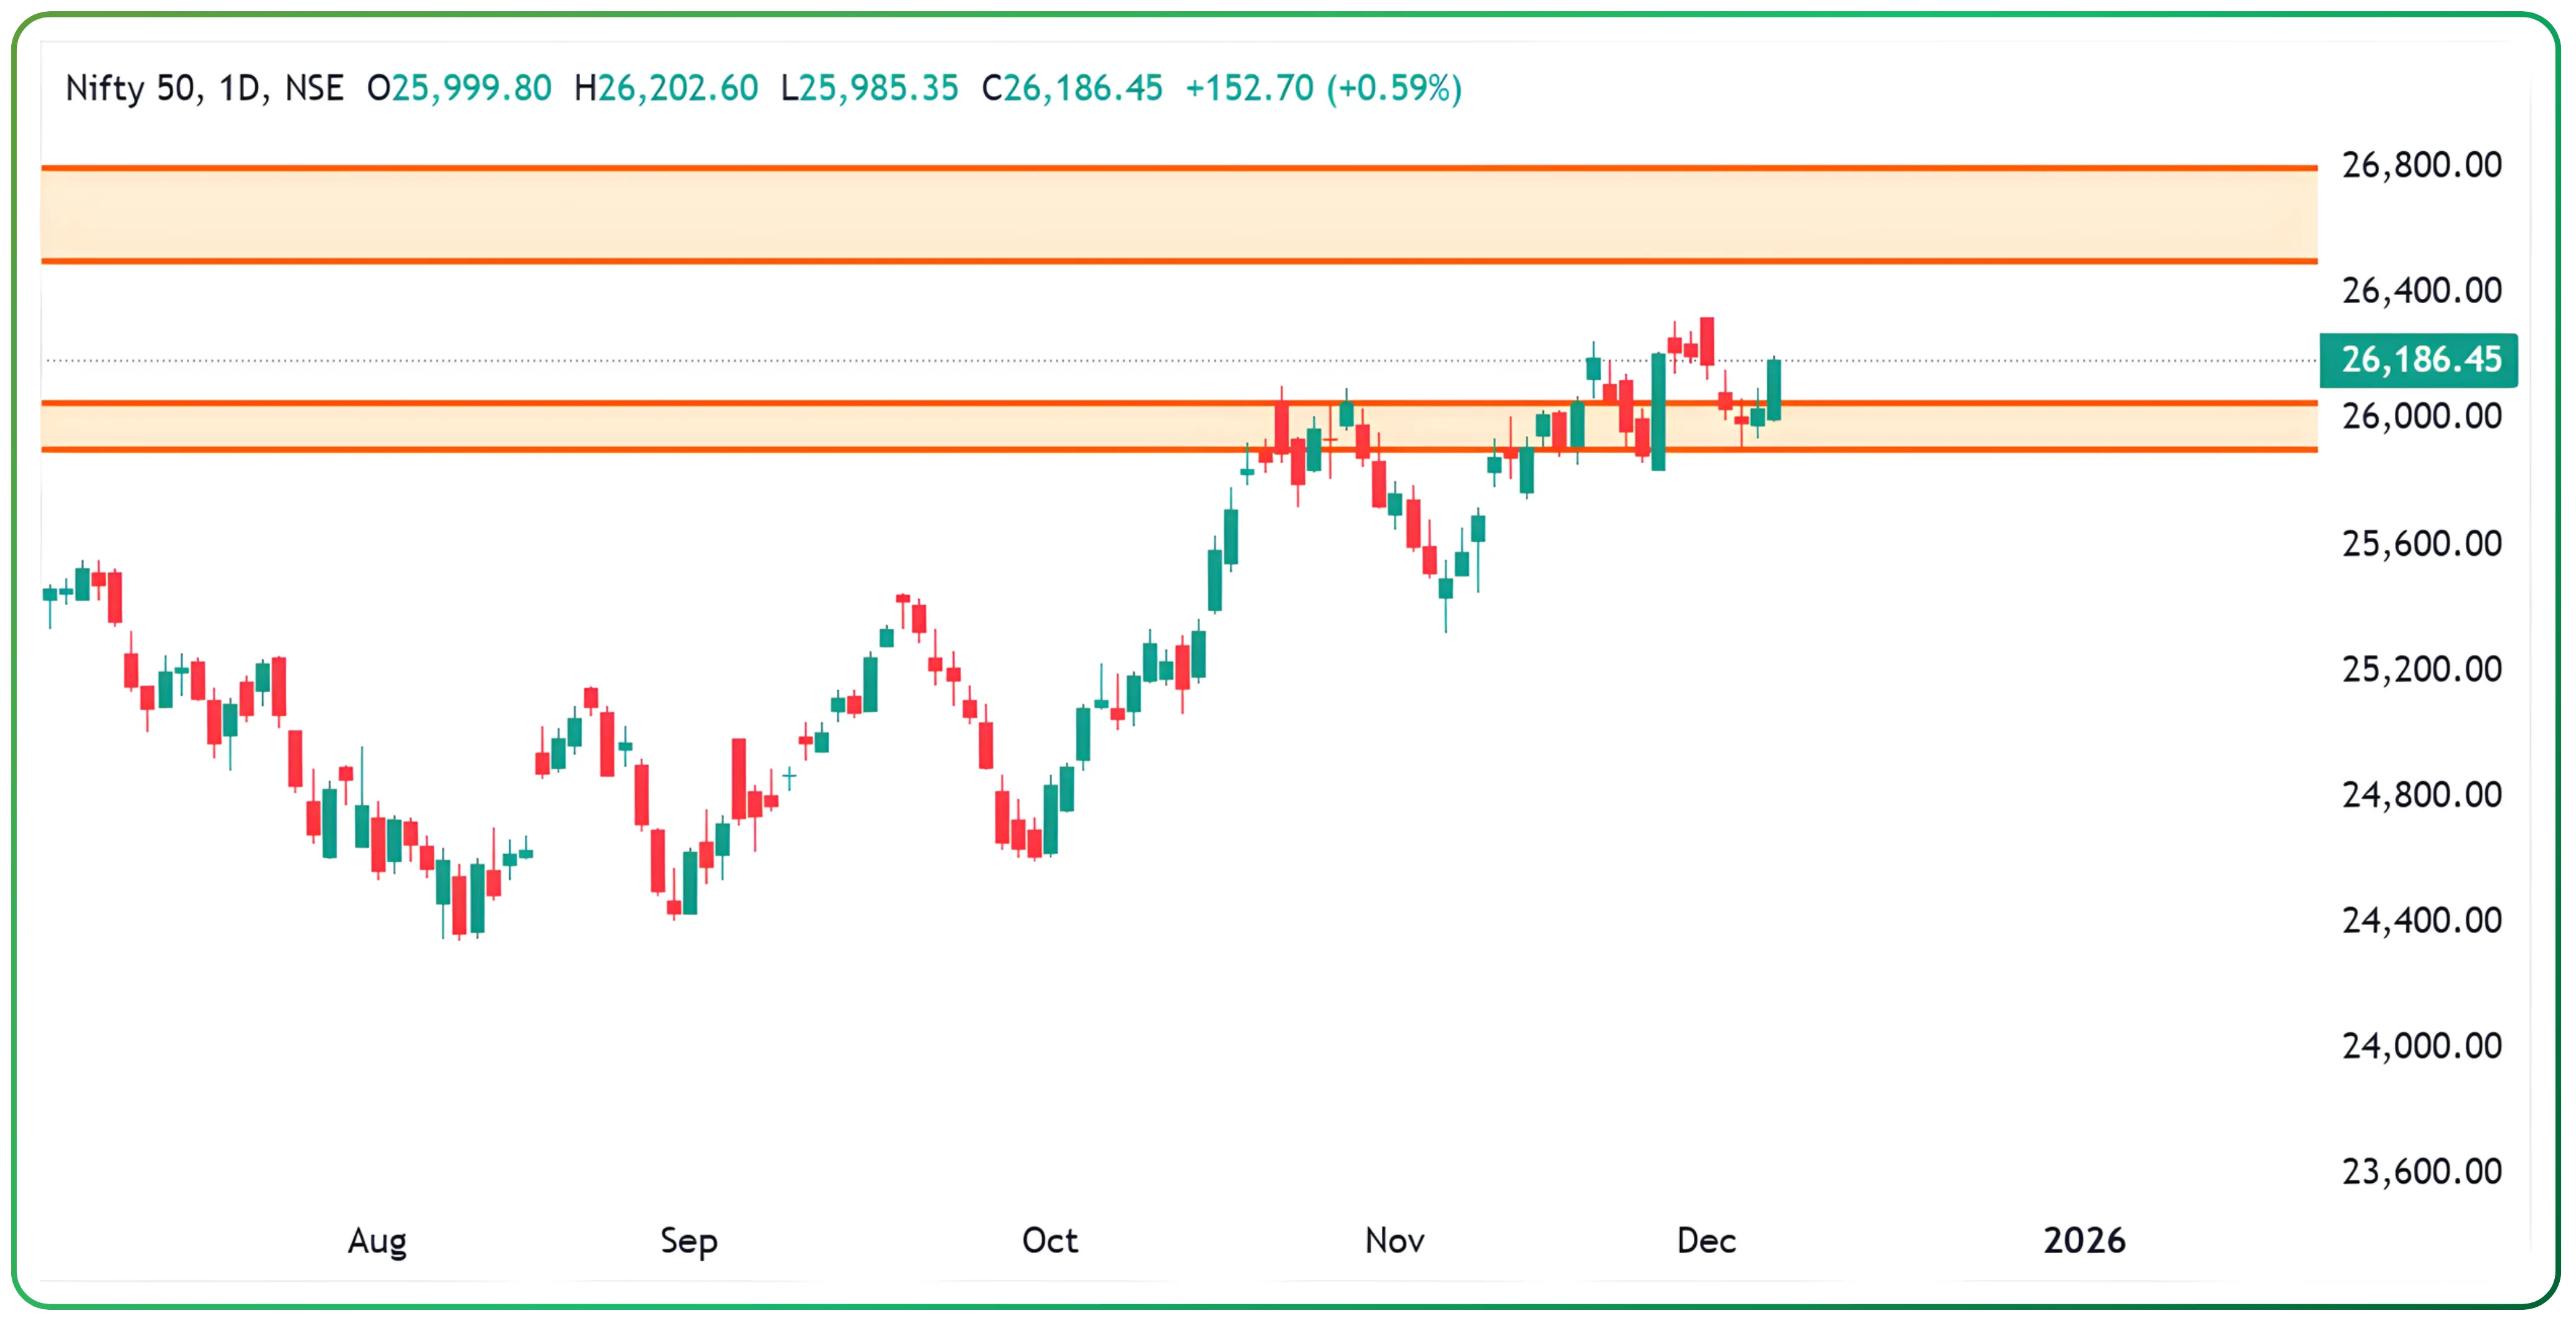
These bands help define entries, targets and stop-losses.
6. Confirm with Option Chain Data
Open interest (OI) in options reflects trader positioning. High Put OI concentration near 26,200 suggests traders are defending that level, indicating potential support unless unwinding occurs. Meaning, the most significant OI concentration is near 26,200 Puts (support) and 26,300 Calls (resistance).
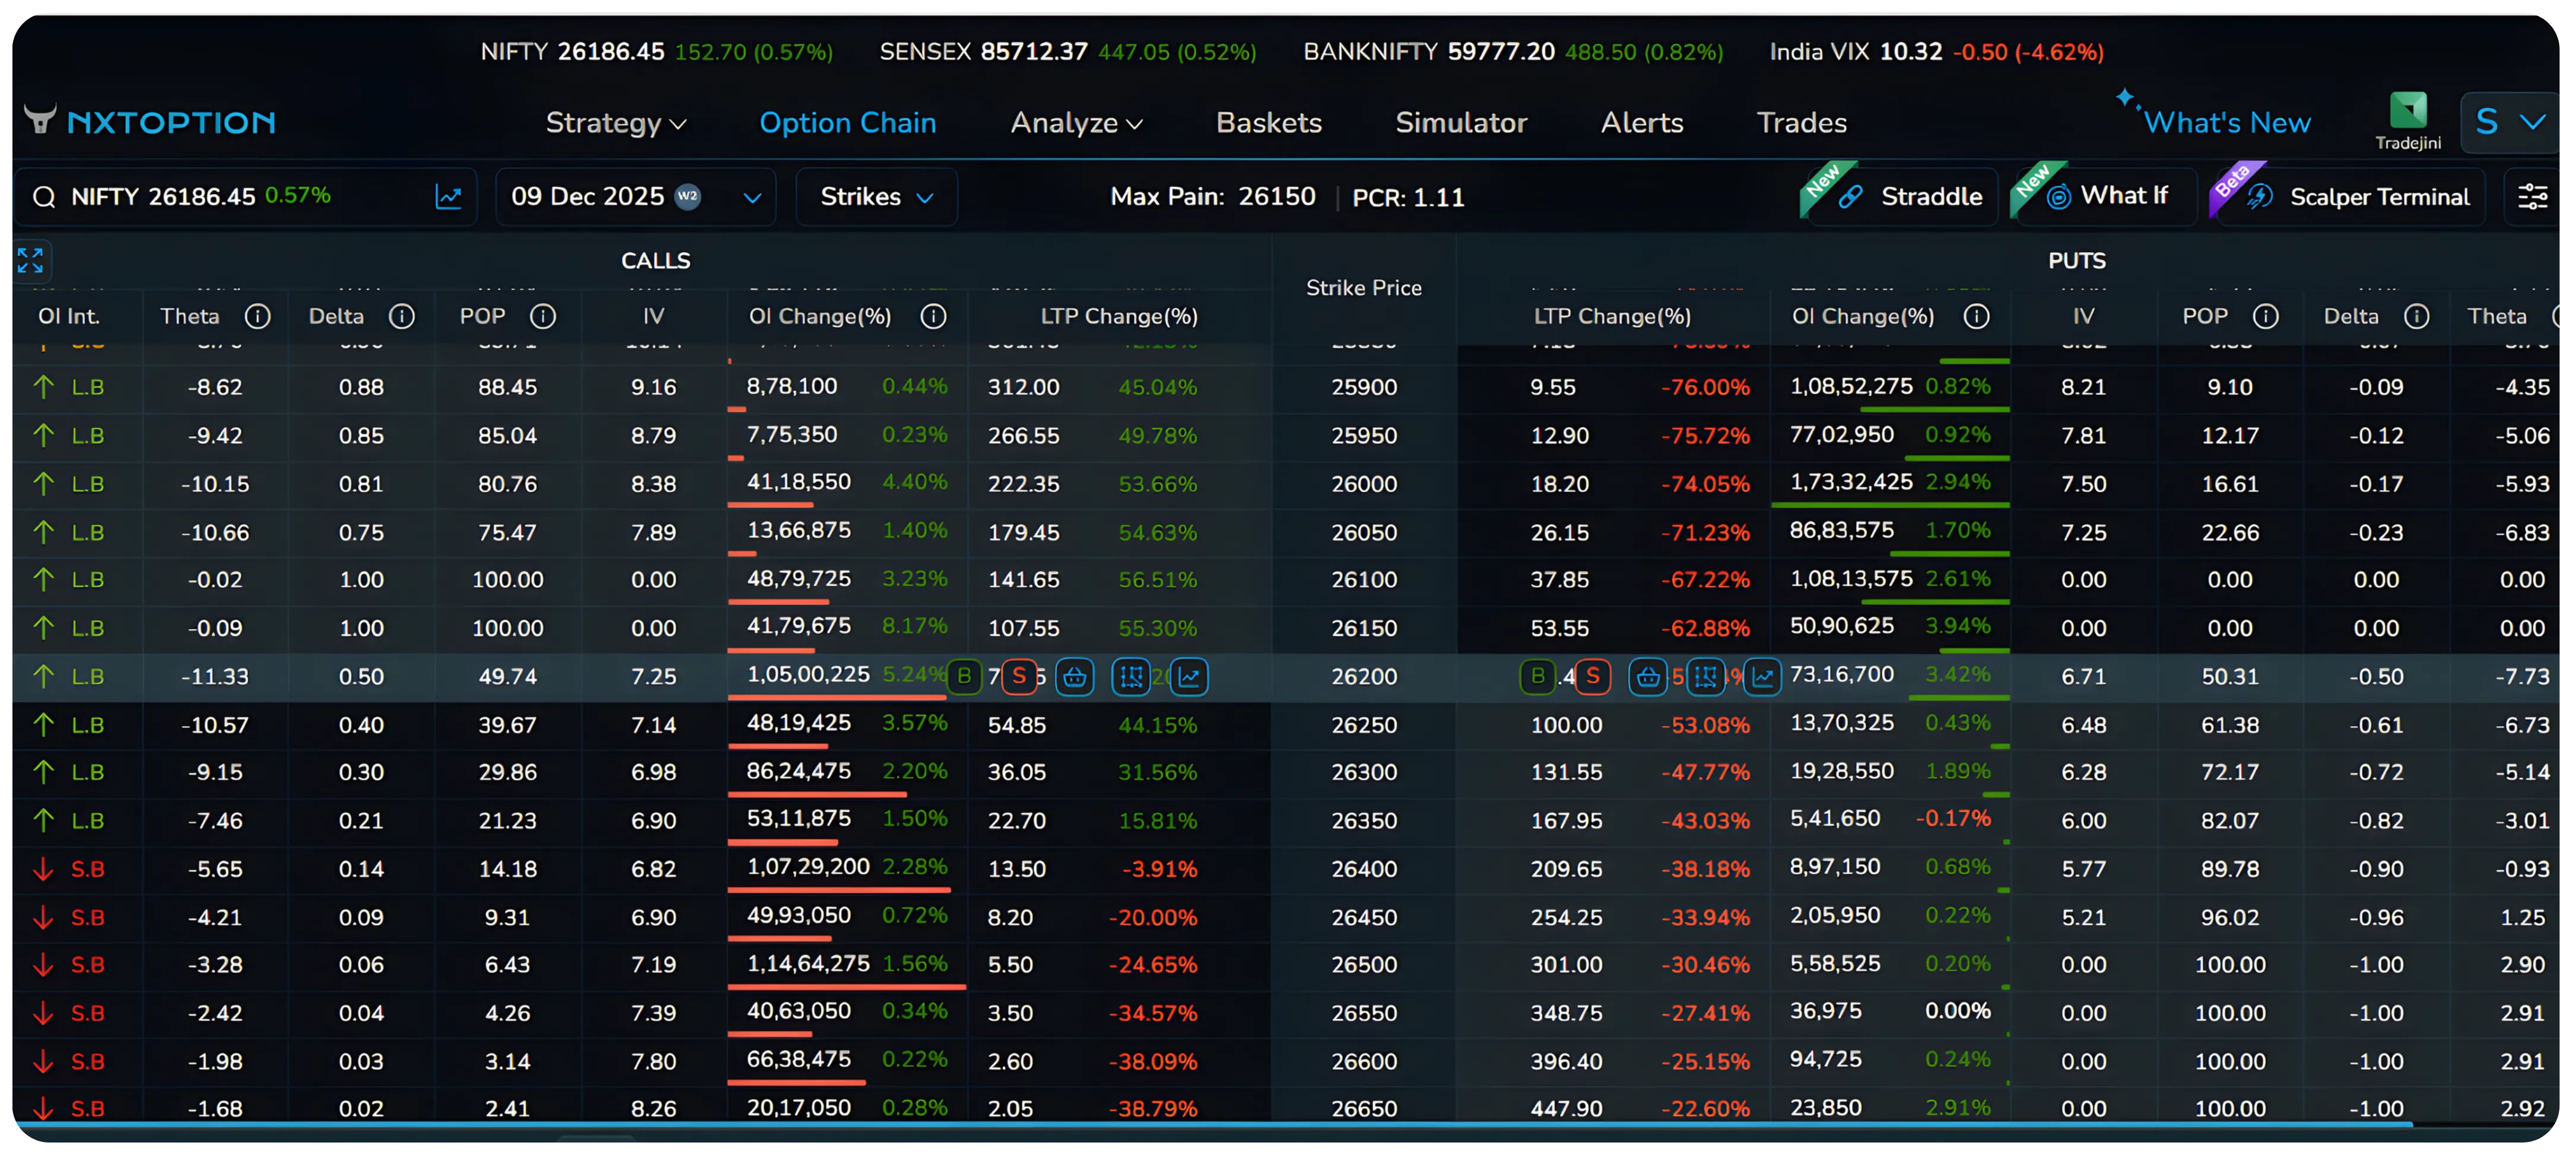
This suggests traders expect the market to remain within this band unless a breakout occurs.
7. Track Institutional Activity
FIIs and DIIs move big money. Keep an eye on FII DII flow institutional activity trading near key price zones. Consistent inflows near support validate strength.
Latest institutional flow data aligns with price stability near the 26,200–26,300 zone.
8. Study Price Action and Candlestick Patterns
If markets reject a gap-down and recover sharply, it shows buyers stepping in, a sign of strength. Structure around key price zones always matters more than one-day patterns.
9. Build Your Action Plan
If most signals point to bullishness, take long trades and avoid counter-trend shorts.
For Nifty, stops can be placed below the support zone (like below 25,900).
When trading stocks, check both the stock and its sector index trend.
For options, spreads like bull call spreads help manage volatility risk better than naked trades.
10. Keep Fundamental Events in Mind
Even strong technical setups can fail on news days. Avoid fresh positions before major triggers like RBI policy announcements, Fed meets, Budget, or major results.
Let the news settle → then follow the price.
11. Combine, Don’t Isolate
A positional view requires multiple data points to agree:
Price above EMAs
Broad Market Participation
Reasonable VIX
OI Confirmation
Institutional Support
Positive Price Action
Only then does probability swing in your favour….
A structured positional view reduces dependence on market noise and improves decision clarity. When price, momentum, volatility, open interest, and institutional activity align, probability shifts in your favour. Consistency comes from discipline, not prediction.
Start applying this framework inside CubePlus and build disciplined trading habits from day one.
Disclaimer: The information provided in our blogs is for informational purposes only and should not be construed as financial, investment, or trading advice. Trading and investing in the securities market carries risk. Always conduct your own research and consult with a qualified financial advisor before making any investment decisions. Past performance is not indicative of future results. Copyrighted and original content for your trading and investing needs.
© 2026 — Tradejini. All Rights Reserved.