


In April 2020, something happened that no trader in the history of oil prices had ever seen. Oil prices turned negative. Sellers were literally paying buyers to take crude off their hands, not as a metaphor, not as a rounding error, but as a real, recorded market price. West Texas Intermediate, the U.S. oil benchmark, briefly fell to minus $37 a barrel. This moment became one of the most unusual episodes in crude oil price history and in the broader crude oil market history.
It was unprecedented, and it made perfect sense once you understood the forces behind it.
That moment, strange as it was, is just the latest chapter in a story that has been unfolding for over fifty years. Crude oil has shaped wars, triggered recessions, redrawn trade routes, and humbled the most powerful economies on earth. No other commodity comes close to its influence. Here is how it got there in the long oil price timeline and broader energy market history.
1973: The Year Oil Became a Weapon
Before 1973, oil was largely treated as an abundant, cheap, and taken-for-granted industrial input by the Western world. That changed in October, when Arab oil-producing nations led by OAPEC announced they would stop exporting oil to countries that had supported Israel during the Yom Kippur War.
This moment, widely known as the 1973 oil embargo, or arab oil embargo, marked the beginning of the modern oil price crisis history. The embargo, coordinated through OAPEC in response to the Yom Kippur War oil tensions, fundamentally reshaped global energy markets.
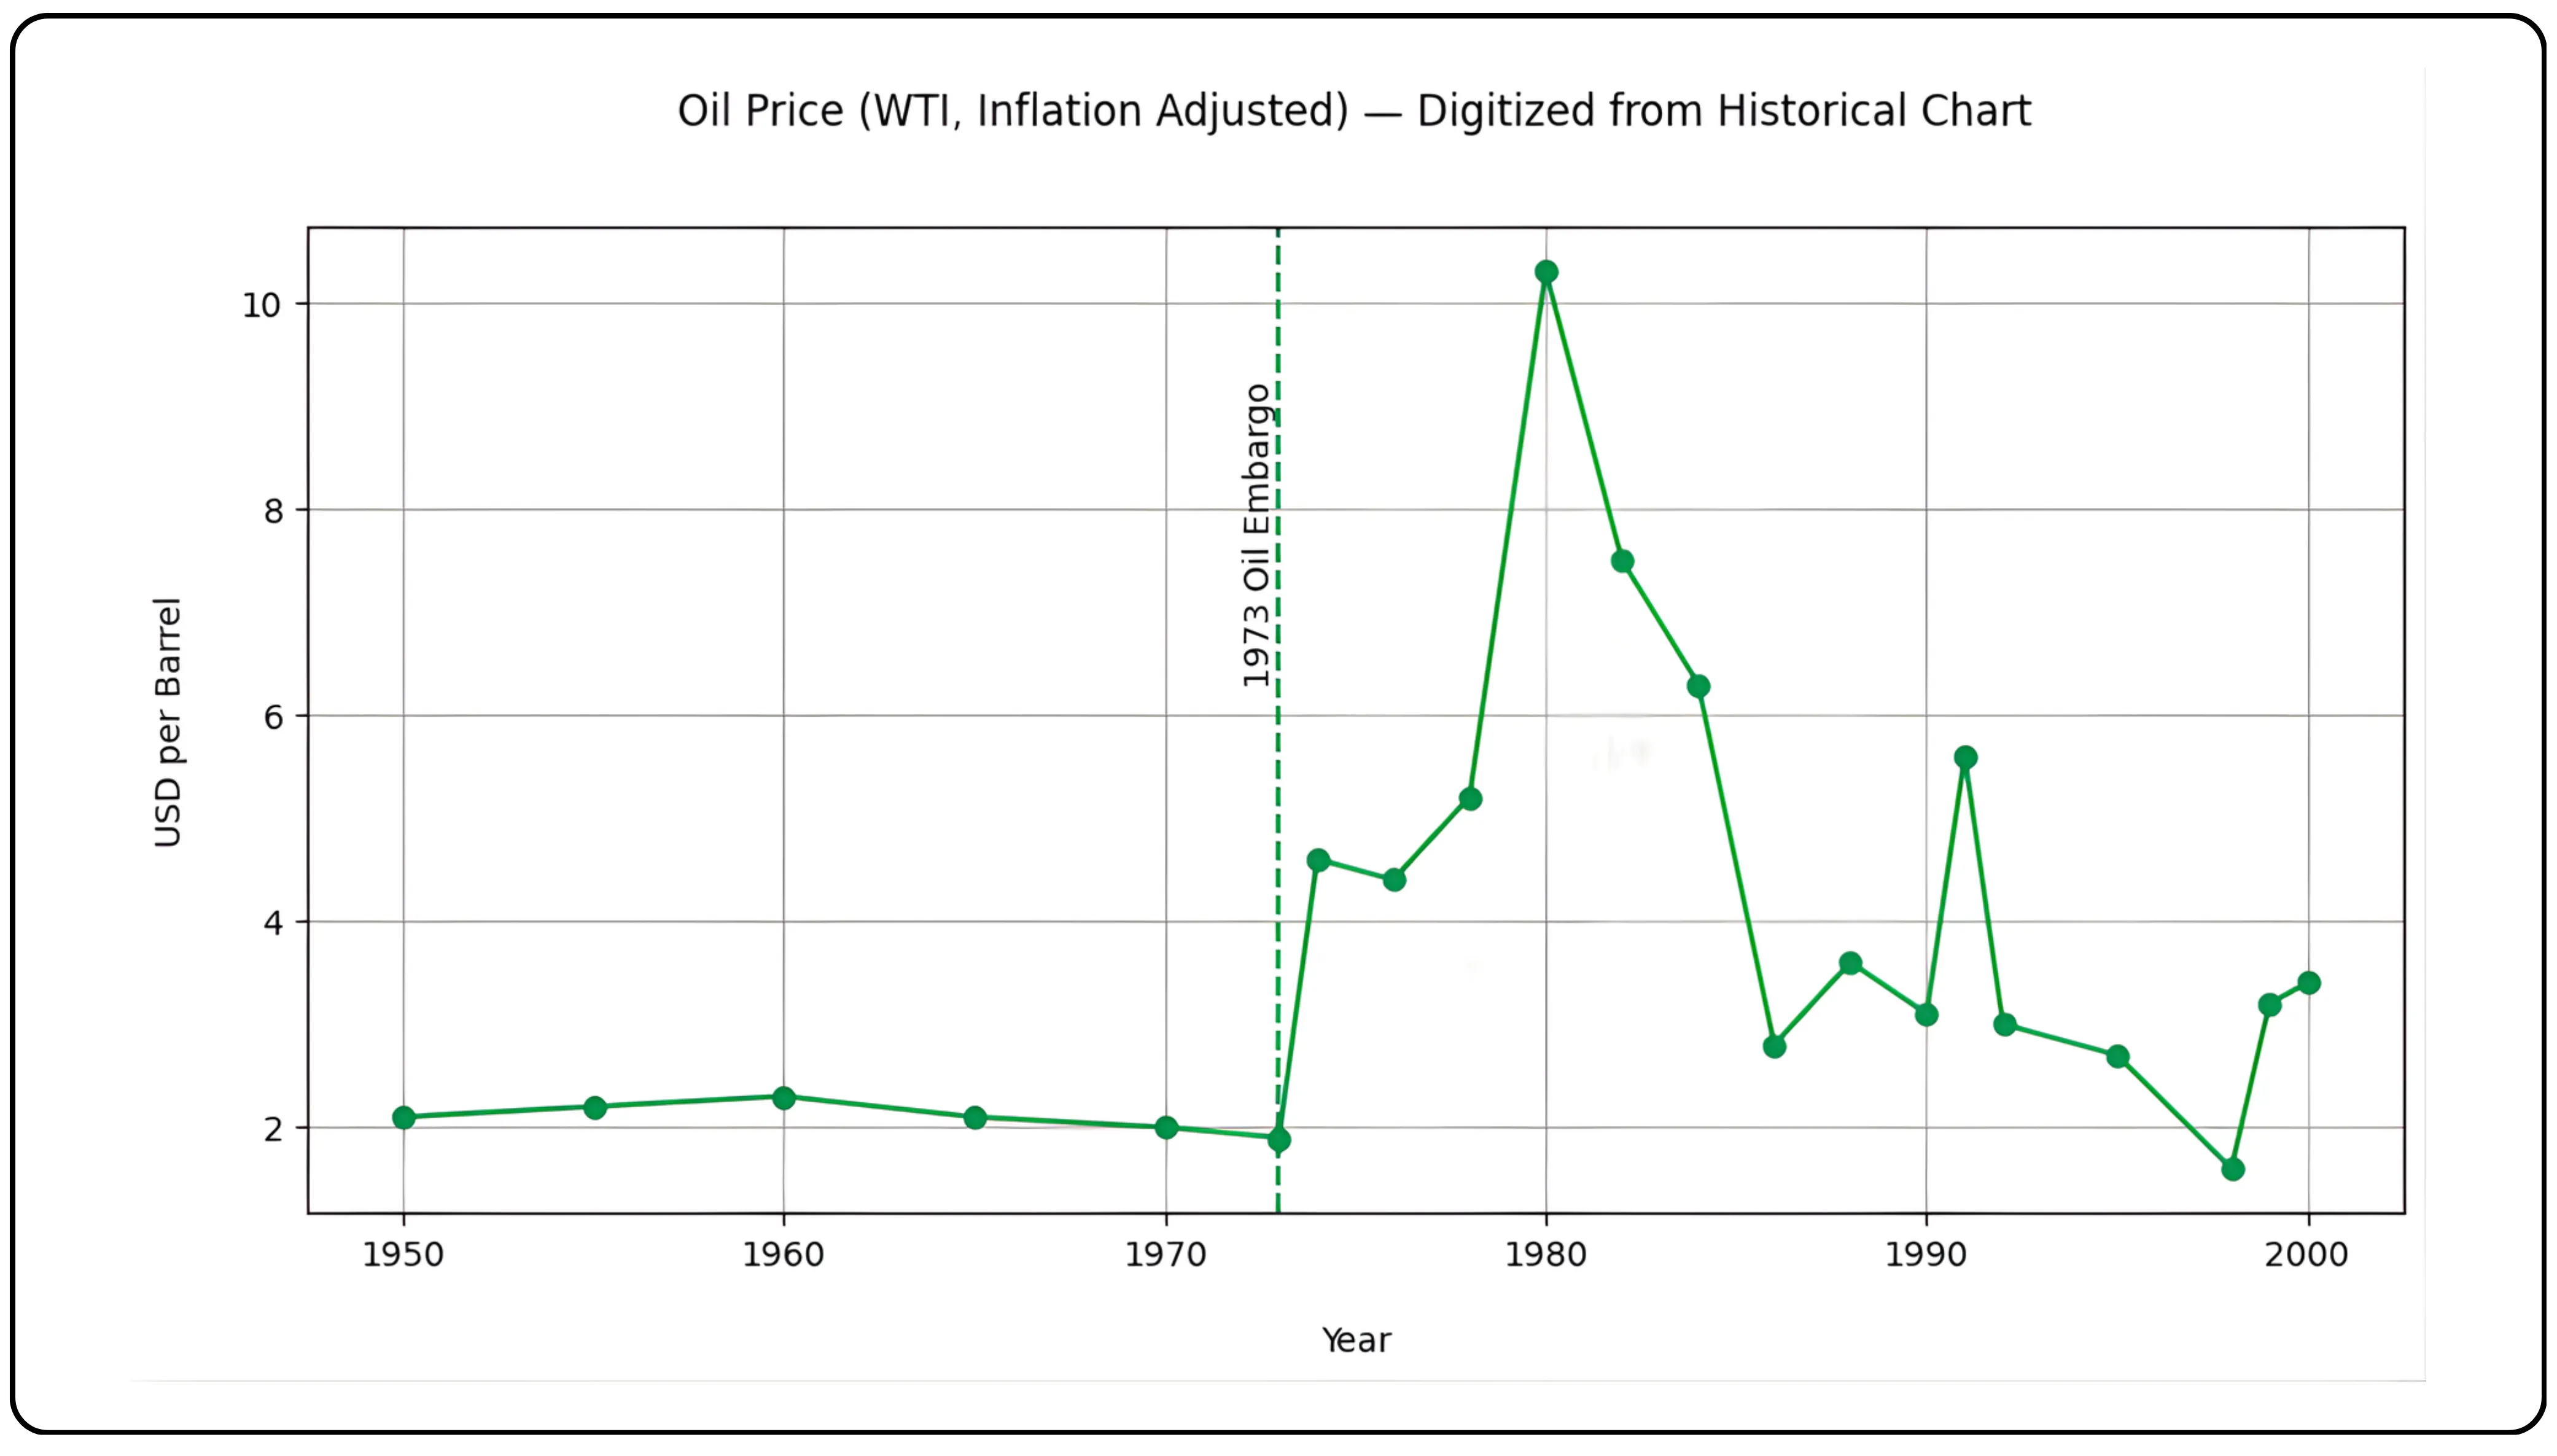
The effect was immediate and brutal. Oil prices 1973 surged dramatically as prices quadrupled within months. Petrol queues stretched around the block in the United States and across Europe. Inflation surged, highlighting the connection between oil price inflation and economic stability. Economies that had been humming along suddenly found themselves vulnerable to a resource they had never thought to protect.
The 1973 oil crisis did something more lasting than cause a recession. It changed how the world thought about energy. Oil was no longer just fuel. It was leverage. It was foreign policy. For the first time, a group of producing nations had demonstrated that they could bring industrialized economies to their lowest, not with armies, but with a supply cut.
Also Read: Gold’s Evolution of Ancient Wealth to Modern Investment Shield
OPEC: How a Cartel Learned to Move Markets
The Organization of the Petroleum Exporting Countries was founded in 1960, marking the beginning of OPEC cartel history, but it was the events of 1973 that revealed its true power. Over the following decades, OPEC evolved into something the world had never quite seen before: a cartel capable of managing the price of the single most important commodity in the global economy.
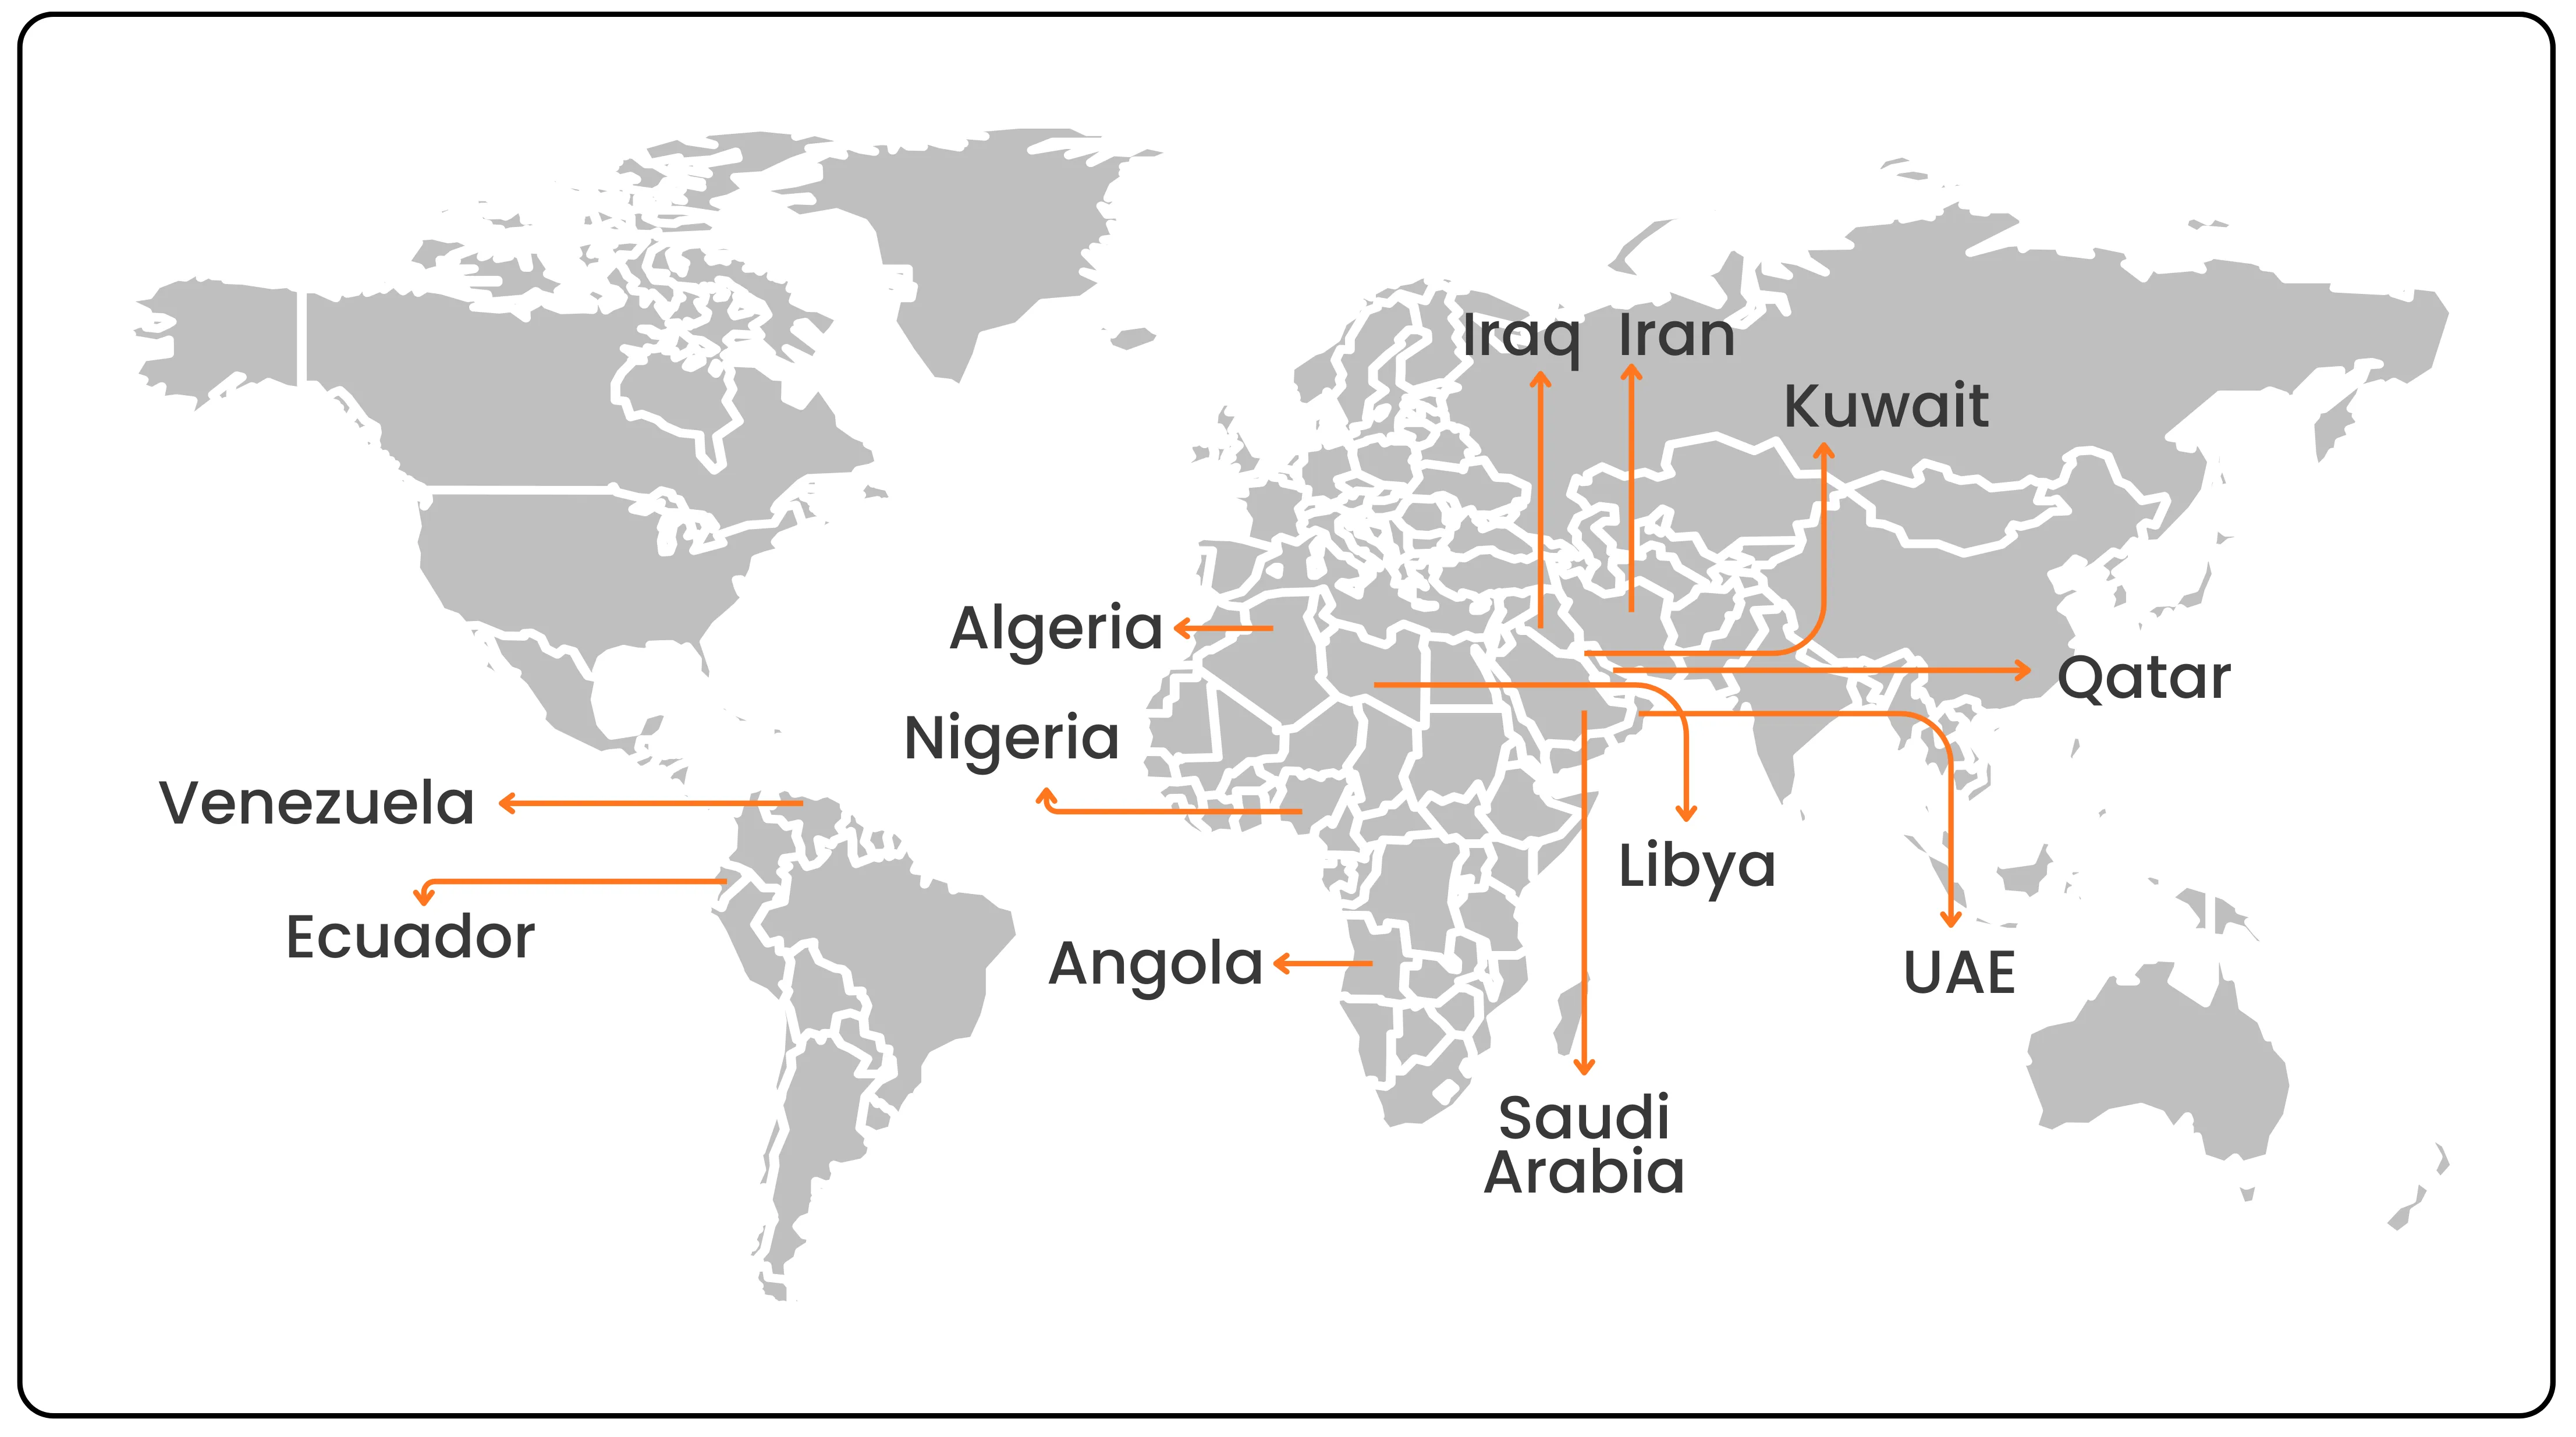
The mechanism is straightforward. When OPEC's member nations agree to reduce their collective production through OPEC production cuts, global supply tightens and prices rise. When they open the taps, supply floods the market, and prices fall. By coordinating these decisions, member countries, many of them holding vast reserves beneath their deserts and seabeds, gained the ability to set the tempo for global inflation, energy costs, and economic growth.
In more recent years, OPEC has expanded its coordination to include Russia and several other non-member producers, forming what is now known as OPEC Plus aka OPEC+. Today, this alliance controls a substantial share of global oil output. A single production announcement from Vienna can move markets within minutes and increase oil price volatility.
2008: The Supercycle and the Crash
The mid-2000s saw a new force enter the oil market at scale: the rise of China and India as major industrial economies. As hundreds of millions of people moved into the middle class, demand for fuel, plastics, and manufactured goods surged. Oil markets, caught between strong demand and limited spare capacity, responded the only way markets know how.
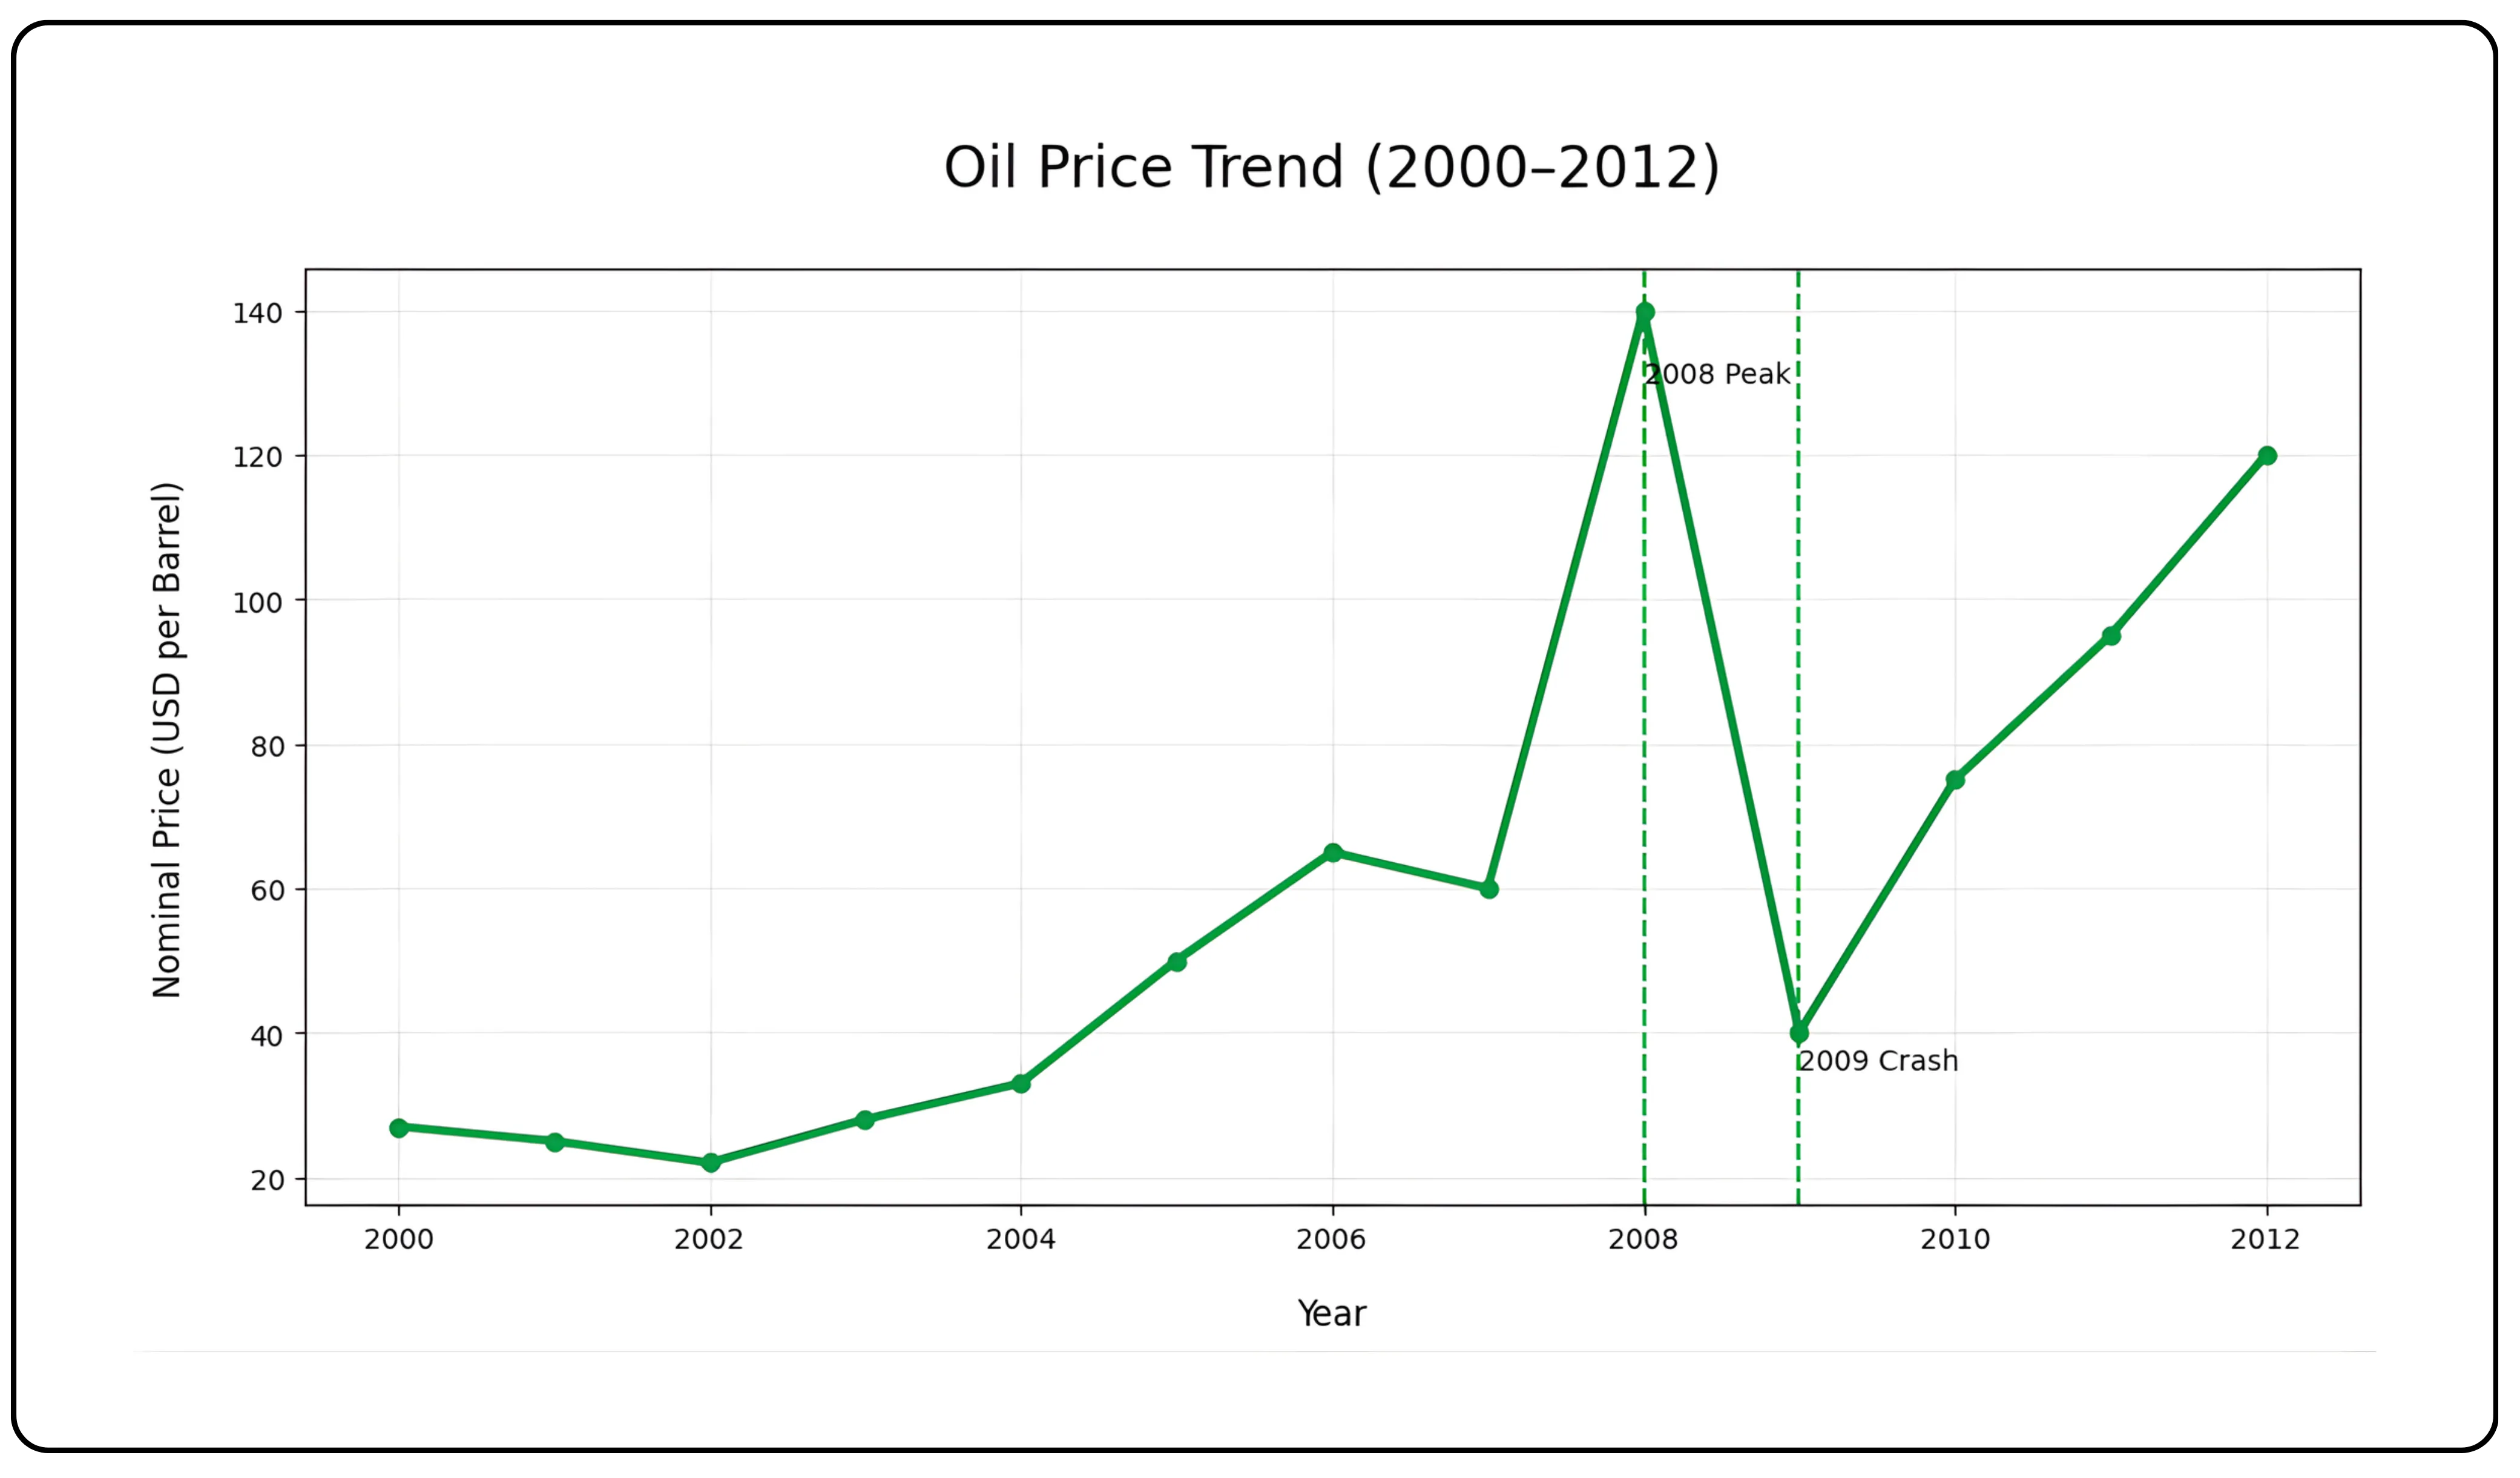
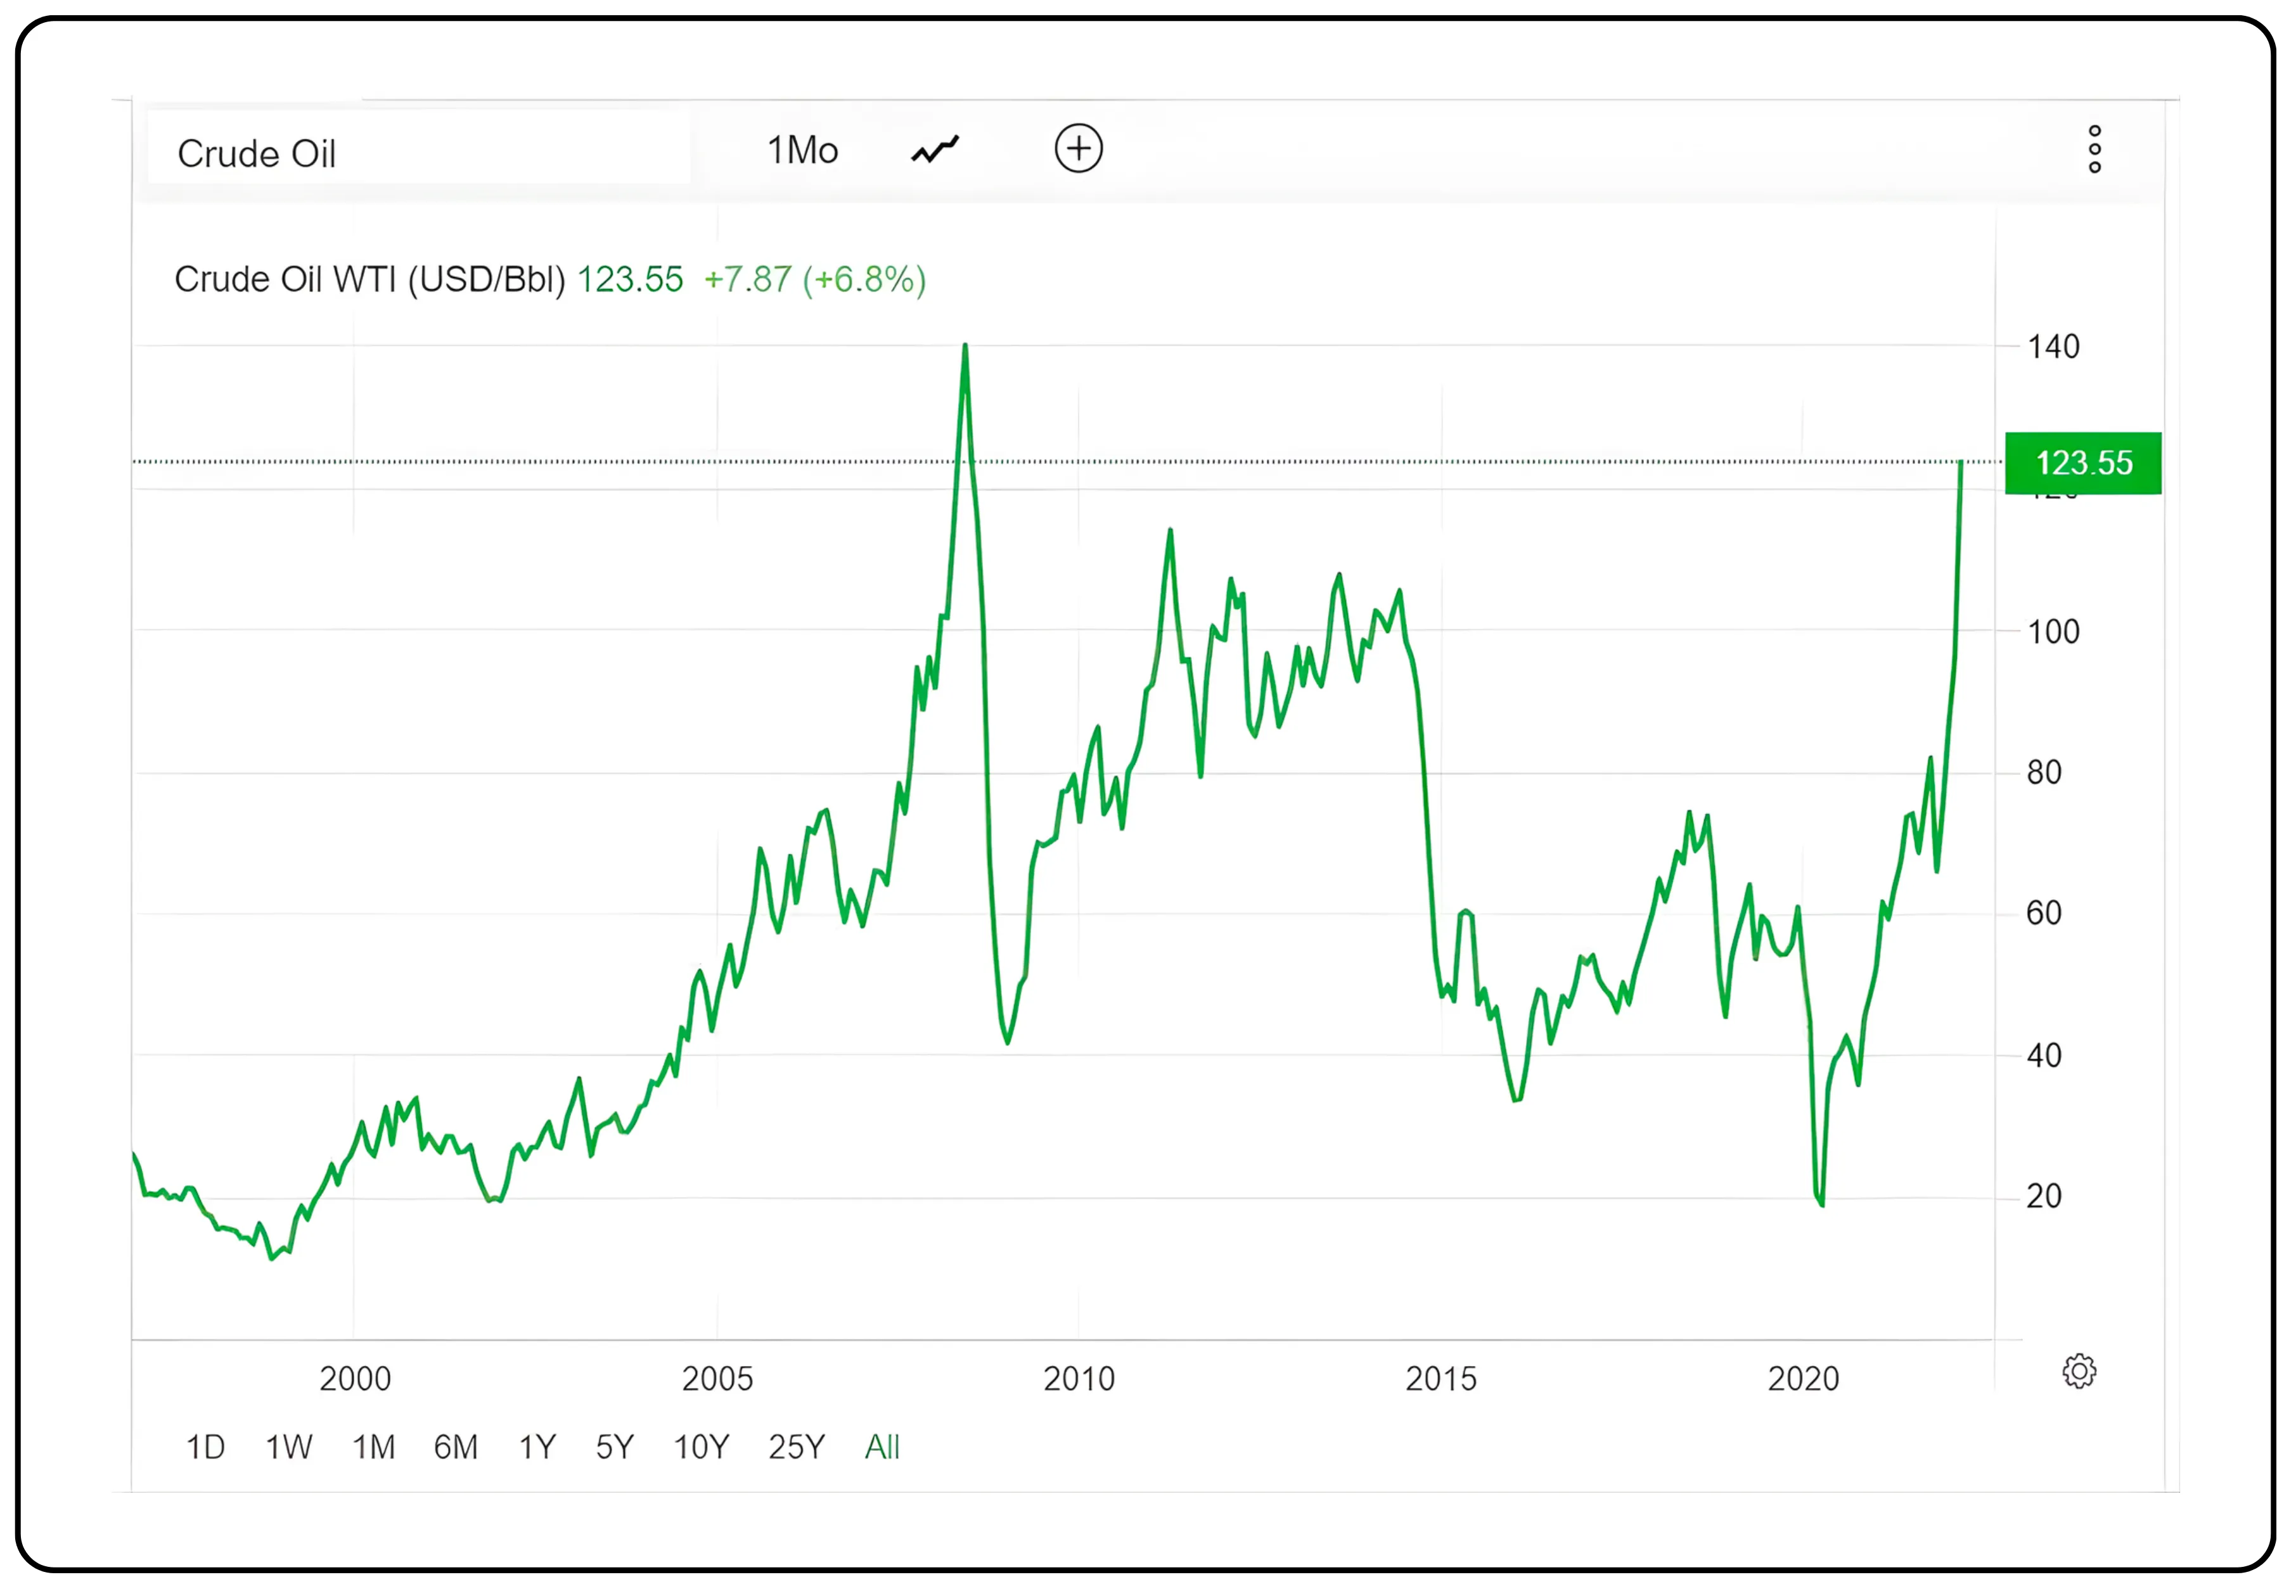
Prices climbed. Then they kept climbing. By July 2008, Brent crude the international benchmark, reached approximately Brent crude $147 per barrel. This period is often cited in oil price 2008 discussions and became a defining phase of the global commodity supercycle. Analysts began debating whether oil might reach $200. The phrase commodity supercycle entered the everyday vocabulary of financial markets.
Then, within weeks, everything changed. The global financial crisis triggered by the collapse of the US housing market and a cascade of failures across the banking system destroyed demand almost overnight. Credit froze, factories cut output, and consumers stopped spending. Oil fell below $40 a barrel by the end of the year. The supercycle had not just ended. It had collapsed.
Read in detail: The inside story of the 2008 Crisis
2020: The Day Prices Went Below Zero
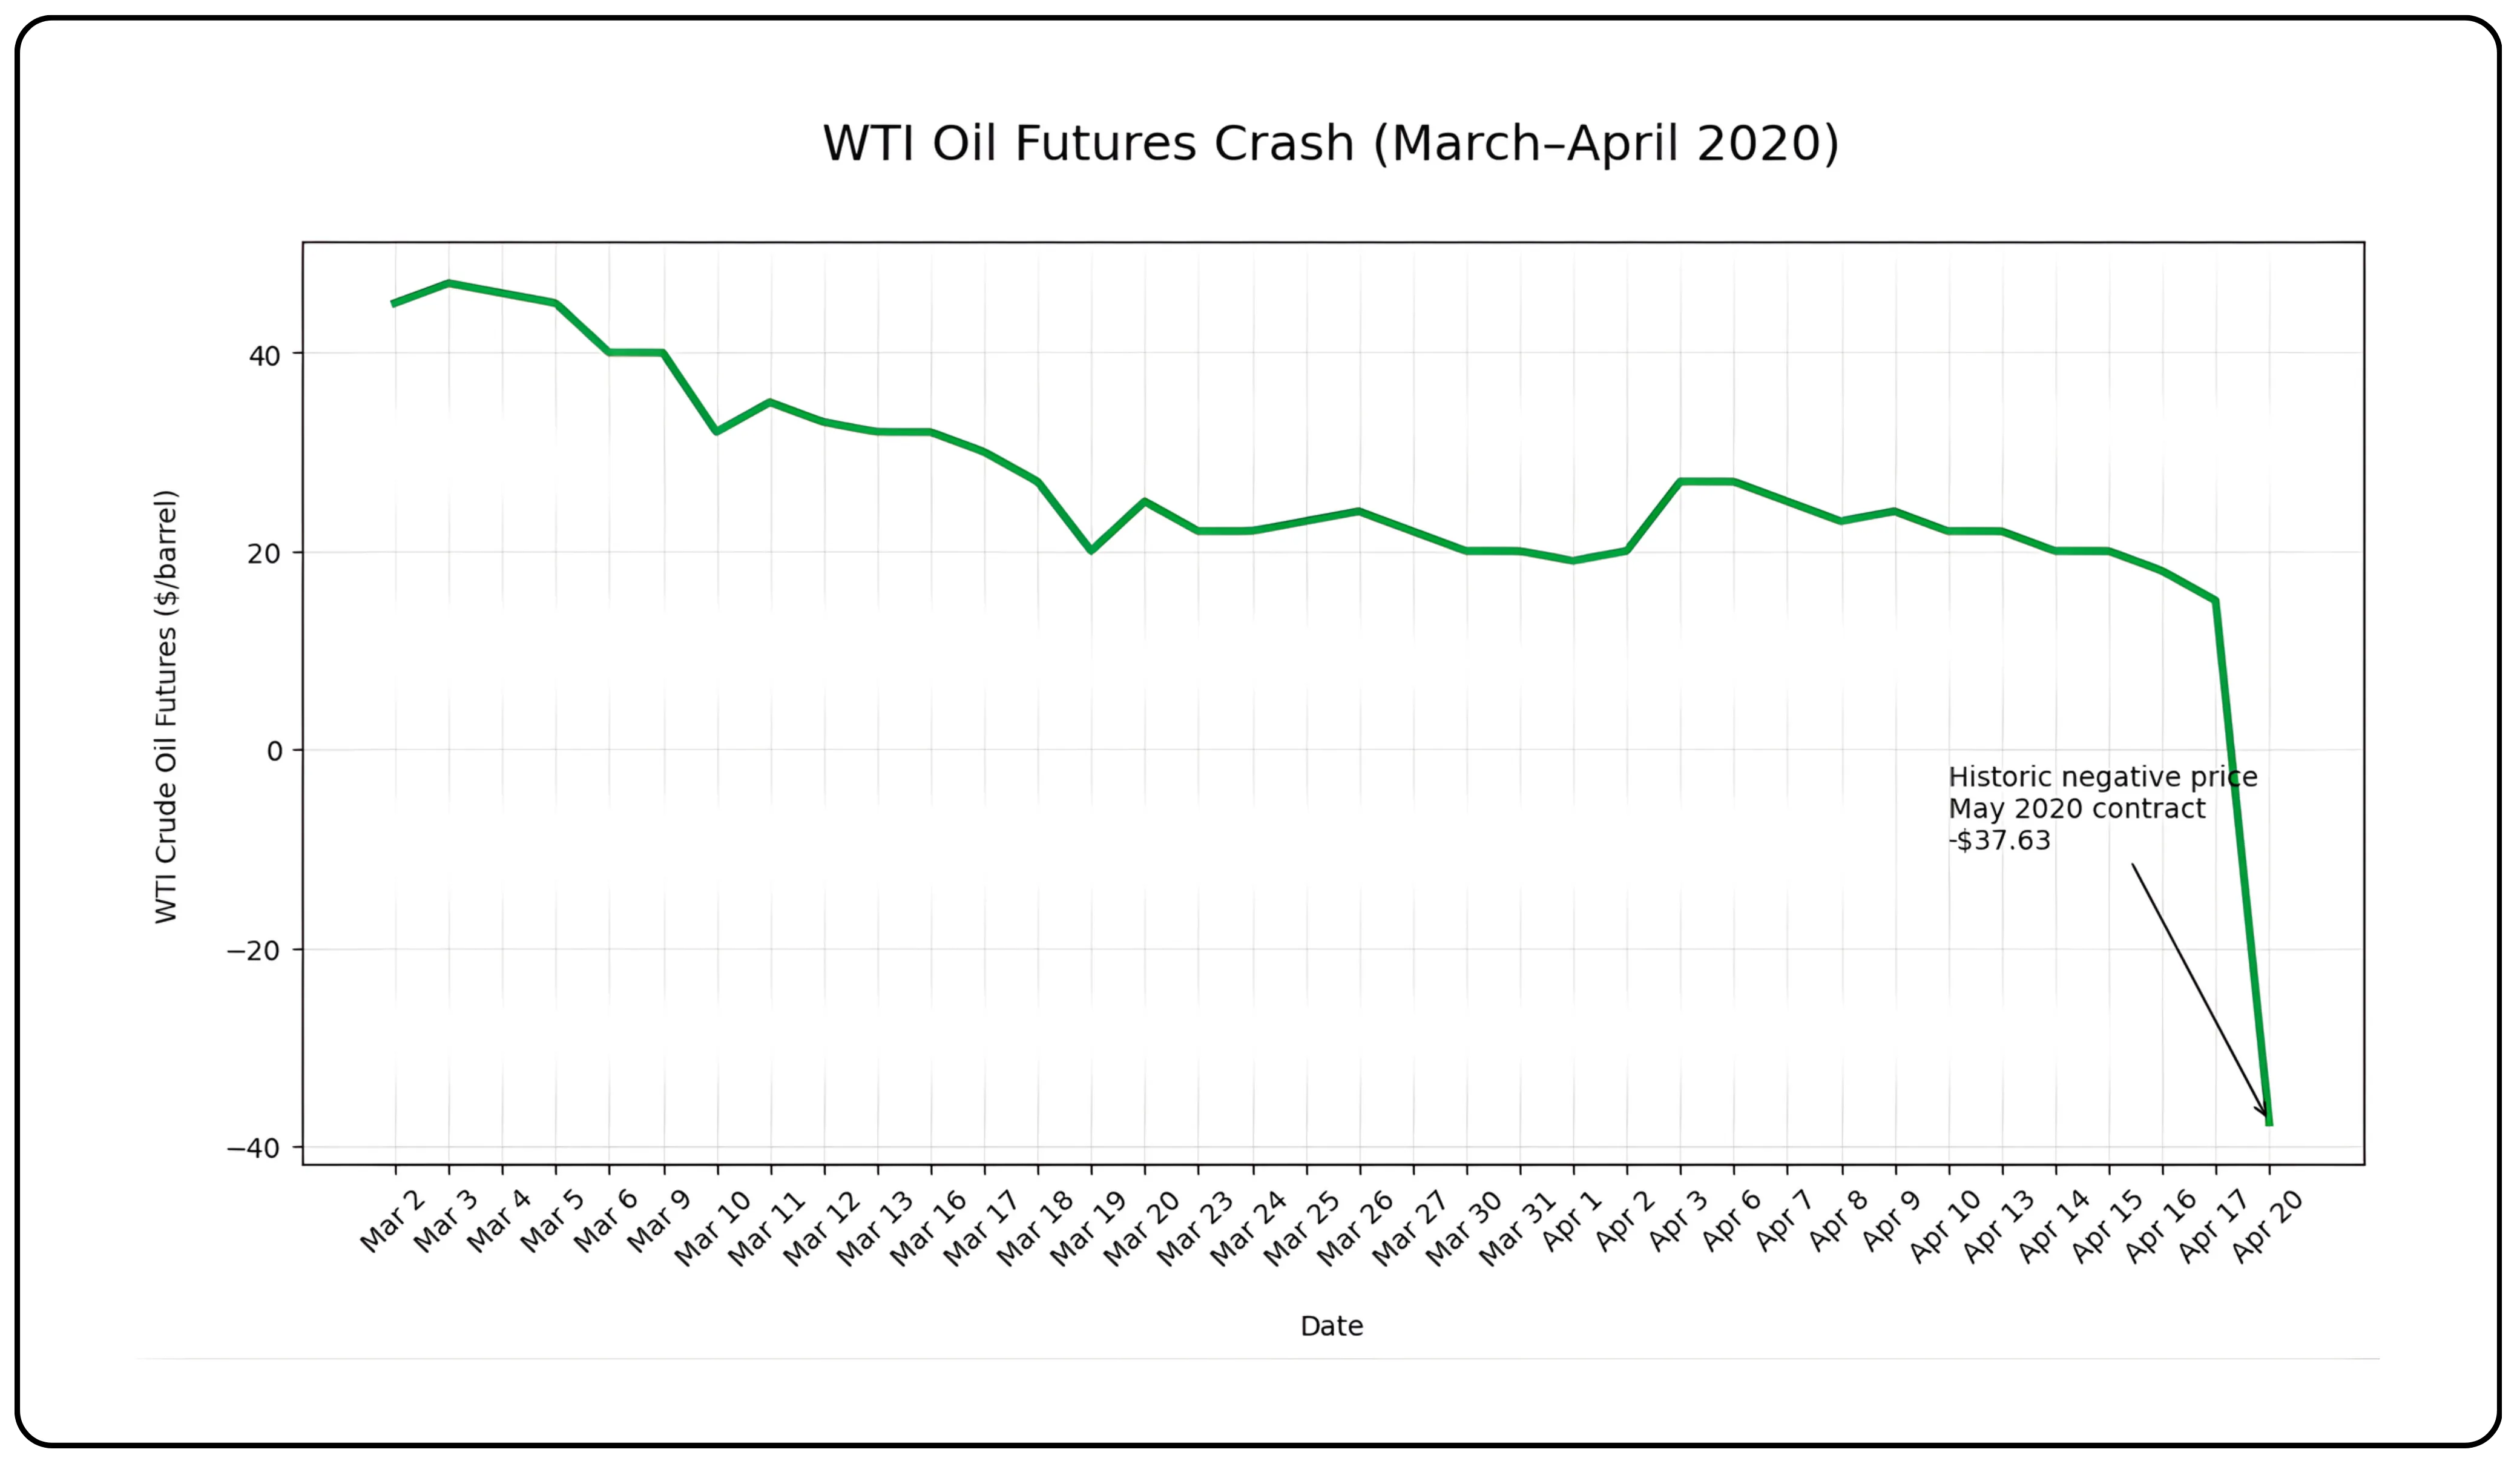
Nothing in the long, turbulent history of oil prices prepared markets for April 20, 2020.
COVID-19 had brought the global economy to a halt. Lockdowns had grounded aircraft, emptied motorways, and shuttered factories across the world. Fuel demand fell faster than producers could adjust. At the same time, storage tanks on land and at sea were filling up rapidly. Traders holding futures contracts for oil deliveries in May suddenly realised they had a serious problem: if they took physical delivery, they had nowhere to store it.
The result was a moment of pure market panic. WTI negative oil prices event. WTI crude futures briefly traded at a negative $37.63 per barrel. Sellers were paying buyers to take oil away. It was not a glitch or a technical anomaly. It was a genuine reflection of what happens when supply dramatically outpaces both demand and storage capacity simultaneously.
This period is now widely studied in discussions of oil prices 2020 and COVID oil prices across global energy markets.
The episode passed quickly; prices recovered as lockdowns eased and demand returned, but it revealed just how fragile the global oil system can become under the right combination of pressures.
2022: War, Sanctions, and the Return of Geopolitics
Energy markets had barely recovered from the pandemic when Russia invaded Ukraine in February 2022. Western nations responded with sweeping sanctions targeting the Russian economy, including significant restrictions on its oil sector. Russia, at that time one of the world's largest oil exporters, suddenly found itself partially cut off from its traditional customers.
Oil prices surged once again. Brent Crude climbed above $130 per barrel in March 2022, its highest level since 2008. European governments scrambled to find alternative suppliers. The concept of energy security, the idea that reliable access to fuel cannot be taken for granted, moved from policy papers into urgent political debate.
The crisis also illustrated how geopolitical disruptions reshape trade routes in real time. India, for instance, dramatically increased imports of discounted Russian crude, leading to a surge in India Russian crude oil purchases. As traditional buyers stepped back, new flows emerged in global markets.
What had been a relatively stable global oil trade network reorganised itself within months.
What Fifty Years of Oil History Tells Us
Taken together, these episodes show that oil markets rarely move on supply and demand alone. Prices are often shaped by oil price geopolitics, policy decisions, economic cycles, and broader geopolitical oil risk.
For investors, policymakers, and market participants, crude oil remains one of the most closely watched commodities in the world. Its price affects inflation, transportation costs, manufacturing, and government policy across multiple economies.
While the future direction of oil markets is uncertain, history of oil prices suggests that periods of stability can quickly give way to sharp volatility when economic, political, or supply dynamics shift.
Understanding these past turning points provides useful context for interpreting the next major move in global energy markets.
Market movements may be unpredictable in the short term, but consistent investing can help smooth the ride. Explore Tradejini’s mutual fund investments and start a SIP today to build long-term wealth.
Disclaimer: The information provided in our blogs is for informational purposes only and should not be construed as financial, investment, or trading advice. Trading and investing in the securities market carries risk. Always conduct your own research and consult with a qualified financial advisor before making any investment decisions. Past performance is not indicative of future results. Copyrighted and original content for your trading and investing needs.
© 2026 — Tradejini. All Rights Reserved.