Concalls
Inside a wind turbine, near the top where the main housing turns to face the wind, there is a stack of specially designed steel washers called disc springs. Although they are small, they can generate a very strong force when compressed. Each time they are squeezed, they flatten slightly and then spring back to their original shape. They repeat this process millions of times over many years, working reliably through heat, cold, rain, and salty coastal air, all without needing regular maintenance.
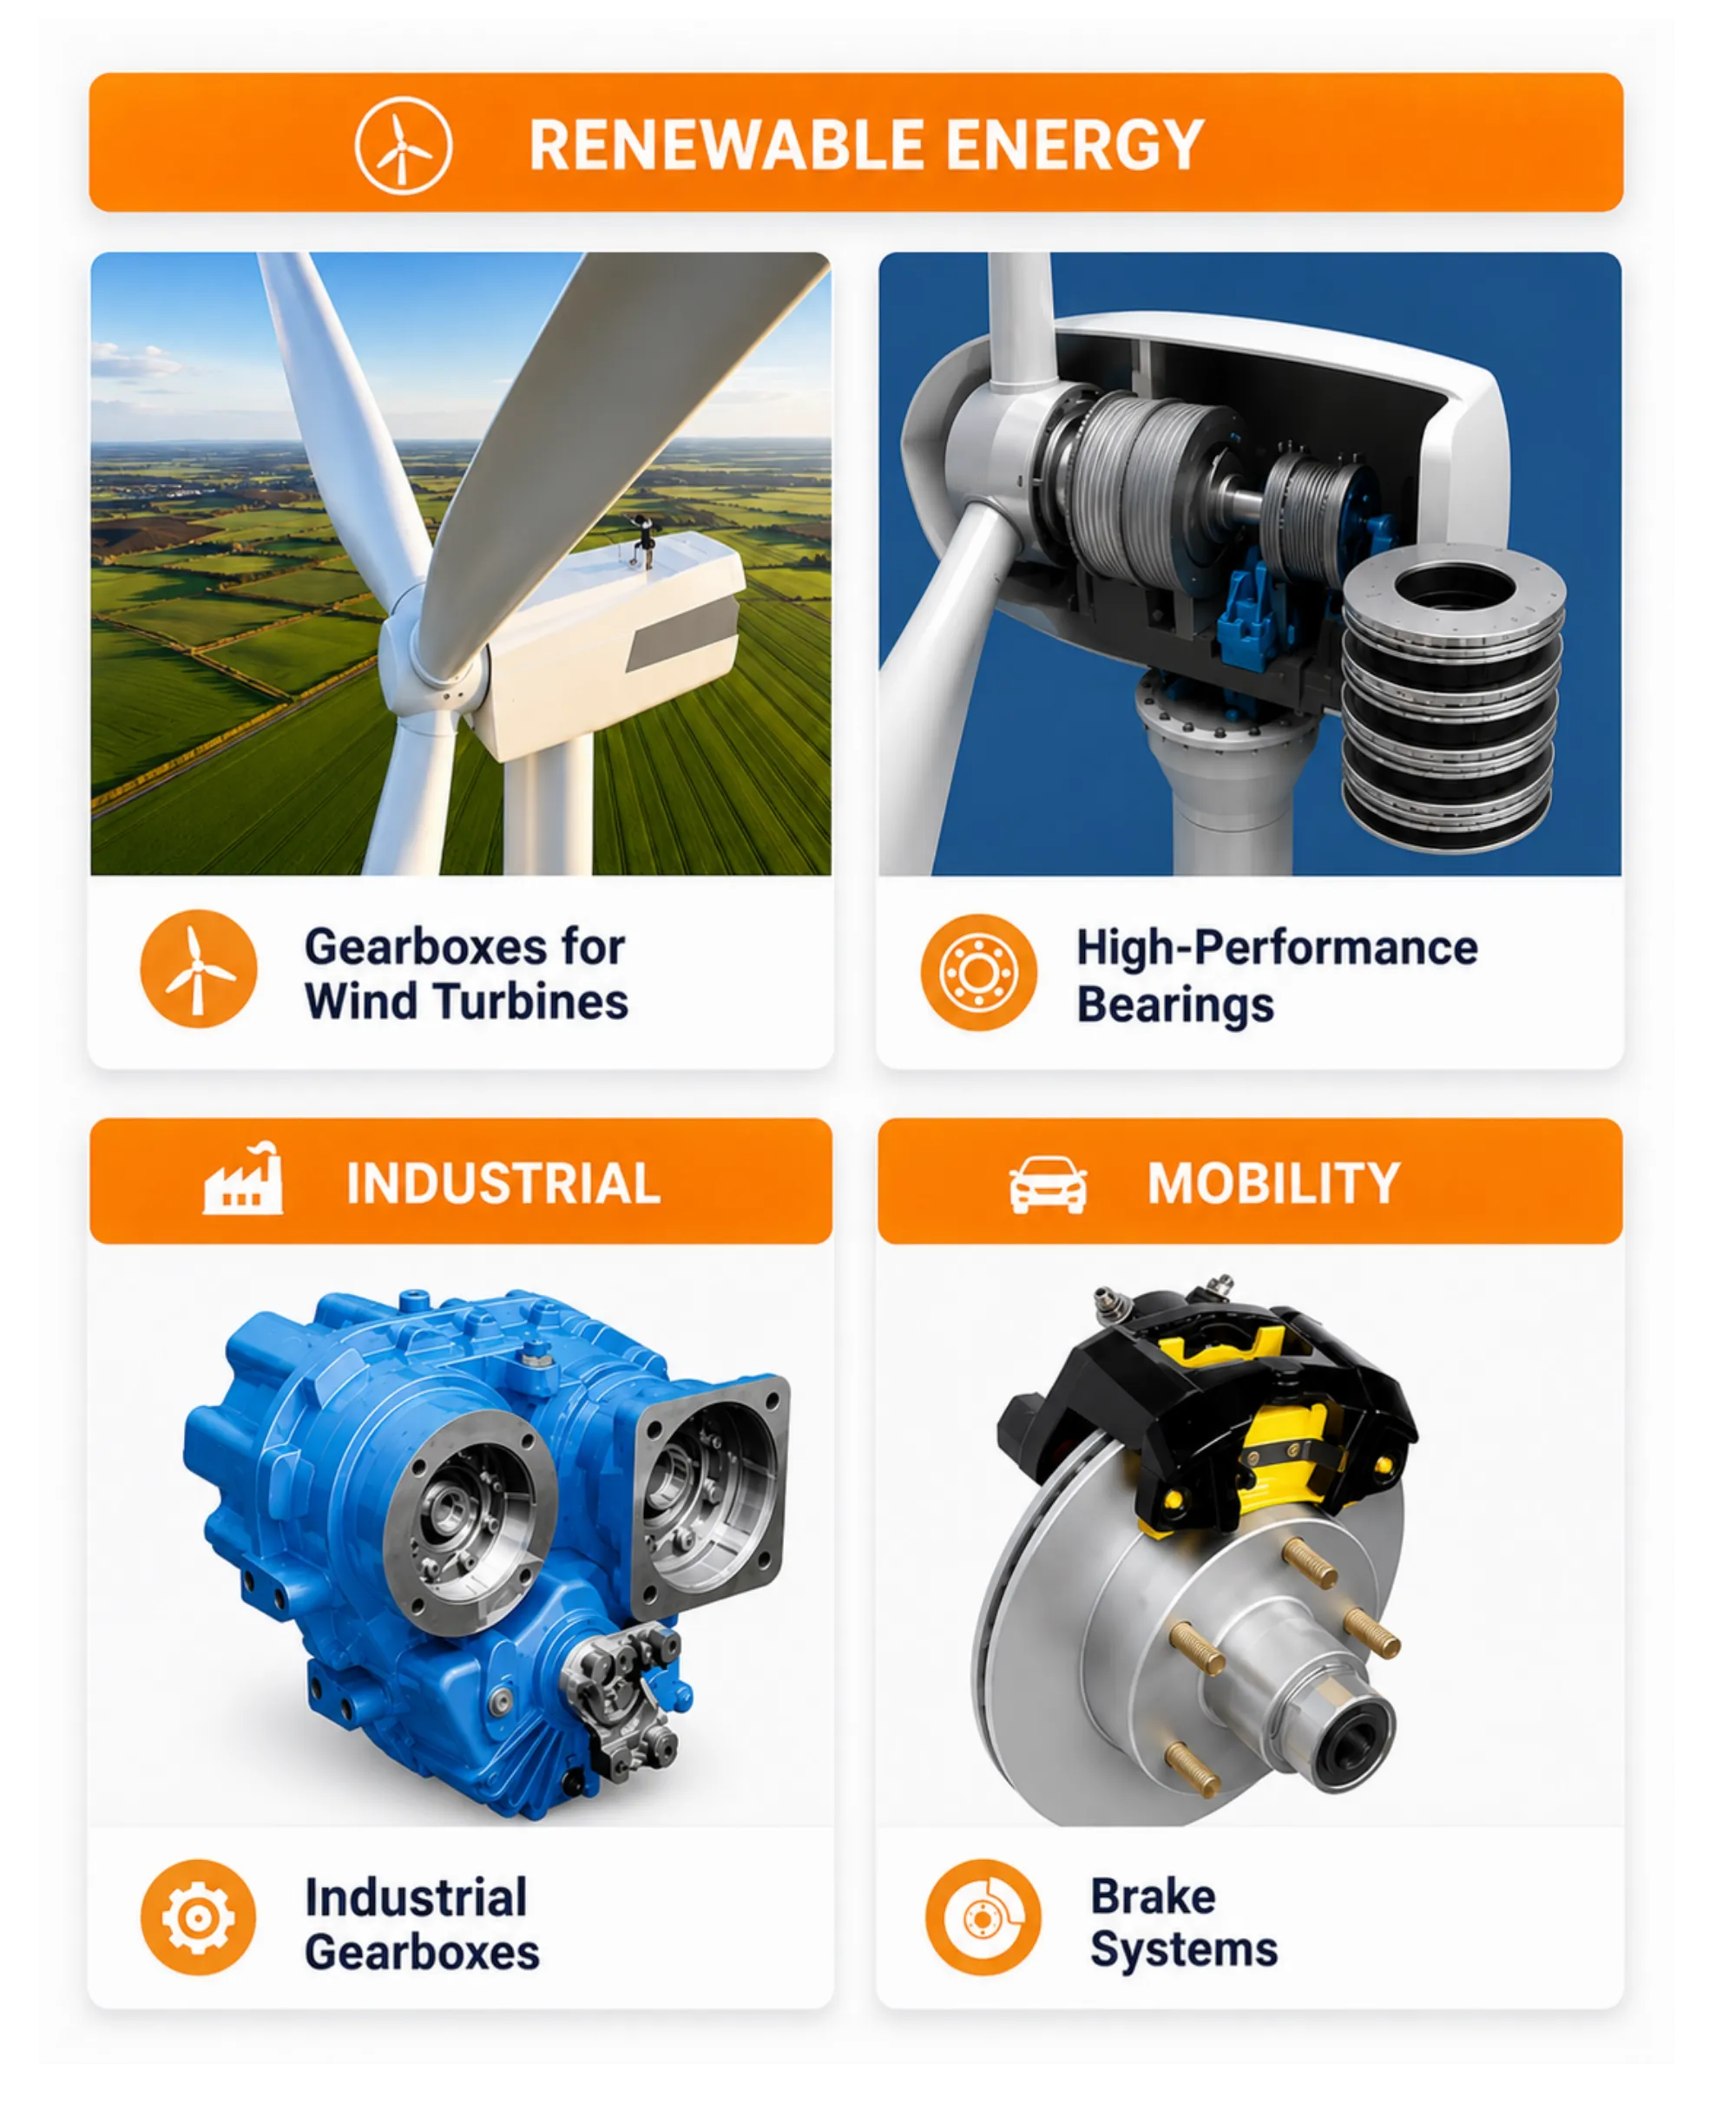
The disc costs very little. The turbine costs a great deal. If the disc relaxes, the brake that holds the nacelle steady begins to slip, and a machine that was supposed to run untouched for twenty years needs a crane and a service crew. This is the economics that Gala Precision Engineering has built a business on. It sells the confidence that a customer never has to think about a particular small component again. That confidence takes years to earn, is granted one customer and one part at a time, and is rarely withdrawn once given.
How the Business Actually Makes Money
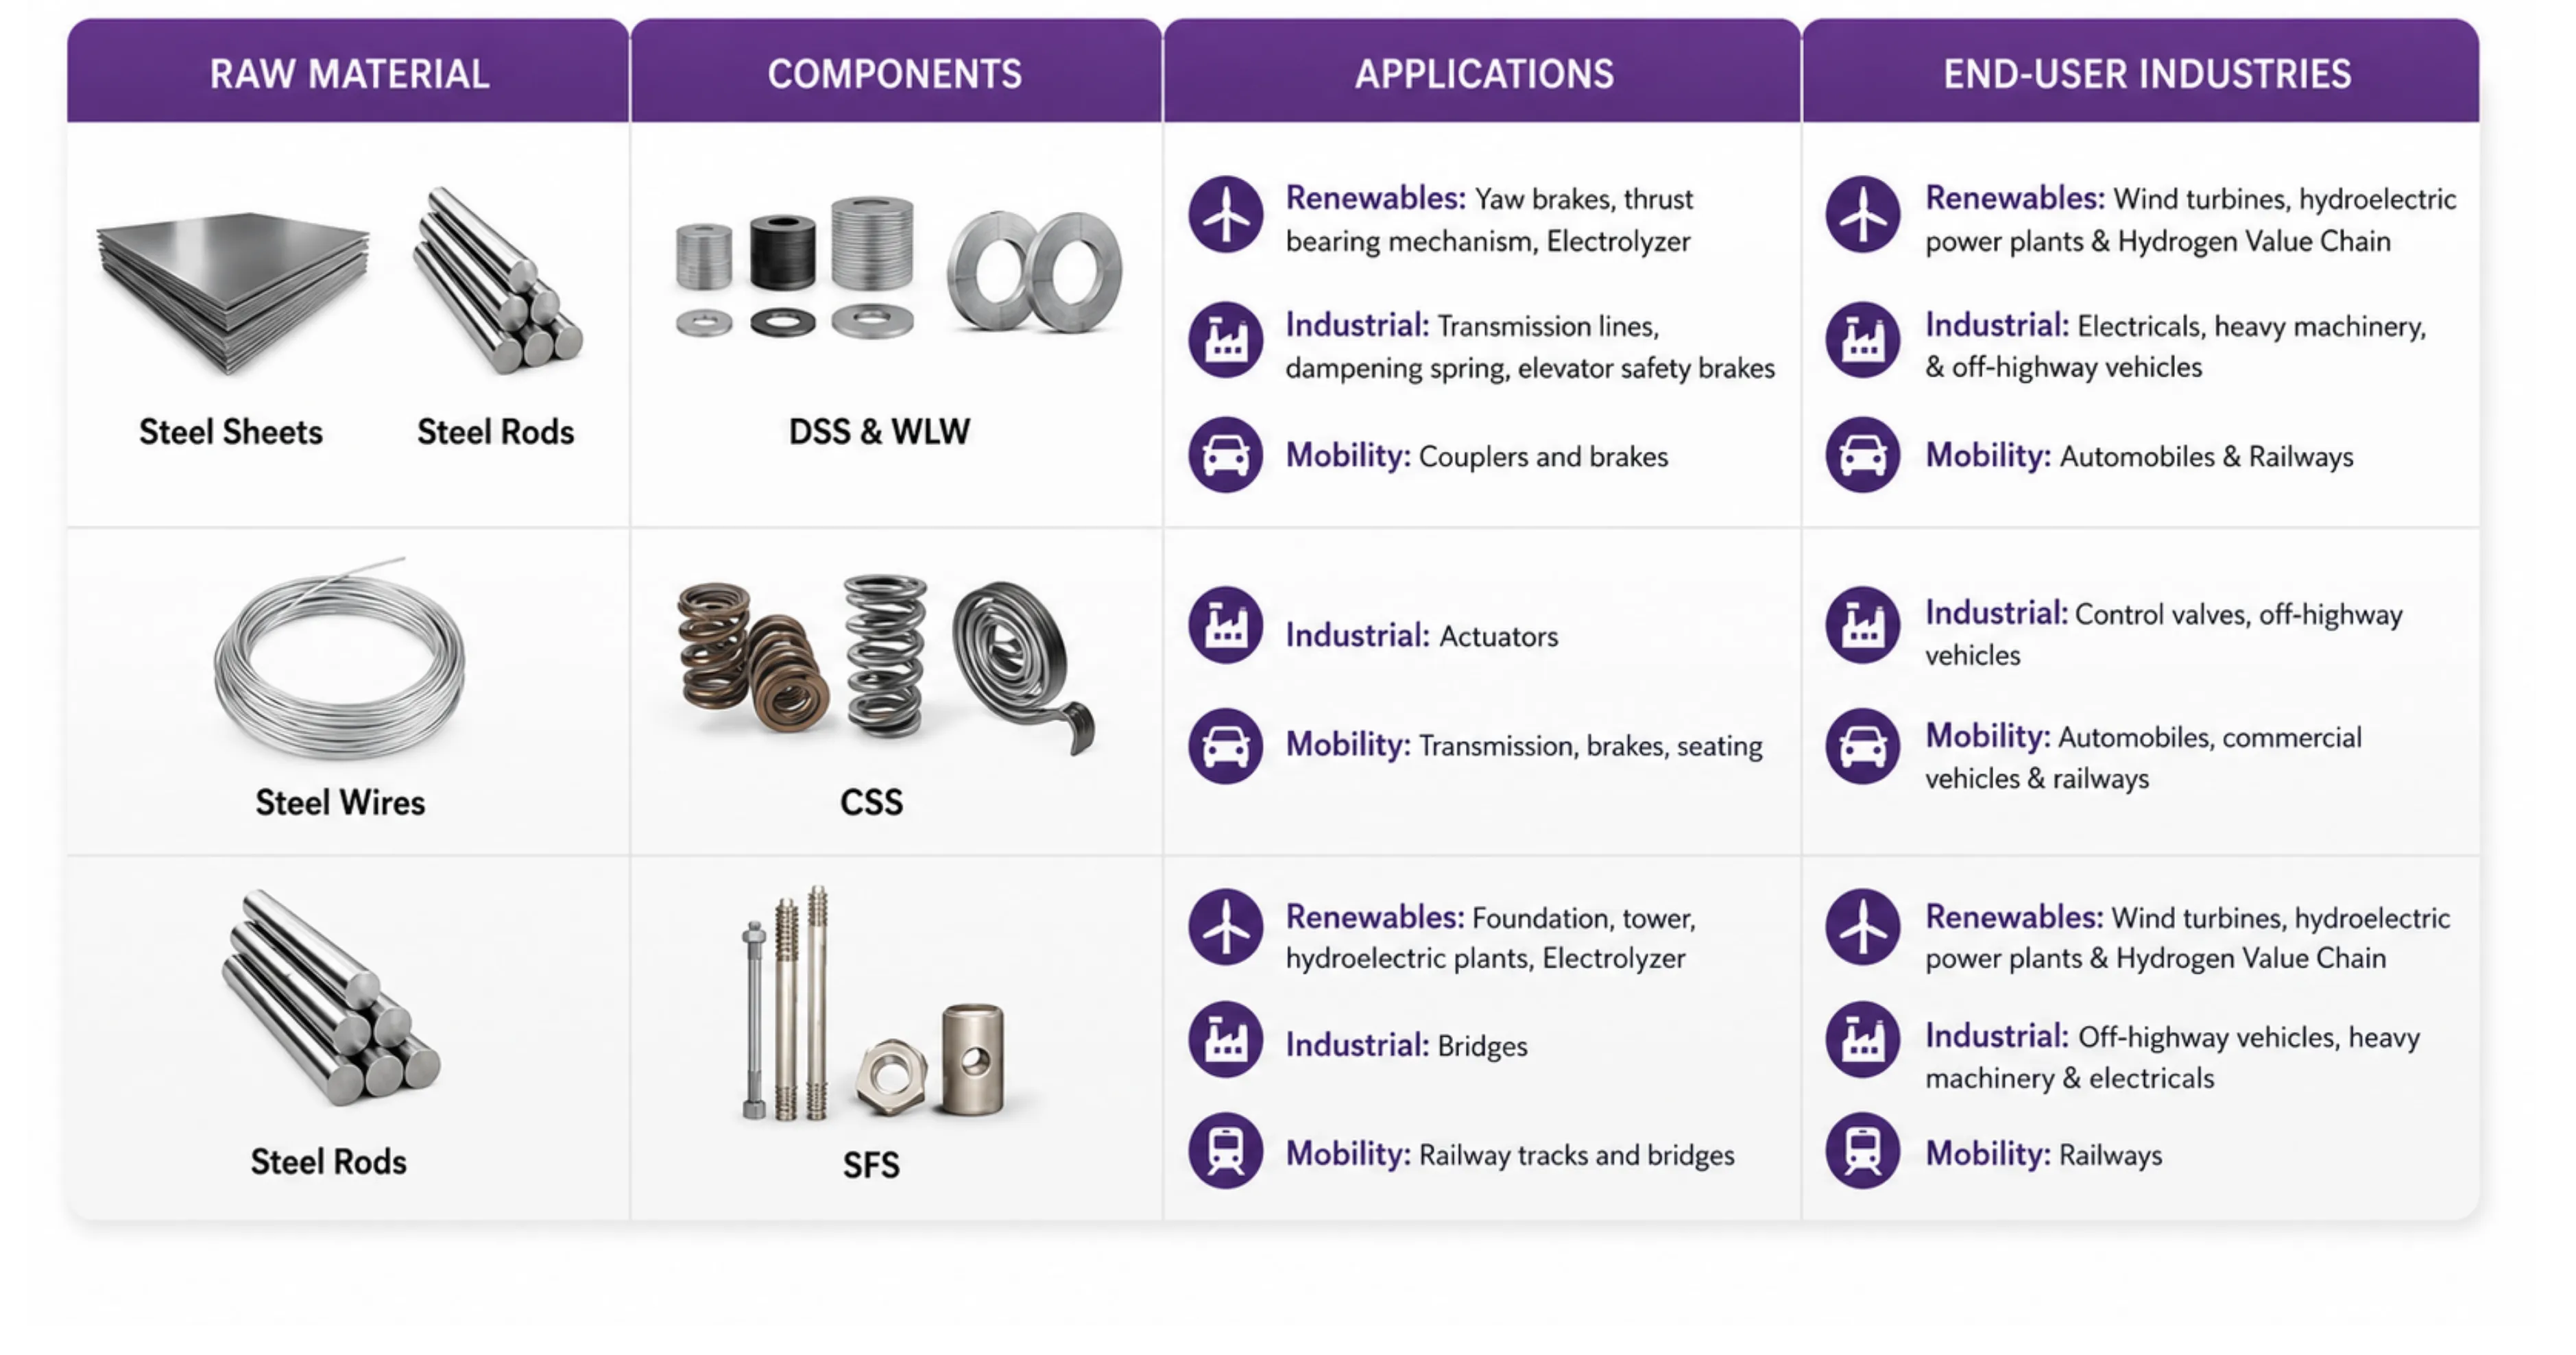
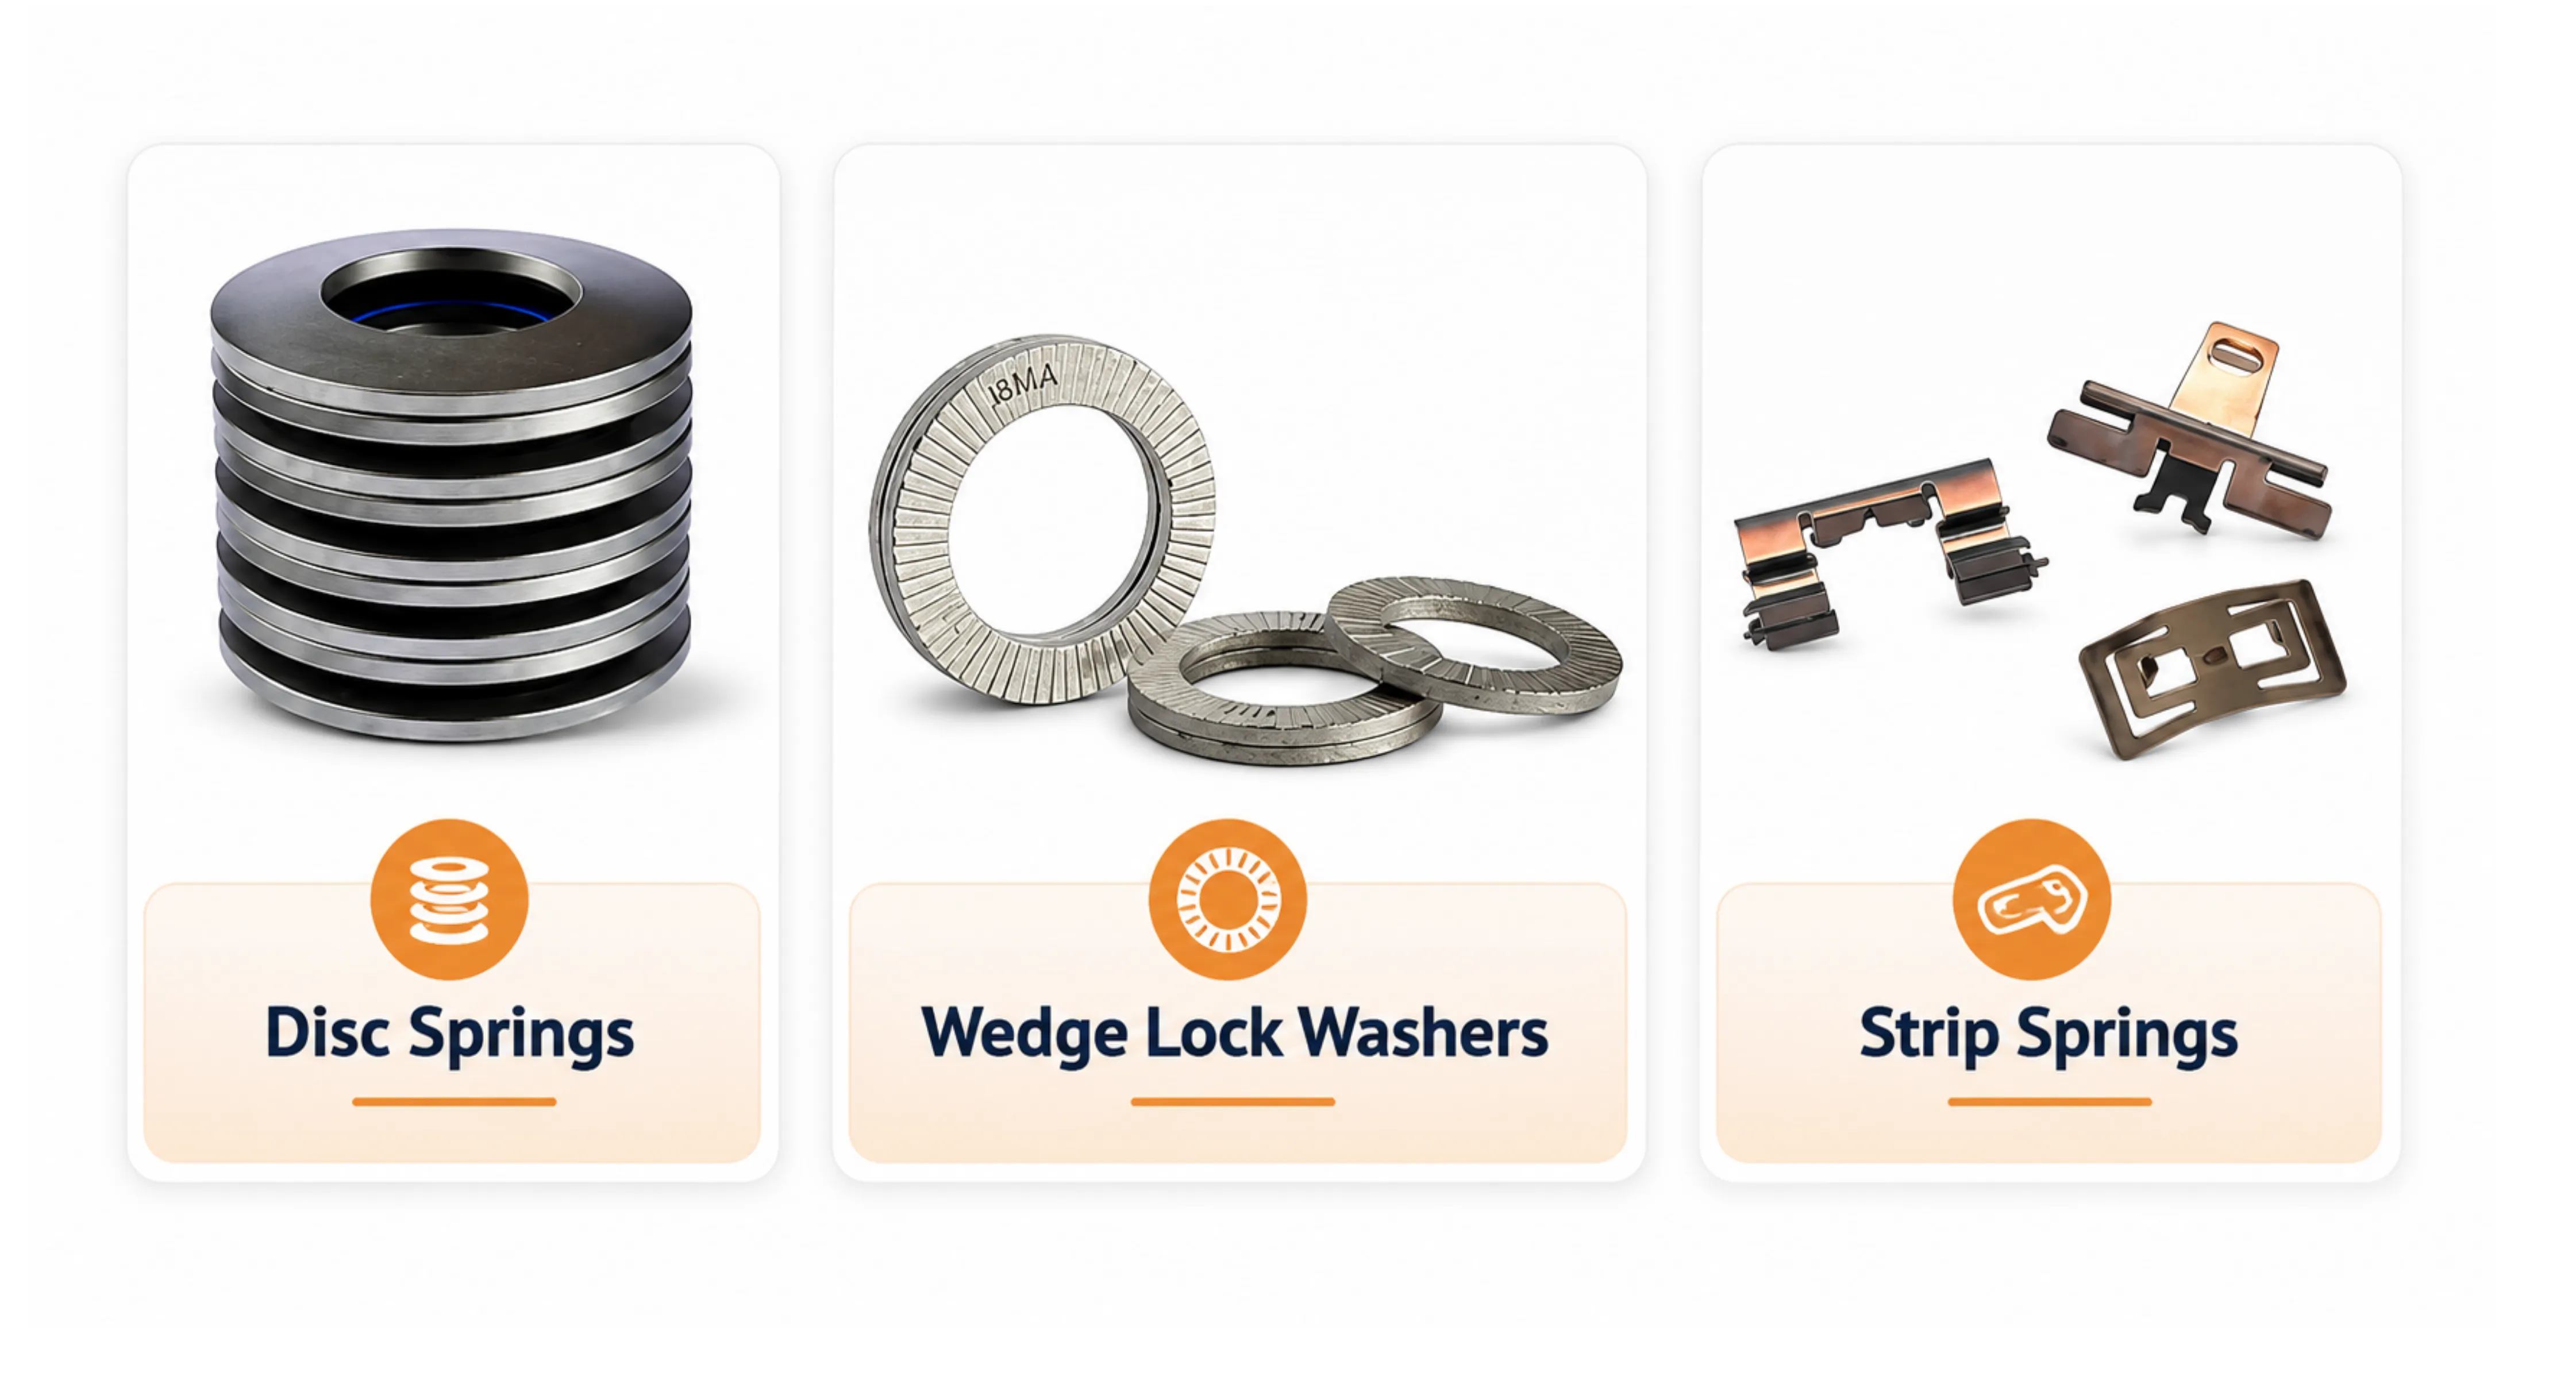
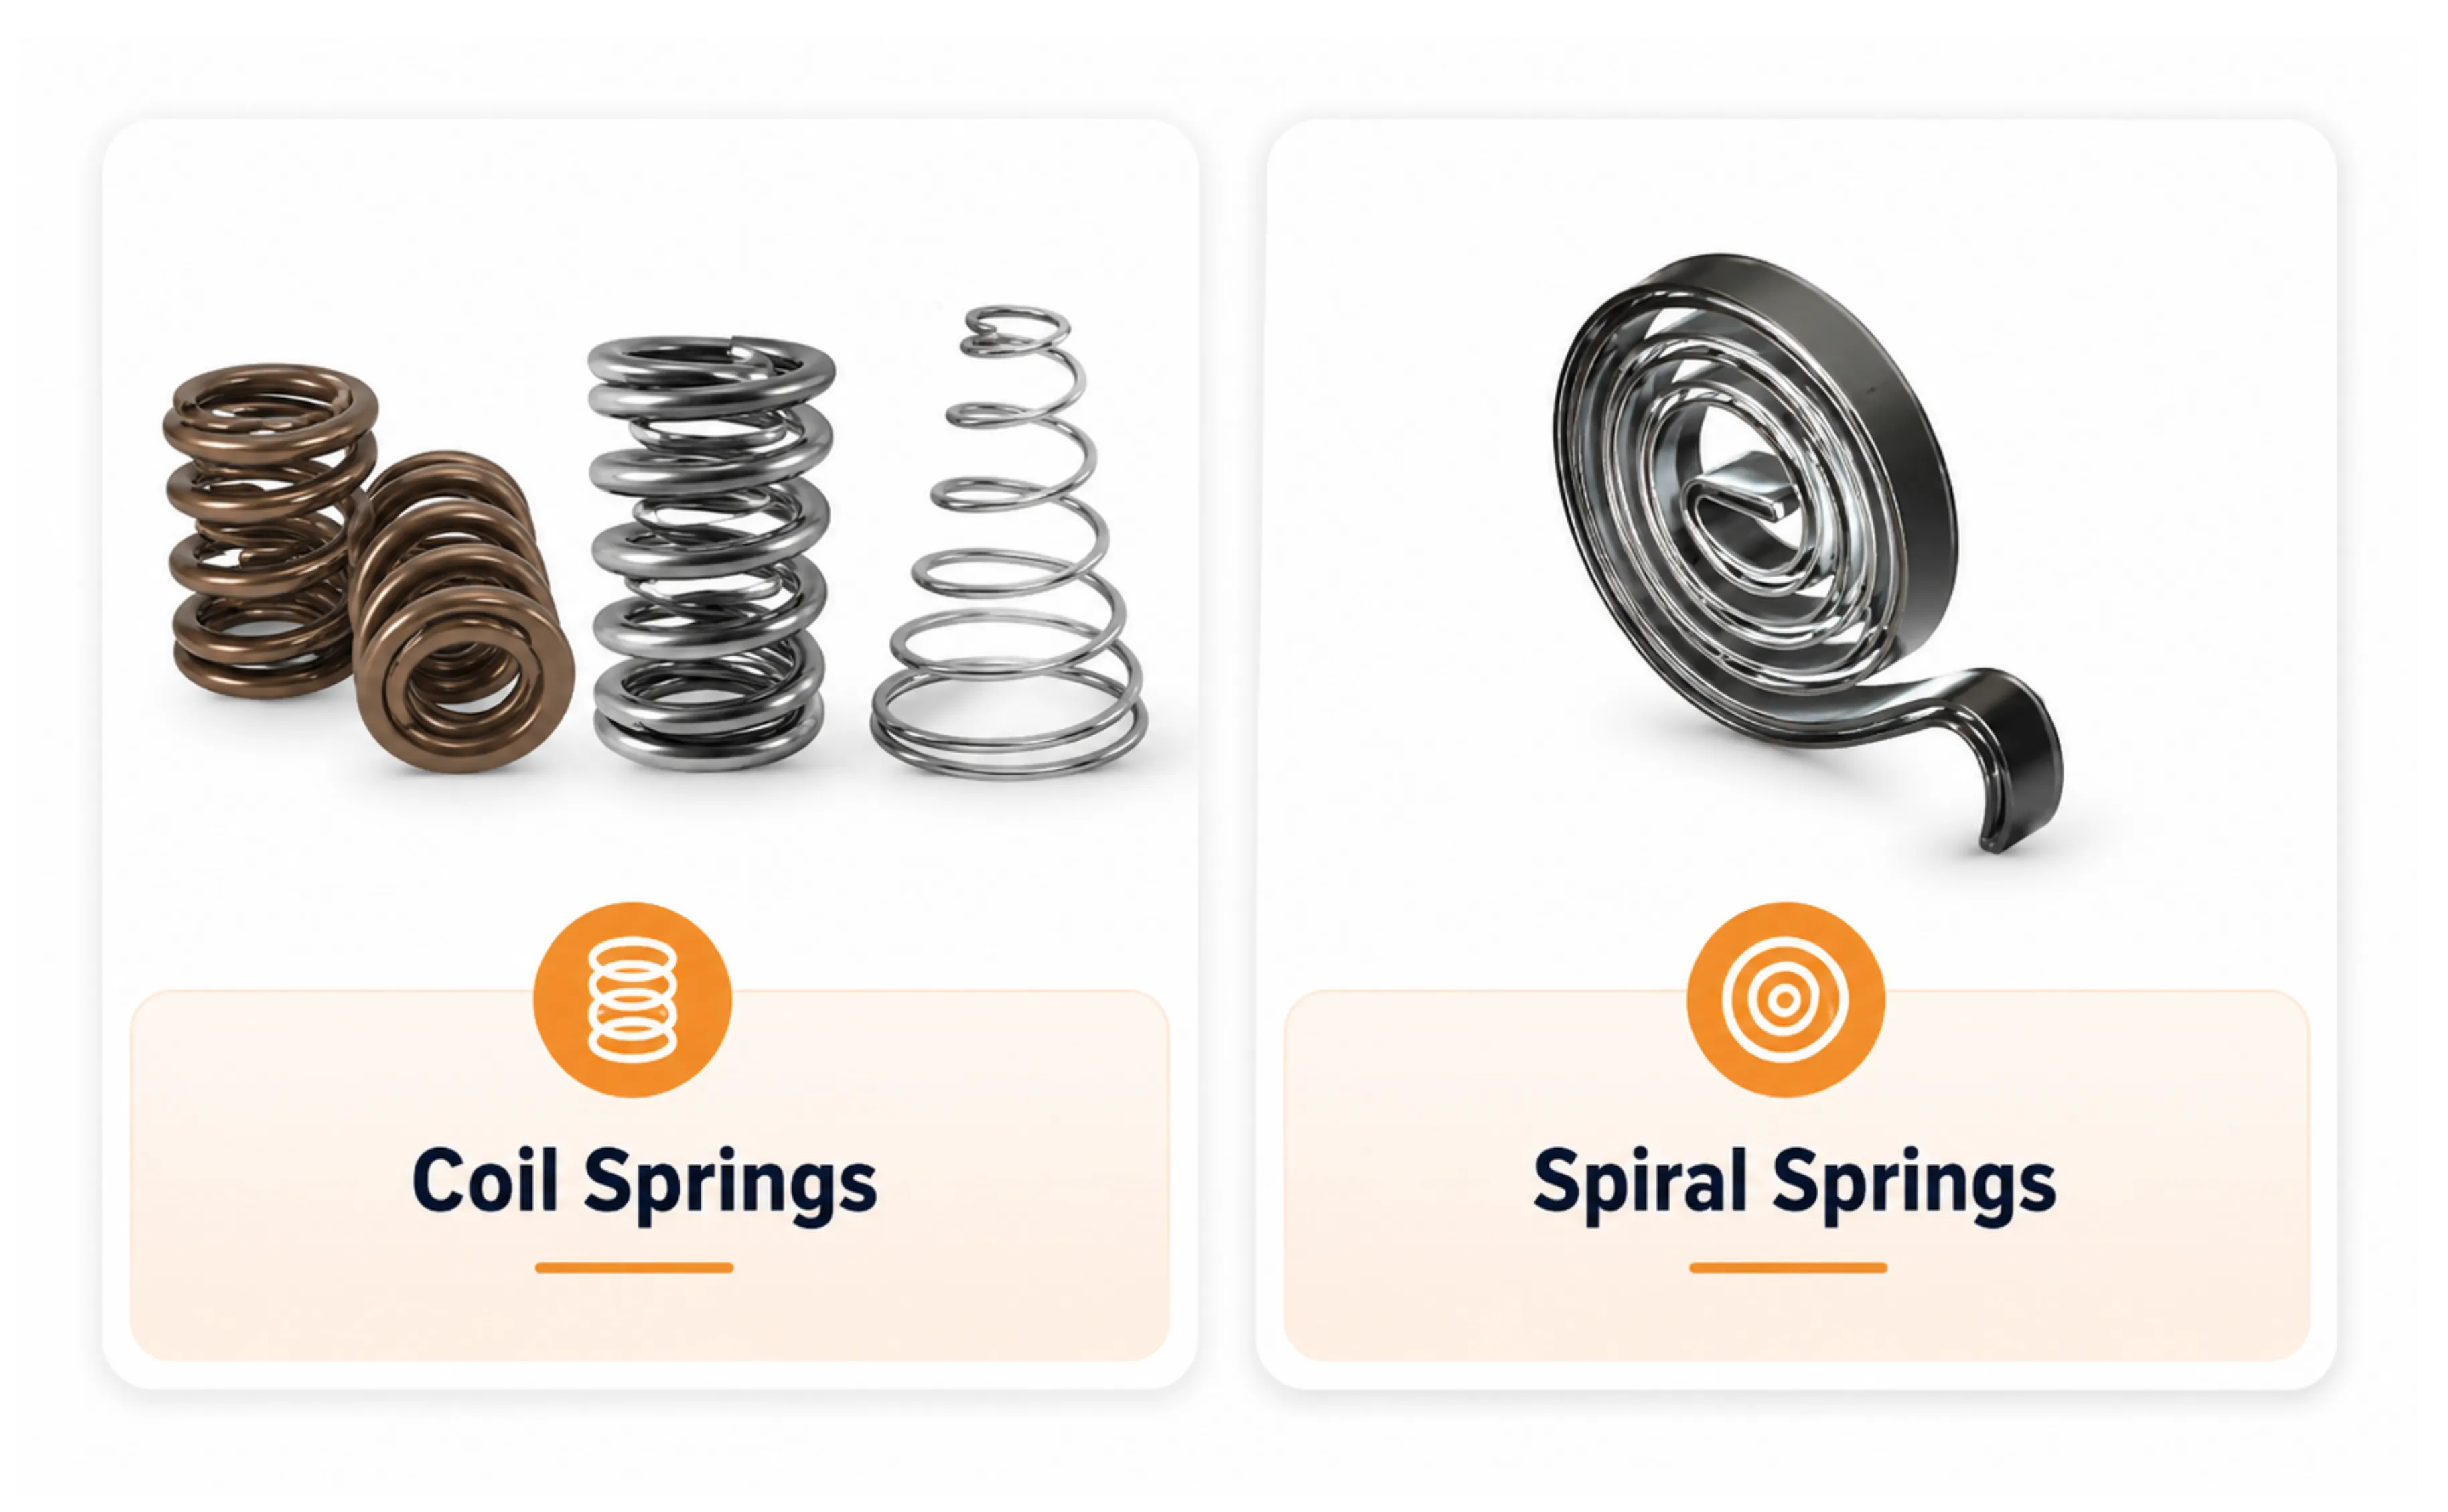
Gala manufactures three families of products. Disc and strip springs, along with wedge lock washers, make up what the company calls DSS, and contributed 49% of revenue in FY26.
Coil and spiral springs, or CSS, contributed 17%.
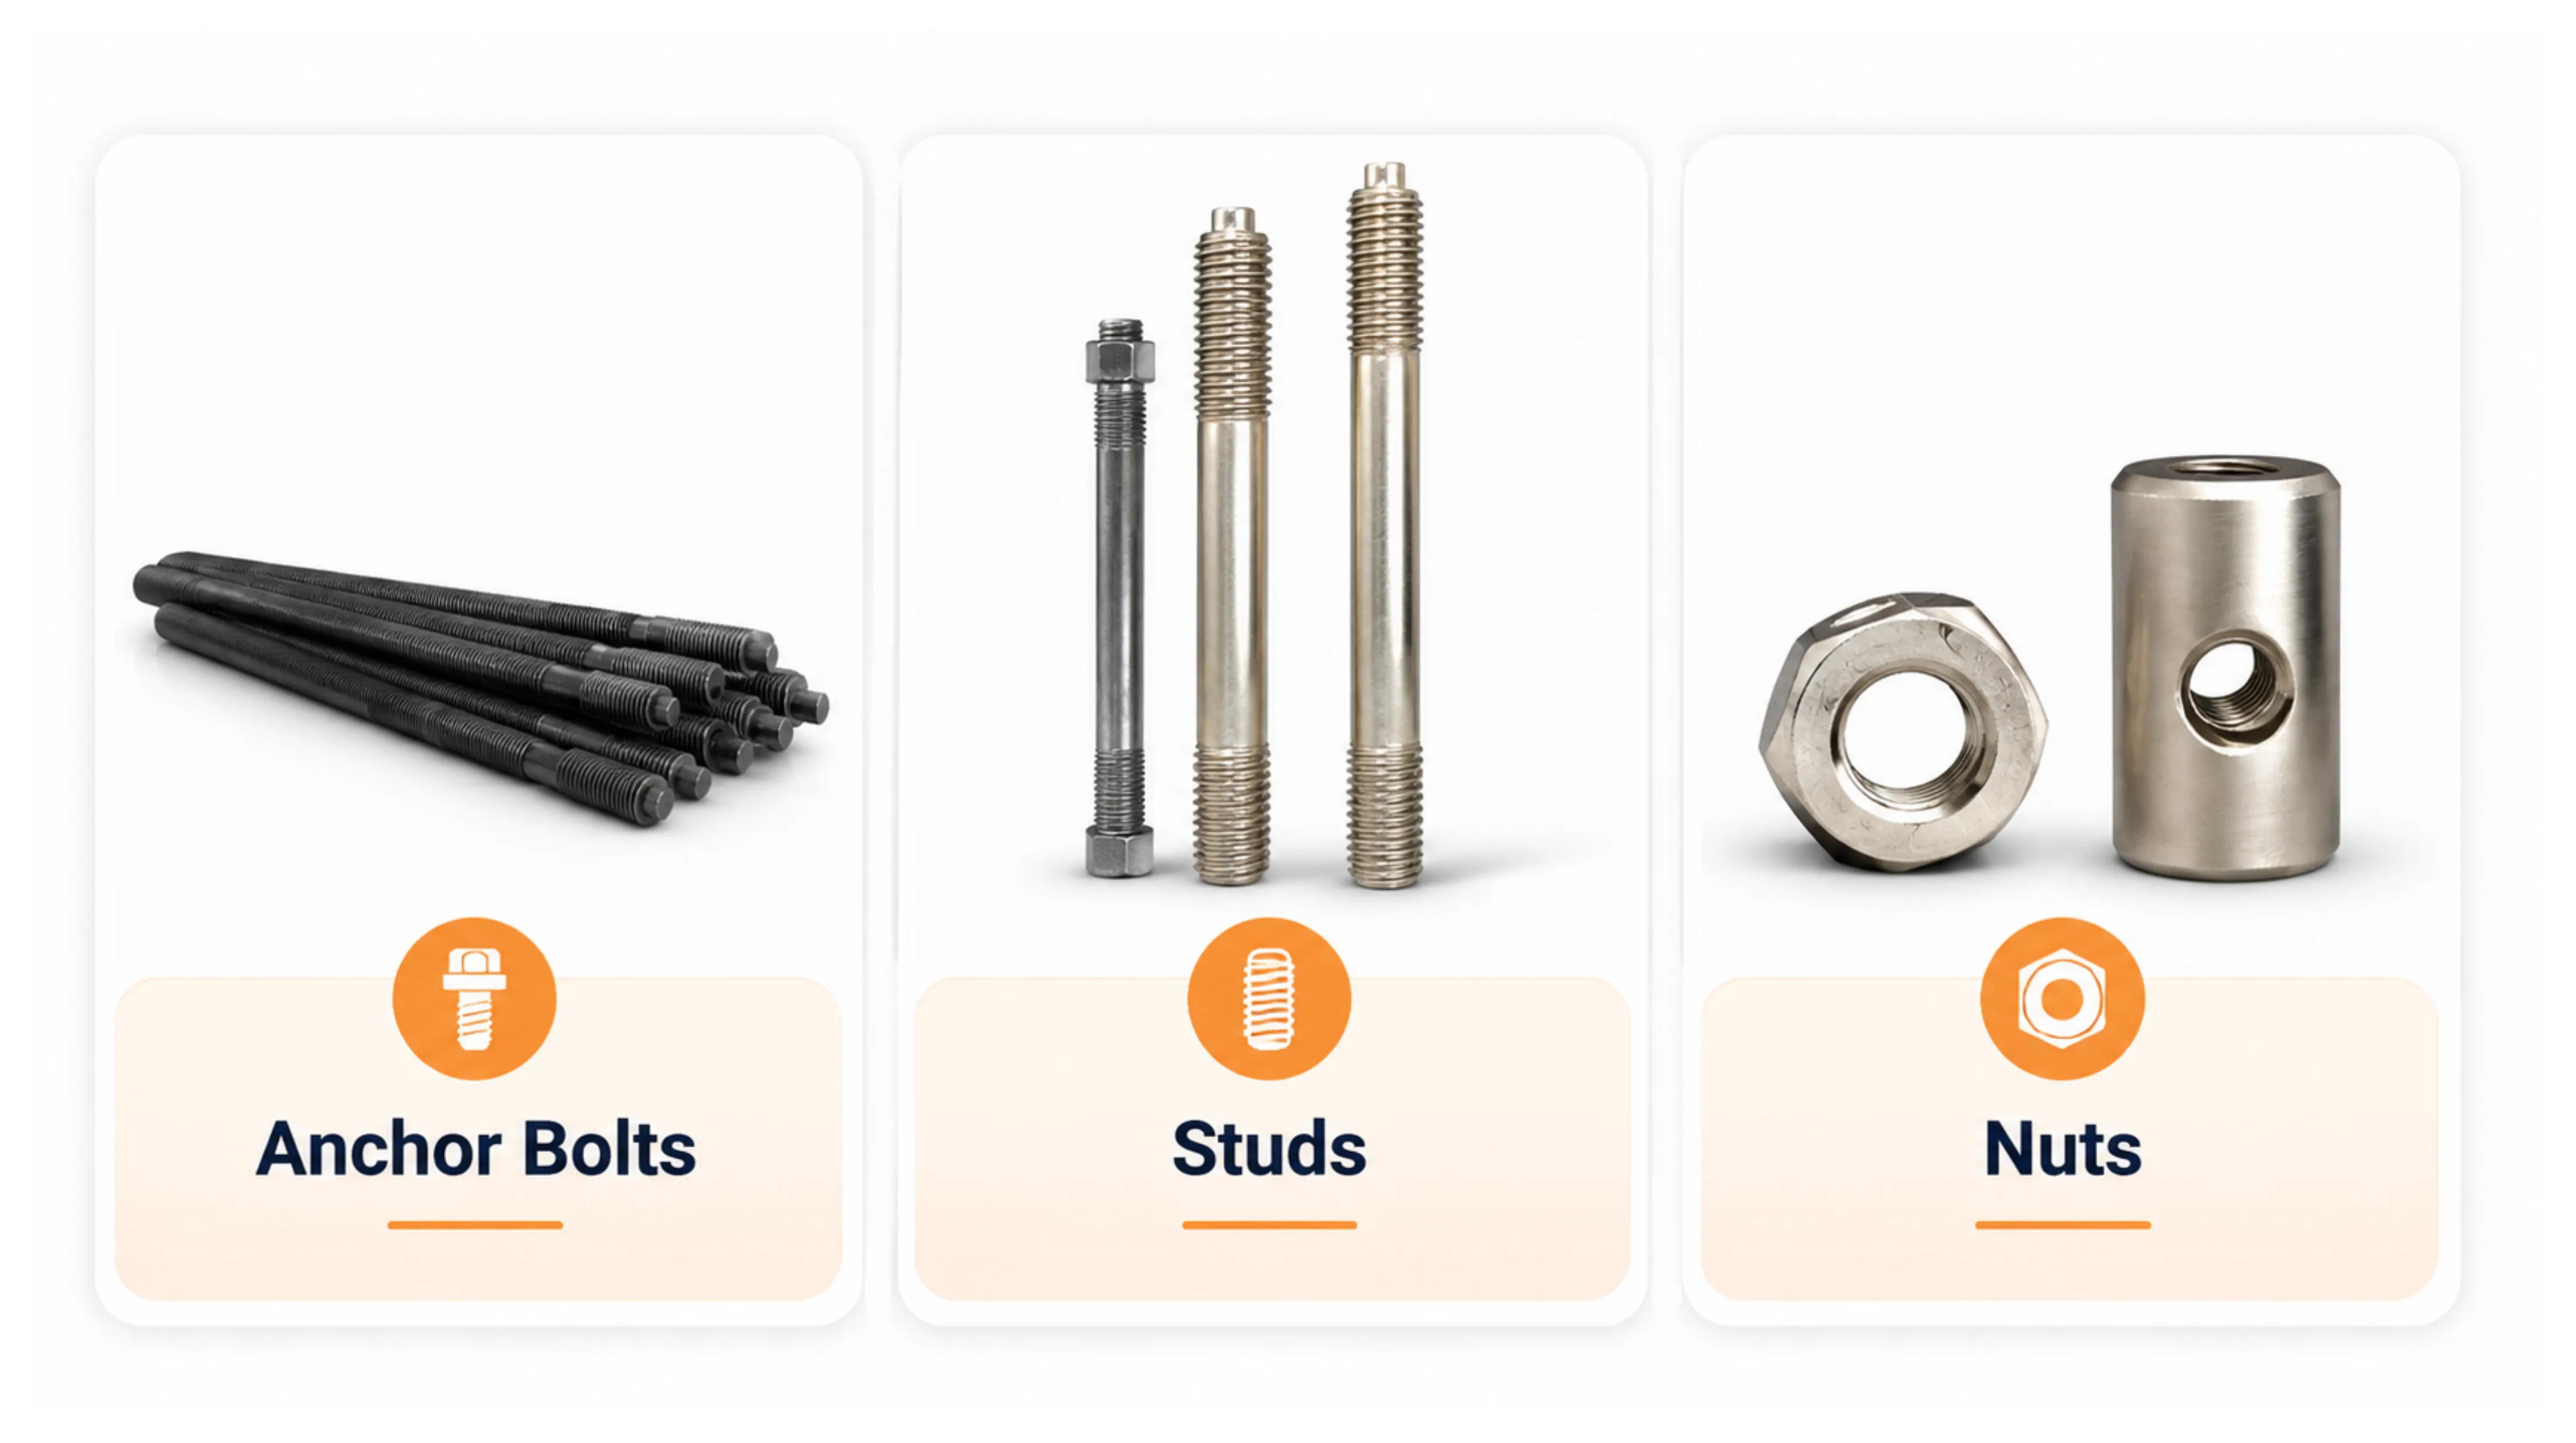
Special fastening solutions, or SFS, which covers high tensile studs, anchor bolts, cross bolts, hex bolts and nuts, contributed 34%.
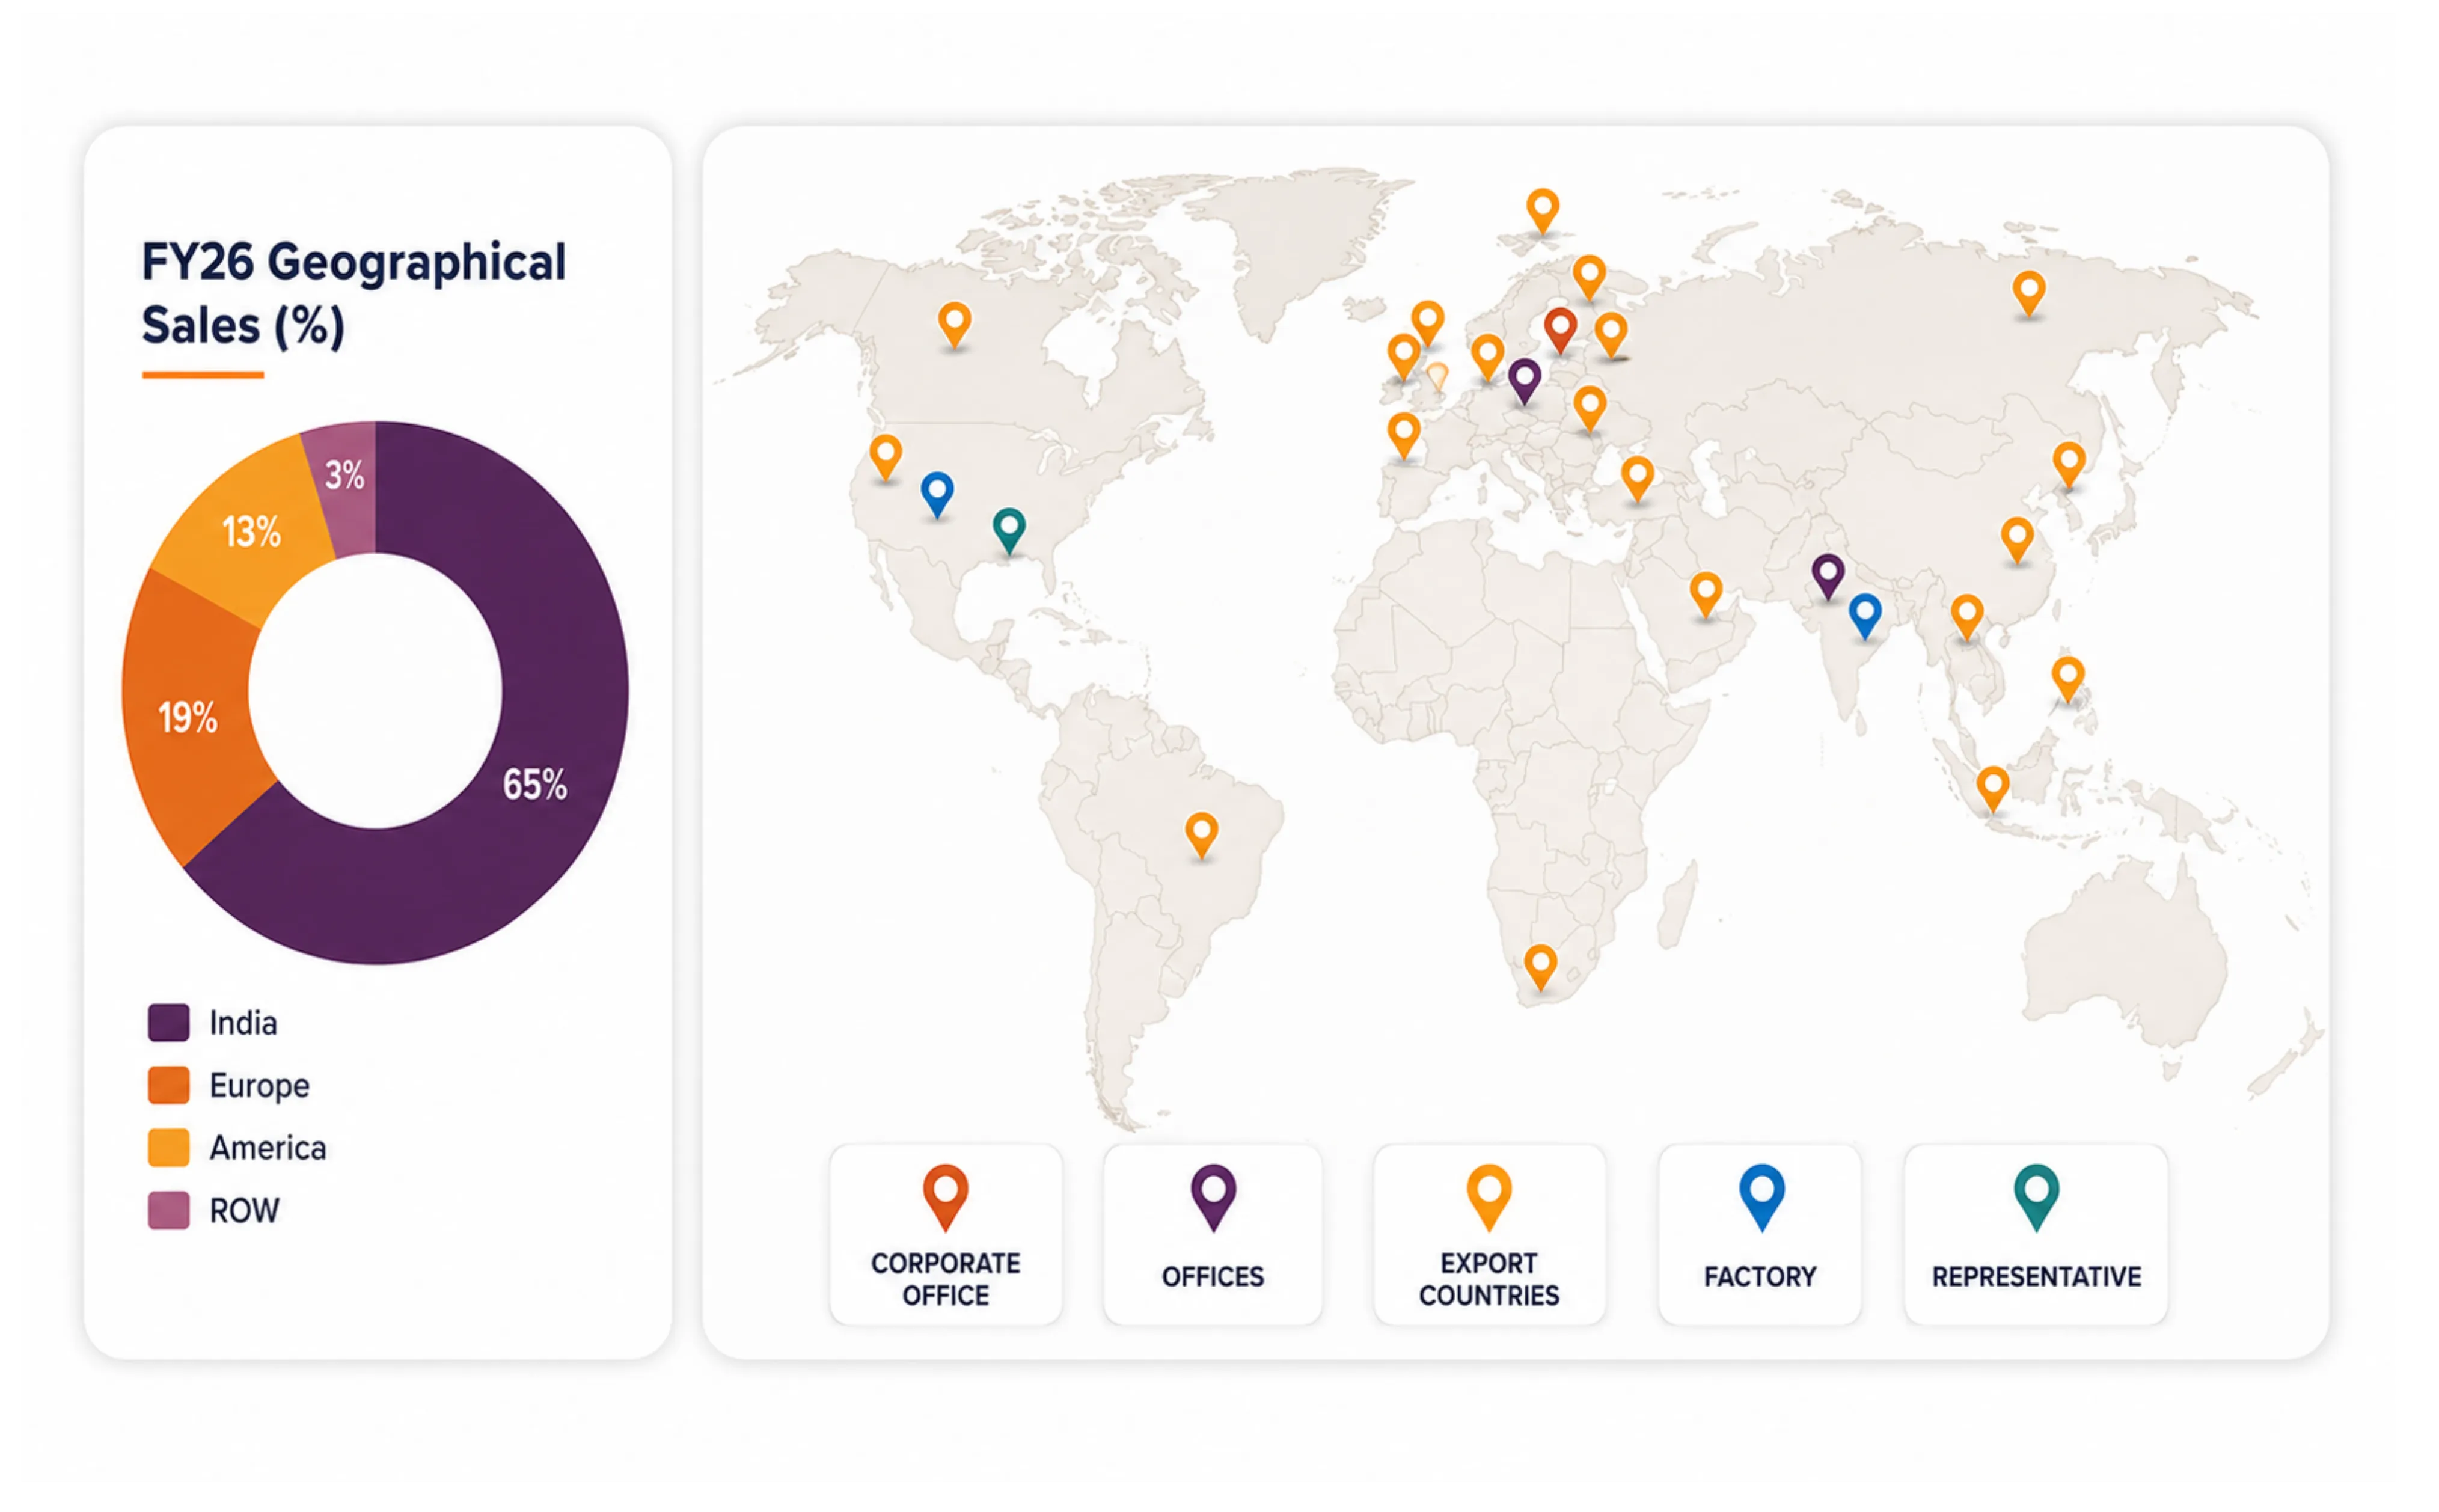
Roughly 800 stock keeping units run across the two plants, one at Wada near Mumbai and one at Vallam near Chennai, serving more than 175 customers across more than 25 countries.
The first thing to understand is what does not drive the margin. Raw material is steel, bought as sheet, coil, wire or rod, and the company's chief financial officer described it on the FY26 earnings call as a complete pass-through to customers, with a lag. Prices get renegotiated when input costs move, and the recovery arrives a quarter or two after the cost does. That single arrangement explains why a business exposed to steel has produced a fairly stable operating margin through periods when steel itself was not stable at all.
Equally important is what does not differentiate the products. It would be reasonable to assume that fasteners are a low-margin commodity and precision springs are a high-margin speciality, and that the growth in fasteners is therefore diluting the mix. Management addressed this directly, stating that all three product groups currently sit at broadly similar profitability, in the range of 17% to 19% at the operating level. The usual mix-shift story does not apply here.
What does drive the business is qualification. A wind turbine maker or a switchgear manufacturer does not buy a critical fastener from a catalogue. It audits the supplier's plant, tests samples in its own laboratory, runs a production part approval process, and only then releases commercial orders. Gala's history is essentially a list of those gates being cleared. An award from ABB of Germany in 2017 as one of its top ten disc spring suppliers. Approval in a European customer's German laboratory before compression springs could be supplied to metro rail. A first dispatch to Vestas as a production part approval lot from the new Chennai plant in July of the last financial year. Certification under IATF 16949, the quality standard that functions as the entry gate to automotive supply chains.
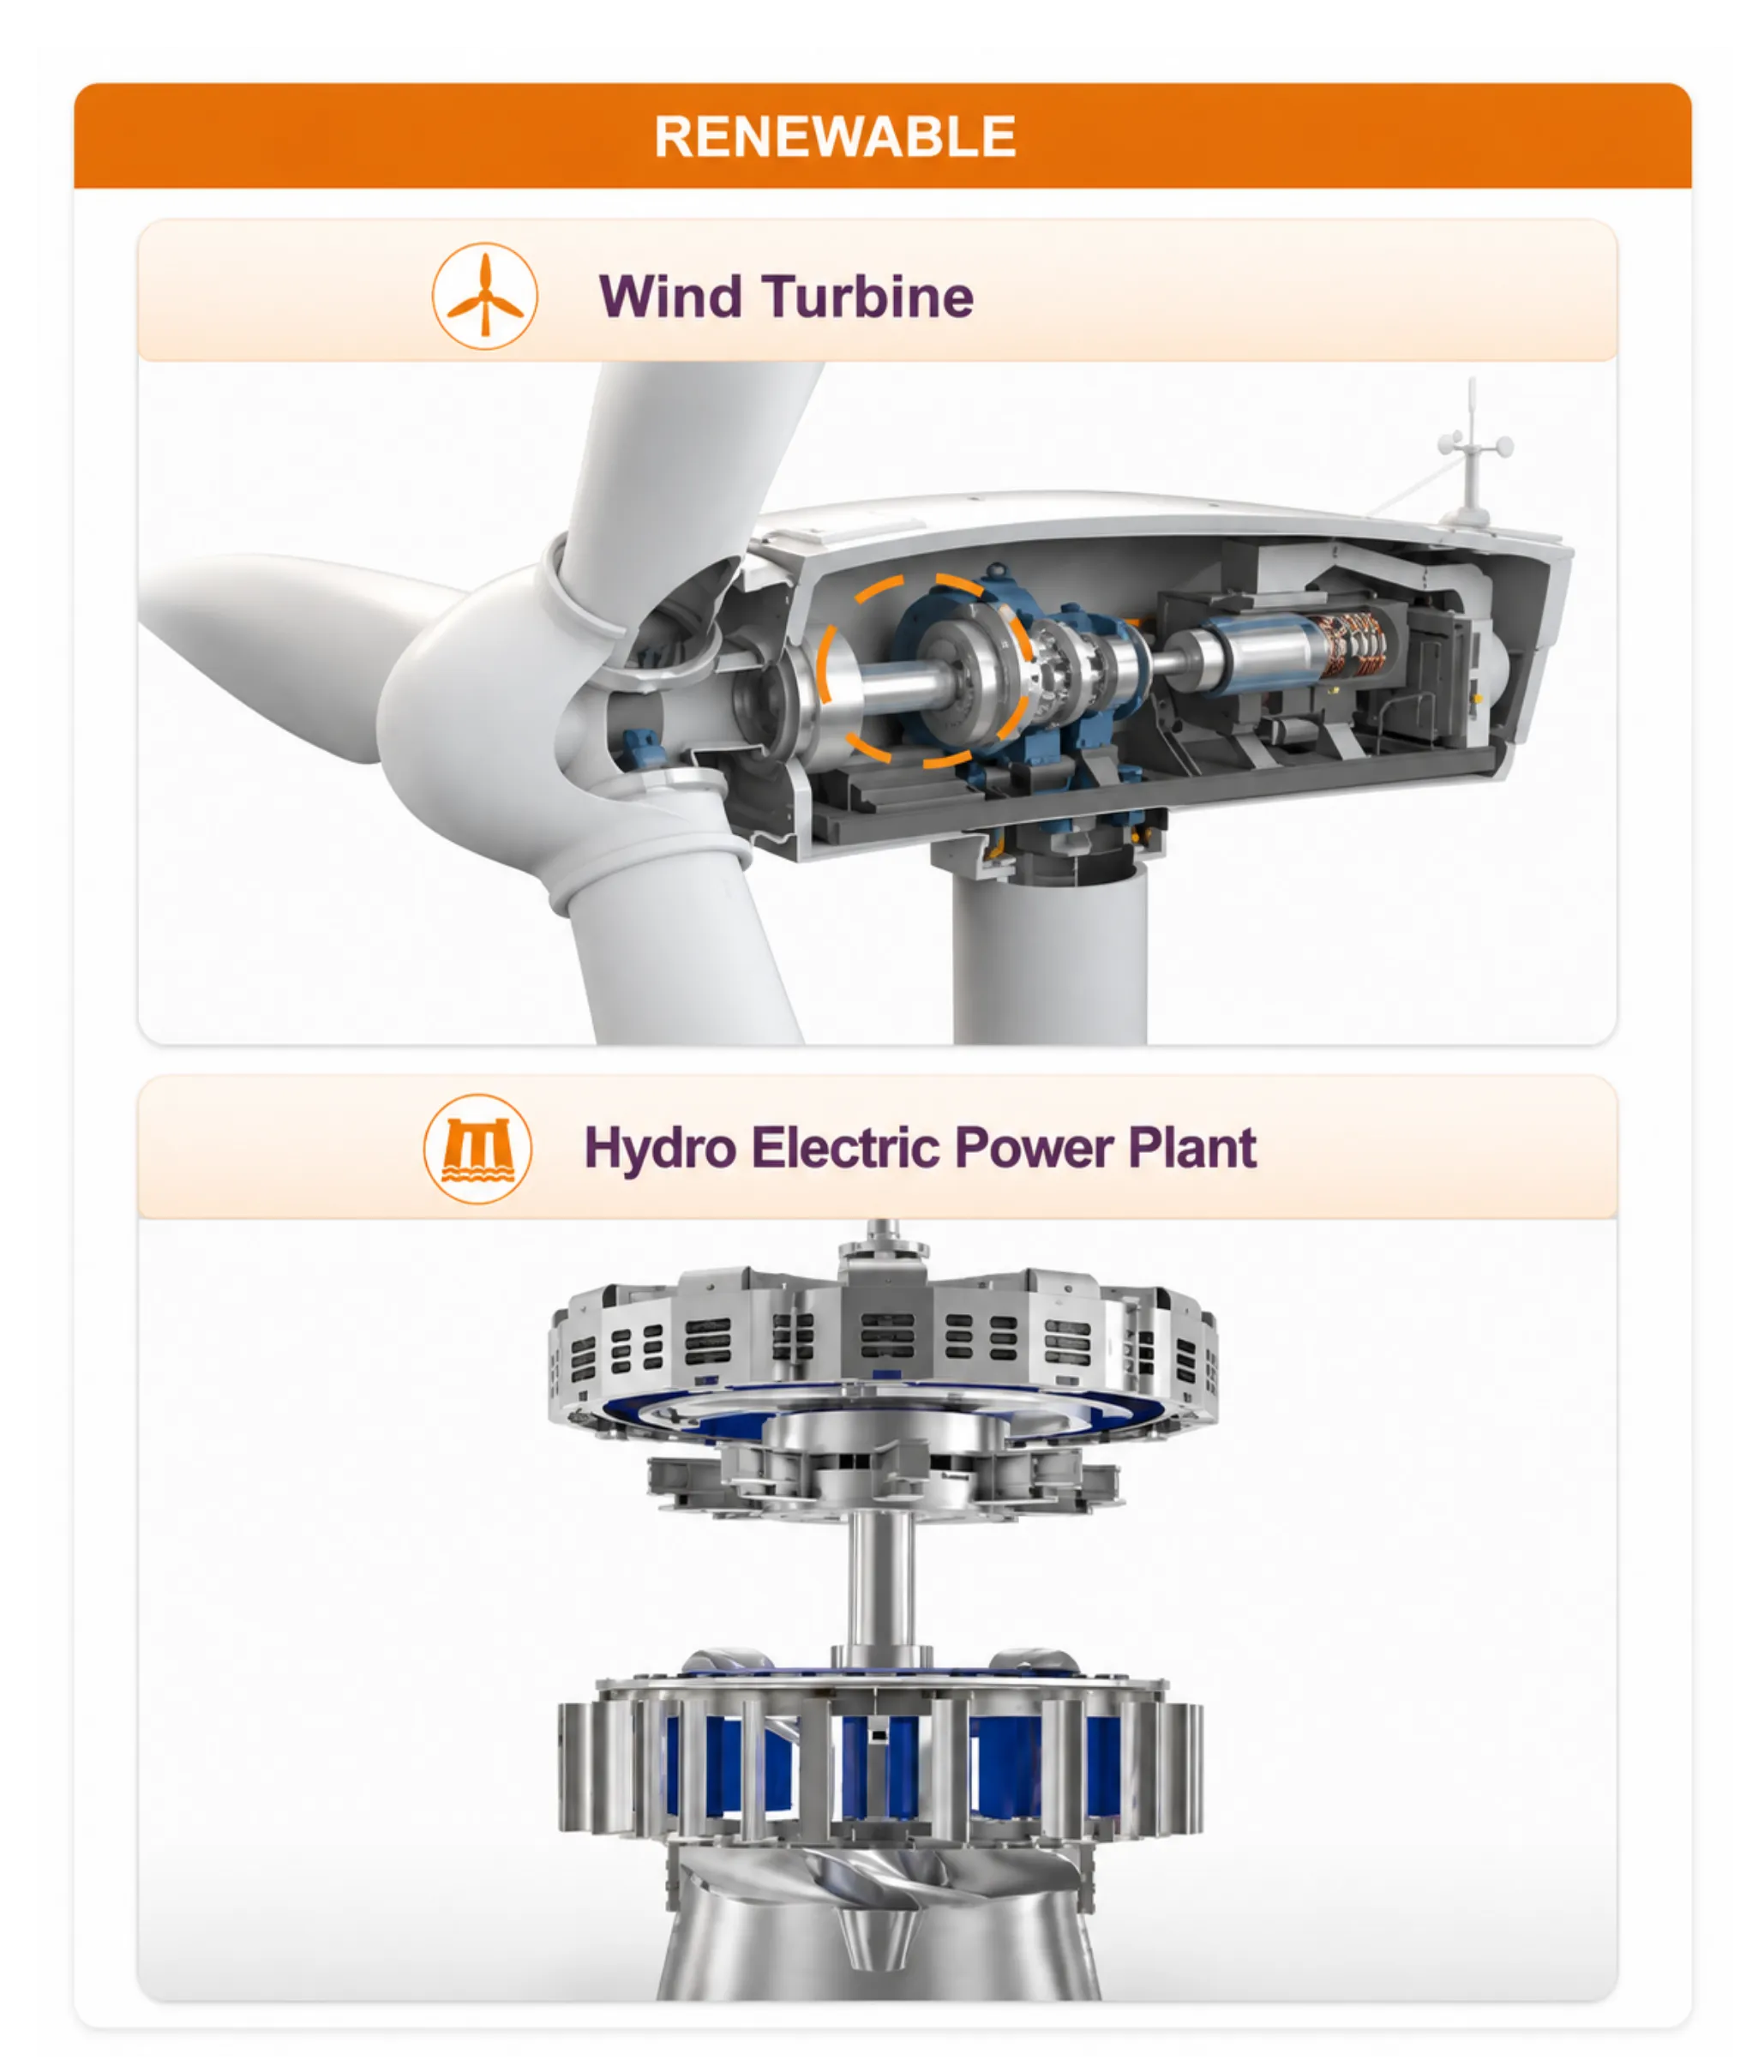
Each of those approvals took time and money to obtain, and each one is worth something precisely because the next supplier would have to spend the same time and money. That, and not manufacturing capability, is the asset on this [balance sheet](https://www.tradejini.com/finance-kickstarter/balance-sheet) that does not appear on the balance sheet.
Five Years of Numbers, and What Sits Underneath Them
Revenue and profitability
Profit and Loss, Consolidated (Rs Crore)
| FY22 | FY23 | FY24 | FY25 | FY26 | |
|---|---|---|---|---|---|
| Revenue | 145 | 165 | 203 | 238 | 314 |
| Operating Expenses | 125 | 138 | 163 | 197 | 262 |
| EBITDA | 20 | 28 | 39 | 41 | 52 |
| EBITDA Margin (%) | 13.8 | 16.6 | 19.2 | 17.2 | 16.5 |
| Other Income | 2 | 11 | (1) | 4 | 4 |
| Depreciation | 6 | 6 | 7 | 8 | 10 |
| Interest Cost | 5 | 6 | 7 | 4 | 3 |
| Profit Before Tax | 11 | 27 | 25 | 33 | 43 |
| Effective Tax Rate (%) | 41 | 12 | 13 | 19 | 18 |
| Profit After Tax | 7 | 24 | 22 | 27 | 35 |
FY23 profit before tax includes an exceptional gain of approximately Rs 9.8 crore relating to the divestment of the surface engineering solutions business, which is why FY23 profit before tax exceeds FY24 despite EBITDA rising by more than a third between those years. Excluding exceptional items in both years, profit after tax was approximately Rs 14.4 crore in FY23 and Rs 24.6 crore in FY24.
Earnings per share is not comparable across this period because share capital expanded twice, once through a capitalisation of reserves and again at the 2024 initial public offering. Earnings per share was Rs 23.56 in FY23, Rs 21.77 in FY24, Rs 22.56 in FY25 and Rs 27.05 in FY26.
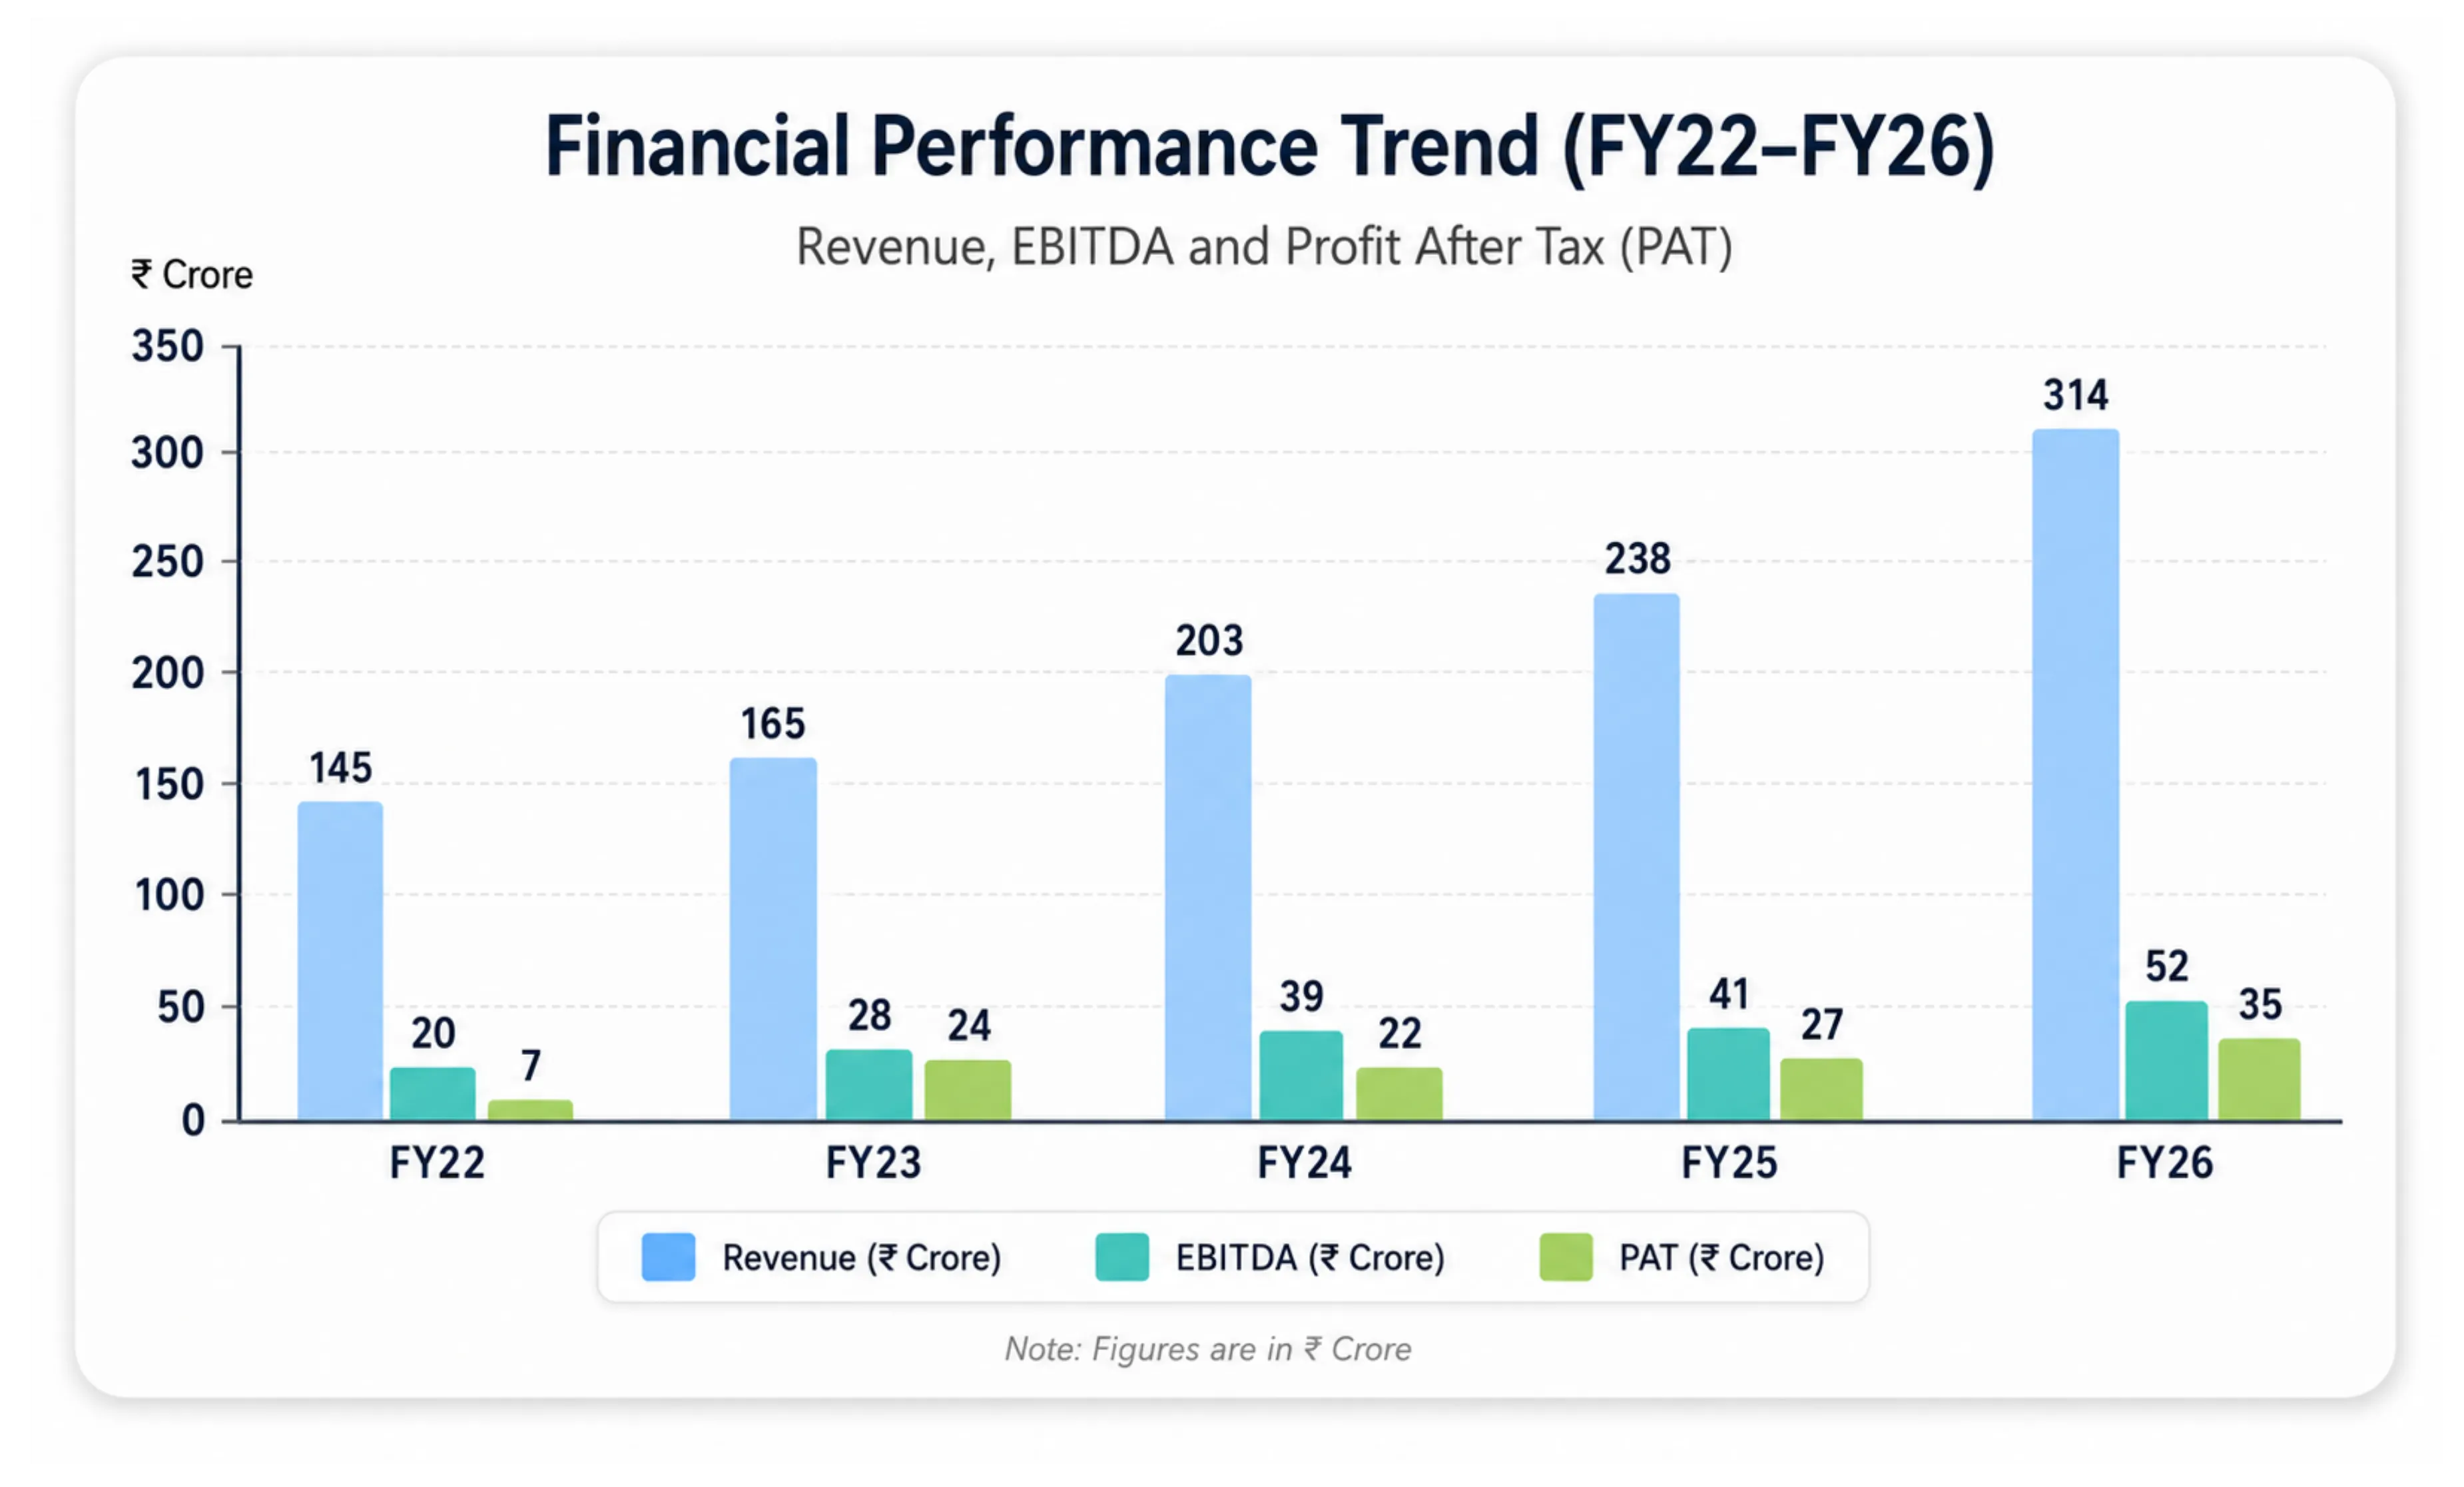
Revenue has slightly more than doubled across five years, compounding at roughly 21% a year, and the pace accelerated rather than faded. FY26 alone added Rs 76 crore of revenue, more than the entire increase across FY22 and FY23 combined. Behind that acceleration sits one segment. Special fastening solutions grew 64% in FY26 to cross Rs 108 crore, and its share of revenue has gone from under 15% in FY22 to 34% in FY26. Over the same period, revenue from renewable energy customers rose from roughly 26% of the total to 42%.
The margin line is where the reading requires care. Operating margin climbed from 13.8% to a peak of 19.2% in FY24, then gave back ground across the two following years to 16.5%. The obvious inference is that growth is coming at the cost of profitability, either through pricing pressure in fasteners or through the drag of an underutilised new plant.
The chief financial officer attributed the FY26 decline almost entirely to a foreign exchange loss of approximately Rs 3.23 crore, close to one percentage point of revenue, arising from forward contracts taken against export collections. Strip that out and FY26 sits near 17.5%, roughly level with FY25 and consistent with the 17% to 19% range management expects to hold once currency volatility settles. The explanation is credible on the arithmetic and consistent with the statement that all three product groups earn similar margins. It is also a convenient explanation, and FY24's 19.2% remains an outlier that has not been repeated since.
The quarterly path through FY26 supports the recovery reading rather than the deterioration one. Operating margin moved 15%, 16%, 17% and 18% across the four quarters, with the fourth quarter delivering Rs 95 crore of revenue and Rs 17 crore of operating profit, against Rs 75 crore and Rs 13 crore in the same quarter a year earlier.
The cash flow, which is the actual story
A spring stores energy when it is compressed and gives it back only when the load is released. A growing manufacturer's balance sheet does the same thing with cash. Every additional rupee of revenue has to be preceded by steel bought, inventory held, goods shipped and an invoice waited on. The faster revenue grows, the more cash is compressed into working capital, and it springs back only when growth slows. This is not a defect. It is the physics of the business model. The question is only how tightly the spring is being wound, and whether anyone is watching the gauge.
Cash Flow, Consolidated (Rs Crore)
| FY22 | FY23 | FY24 | FY25 | FY26 | |
|---|---|---|---|---|---|
| Cash from Operations | 12 | 16 | 16 | 3 | 10 |
| Capital Expenditure | 7 | 3 | 13 | 34 | 38 |
| Free Cash Flow | 5 | 13 | 3 | (31) | (28) |
| Cash from Investing | (7) | (12) | (3) | (92) | (11) |
| Cash from Financing | (7) | (4) | (12) | 89 | 11 |
| Net Cash Flow | (2) | 0 | 1 | 0 | 10 |
| Cash from Operations as % of EBITDA | 66 | 74 | 54 | 24 | 34 |
Capital expenditure is derived as cash from operations less free cash flow. The unusually large investing outflow in FY25 and the corresponding financing inflow reflect the initial public offering, with a substantial portion of the proceeds placed in bank deposits during that year and drawn down in FY26.
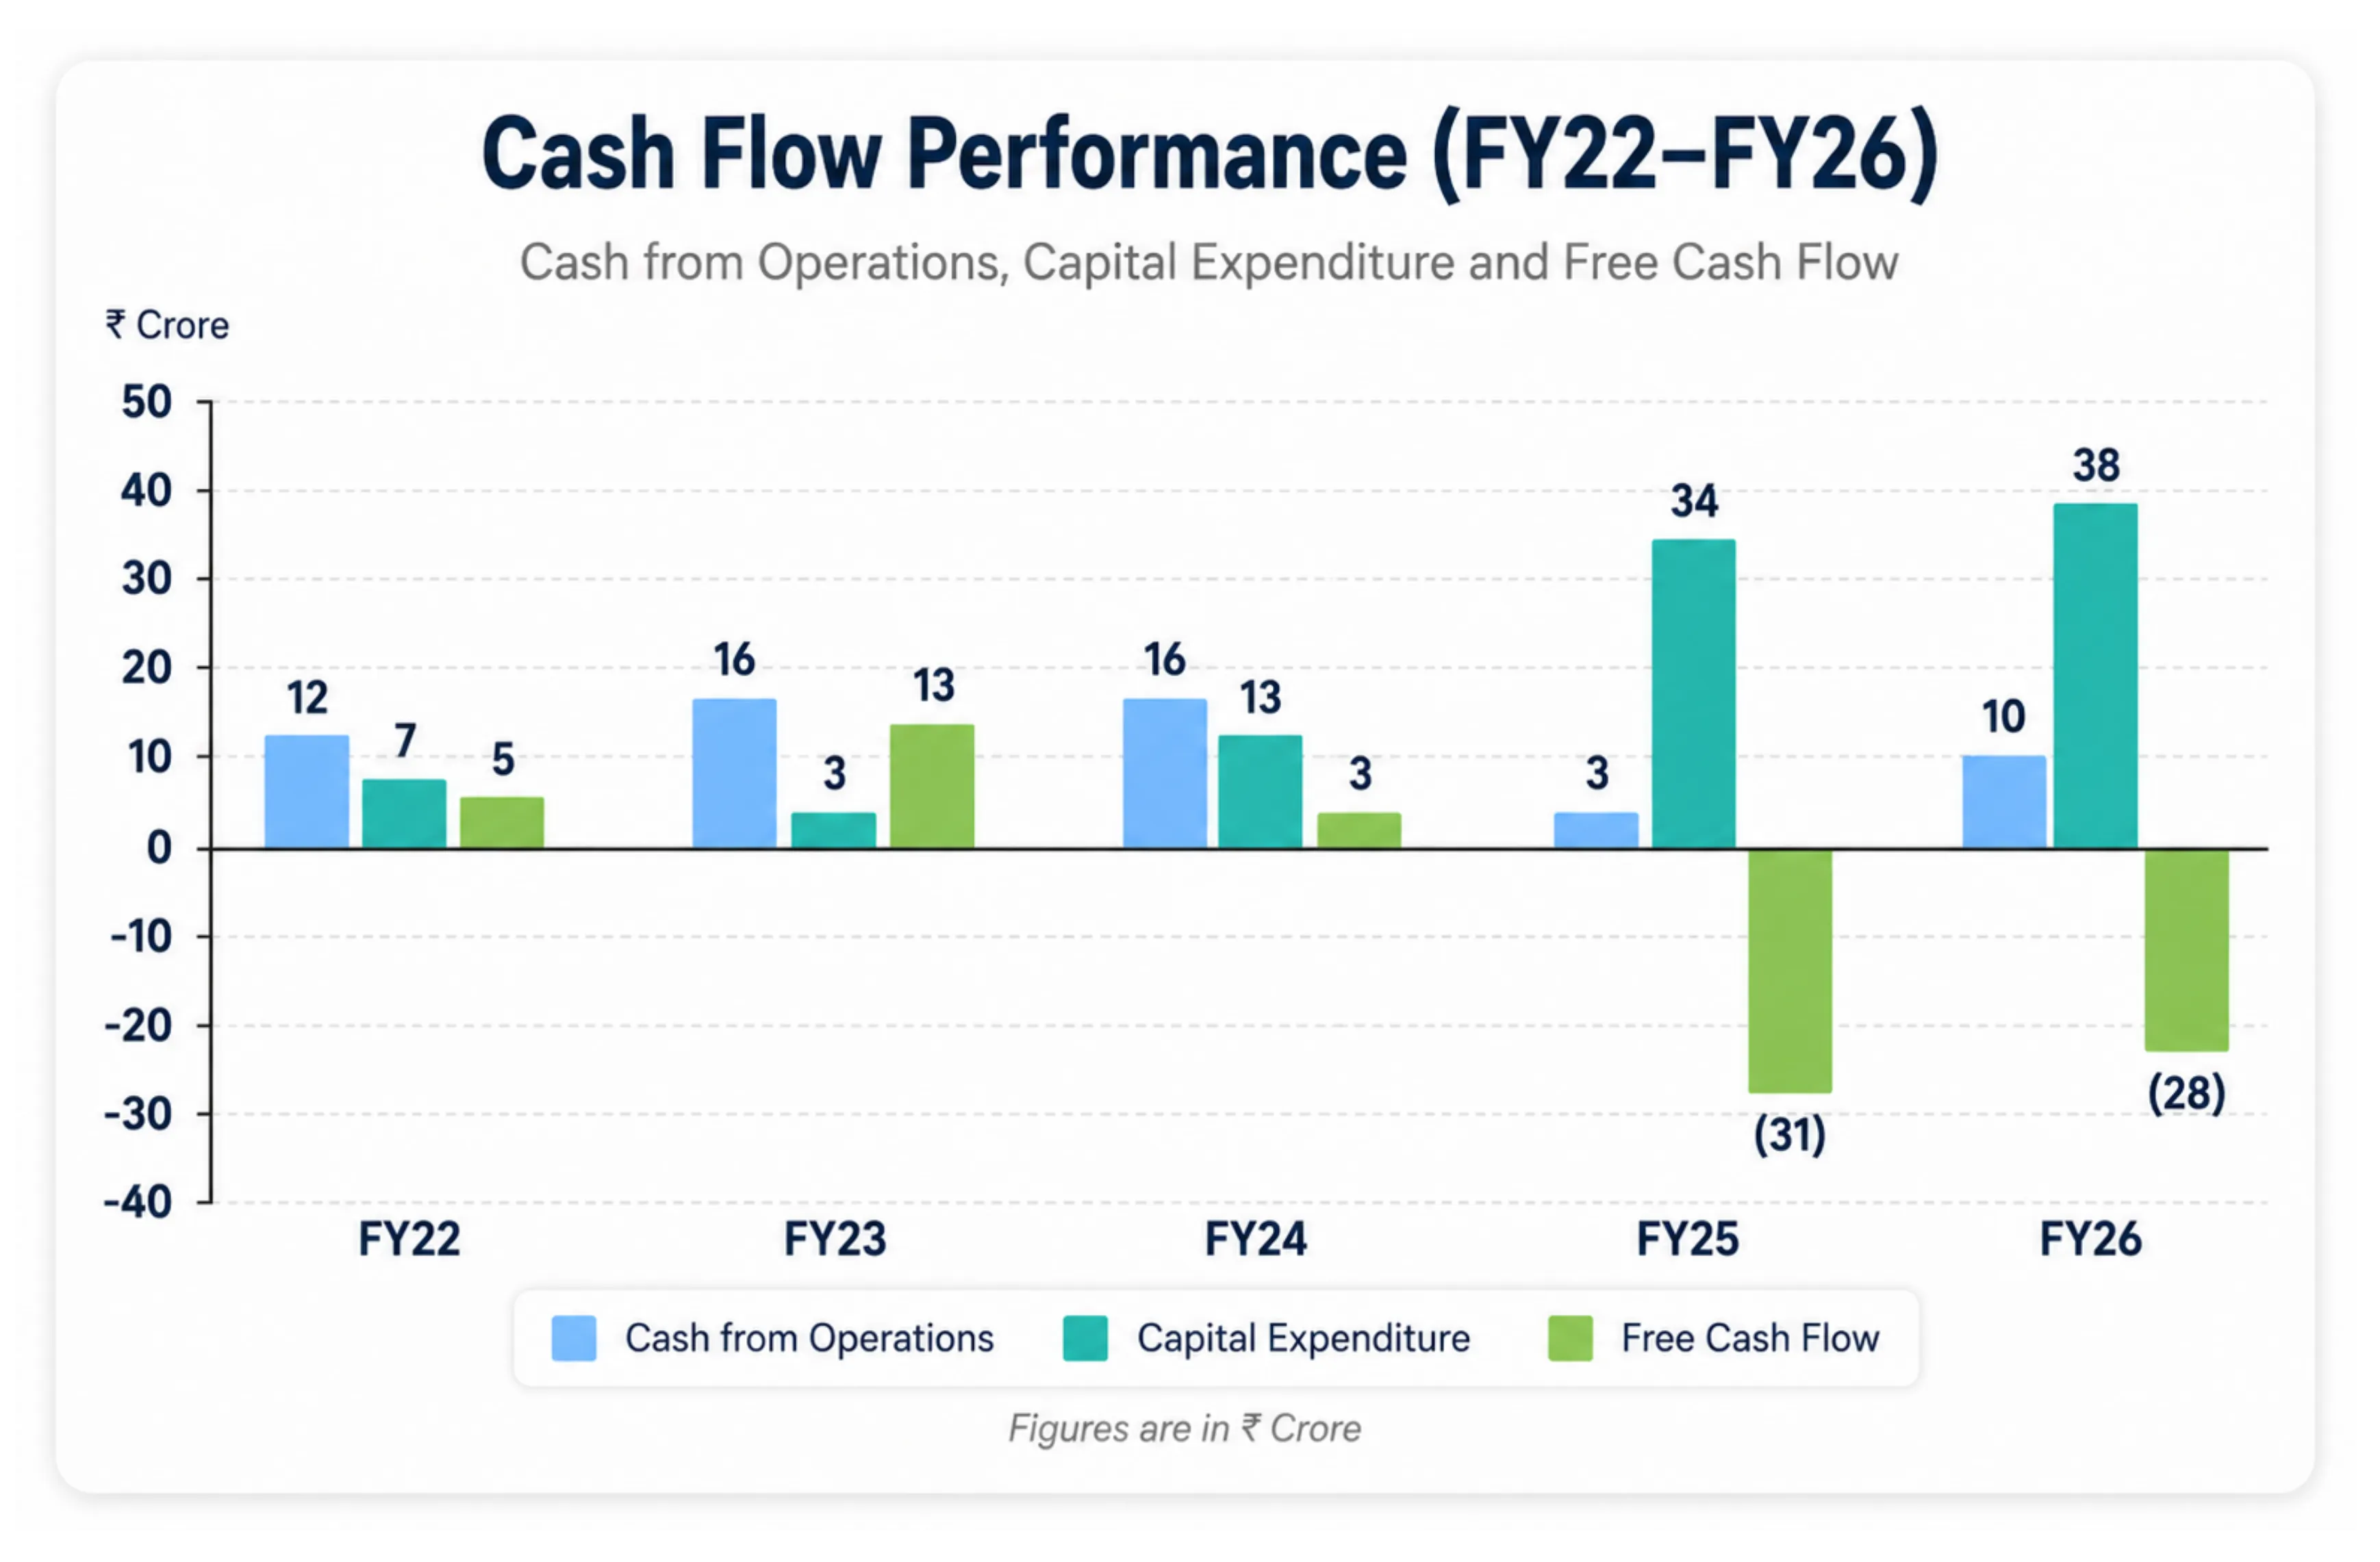
The proportion of operating profit that actually arrives as cash, has fallen from 74% in FY23 to 34% in FY26, with a trough of 24% in FY25. In absolute terms, across FY24, FY25 and FY26 the company reported roughly Rs 84 crore of cumulative profit after tax and generated roughly Rs 29 crore of cumulative cash from operations. Free cash flow, which is operating cash less capital expenditure, has been negative in each of the last two years, by Rs 31 crore and Rs 28 crore.
Two forces are at work and they should not be conflated. The first is capital expenditure, which rose from Rs 13 crore in FY24 to Rs 34 crore and Rs 38 crore in the two years since, funded largely by the public issue and directed at the Chennai plant and further work at Wada. Capital expenditure suppressing free cash flow during a capacity build is expected, and reversible the moment the build stops.
The second force is working capital, and it is the one that matters. The company reports working capital days rising from 81.9 in FY23 to 83.4 in FY24, then to 116.4 in FY25 and 140.5 in FY26. The visible driver is receivables. Debtor days, meaning the average number of days of sales sitting uncollected, went from 66 in FY23 to 85, then 109, before improving to 95 in FY26. Inventory, contrary to what might be expected of a plant ramp, has been comparatively disciplined at close to 104 days of sales in FY26, in line with FY24, and management stated on the earnings call that inventory is running near 103 days with an intention to reduce it by around ten days.
So the strain is on collection, not on stock. That is a meaningful distinction. Inventory is within the company's control. Receivable days are a function of who the customers are, and Gala's customers are very large industrial buyers with long payment terms and considerable negotiating power. Improving from 109 to 95 days is genuine progress. Returning to 66 would require a change in customer mix that nothing in the current strategy points toward.
The Balance Sheet
Balance Sheet, Consolidated (Rs Crore)
| FY22 | FY23 | FY24 | FY25 | FY26 | |
|---|---|---|---|---|---|
| Fixed Assets | 56 | 61 | 64 | 84 | 104 |
| Capital Work in Progress | 3 | 5 | 7 | 11 | 19 |
| Other Assets | 86 | 105 | 118 | 225 | 252 |
| Total Assets | 146 | 170 | 189 | 320 | 374 |
| Net Worth | 60 | 84 | 105 | 257 | 293 |
| Total Borrowings | 57 | 60 | 57 | 24 | 38 |
| Net Debt | NA | 48 | 53 | Net cash | Net cash |
| Net Debt / EBITDA (x) | NA | 1.8 | 1.4 | Net cash | Net cash |
| Return on Equity (%) | NA | 20.1 | 26.1 | 15.0 | 13.3 |
| Return on Capital Employed (%) | NA | 16.5 | 21.1 | 15.0 | 13.9 |
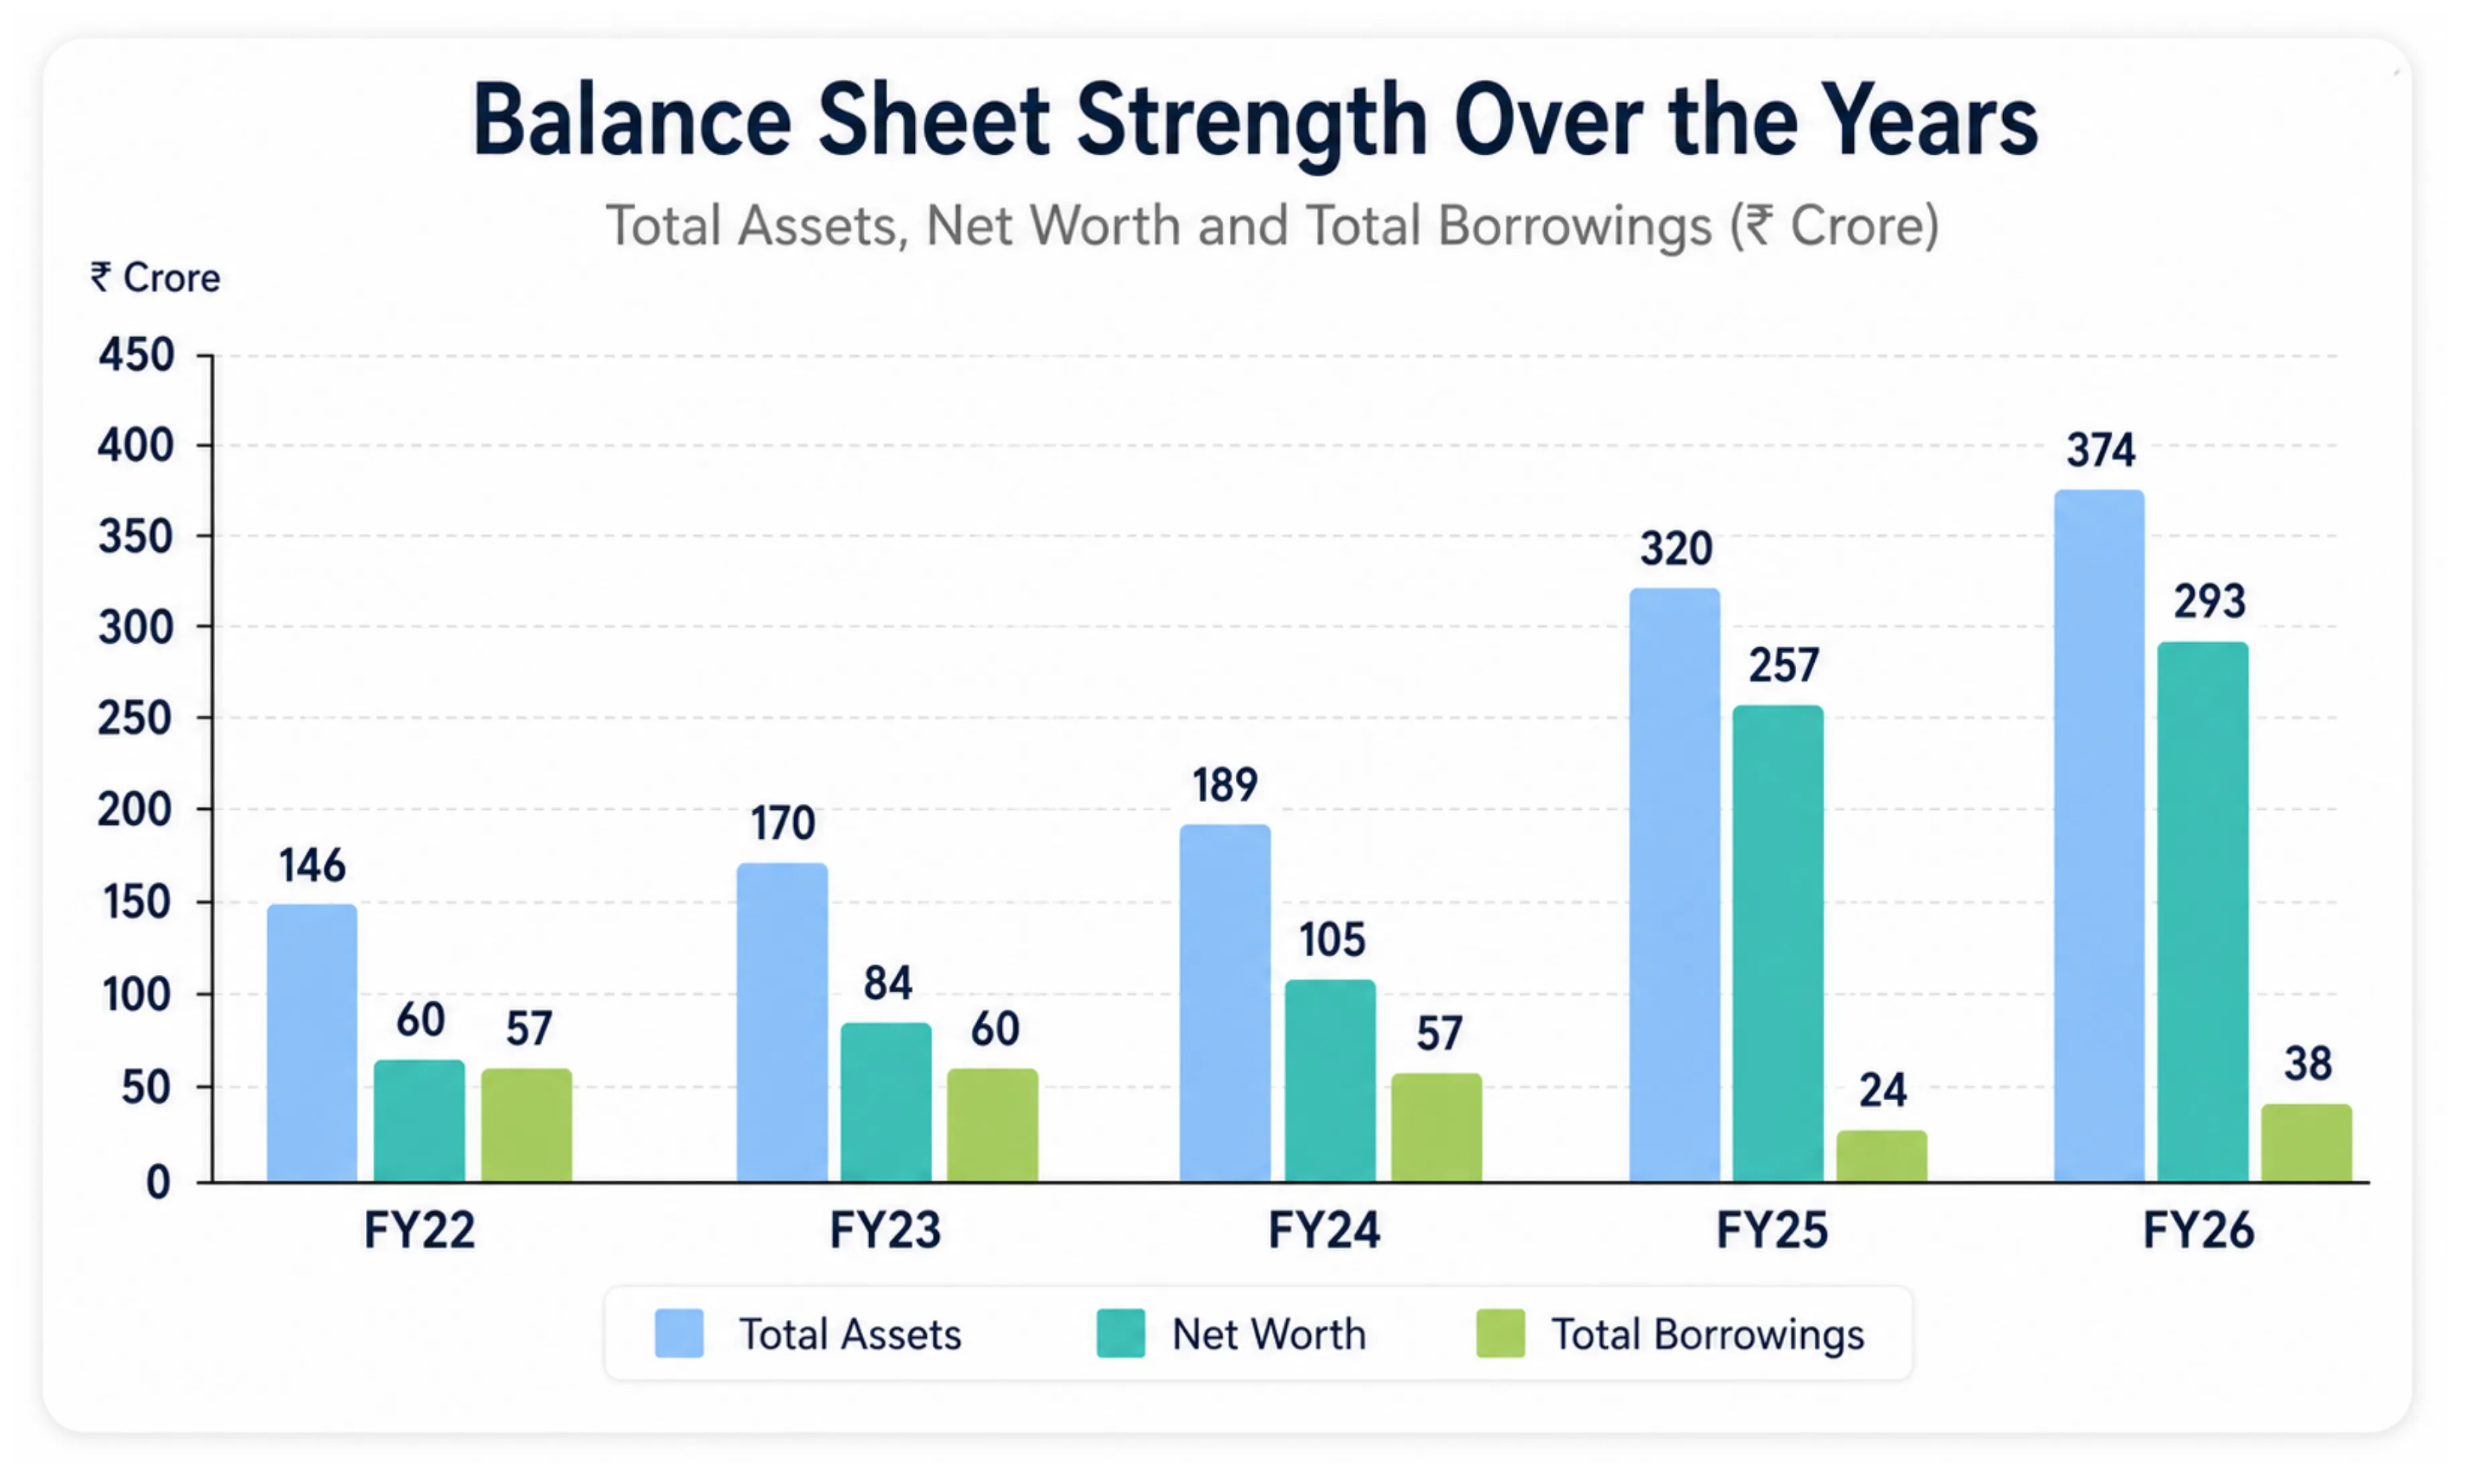
Debt is not a story at this company. Borrowings stood at Rs 38 crore against cash and bank balances of Rs 50.5 crore at the close of FY26, leaving a small net cash position, and debt to equity of 0.13. [Interest](https://www.tradejini.com/finance-kickstarter/interest) cost has halved from Rs 6 crore to Rs 3 crore across the period as public issue proceeds were used to retire Rs 45.4 crore of loans.
The line that will trouble readers is the return ratios. Return on equity fell from 26.1% in FY24 to 13.3% in FY26, and return on capital employed from 21.1% to 13.9%. On the face of it, a business that halved its returns in two years while growing revenue by more than half is a business doing something wrong.
It is not, or at least not for that reason. Net worth went from Rs 105 crore to Rs 257 crore in a single year, because the company raised Rs 121.2 crore through its public issue in FY25. Returns are calculated on that enlarged base. The relevant test is not whether the ratio fell, which was arithmetically certain, but whether the new capital is being put to work. Of the Rs 121.2 crore raised, Rs 84.1 crore had been deployed as of the latest disclosure, with Rs 45.4 crore to loan repayment, Rs 28.4 crore to the Chennai plant and Rs 9.3 crore to Wada. Rs 37.1 crore remains unspent, of which Rs 26.8 crore was earmarked for general corporate purposes.
Roughly thirteen percent of the equity base is therefore sitting idle and dragging the ratio down. The honest reading is that returns will not recover to FY24 levels through capital deployment alone, but that a meaningful part of the decline is timing rather than deterioration.
Also Read: A Fundamental Look At Sheela Foam's Kurlon Turnaround
Where the Demand Comes From
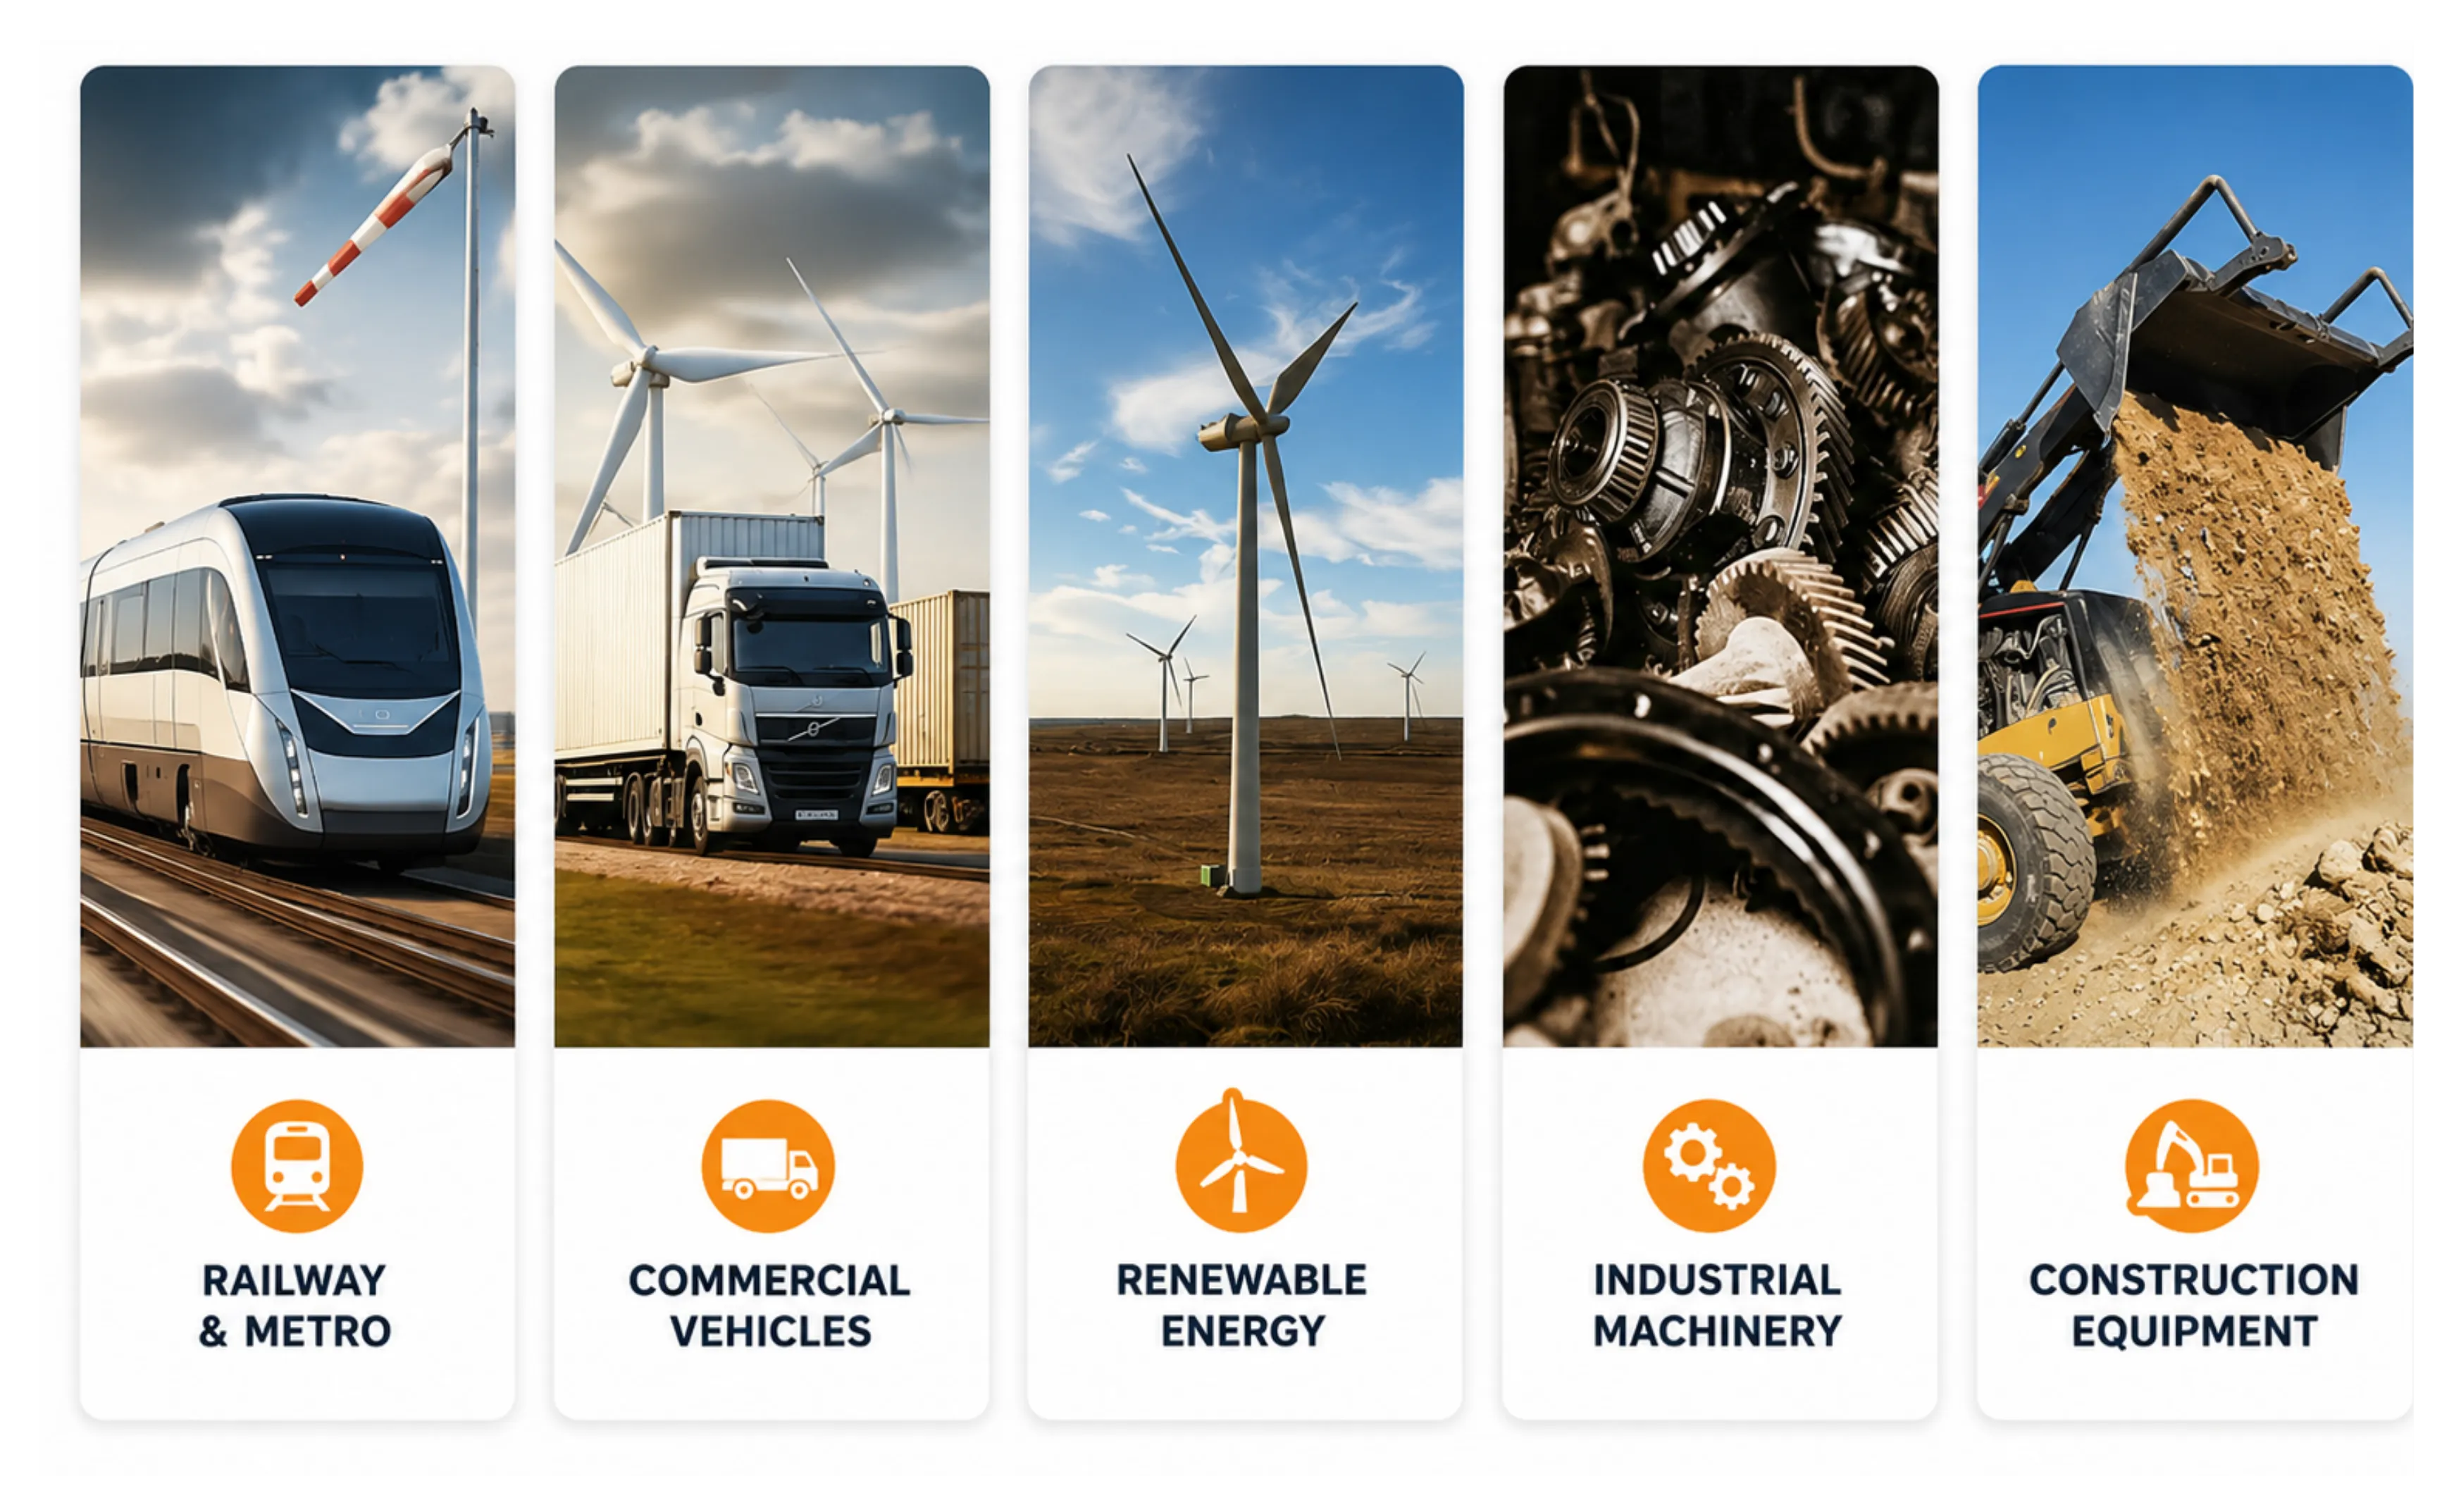
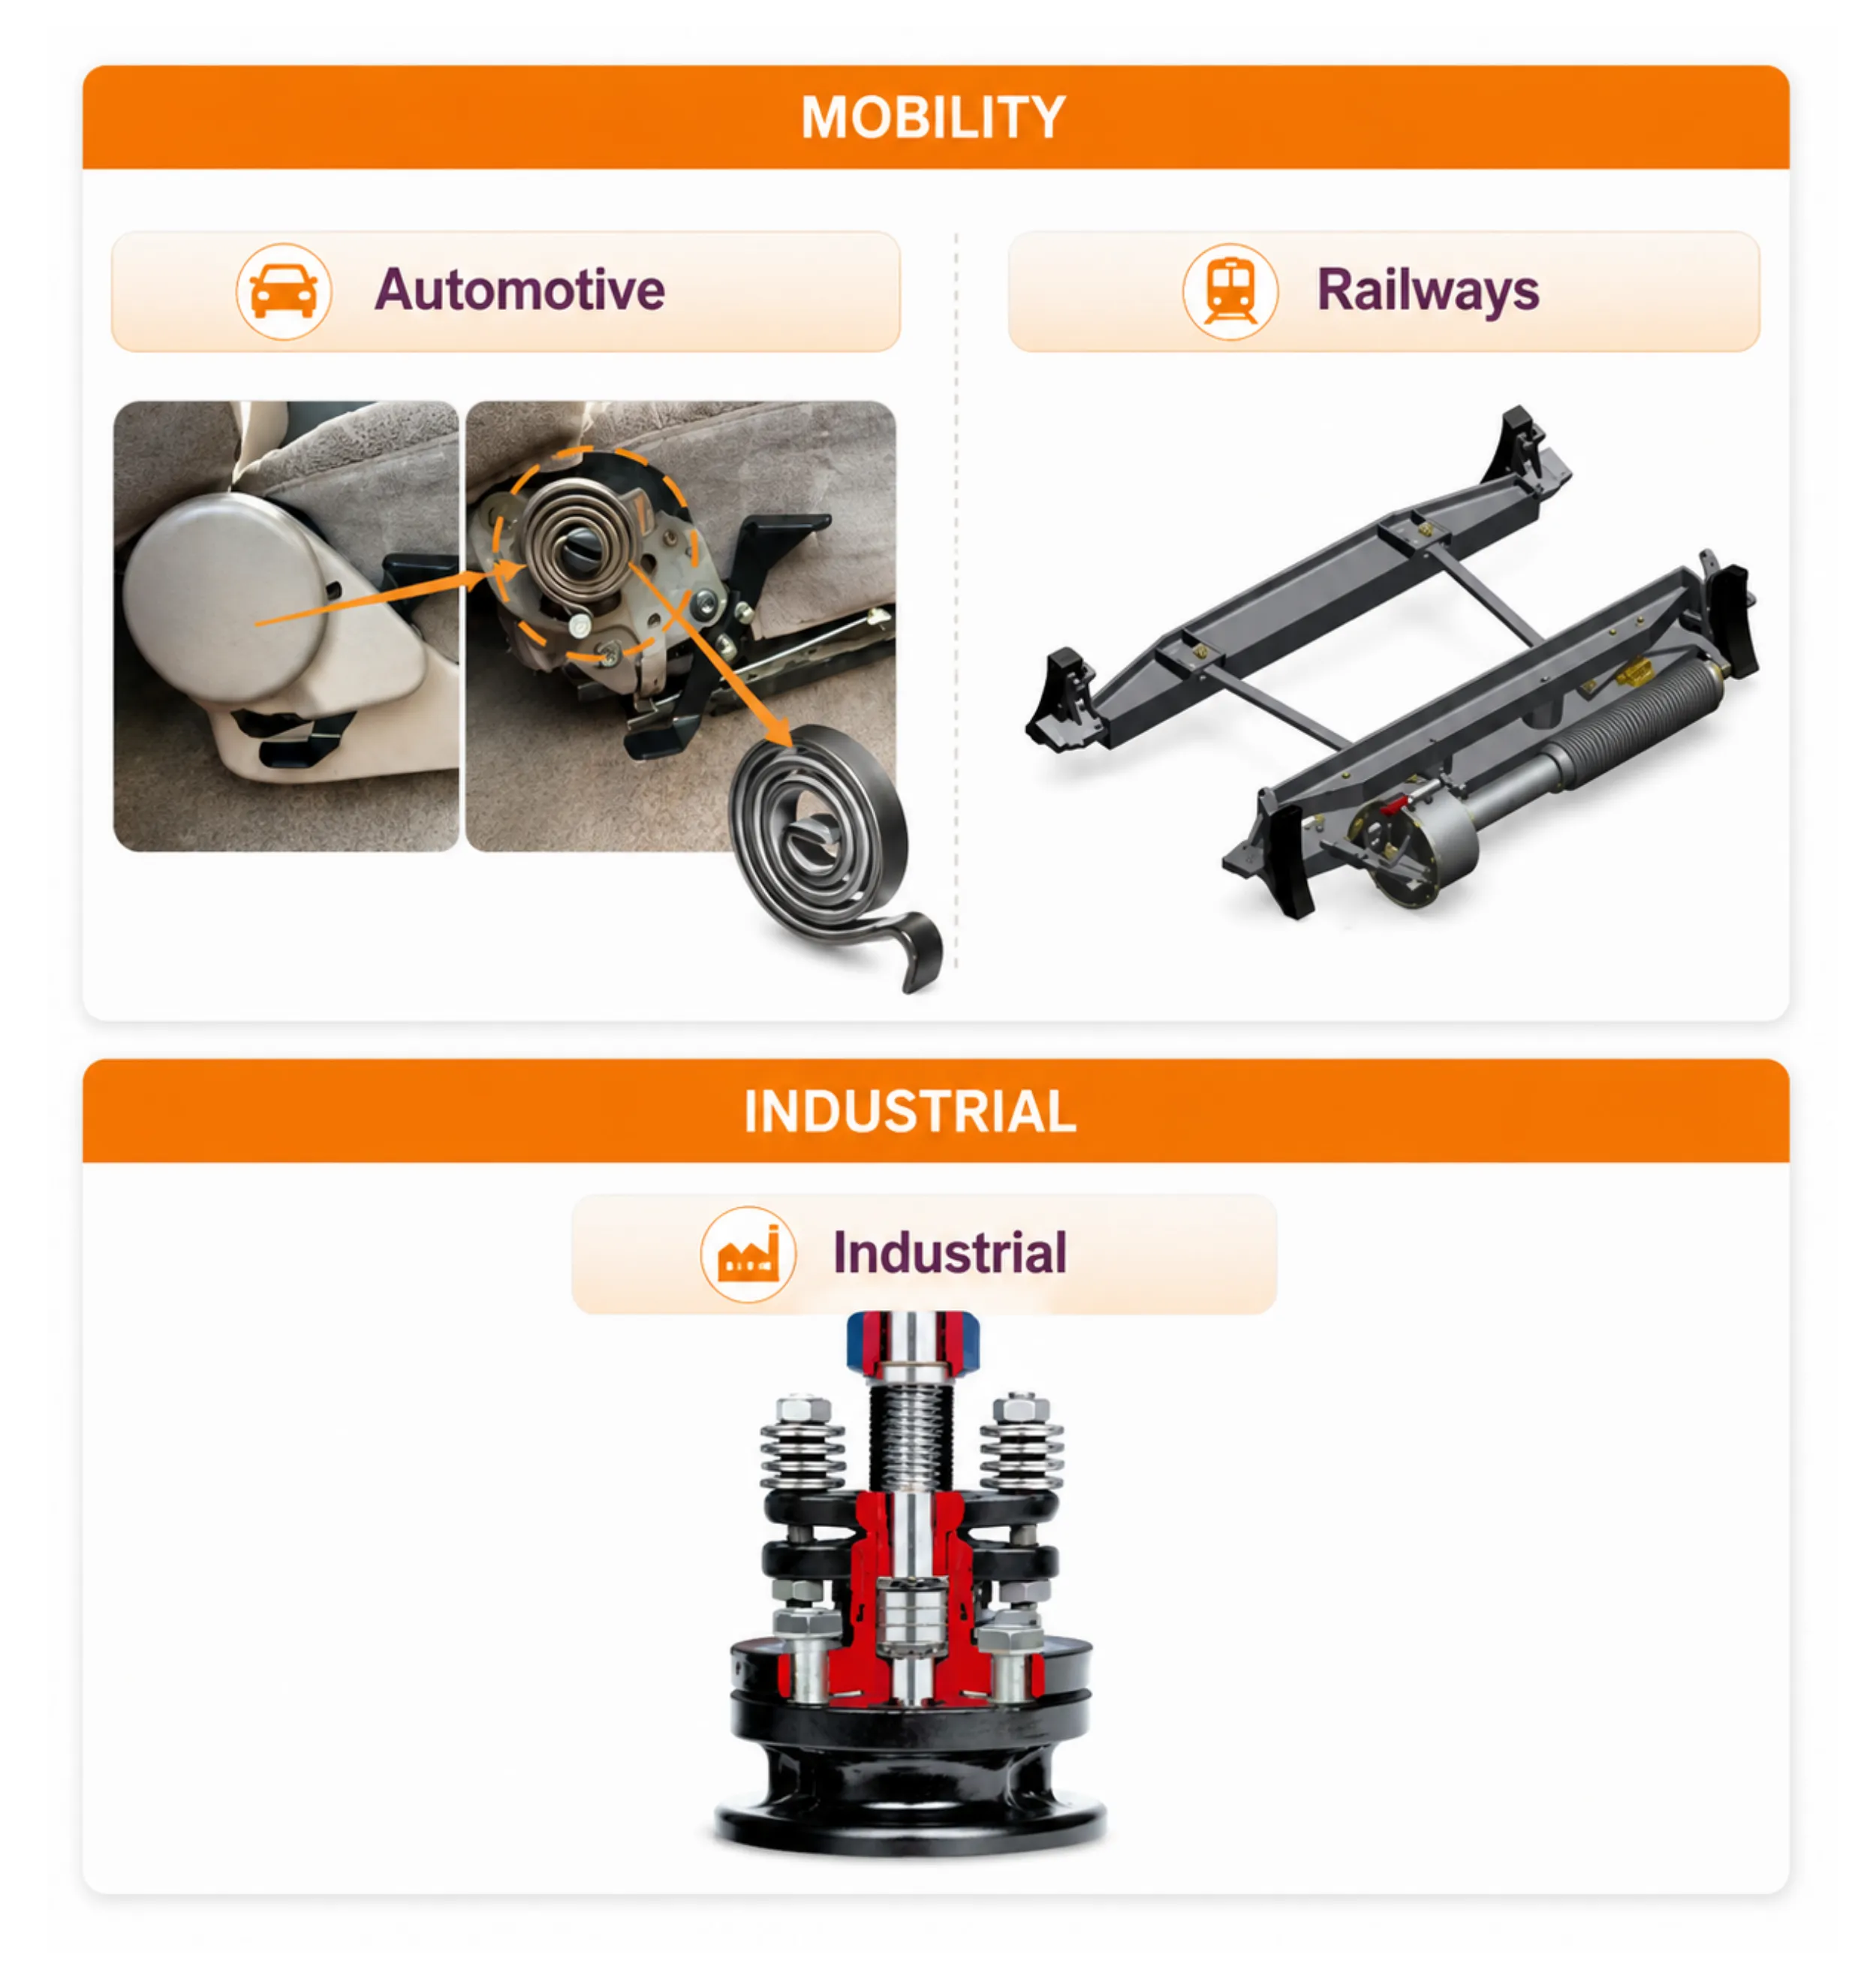
Gala's end markets divide into renewable energy at 42% of FY26 revenue, industrial applications at 32% and mobility at 26%. The renewable share is the one that has moved, and it is the one worth examining.
India added 6.05 GW of wind capacity in FY26, taking cumulative installed wind capacity beyond 56 GW. That addition was nearly 46% higher than the preceding year, and the medium-term outlook points to annual additions of roughly 7 to 10 GW, with one market estimate putting cumulative additions at 57 GW by 2032, implying an average near 8 GW a year. Total non-fossil capacity reached 283.46 GW as at 31 March 2026.
For a components supplier this matters in a specific way. A wind turbine needs anchor bolts in its foundation, high tensile studs through its tower flanges, disc springs in its yaw brake and thrust bearing mechanisms, and vibration resistant washers throughout. That content is fixed per turbine and consumed at installation. Wind installation is therefore not a general economic tailwind for Gala, it is close to a direct volume input, and the roughly 46% step up in FY26 installations sits alongside the roughly 32% revenue growth the company reported in the same year.
The concentration cuts both ways, and the export exposure adds a second layer. Around 60% to 65% of wind energy sales are domestic and 30% to 35% are export, with exports overall at 35.5% of company revenue in FY26, split between Europe at 19% and America at 13%.
On the export side, one widely anticipated benefit is likely to be smaller than expected. Gala's products currently attract a 3.7% import duty in Europe, paid by its customers. Management expects the India European Union free trade agreement to take that to zero from January 2027, and then said plainly that the benefit would likely be offset by the Carbon Border Adjustment Mechanism, a European levy on the embedded carbon in imported goods, which will impose an additional cost on the same customers for the same shipments. Two policy changes moving in opposite directions on the same trade lane. The candour is more useful than the outcome.
The other end markets grow more slowly. Domestic demand for disc and strip springs including wedge lock washers is projected to compound at roughly 6.1%, and the global market at 6.2%. Coil and spiral springs are projected at 9.8% domestically. Domestic special fastening solutions are projected at 18.0%, the fastest of the three by a wide margin.
What Gala Has That Others Do Not
The first advantage is position in a defended niche. Gala holds roughly 70% of the domestic renewal market for disc and strip springs, and runs that facility at 85% capacity utilisation against installed capacity of 225.5 million units. Renewal demand, meaning replacement of parts in equipment already in service, is the most durable revenue a component maker can hold, because the specification is already written and the incumbent is already approved.
The second is the customer list, which functions as evidence rather than decoration. Vestas, GE Vernova, Suzlon, Enercon, Senvion and Regal Rexnord in renewable energy. ABB, Siemens Energy, Schneider Electric, Larsen and Toubro, John Deere, Würth and Legrand in industrial. Schaeffler, Wabtec, Hitachi Astemo, Indian Railways and Endurance in mobility. Each of these required a qualification cycle to enter. The associated recognitions are specific and dated: supplier of the year for disc springs from ABB in 2015, a gold category award from Endurance in 2018, and a high quality and reliability supplier recognition from Würth in 2023.
The third is breadth within a narrow definition. Alongside the product range described earlier, the company offers more than 100 standard disc spring sizes from stock with online selection software. Management's own decomposition of recent growth is instructive on how this converts to revenue: approximately 10% from entirely new customers, 10% to 12% from selling new parts to existing customers, and 5% to 7% from organic growth in existing parts. The middle component is the one the breadth buys. A customer already purchasing disc springs is a low-friction buyer of wedge lock washers, and then of bolts.
The fourth is a manufacturing footprint that was assembled ahead of demand. Land at Vallam Vadagal in the SIPCOT industrial estate near Chennai was purchased in 2022 for future fastener expansion, and the plant was commissioned in 2025. The advantage was in the sequencing rather than the asset.
Where the Next Three to Five Years Come From
Chennai, and the arithmetic of a ramp
The Chennai plant has installed capacity of 4,600 metric tonnes and ran at 40% utilisation in FY26. It reached a monthly output run rate of roughly Rs 5 crore by the fourth quarter, equivalent to Rs 60 crore annually. Phase 2 was under construction as at the FY26 earnings call, expected to complete around the end of June or in July, adding a further Rs 5 crore of monthly capacity and taking total annual capacity to roughly Rs 120 crore of output.
Management's stated expectation is roughly Rs 80 crore of revenue from Chennai in FY27, or close to 67% to 70% utilisation, with the monthly run rate climbing through the second half toward Rs 9 crore to Rs 10 crore. Against FY26 group revenue of Rs 314 crore, that single plant delivering as guided would contribute a substantial share of the 20% to 25% growth management targets at the company level.
The execution risk is straightforward. The ramp depends on customer approvals converting to volume rather than on machinery, and the first commercial supply of high tensile bolts to a global wind turbine maker in India only commenced in the fourth quarter of FY26. A single delayed qualification moves the whole schedule.
The land constraint
This is the most concrete near-term issue in the business, and management was unusually direct about it. Once Phase 2 is complete, the Chennai site is fully built out, with no remaining land. Wada has no additional land either, with the available floor space index already constructed.
The company has been evaluating two or three industrial plots at Wada for outright purchase, and separately pursuing a long-lease plot from the SIPCOT authority at Chennai. As at the FY26 call, neither had closed. Management indicated roughly Rs 50 crore of capital expenditure could be deployed in FY27 depending on when land is finalised, and that from land acquisition to a commissioned facility takes roughly fifteen months give or take three, comprising six months for initial approvals and nine to twelve months for construction and final clearances.
Working backwards, land closing in the middle of calendar 2026 means a new facility contributing revenue somewhere in FY28. The fallback, should land not close, is to shift stud manufacturing to a leased facility and expand bolt manufacturing within the existing buildings. That preserves order fulfilment but does so at lower capital efficiency.
Offshore wind
The company entered the offshore wind turbine segment in FY26 through the development and supply of critical fasteners to a global original equipment manufacturer in Europe. Management expects the offshore relationship to contribute roughly 10% of fastener sales within two to three years. On FY26 fastener revenue of Rs 108 crore that is a modest absolute number, but offshore turbines are larger, use more fastener content per unit and impose tighter qualification standards, so the strategic value is the reference rather than the initial volume. The risk is dependency on a single customer relationship in a segment where project timelines routinely slip.
Widening the addressable market by adding products
The pattern management describes is deliberate and repeatable. Manufacturing studs addressed roughly USD 1 billion of the global market. Adding bolts and nuts took the addressed market to roughly USD 2.5 billion. Five years ago the company added Gallock wedge lock washers to the disc spring family, competing mainly with European producers.
Management also flagged where the pull is coming from next, citing opportunities in gas turbines, railways, construction equipment, mining equipment and agricultural equipment, with market development already underway and some orders recently confirmed. The risk is dilution of focus. Each new product family requires its own qualification cycle and its own working capital, in a business that is already consuming more working capital than it generates.
How Gala Compares
Genuine listed comparables for this business do not exist in India. The two competitors management names for coil and spiral springs are NHK Spring, a Japanese company with plants at Aurangabad and Gurgaon, and Stumpp, Schuele and Somappa, an Indian company headquartered in Bengaluru. The first is listed in Japan and the second is unlisted, so neither can appear below.
The two companies that do appear are fastener manufacturers whose end markets are dominated by automobiles rather than renewable energy, and whose scale differs from Gala's substantially in both directions. Sundram Fasteners is roughly twenty times Gala's revenue. Sterling Tools is currently in a sharp contraction. This is a reference table on scale, profitability and valuation, not a like for like comparison, and no conclusion about relative business quality should be drawn from it without that qualification.
Peer Comparison, as on 20 July 2026
| Company | CMP (Rs) | Market Cap (Rs Cr) | Revenue (Rs Cr) | Revenue Growth (%) | Operating Margin (%) | RoCE (%) | RoE (%) | Debt / Equity | PE (x) | EV/EBITDA (x) |
|---|---|---|---|---|---|---|---|---|---|---|
| Gala Precision Engineering | 1,212 | 1,553 | 314 | 32.2 | 16.6 | 15.6 | 13.2 | 0.13 | 42.7 | 26.6 |
| Sundram Fasteners | 955 | 20,079 | 6,289 | 5.6 | 15.9 | 17.6 | 14.9 | 0.15 | 33.3 | 19.1 |
| Sterling Tools | 243 | 871 | 828 | (19.3) | 9.2 | 7.2 | 4.7 | 0.28 | 36.3 | 9.8 |
The table says three things. Gala runs the highest operating margin of the three, which is consistent with a product mix weighted toward engineered components rather than volume fasteners. Its return on capital is close to Sundram's but not ahead of it, and its return on equity is lower, which is the public issue capital still working its way into the business. And it carries the highest multiples on both earnings and enterprise value, by a wide margin over Sundram.
The premium is therefore being paid for the growth rate, 32.2% against Sundram's 5.6%, and not for superior returns on capital as they stand today.
Sterling Tools is the more instructive row, for an uncomfortable reason. Revenue down 19.3%, profit down 58.7% and return on capital employed at 7.2% is what a fastener business looks like when its principal end market turns down. Sterling's principal end market is automobiles. Gala's is wind, at 42% of revenue and rising. Nothing about Gala's current trajectory resembles Sterling's. The row is in the table to show the shape of the downside for this business model, which is the thing a growth multiple tends to make readers forget.
Key Risks
Cash conversion and working capital intensity. Severity: high. The trigger is revenue growth continuing at 20% or more while debtor days fail to improve below the mid-nineties. The financial impact falls on free cash flow, which has already been negative by Rs 31 crore and Rs 28 crore in the last two years, and eventually on borrowings, since a company generating Rs 10 crore of operating cash cannot self-fund Rs 50 crore of annual capital expenditure indefinitely. Every incremental rupee of revenue currently consumes cash before it returns any.
Concentration in wind energy. Severity: high. The trigger is a slowdown in Indian wind installations from the 6.05 GW added in FY26 back toward earlier levels, or the loss of a single large original equipment manufacturer relationship. Renewable energy is 42% of revenue and is the segment driving growth, so the impact would hit revenue growth and operating leverage simultaneously. With the Chennai plant's fixed cost base now in place, an unfilled ramp would compress operating margin well below the 17% to 19% band management expects.
Land constraint at both plants. Severity: medium. The trigger is failure to close either the Wada plots or the SIPCOT allotment through FY27. Once Phase 2 completes, capacity is capped at roughly Rs 120 crore of output from Chennai with no further land at either site. The impact is on growth beyond FY28 rather than on current earnings, and the fallback of leasing space for stud manufacturing preserves volume at the cost of capital efficiency and probably of margin.
Litigation over wedge lock washers. Severity: medium. A patent suit relating to wedge lock washers remains pending, with arguments not yet heard as at the FY26 earnings call and the next hearing scheduled for June 2026. Wedge lock washers sit within the disc and strip springs family that contributed 49% of FY26 revenue, though the washer sub-line is a fraction of that. The impact would be felt through legal costs, potential damages, or restriction on a product line the company has invested in since roughly 2020.
Foreign exchange. Severity: medium. Exports are 35.5% of revenue, and the company reduced forward cover from 70% of estimated export collections to 40%, extending twelve months forward. A Rs 3.23 crore foreign exchange loss in FY26 cost close to a full percentage point of operating margin. The reduced hedge ratio increases exposure to currency movement in both directions, and the same loss recurring would keep margin below the guided band.
Raw material pass-through lag. Severity: medium. Steel and energy cost inflation is recovered from customers, but only after a negotiation that management indicated begins after the cost has been incurred. The trigger is a sharp input cost move within a quarter. The impact is quarterly margin volatility of the order of one to two percentage points, which annualises out but does not disappear within any single reporting period.
Also Read: A Fundamental Review of Mahindra Logistics’ FY26 Growth
Valuation
The method matters more than usual for this company, so it is worth stating before any number appears.
Gala is not a capital-light business. Net fixed assets plus capital work in progress went from Rs 59 crore to Rs 123 crore across the five years, asset turnover is 0.91, depreciation has risen from Rs 6 crore to Rs 10 crore and will keep rising as the Chennai and prospective new-site assets come on, and management has indicated roughly Rs 50 crore of further capital expenditure in FY27 against FY26 EBITDA of Rs 52 crore. A price to earnings multiple applied through a capacity build understates the business, because rising depreciation compresses reported earnings for reasons that have nothing to do with the operations.
The primary method used here is therefore enterprise value to EBITDA on forward earnings, which is neutral to the depreciation schedule and to the capital structure. Forward price to earnings is shown alongside it as a secondary check. A third test, free cash flow conversion, is applied afterwards, because both multiples measure the same reported profit and neither of them can see whether that profit arrives as cash.
One arithmetic note, so that two numbers in this article do not appear to contradict each other. The peer table shows enterprise value to EBITDA of 26.6 times on a basis that includes other income within EBITDA. On operating EBITDA alone of Rs 51.9 crore, against an enterprise value of approximately Rs 1,540 crore after netting Rs 38 crore of borrowings against Rs 50.5 crore of cash and bank balances, the trailing multiple is 29.7 times. Both are correct on their stated basis.
Scenario assumptions, FY28 estimated
The bull case requires three things to go right together: Chennai reaching close to full utilisation across both phases by FY28, new land closing during FY27 so that capacity is not capped, and the offshore wind relationship converting to volume. That combination supports revenue growing at roughly 30% and 25% across the two years, with operating margin recovering to the top of management's guided band at 19% as the new plant absorbs its fixed cost.
The base case assumes Chennai delivers close to management's Rs 80 crore guidance in FY27 and improves further in FY28, that group revenue grows in the low twenties in percentage terms, consistent with the 20% to 25% management targets, and that operating margin settles at 17.5%, which is the lower half of the guided band and roughly where FY26 sits once the foreign exchange loss is excluded.
The bear case assumes wind installations moderate, Chennai utilisation stalls below 60%, and margin compresses to 15% as fixed costs sit against lower volume. Revenue growth slows to roughly 11% a year. This is a moderate disappointment, not a collapse.
Valuation Scenario Matrix, FY28 Estimated
| Scenario | Revenue (Rs Cr) | EBITDA (Rs Cr) | EBITDA Margin (%) | PAT (Rs Cr) | EPS (Rs) | Implied PE at CMP (x) | Implied EV/EBITDA at CMP (x) |
|---|---|---|---|---|---|---|---|
| Bull | 530 | 101 | 19.0 | 68 | 53.1 | 22.8 | 15.4 |
| Base | 468 | 82 | 17.5 | 54 | 42.2 | 28.7 | 19.0 |
| Bear | 390 | 59 | 15.0 | 33 | 26.0 | 46.6 | 26.5 |
Implied multiples are calculated on the current market capitalisation of Rs 1,553 crore and a share count of 1.272 crore shares. All three scenarios assume a normalised effective tax rate of 22%, against 18% to 19% actually reported in FY25 and FY26, and depreciation rising to between Rs 15 crore and Rs 16 crore as new capacity is commissioned.
The matrix says something specific about what is already in the price. At the current market price the shares trade at roughly 28.7 times a base case that is two years out and that itself assumes management delivers close to its own guidance on both growth and margin. In the bear case, which is a moderate disappointment rather than a bad outcome, the shares would still be at 46.6 times FY28 earnings, above where they trade on trailing FY26 earnings today. Only the bull case, requiring three separate things to go right in sequence, brings the multiple into the range where Sundram Fasteners trades today on realised rather than projected numbers.
Now the third test. Suppose the base case arrives exactly. Rs 54 crore of profit after tax in FY28. On the cash conversion of the last three years, roughly 35% of operating profit reaching operating cash, that Rs 82 crore of EBITDA would produce something near Rs 29 crore of operating cash, against capital expenditure that management has already indicated runs near Rs 50 crore a year while the expansion continues. Free cash flow would remain negative even in the case where everything works.
That is not a reason the base case is wrong. It is a statement about what has to change for the base case to be worth what the market is paying for it. Either cash conversion improves toward the 65% to 75% the company achieved in FY22 and FY23, or the capital expenditure cycle ends, or the company funds the gap. The first is the only one of the three that resolves the question rather than deferring it.
Stress Test
The stress test differs from the bear case in that three adverse developments occur at once rather than one moderately.
The assumptions are these. Indian wind installations revert toward FY25 levels, removing the volume growth that has driven revenue. The Chennai plant stalls near 45% utilisation as customer approvals slip, leaving the Phase 2 fixed cost base substantially unabsorbed. And working capital extends past 160 days as customers stretch payment terms in a weaker capital expenditure environment, forcing the company to fund the gap with borrowings while the FY27 capital expenditure commitment is already underway.
Stress Test, FY28 Estimated
| Metric | Base Case FY28E | Stress Scenario FY28E |
|---|---|---|
| Revenue (Rs Cr) | 468 | 355 |
| EBITDA (Rs Cr) | 82 | 48 |
| EBITDA Margin (%) | 17.5 | 13.5 |
| Interest Cost (Rs Cr) | 3 | 8 |
| PAT (Rs Cr) | 54 | 22 |
| Net Debt (Rs Cr) | Net cash | 75 |
| Net Debt / EBITDA (x) | Net cash | 1.6 |
The business survives this comfortably, and it is worth being precise about why. Net worth stood at Rs 293 crore at the close of FY26 against total borrowings of Rs 38 crore, with a current ratio of 3.44 and a small net cash position. Even with Rs 75 crore of net debt in the stressed scenario, leverage would sit at 1.6 times EBITDA, which is well within the range a manufacturer with this asset base can carry. The company would remain profitable throughout, at roughly Rs 22 crore, and interest cover would remain above five times.
The threshold at which survival becomes a genuine question is considerably further out. It would require operating margin falling below roughly 8%, at which point interest and depreciation would consume nearly all operating profit, combined with working capital continuing to expand. On the evidence of the last five years, the lowest operating margin recorded was 13.8% in FY22, when revenue was less than half current levels and the fixed cost base was correspondingly thinner. The financial risk in this business is not solvency. It is that capital keeps going in and cash keeps not coming out, and the returns stay in the low teens for longer than the current price assumes.
Key Monitorables
| Metric | Why It Matters | Threshold |
|---|---|---|
| Cash from operations as a percentage of EBITDA | The single measure of whether reported profit is real cash. Fell from 74% in FY23 to 34% in FY26 | Above 50% and rising: working capital strain is a ramp cost. Below 35% for a third consecutive year: it is structural |
| Chennai plant capacity utilisation | The plant is the principal growth engine and its fixed cost is already committed | Above 65% by Q4 FY27, consistent with management's Rs 80 crore revenue guidance. Below 55%: reassess the growth path |
| EBITDA margin | Tests whether the FY26 decline was foreign exchange or something structural | Sustained above 17.5% through FY27 confirms the explanation. Below 16% for two consecutive quarters does not |
| Debtor days | The visible source of the working capital strain | Below 90 and falling: collection is improving. Above 105: the FY25 problem has returned |
| Land acquisition at Wada or SIPCOT | Growth beyond FY28 is capped without it, and the commissioning lag is roughly fifteen months | Closed and announced by the end of FY27. Not closed by then: growth beyond FY28 is constrained regardless of demand |
What the Company Has Proven, and What It Has Not
Gala Precision Engineering has done something genuinely difficult over the last five years. It has taken a business built on a product category where it was already dominant, disc and strip springs, and where the entire global market is worth roughly USD 891 million, and moved deliberately into fasteners, where the global market is roughly USD 97 billion and where it started with nothing. It did this without abandoning the original business, without discounting its way in, and without breaking its balance sheet. Special fastening solutions went from under 15% of revenue to 34% in five years and crossed Rs 100 crore. The plant that will carry the next stage of that shift is built, approved by a global wind turbine maker and shipping.
That is the proven part. It is not a small thing, and it is why the business commands attention that a Rs 314 crore engineering company would not otherwise receive.
What remains unproven is whether this business can convert its profits into cash at scale. Across the last three years it reported roughly Rs 84 crore of profit and collected roughly Rs 29 crore of operating cash. Free cash flow has been negative for two consecutive years. Returns on capital have fallen to the low teens, partly for the benign reason that public issue money is still finding its way into assets, and partly because a business consuming working capital at this rate has to keep feeding capital in to stand still. Management has guided to improving cash flow conversion by around 10% a year, which is honest about the direction and modest about the pace.
The market is currently paying roughly 42.7 times trailing earnings and 26.6 times enterprise value to EBITDA for a company delivering 32% revenue growth, a 16.5% operating margin and a 13.3% return on equity. What the business is delivering is a successful strategic migration into a larger market, executed carefully, funded prudently and not yet visible in cash. What the price appears to assume is that the migration completes on schedule, that margin recovers to the upper half of the guided band, and that the cash follows. Two of those three are within management's control. The third depends on customers who are considerably larger than Gala and who set the payment terms.
Disclaimer: The information provided in our blogs is for informational purposes only and should not be construed as financial, investment, or trading advice. Trading and investing in the securities market carries risk. Always conduct your own research and consult with a qualified financial advisor before making any investment decisions. Past performance is not indicative of future results. Copyrighted and original content for your trading and investing needs.
© 2026 — Tradejini. All Rights Reserved.