

India had 39 GW of total renewable energy capacity (excluding large hydro) in 2015. By March 2026, that number had grown to 275 GW, which is a more than seven-fold increase in just over a decade. In FY26 alone, the country added ~55 GW of fresh non-fossil fuel capacity (provisional estimates), the highest single-year addition in the nation's history, nearly double the previous record of 29.5 GW set in FY25. To put that in perspective, 55 GW is roughly equivalent to the entire renewable energy capacity that India had in 2017. In effect, the country added nearly two decades’ worth of capacity in a single year. Solar has led this charge. India now has 150.26 GW of installed solar capacity as of March 2026, making it the world's third-largest solar power producer. Within that, 44.61 GW of solar was added in FY26 alone, nearly double the 23.83 GW added in FY25, which was itself a record at the time. Solar module manufacturing capacity reached 172 GW by March 2026, up from 74 GW in March 2025, with solar cell manufacturing capacity crossing 26 GW. The domestic solar manufacturing ecosystem has scaled up so rapidly that Indian module demand has significantly shifted toward domestic sources, especially for ALMM-compliant projects, a structural shift that took years to build and has significant implications for companies in the manufacturing value chain.
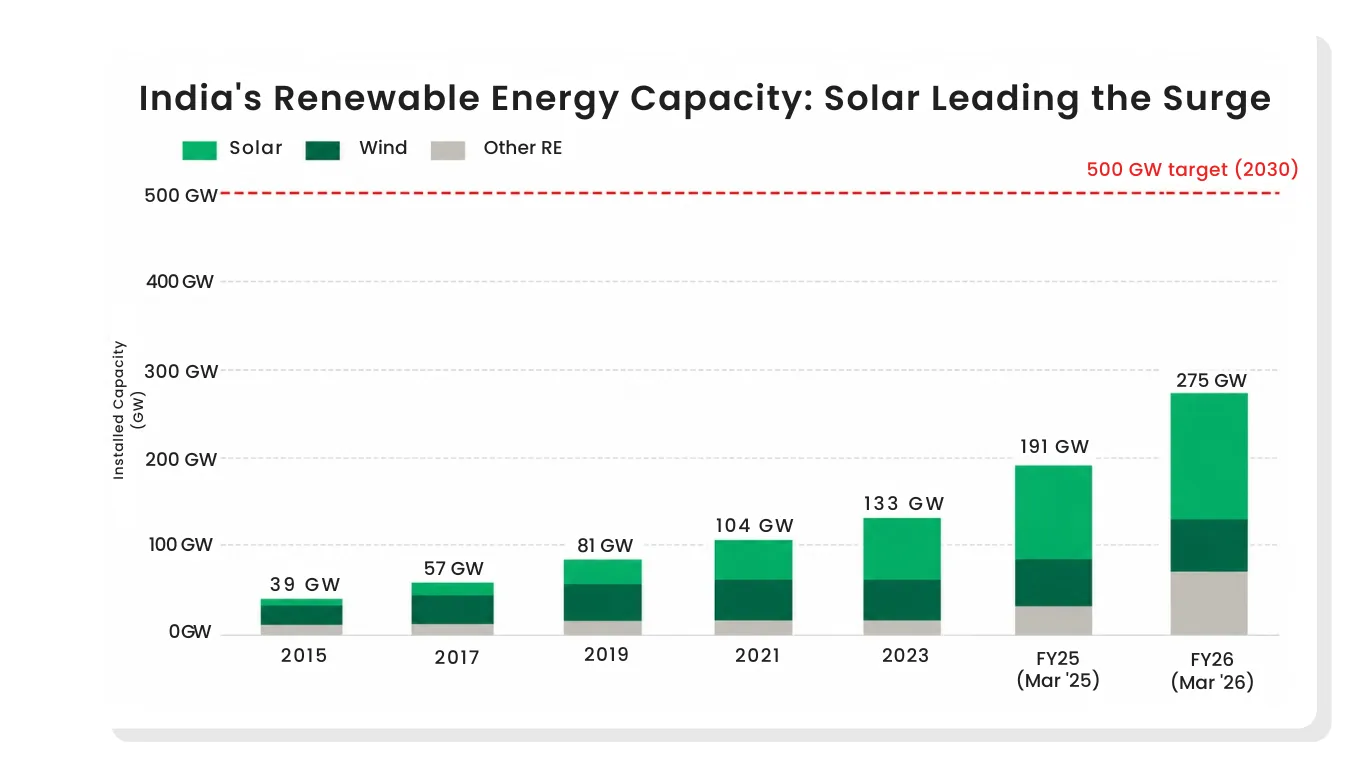
India's Renewable Energy Capacity Growth (GW): Solar has driven the bulk of additions since 2021. Source: MNRE / IRENA
Where India Stands Globally
India now ranks 3rd globally in renewable energy installed capacity, 4th in wind power capacity, and 3rd in solar power capacity, according to the International Renewable Energy Agency (IRENA). In a decade, it went from being a minor player in the global renewable energy landscape to being one of the fastest-growing large renewable energy markets globally. That is not an incremental change. That is a structural repositioning of the country in the global economy.
Non-fossil sources (including large hydro and nuclear) now make up over 51% of India's total installed power capacity of 532+ GW, and the NDC goal of having 50% non-fossil capacity was achieved five years ahead of the 2030 deadline. India was also the world's largest recipient of development finance funding for clean energy in 2024, attracting around USD 2.4 billion in project-type interventions in a single year. FDI into the non-conventional energy sector has risen from roughly 1% of total FDI inflows in FY21 to around 8% in FY25. The sector attracted USD 3.4 billion in FDI in the first three quarters of FY25 alone, nearly matching all of FY24.
What Is Green Energy and Why India Is Different From Every Other Market
When financial media talks about green energy, they often use it as a catch-all term for anything that is not coal or oil. In reality, 'green energy' in the Indian stock market context spans at least five distinct sub-sectors with very different business models, margin profiles, capital requirements, and risk factors.
The Five Sub-Sectors That Matter
1. Solar Power Generation
Solar power generation is the largest and fastest-growing segment. India installed 44.61 GW of new solar capacity in FY26, taking total installed solar to 150.26 GW, a massive acceleration from 26 GW in FY18. Companies like Adani Green Energy and NTPC Green Energy are primarily solar power developers: they build plants, sign long-term Power Purchase Agreements (PPAs) with state utilities or corporates, and collect tariff-based revenue for 25 years. EBITDA margins in this segment are extraordinarily high: Adani Green reported a 91.7% EBITDA margin at the power generation (supply) level on its power supply operations in FY25, because the 'fuel' is free sunlight.
2. Wind Power Generation
Wind power generation is the second pillar. India had 56 GW of installed wind capacity as of March 2026, adding 6.05 GW in FY26, also a record. The National Electricity Plan targets 122 GW of wind capacity by FY32. JSW Energy, Tornt Power, and NTPC Green are growing their wind portfolios alongside solar. Wind economics are slightly different, with higher upfront costs, lower capacity utilisation in certain geographies, but the revenue model is similar: long-term tariff contracts with DISCOMs or direct corporate buyers.
3. Solar Manufacturing and Equipment
Solar manufacturing and equipment is the industrial backbone of the energy transition. Companies like Borosil Renewables (solar glass, the only large-scale manufacturer in India, and the largest non-Chinese solar glass producer in the world), Websol Energy (solar cells and modules), and Tata Power Solar through its subsidiary TP Solar (which commissioned a 4.3 GW integrated cell and module manufacturing facility in Tirunelveli, Tamil Nadu in December 2024, with PAT swinging from a loss of ₹36 crore to a profit of ₹422 crore in FY25) are the picks-and-shovels plays in the green energy ecosystem.
4. Green Hydrogen: The Emerging Frontier
India's National Green Hydrogen Mission has a target of producing 5 million tonnes per annum of green hydrogen by 2030. Budget allocation doubled to ₹600 crore in FY26. The business case is still being established, and no listed Indian company has green hydrogen as a mature revenue line yet, though NTPC, Adani, and Greenko are all investing.
5. Wind O&M Services
Wind O&M services represent perhaps the most overlooked corner of the ecosystem. Inox Green Energy Services manages a 3.5 GW wind turbine operations and maintenance portfolio as of FY25. This is an asset-light, high-margin, recurring revenue business. As India's installed wind fleet grows from 56 GW today toward 122 GW by FY32, the O&M market scales with it automatically. Every turbine that gets commissioned becomes an O&M revenue opportunity.
Also read: Catching the Tailwind of Indian Shipbuilding Growth
What Is Actually Powering This Sector, Beyond the Headlines
There are three kinds of growth drivers in any sector: cyclical tailwinds that come and go with economic conditions, policy-driven tailwinds that exist only as long as the government stays supportive, and structural tailwinds that are driven by economics and demographics and exist regardless of any particular government or budget cycle. India's green energy sector benefits from all three. Understanding which driver is which determines how long-lived the growth opportunity actually is.
Driver 1: The Economics Are Now Irresistible
This is the most important driver and the one most people underestimate. Solar tariffs in India have fallen from over ₹10 per unit in 2010 to sub-₹2.50 per unit in recent auction outcomes, representing a 75% reduction in 15 years. Wind tariffs have followed a similar trajectory. At these prices, utility-scale solar and wind are cheaper to produce than power from new coal plants in India. This is not a government subsidy creating artificial economics; it is a genuine market reality.
When renewable energy is the cheapest option for generations, utilities do not need policy pressure to buy it. They choose it because it saves money.This cost competitiveness is structural and unlikely to reverse meaningfully by a change in government, because it is driven by global manufacturing scale and technological learning curves, not by Indian policy alone.
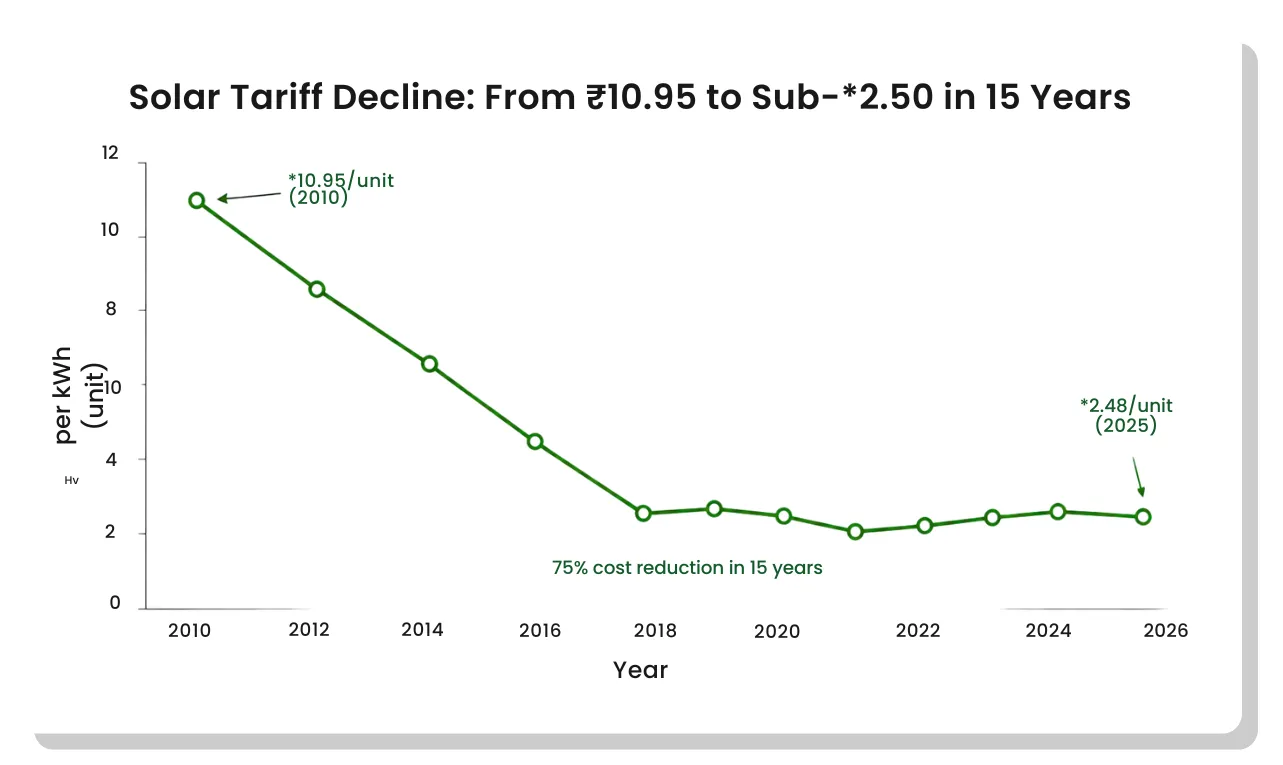
Solar Tariff Decline in India (₹/unit): 75% cost reduction in 15 years has made solar the cheapest new generation source. Sources: MNRE, SECI auction data
Driver 2: Policy That Goes Beyond Subsidies
Three specific policies are near-term, quantifiable catalysts for the sector, not distant aspirations.
PM Surya Ghar: Muft Bijli Yojana
The rooftop solar scheme received an 80% increase in budget allocation to ₹20,000 crore in FY2025-26. From January to December 2025, nearly 14.43 lakh rooftop solar systems were installed under the scheme, benefiting over 18.14 lakh households. This is not just government spending; it is demand creation for solar modules, EPC contractors, and project finance businesses. Tata Power's EPC division recorded revenue of ₹5,392 crore in FY25, with PAT of ₹377 crore.
ALMM: The Manufacturing Moat
The Approved List of Models and Manufacturers (ALMM) policy mandates that government-tendered projects use only ALMM-listed domestic modules and cells. This has significantly reduced dependence on imports in utility-scale projects in the utility-scale market. Module and cell manufacturing capacity crossed 175 GW and 30 GW respectively in 2025. A significant volume of capacity was commissioned ahead of the June 2026 ALMM extension deadline, contributing to FY26's record additions.
VGF for Battery Storage and Offshore Wind
Viability Gap Funding of ₹7,453 crore for offshore wind (India's first 1 GW, off Gujarat and Tamil Nadu), and VGF for standalone battery energy storage systems have unlocked two new frontiers. BESS tariffs hit record lows in a November 2025 auction. Battery storage capacity is projected to jump from 507 MWh in 2025 to 5 GWh in 2026, still small in absolute terms, but the trajectory is the signal.
Driver 3: Demand That Cannot Be Turned Off
Peak electricity demand in India stood at around 250 GW in FY25. According to the Central Electricity Authority's National Electricity Plan, it will reach 296 GW by FY27 and 388 GW by FY32. That growth in less than a decade is driven by three forces largely independent of short-term government policy: India's growing middle class consuming more power, the rapid expansion of data centres driven by AI adoption, and the progressive electrification of transport through EVs.
Hyperscalers including Google, Microsoft, Amazon, and Meta are all expanding aggressively in India. Google has already signed a 61 MW C&I Power Purchase Agreement with Adani Green Energy, which is a long-duration, creditworthy contract that is a developer's dream. Corporate sustainability commitments are driving a surge in C&I PPA activity, with contracts signed directly between corporate buyers and developers, bypassing state DISCOMs. JSW Energy has reported that 95% of its total capacity is contracted under PPAs.
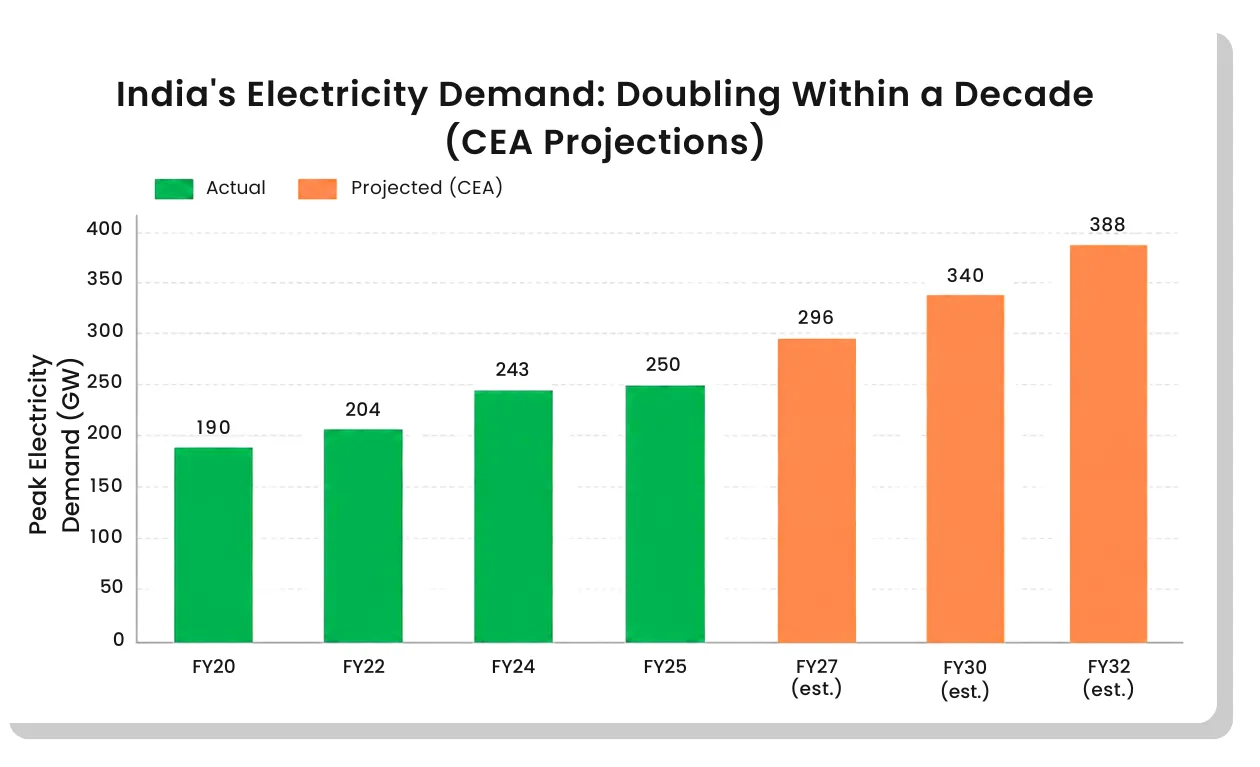
India Peak Electricity Demand: Actual vs. CEA Projections (GW). Doubling in under a decade creates the demand base for 500 GW of renewable capacity.
Who Is Building India's Clean Energy Future, and at What Cost
The table below profiles seven listed companies that collectively represent the full spectrum of India's green energy ecosystem, spanning pure-play developers and integrated utilities to equipment manufacturers and O&M service providers.
| Company | Segment | Op. Capacity (FY25) |
|---|---|---|
| Adani Green Energy (AGEL) | Pure-play RE Developer | 14.2 GW (50 GW target FY30) |
| Tata Power (RE + Mfg) | Integrated Utility + Solar Mfg + EPC | 5.5 GW operational (10.9 GW incl. pipeline) |
| JSW Energy | Integrated (Thermal + RE pivot) | 7.9 GW installed (29.9 GW locked-in) |
| NTPC Green Energy (NGEL) | PSU RE Developer | ~3.3 GW operational (17.3 GW under dev.) |
| Tornt Power | Integrated Utility (RE growing) | 0.83 GW RE (3+ GW pipeline) |
| Inox Green Energy Services | Wind O&M Services | 3.35 GW O&M portfolio |
| Borosil Renewables | Solar Glass Manufacturing | 15 GW equiv. (2,300 TPD) |
*Pure-play developers operate high-margin, long-duration annuity models, while integrated utilities balance renewable expansion with existing thermal or distribution businesses.
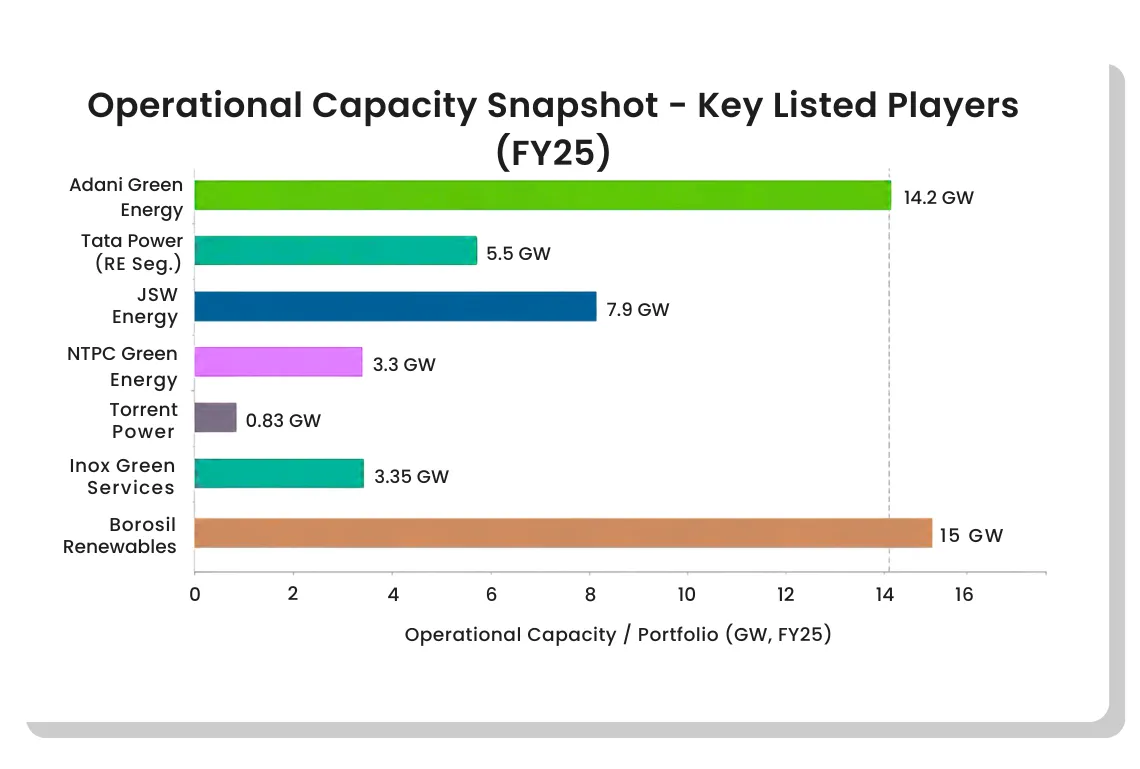
Operational Capacity / Portfolio by Company (GW, FY25): AGEL leads pure-play RE; integrated utilities show smaller RE books within larger businesses. Source: Company AR FY25
Also read: Navigating India's Wastewater Treatment Mega Cycle
The Five Things That Could Break the Story
The risks below are specific to India's green energy sector, with specific financial consequences attached to each one.
Risk 1: DISCOM Financial Stress: Structurally Better, but Not Resolved
India's electricity distribution companies (DISCOMs) carry accumulated losses of approximately ₹6.47 lakh crore. While DISCOMs recorded their first aggregate profit in a decade (₹2,701 crore in FY25, reversing a ₹25,553 crore loss the previous year), this aggregate hides deep state-by-state variations. Punjab, Jharkhand, and parts of Uttar Pradesh remain financially stressed. When DISCOMs delay or default on PPA payments, the developer's cash flow is disrupted, directly affecting interest coverage ratios and equity valuations. Tornt Power's FY25 annual report flags pending regulatory receivables of ₹3,157 crore. AGEL has a massive 5 GW PPA with MSEDCL (Maharashtra). One large DISCOM default can create 12–18 months of earnings uncertainty for any developer with concentrated state exposure.
Risk 2: Grid Evacuation: The Mismatch Between Generation Build-Out and Transmission
In 2025, curtailment rates in high-renewable states including Rajasthan, Gujarat, and Tamil Nadu ran between 10% and 30% due to transmission unavailability. As of September 2025, approximately 44 GW of awarded renewable capacity remained stranded with unsigned PSAs, partly because DISCOMs were reluctant and partly because grid connectivity was uncertain. India's solar and wind commissioning rate has now outpaced its transmission build-out rate. The Budget 2026 allocation of ₹600 crore for the Green Energy Corridor addresses the symptom, not the scale. Until inter-state transmission systems (ISTS) catch up, Plant Load Factors on newly commissioned assets may remain below contracted design levels, which means commissioned capacity does not translate directly into revenue or returns.
Risk 3: Tariff Compression Versus Cost Stability: The IRR Risk in New Projects
Solar tariffs in recent auctions have gone below ₹2.50 per unit. Module manufacturing costs had been falling for years, providing the margin buffer that made these low tariffs workable. But module prices stabilised, and in some cases rose, in late 2024 and into 2025, partly because ALMM compliance costs are a real expense, and partly because global polysilicon prices recovered from historical lows. If developers continue to bid sub-₹2.50 tariffs to win market share while input costs stabilise, the project IRRs locked in today could prove marginal at 8–9% rather than the 12–14% that justifies current valuations. Existing contracted capacity is protected; the risk is in the next wave of project development.
Risk 4: Execution Risk in Greenfield Development at Scale
Adani Green's Khavda site targets 30 GW by 2029. JSW Energy has a 29.9 GW locked-in pipeline. The scale of ambition is extraordinary. But every GW of greenfield capacity requires land, transmission connectivity, equipment, labour, and financing, all of which take time and can be disrupted by weather, regulatory delays, or supply chain issues. Companies reporting 'locked-in' capacity or pipeline figures are describing where they plan to be, not where they are. The gap between announced pipelines and commissioned, revenue-generating assets is where execution risk lives.
Risk 5: Post-ALMM Deadline Uncertainty: FY27 Addition Moderation Risk
A significant share of FY26's record 55.3 GW of renewable additions was driven by developers rushing to commission projects before the June 2026 ALMM cell compliance deadline. JMK Research flagged this in its December 2025 review: post-deadline capacity additions could moderate meaningfully in the near term before stabilising unless the government provides an extension or policy clarity on ALCM timelines. If FY27 additions moderate to 30–35 GW from FY26's record, equipment manufacturers and EPC contractors will see earnings growth compress. This is not a structural setback because the underlying demand is unchanged, but it creates a period of moderation that premium valuations may not have priced in.
Disclaimer: The information provided in our blogs is for informational purposes only and should not be construed as financial, investment, or trading advice. Trading and investing in the securities market carries risk. Always conduct your own research and consult with a qualified financial advisor before making any investment decisions. Past performance is not indicative of future results. Copyrighted and original content for your trading and investing needs.
© 2026 — Tradejini. All Rights Reserved.