


Every futures trader eventually faces the same question near contract expiration or expiry date. Should you roll the futures position or exit it. Futures rollover means that traders close their current month’s futures contracts while opening new ones for the next month to maintain the same market exposure. The decision often gets made late, under pressure, and with partial rollover data.
You glance at the price difference between futures contracts, assume the rollover cost is manageable, and roll the same position into the next month contract by closing the expiring contract and opening a later-dated one. Later, you realise the carry forward cost wiped out a large part of your expected profit. Rollover risk is rarely about direction or market trends. It is about cost, liquidity, timing, and execution during the rollover process. Since futures contracts have a fixed expiration date, traders roll positions to maintain market exposure without facing settlement or physical delivery, but mistimed rollovers can lead to forced liquidation or unexpected settlement.
Also Read: A practical guide to CE PE OI difference
Futures traders miss these risks because rollover data is scattered. One screen shows futures prices for the near month contract and far month. Another shows open interest and volume. Cost calculations are done mentally or on Excel. By the time the full futures rollover analysis is clear, the opportunity has passed and rollover costs have already compounded.
What if futures rollover decisions were visible upfront. What if you could instantly see which futures contracts are expensive to roll, which ones offer rollover gains, and where liquidity, volume, and market sentiment are shifting before the expiration date. All without leaving the trading screen.
This is exactly what Rollover Analysis inside NxtOption is built for. It brings rollover cost, rollover data, open interest, price action, and execution tools into a single view for futures trading. The goal is simple. Help traders decide faster, manage leverage more safely, and avoid rollover mistakes that quietly erode significant profits.
Futures Rollover Analysis in NxtOption: Understanding the rollover process
At its core, Rollover Analysis is a futures rollover analysis and scanning tool for futures contracts approaching contract expiration. A futures rollover is when a trader exits a position in an expiring contract and opens a new position in a later-dated contract to continue holding exposure. Rollovers only apply to futures contracts and do not occur in options.
The tool shows how costly or beneficial it is to roll positions from the current month contract to the further out month contract using live rollover data. Rollover data shows how many futures contracts are being carried forward from the current expiry month to the next, helping traders understand participation and conviction.
Also Read: A practical guide to the NxtOption Positions screen
The key capabilities that allow you to view Futures Contracts and rollover cost at a glance
Rollover Cost Visibility
You see rollover cost both in points and percentage. Rollover costs vary depending on the price difference between the current and next series contracts. In a contango market, rolling over a long position incurs a negative roll yield. In backwardation, rolling forward can generate a positive roll yield. The cost of carry includes interest, dividends, and other holding costs reflected in this price difference.
Liquidity Assessment
Open interest and open interest change help determine participation, liquidity quality, and execution risk. Changes in open interest during a rollover signal market interest. Rising open interest indicates strong participation, while falling open interest suggests waning conviction among traders.
Also Read: Precision Index Trading With One Tap Execution
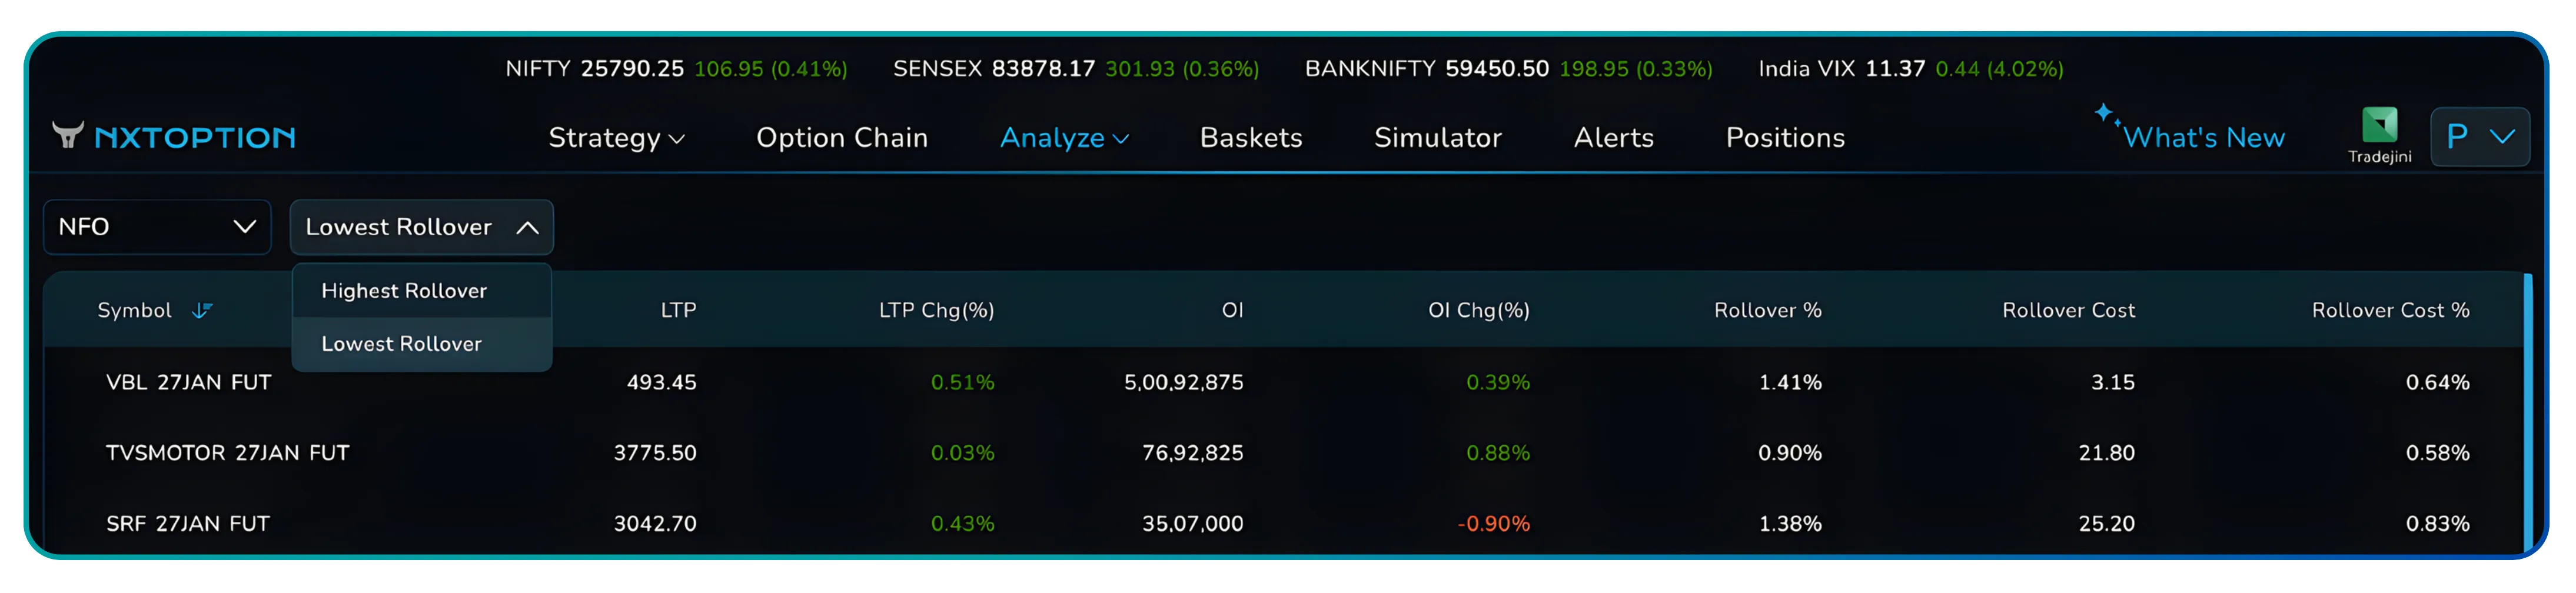
Smart Sorting and Filtering
Sort instantly by highest rollover or lowest rollover. A higher-than-average rollover percentage generally indicates strong conviction that the current market trend will continue. Low rollovers may signal uncertainty or declining confidence as traders choose not to carry positions forward.
Integrated Trade Actions
From the same row, traders can place orders, open charts, view volatility, build a trading strategy, or set alerts. This reduces slippage and brokerage-related friction that can occur when rolling over futures contracts manually.
Segment Coverage
Supports NFO stock futures and BFO index futures, covering stocks, indices, and broader futures trading activity in one interface.
The advantage is speed with clarity. Traders spend less time calculating rollover costs and more time managing risk, liquidity, and exposure.
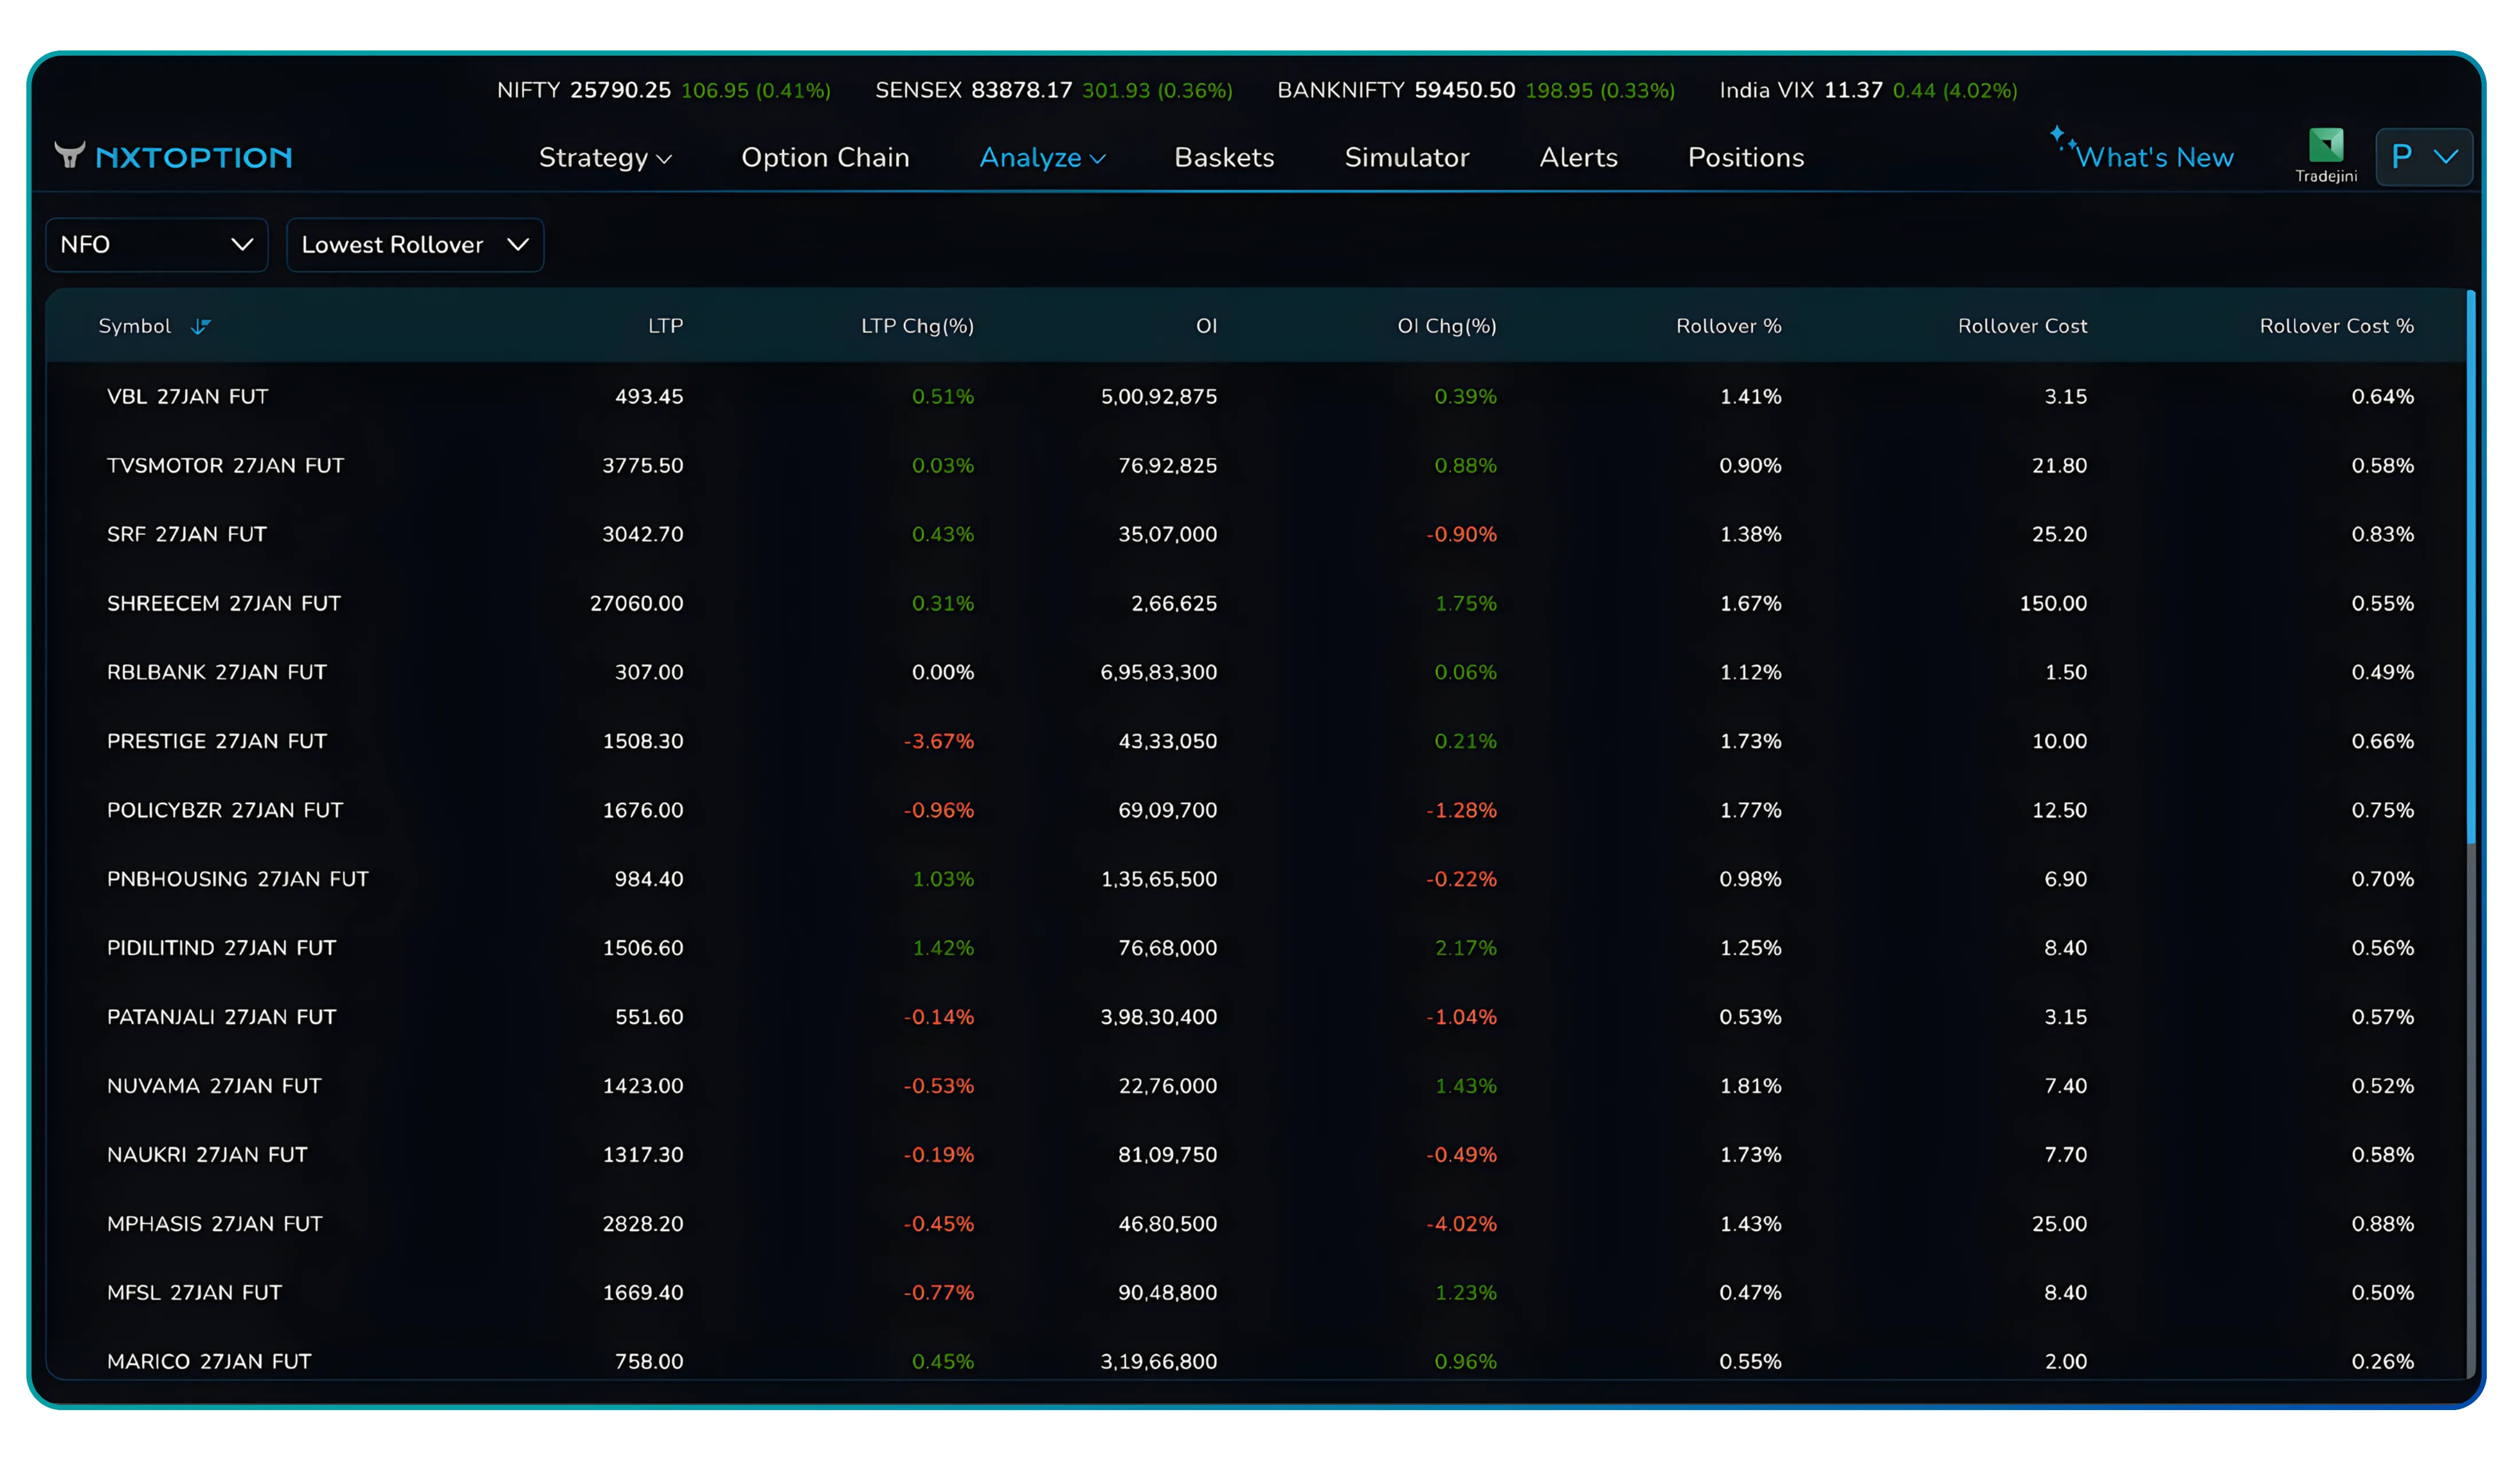
Understanding the Futures Contracts Rollover Analysis screen in detail
Futures Position selection and sorting controls
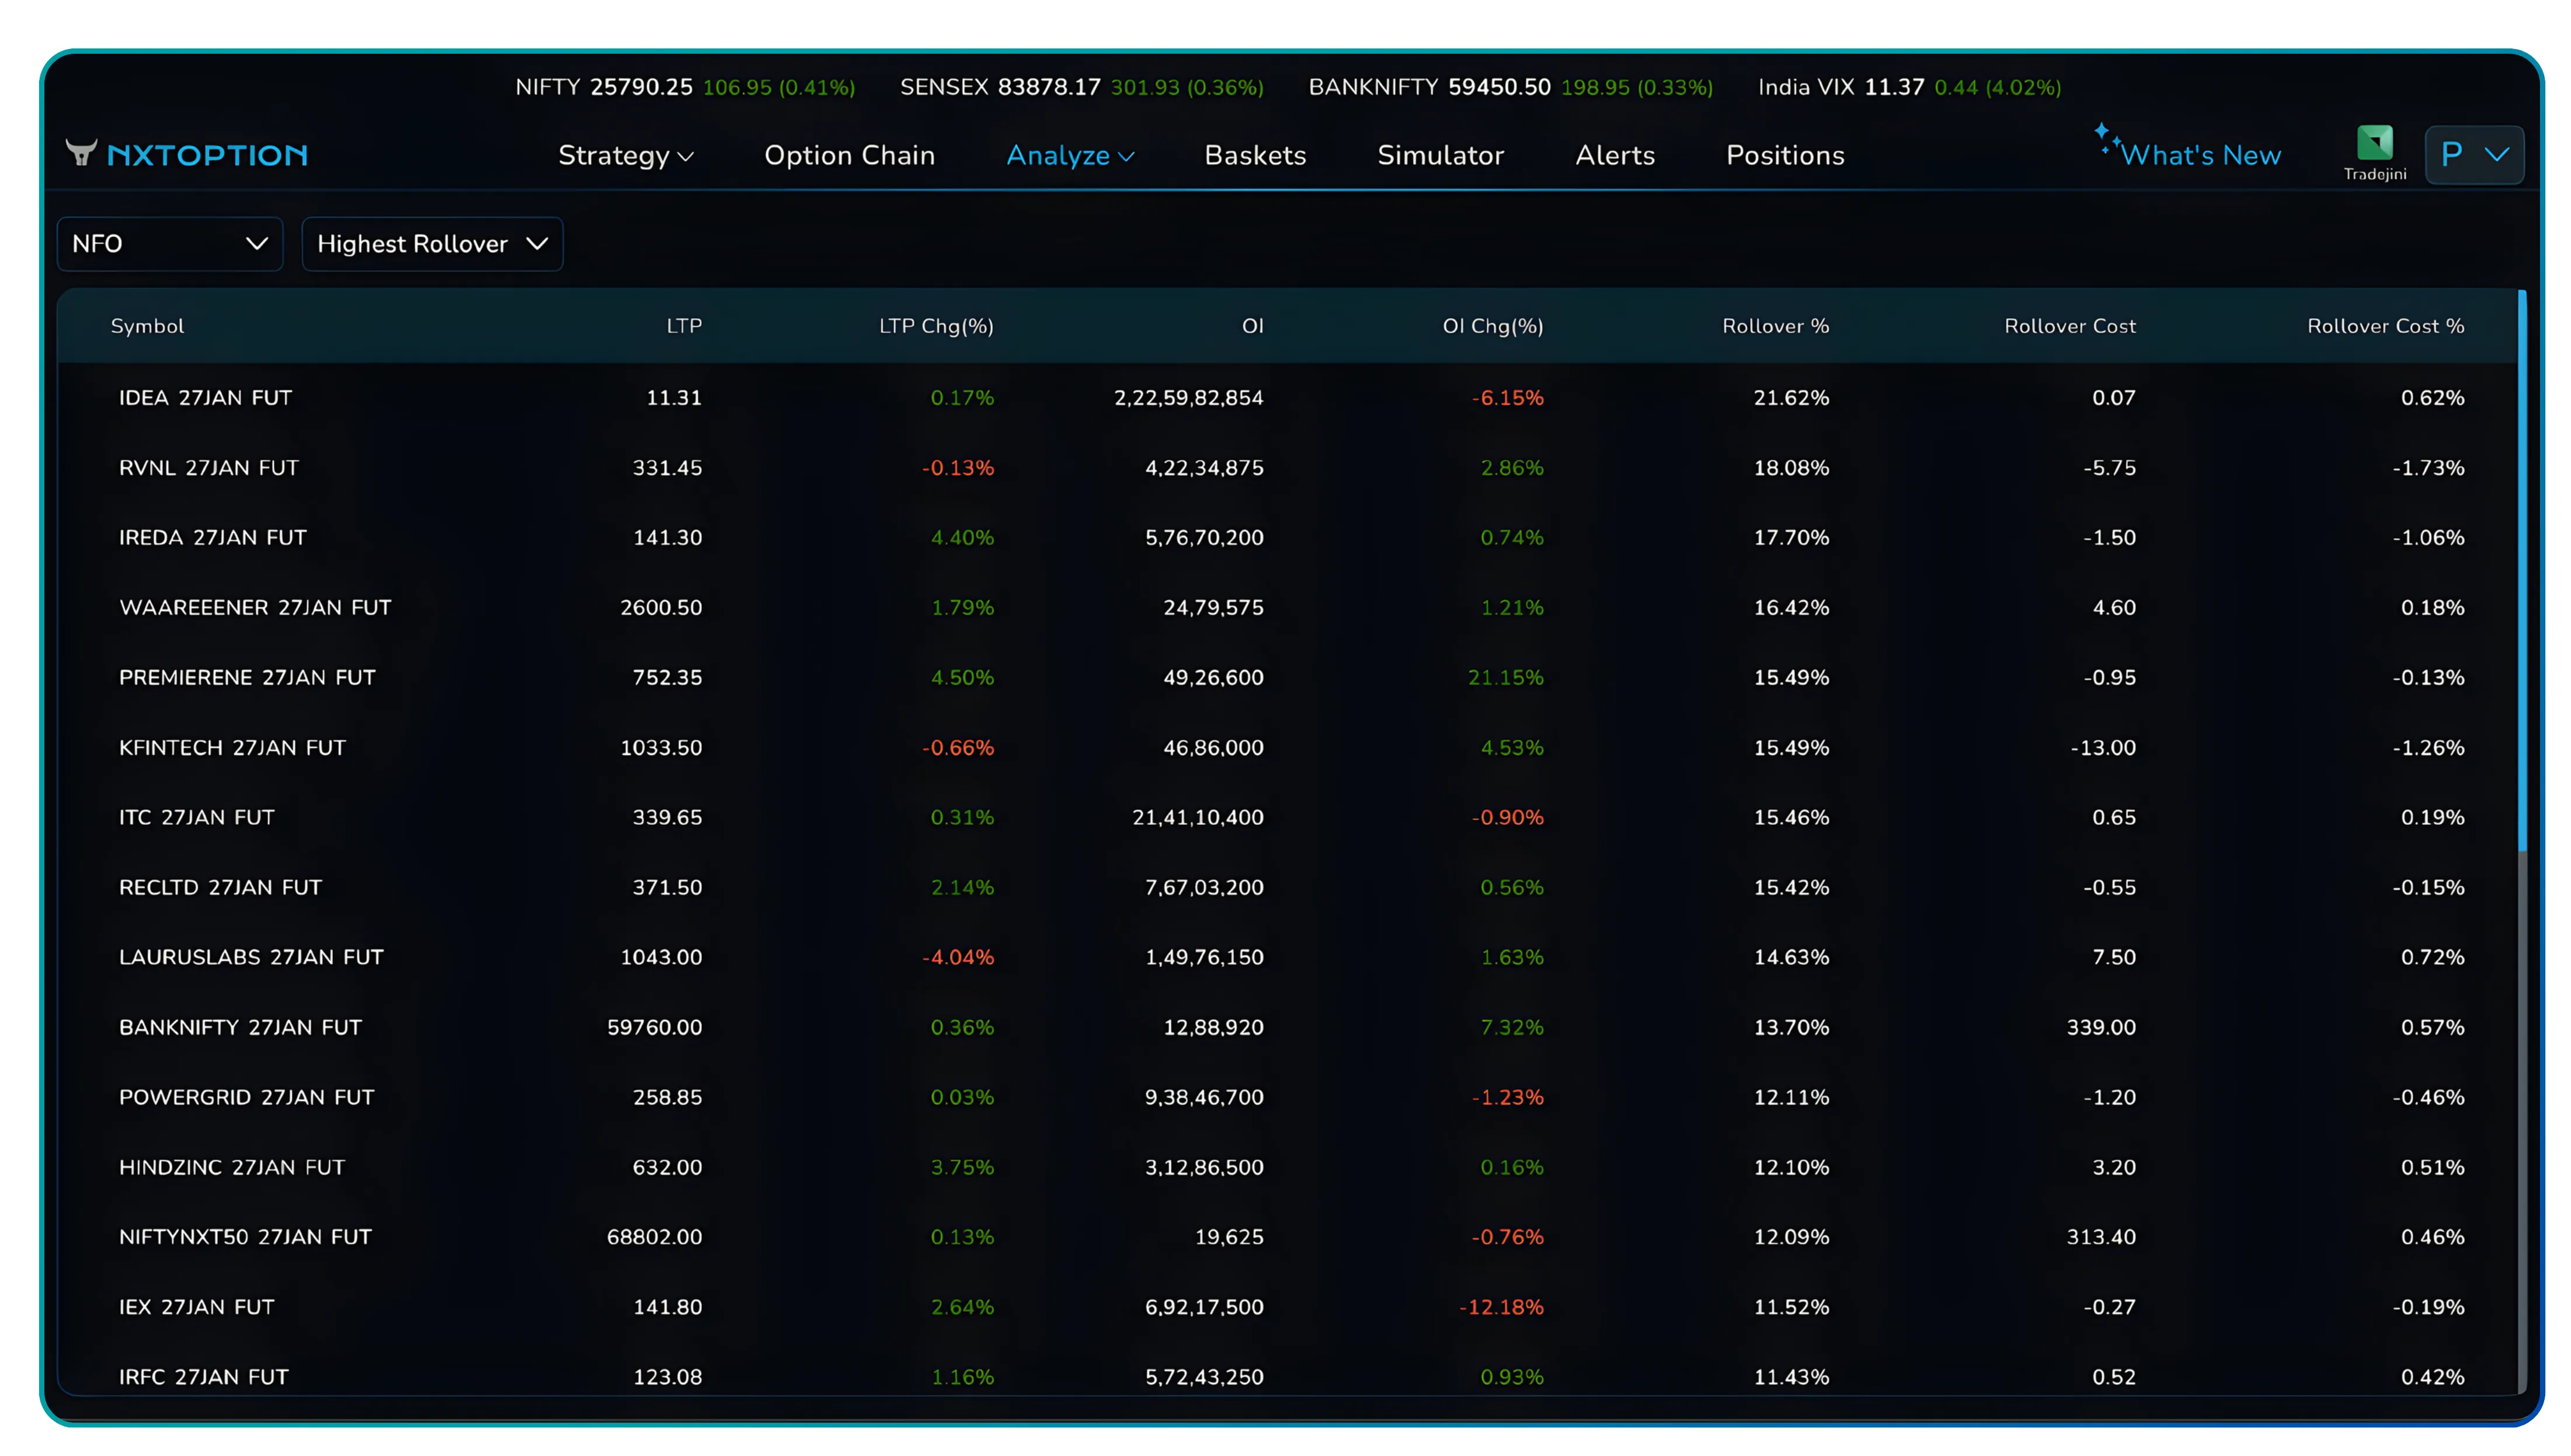
At the top-left, the Instrument Selection Dropdown lets traders switch between NFO and BFO futures contracts. The table updates instantly. NFO displays stock futures such as IDEA or RVNL. BFO limits the view to index futures like SENSEX and BANKEX.
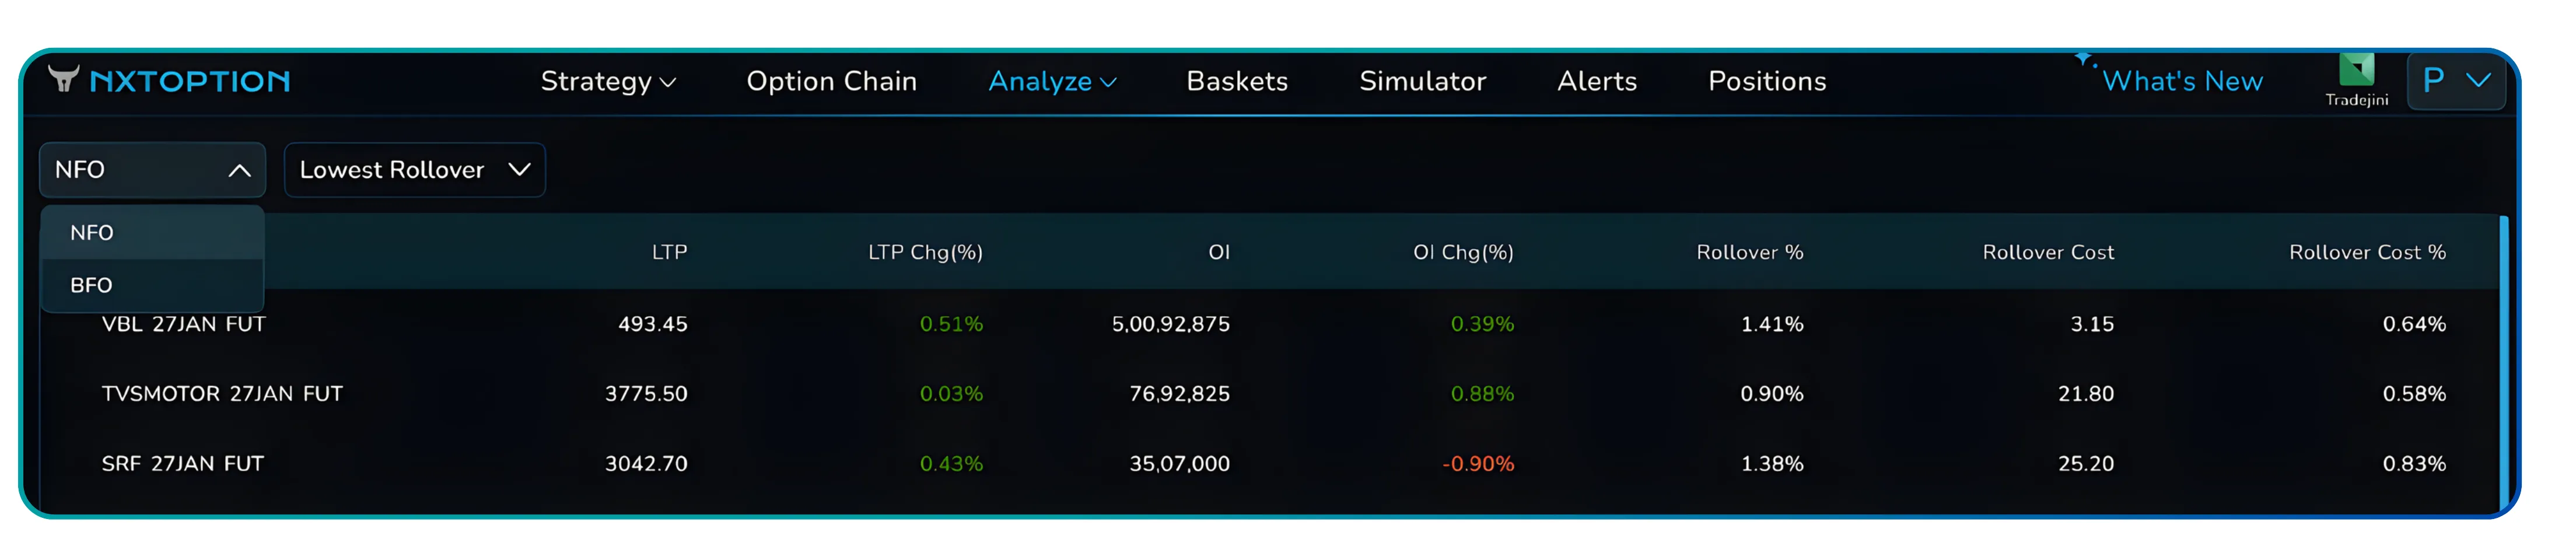
Besides the same, the Sorting Dropdown offers two views. Highest Rollover and Lowest Rollover. This quickly surfaces contracts where rollover percentages suggest strong sentiment or where low rollover levels indicate uncertainty ahead of expiry. Traders can also click any column header to sort manually by price action, open interest, or rollover data.
Rollover Data and Open Interest. Core metrics explained
The table is the heart of the futures rollover analysis feature. Each column serves a specific purpose.
| Metric | What it shows | Why it matters |
|---|---|---|
| Symbol | Futures contract identifier | Confirms underlying asset and expiry |
| LTP | Last traded price | Current market level |
| LTP Chg (%) | Price change vs spot | Directional bias |
| OI | Open interest | Liquidity and participation |
| OI Chg (%) | Change in open interest | New positions or exits |
| Rollover % | Cost or benefit of rolling | Market sentiment indicator |
| Rollover Cost | Cost in points | Actual carry impact |
| Rollover Cost % | Normalised cost | Cross-contract comparison |
High rollover percentages often indicate continued interest in the current market trend. Low rollover percentages may reflect declining trader confidence or uncertainty around future price direction. Rollover percentages are best interpreted relative to historical data, rather than in isolation.
Row-level action buttons and workflow
Hovering over any row reveals quick action icons designed for active futures traders.
- Buy (B) and Sell (S) open the order pad with the selected futures contract pre-filled.
- Strategy Builder loads the futures position for multi-leg planning.
- IV Charts provide volatility context before rolling.
- Price Alerts allow rule-based monitoring near expiry.
- TradingView Chart opens technical analysis instantly.
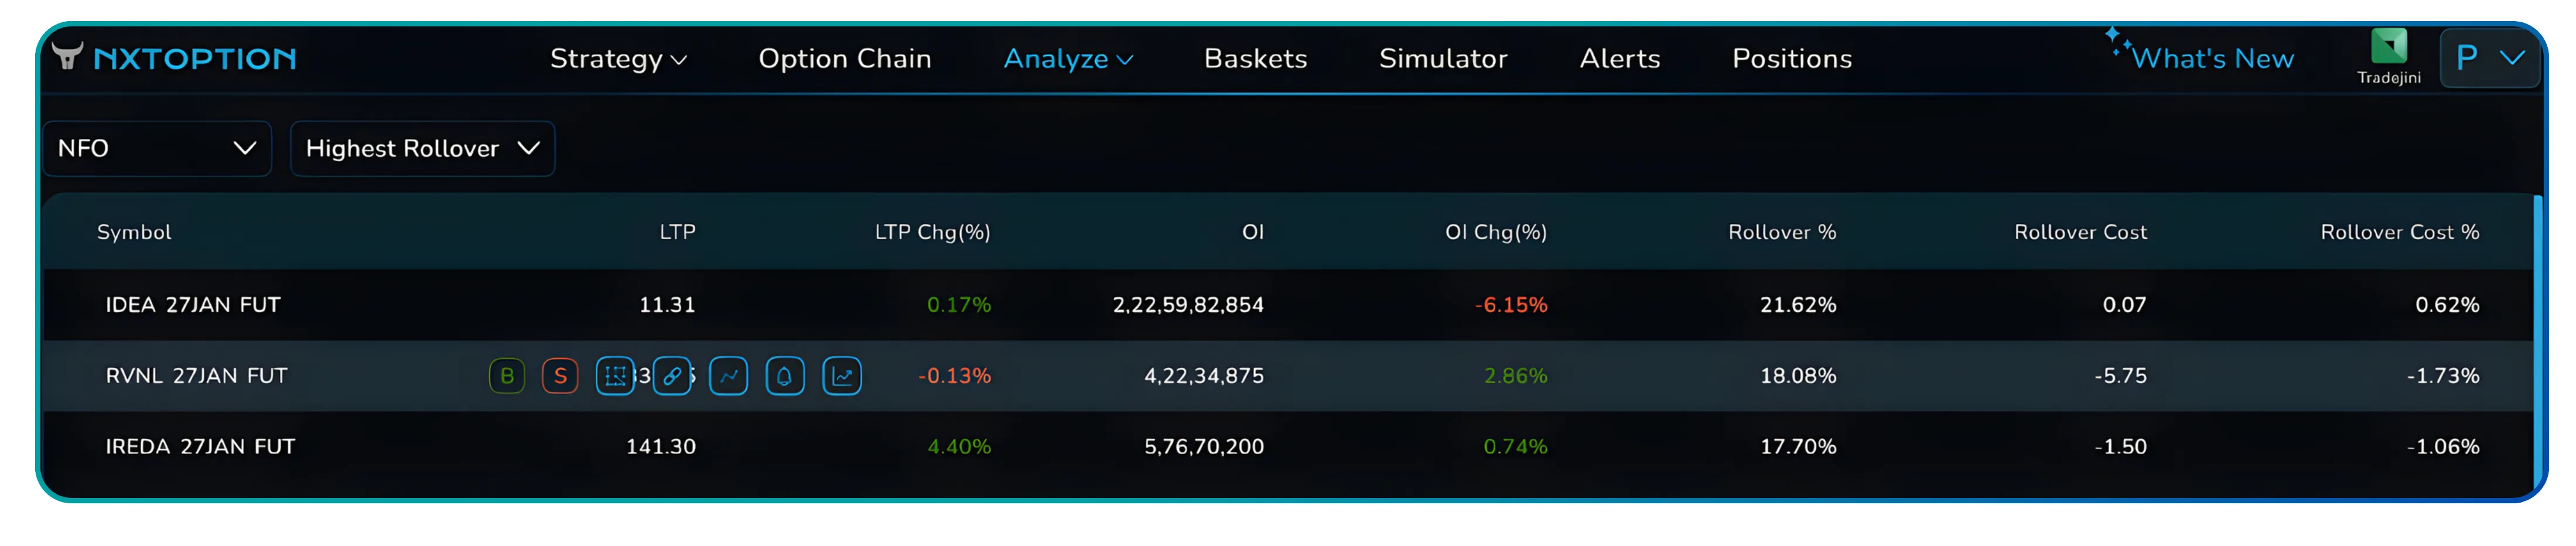
This integrated workflow helps traders manage rollovers efficiently while minimizing slippage, execution delays, and operational errors.
Also Read: How Traders Can Use Straddle charts in NxtOption with VWAP
How rollovers happen and how futures traders actually use this data
Rollover metrics do not stand alone. They work best when viewed alongside price action, volume, and open interest.
High rollovers with rising open interest often indicate bullish conviction that the current trend will continue into the next contract month. Low rollovers combined with falling open interest suggest uncertainty or position unwinding as traders reduce exposure.
Traders typically monitor shifts in volume and open interest as liquidity moves from the front month to the next active month. Liquidity is critical. As expiration approaches, volume dries up in the current contract while the next contract gains activity. Rollover analysis helps traders identify the optimal window to roll over, ensuring better liquidity and reducing execution risk.
Accessing the Futures Rollover Analysis feature
- Getting to the tool is straightforward.
- Log in to your Tradejini CubePlus account.
- Navigate to NxtOption from the main menu.
- Open the Analysis section.
- Select Rollover Analysis.
The interface loads instantly with live futures rollover data. Traders must manually close and reopen positions when rolling over futures contracts. There is no automatic rollover. Most rollover activity typically begins several days before expiry and is completed by the close of trading on the expiry day.
Futures Trading takeaway. Why this rollover analysis belongs in your workflow
Rollover Analysis addresses a persistent risk in futures trading. It removes guesswork from the rollover process.
Cost clarity. Traders see rollover costs, cost of carry, and spreads before committing capital. Liquidity awareness. Open interest and volume data help avoid poor execution near expiry. Better timing. Rollover percentages help gauge market sentiment and momentum continuity. Lower risk. Clear visibility reduces leverage-related losses and settlement surprises.
This feature is not about predicting price direction. It is about visibility and control. When rollover economics, liquidity, and sentiment are clear, traders make calmer, more disciplined decisions.
Open NxtOption, access Rollover Analysis, and review your futures positions before the next expiry cycle. Small rollover costs compound fast. Catch them early.
Also Read: Understanding OI Breakdown in trading using NxtOption
Disclaimer: The information provided in our blogs is for informational purposes only and should not be construed as financial, investment, or trading advice. Trading and investing in the securities market carries risk. Always conduct your own research and consult with a qualified financial advisor before making any investment decisions. Past performance is not indicative of future results. Copyrighted and original content for your trading and investing needs.
© 2026 — Tradejini. All Rights Reserved.