


The Chande Kroll Stop indicator is a volatility-based trailing stop designed to help traders manage risk and trail profits in trending markets. It belongs to the category of trend-following indicators used in Tushar Chande technical analysis and functions as a lagging tool, meaning it responds to price action rather than predicting future movement. In practical trading terms, this lag is intentional and beneficial, because the indicator is meant to confirm when a trend has structurally weakened rather than anticipate reversals prematurely.
At its core, the Chande Kroll Stop focuses on one essential problem faced by traders across all timeframes. How much price movement should be tolerated before a trade idea is considered invalid. Traditional stop-loss techniques rely on fixed point values or percentages that remain static regardless of changing market conditions. The Chande Kroll Stop replaces this rigidity with a dynamic ATR trailing stop-loss strategy that adjusts stop levels based on actual market volatility.
The indicator was developed by Tushar Chande, who is also known for creating momentum and trend-measuring tools such as the Aroon indicator and the Chande Momentum Oscillator. In line with his broader work in Tushar Chande technical analysis, the Chande Kroll Stop is grounded in the idea that markets breathe. Volatility expands during participation-driven moves and contracts during periods of uncertainty or balance. A stop-loss system that ignores this behaviour inevitably conflicts with price.
Visually, the Chande Kroll Stop plots two adaptive stop lines on the chart, one intended to manage long positions and the other to manage short positions. Price interaction with these lines provides immediate structural context for risk management for options trading and directional trades alike. Sustained price action on one side of the stop framework suggests trend continuation, while decisive breaches indicate that volatility and structure have shifted enough to warrant exiting the trade. The indicator works best in trending markets and is less effective during narrow, range-bound conditions where price frequently oscillates without commitment.
Component Breakdown With Specifics
The Chande Kroll Stop is constructed from a combination of price structure and volatility measurement. The table below outlines the core components, their calculation logic, commonly used values, and practical interpretation within a volatility-based trailing stop framework.
| Component | Calculation / Logic | Typical Values | Interpretation |
|---|---|---|---|
| Lookback Period | Highest high and lowest low over a defined period | 20 periods commonly used | Establishes recent price extremes that anchor the stop framework |
| ATR Period | Average True Range calculation | 10 or 14 periods | Measures current market volatility |
| ATR Multiplier | ATR multiplied by a fixed factor | 1.5 to 3 times ATR | Controls how tight or loose the trailing stop is |
| Long Stop Line | Lowest low plus ATR-based buffer | Dynamic | Trailing stop for long positions |
| Short Stop Line | Highest high minus ATR-based buffer | Dynamic | Trailing stop for short positions |
Also Read: A Deep Dive into Trading Chart Terminal
Visual Identification Guide
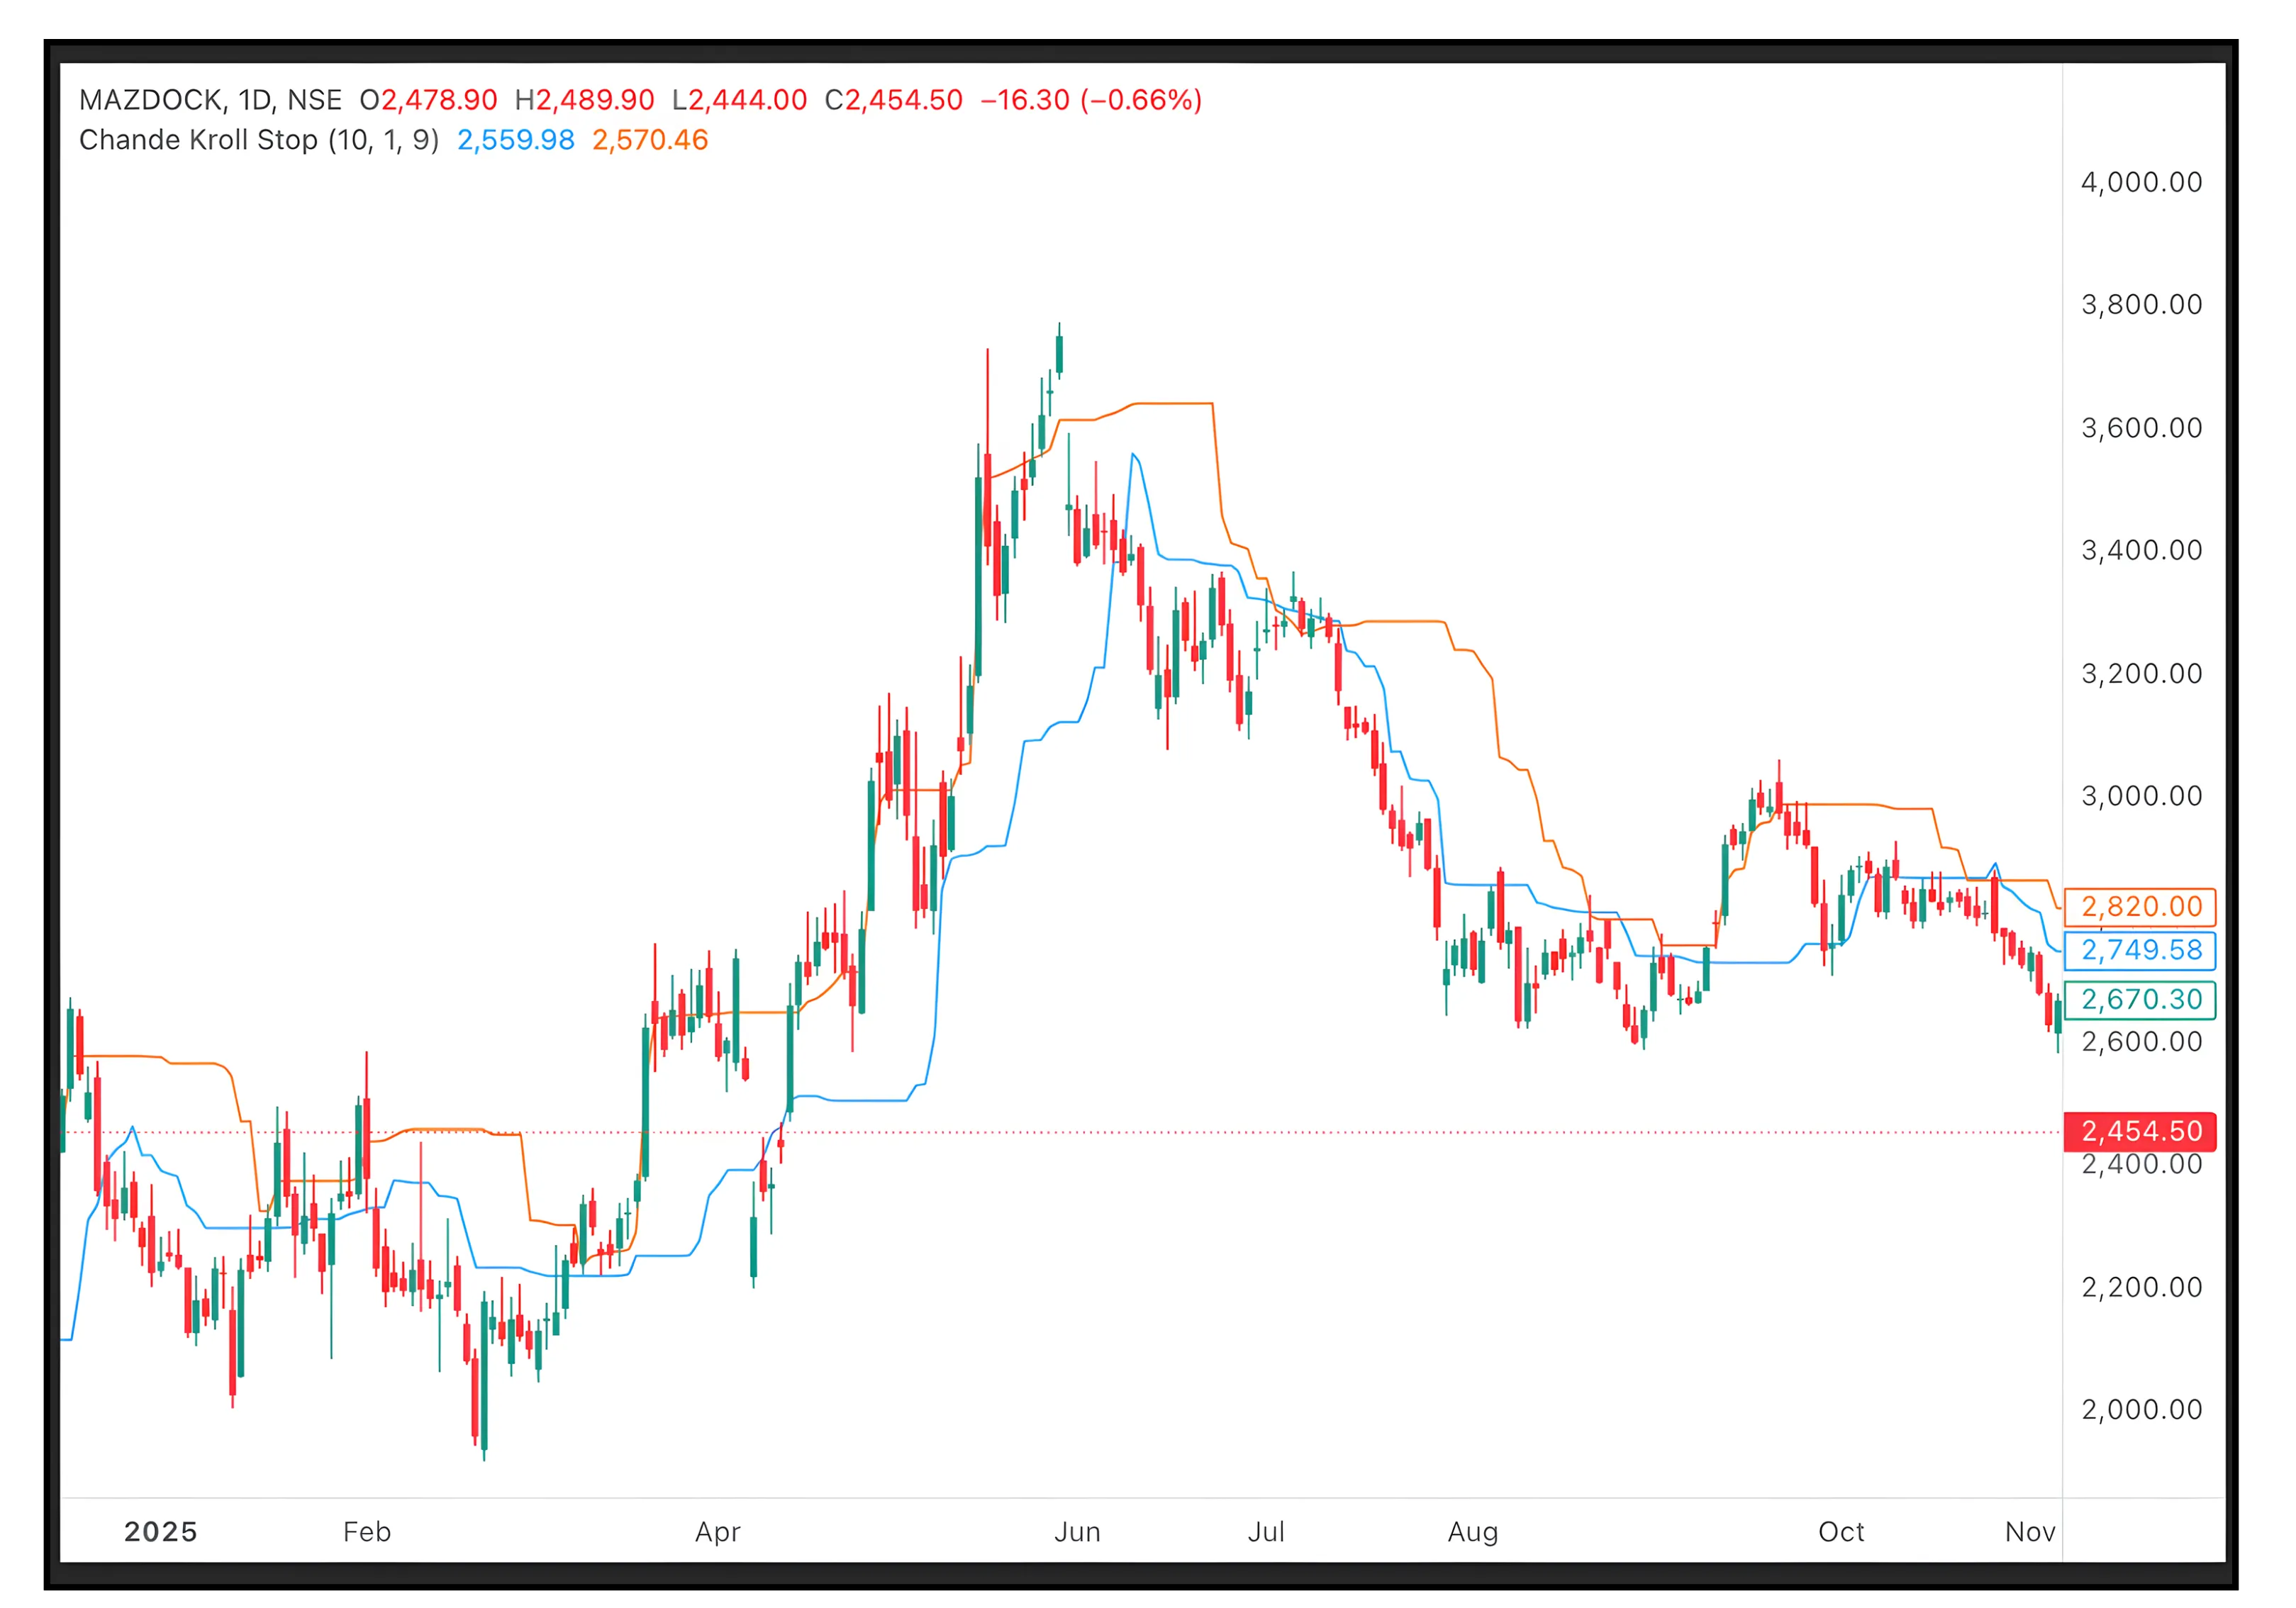
When reading the Chande Kroll Stop on a live chart, the focus should always be on how the stop lines behave relative to price rather than on isolated crossovers. The MAZDOCK daily chart from early 2025 through October provides a clear illustration of this behaviour across multiple market phases.
During the strong advance from April through June, the blue stop line can be seen rising steadily beneath the price action. Despite several pullbacks and periods of short-term consolidation, the stop never tightened aggressively toward price. Instead, it adjusted gradually higher in response to expanding volatility, signalling that the broader upward structure remained intact. This visual behaviour highlights one of the core strengths of the indicator for trend-following indicators India use cases. Normal corrections and profit-taking moves did not result in structural invalidation, allowing price to fluctuate without forcing premature exits.
As the trend matured and eventually transitioned into a prolonged decline from June through September, the stop framework adapted smoothly. The orange stop line began tracking price from above, maintaining a consistent distance that reflected prevailing volatility. Counter-trend rebounds were allowed to play out without immediately breaching the stop, indicating that these moves were corrective rather than structurally meaningful. Throughout this phase, the stop line slope and spacing conveyed more information than any single candle interaction.
Also Read: A practical guide to CE PE OI difference
Across both phases, the key visual cue is consistency. When the stop line slopes clearly and maintains separation from price, the dominant structure remains intact. When the stop line flattens and price begins oscillating closer to it, momentum is weakening and the market is transitioning into balance. The MAZDOCK chart demonstrates how the Chande Kroll Stop visually distinguishes between trend persistence and noise, making it a practical tool for interpreting structure rather than reacting to short-term price fluctuations.
Comparative Analysis. Chande Kroll Stop vs Similar Tools
Chande Kroll Stop is often compared with other volatility-based trailing stop mechanisms. The table below highlights how it differs from commonly used alternatives.
| Feature | Chande Kroll Stop | SuperTrend | ATR Trailing Stop |
|---|---|---|---|
| Structural Anchor | Highs and lows over lookback period | ATR with trend factor | Entry-based ATR |
| Volatility Adaptation | High | High | Moderate |
| Context Awareness | Dual stop framework | Single trend line | Single stop level |
| Whipsaw Sensitivity | Moderate | High in ranges | Depends on settings |
| Primary Role | Risk management and trailing | Trend direction and stop | Pure risk control |
The key distinction lies in context. Chande Kroll Stop provides a broader structural view by plotting both long and short stop zones simultaneously, which helps traders identify transition phases more clearly. Other tools often compress this information into a single line, which can obscure periods of indecision.
Also Read: SEBI Overhaul Brings More Transparent Fees
Market Psychology and Context
Understanding why the Chande Kroll Stop works requires understanding how different market participants behave during trends. Strong directional moves are typically driven by institutional participation, where positions are accumulated and distributed over time rather than entered and exited at exact price levels. These participants allow for volatility as long as the broader structure remains intact.
During consolidations, the stop framework flattens because neither buyers nor sellers have enough conviction to push price meaningfully. This reflects a genuine balance in supply and demand rather than a hidden directional signal. When price eventually breaks beyond the stop framework with volatility expansion, it often triggers a chain reaction of exits and entries as market participants reassess risk.
The indicator works not because it predicts future price, but because it reacts systematically when the underlying structure that supported the trade no longer exists. This reaction-based design makes it particularly effective for protecting accumulated profits while avoiding emotional decision-making.
Also Read: Understanding Heikin Ashi Candles for Trend Trading
Practical Trading Application. Quick Recap
In bullish market contexts, the Chande Kroll Stop is used to trail long positions as long as price sustains above the relevant stop line and the stop continues to rise in line with volatility. The ideal environment is a trending market with stable or expanding volatility and confirmation from broader trend and momentum tools.
The indicator is most effective when treated as a trade management framework rather than an entry trigger. Entries should be derived from price action, trend structure, or other indicators, while the Chande Kroll Stop defines when the original trade thesis has been invalidated.
Interpreting Entry and Exit Behaviour Using Chande Kroll Stop
Although the Chande Kroll Stop is primarily designed as a risk management and trailing framework, it can also assist in identifying structural entry and exit zones when interpreted correctly. Rather than treating every stop interaction as a trade signal, the focus should be on how price behaves around the stop lines after periods of consolidation or trend exhaustion.
A common entry framework emerges when price transitions from a prolonged consolidation or corrective phase and establishes itself decisively above the blue stop line. This behaviour reflects a shift in volatility and structure rather than a simple crossover. The emphasis should always be on candle closes and follow-through, as brief intraday moves through the stop line are frequent and often unreliable.
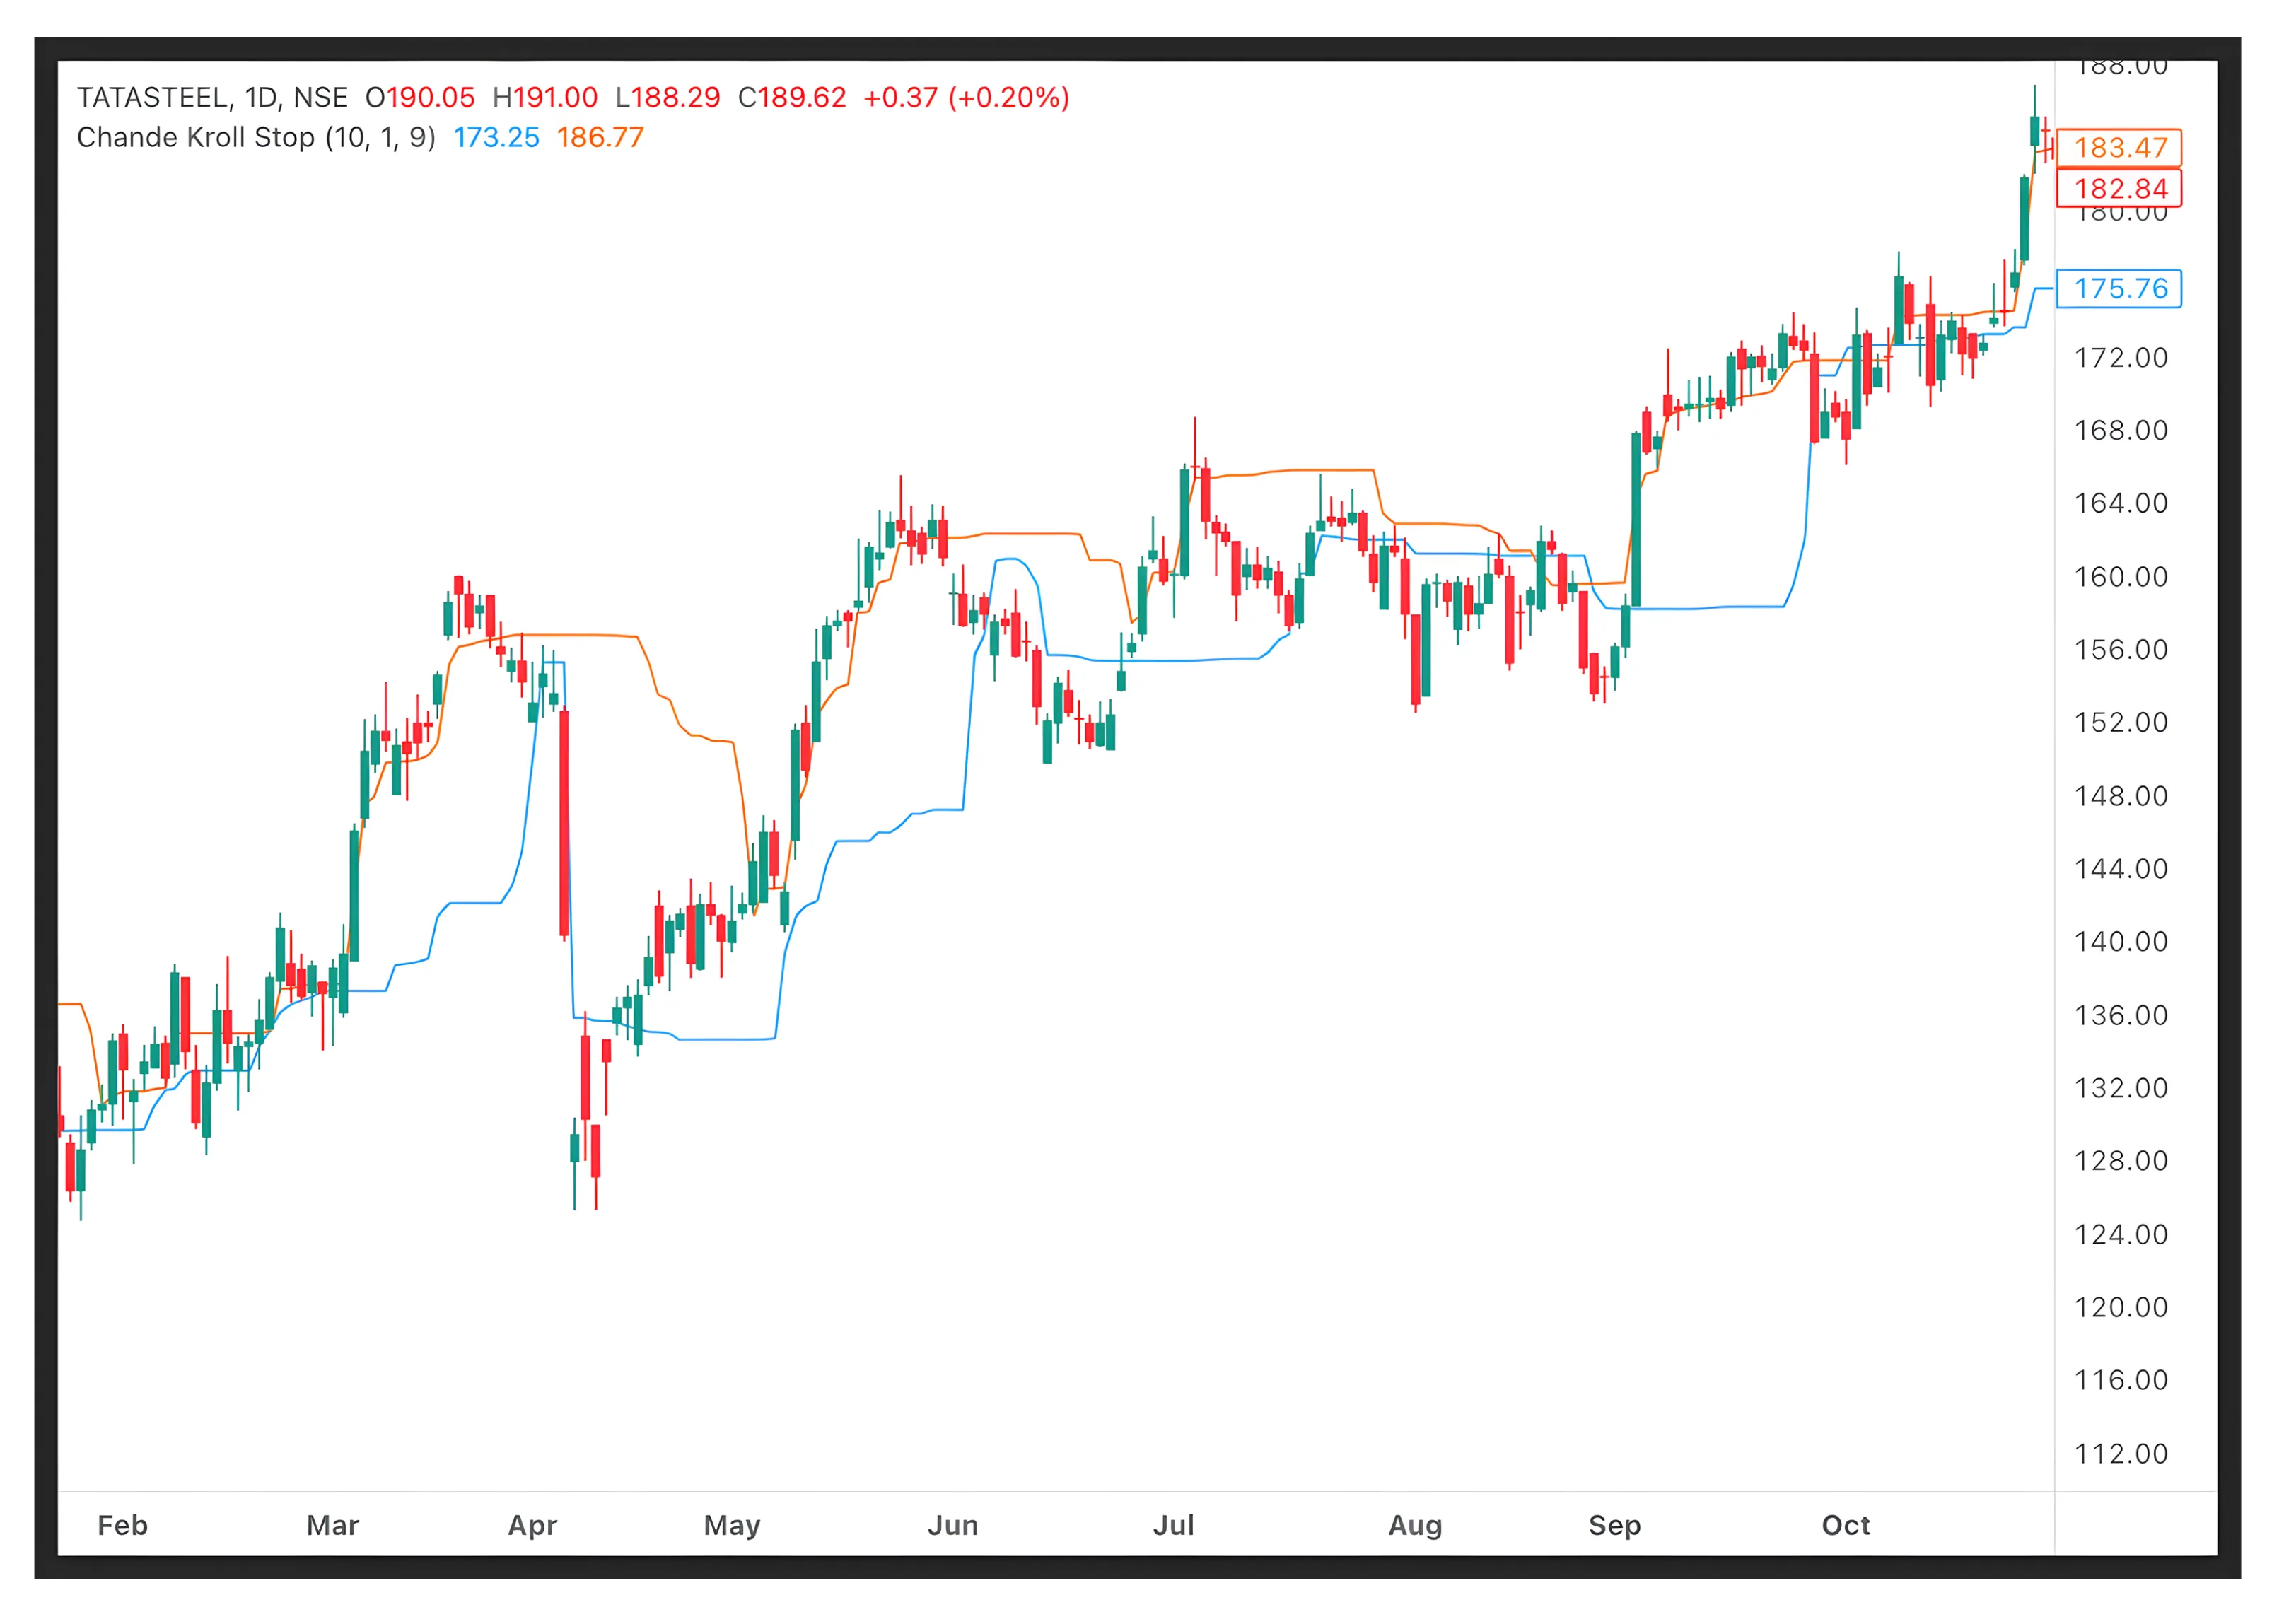
The TATA Steel daily chart provides a useful historical illustration of this behaviour in a moderately ranged environment. For much of the observed period, price oscillated within a broad band while the Chande Kroll Stop lines adjusted gradually to changing volatility conditions. During phases where upward momentum strengthened, the blue stop line rose steadily beneath price, reflecting improving structure rather than signalling immediate acceleration.
As the rally progressed and price moved into consolidation phases, the blue stop line began to flatten. This flattening did not indicate a reversal by itself, but it served as an early visual cue that momentum was no longer expanding. In several instances, price continued to trade above the stop despite sideways movement, demonstrating how the indicator prioritises structural integrity over short-term fluctuations.
Also Read: Exploring the Financials Dashboard on CubePlus
From a trade management perspective, this historical behaviour highlights how the Chande Kroll Stop balances protection with flexibility. As trends develop, stop levels are progressively raised, securing a growing portion of the move while still allowing room for normal retracements. This characteristic makes the indicator particularly effective for managing open positions during extended trends, without forcing exits during routine consolidation phases.
Combining the Chande Kroll Stop with Other Technical Tools
While the Chande Kroll Stop functions effectively as a standalone risk and structure framework, its reliability improves when interpreted alongside complementary technical tools. Trend-based indicators such as moving averages or ADX provide context for stop behaviour by clarifying whether volatility-adjusted structure aligns with the broader trend. When stop lines trail price in the direction of a well-established trend, the indicator’s signals carry more structural significance than when they appear against weakening or sideways conditions.
Momentum indicators such as RSI or MACD help assess whether changes in stop behaviour are supported by internal strength. When volatility-adjusted structure improves alongside stabilising or expanding momentum, it suggests that price movement is being supported rather than exhausted. In contrast, stop interactions that occur while momentum is diverging or fading often reflect temporary volatility rather than a durable structural shift.
Volume adds an additional layer of validation. Stop adjustments that occur during periods of rising participation are typically more meaningful than those formed in low-volume environments. Used together, trend context, momentum behaviour, and volume confirmation help ensure that the Chande Kroll Stop is applied as a confirmation and risk management for options trading tool rather than a standalone decision trigger.
Market Context, Risk Discipline, and Strategic Use
The Chande Kroll Stop performs best when traders recognise the market environment in which it is being applied. In sustained trending phases, where volatility expands and price structure remains directional, the indicator helps maintain alignment with the dominant move while filtering out routine pullbacks. During consolidation or range-bound phases, the stop lines often flatten and price oscillates closer to them, reflecting genuine balance rather than opportunity. In such conditions, the indicator provides less directional clarity and instead acts as a signal to reduce exposure, tighten risk assumptions, or wait for clearer structural development.
From a risk management perspective, the primary strength of the Chande Kroll Stop lies in its mechanical nature. By trailing price based on volatility rather than discretion, it removes much of the emotional decision-making associated with holding winning positions. Traders are not required to guess when to tighten stops or lock in profits. The market dictates those adjustments through changing volatility. When integrated thoughtfully into a broader framework, the indicator serves as a stabilising force, helping traders remain disciplined during both favourable and unfavourable phases of a trade.
Also Read: When Financial Decisions Are About More Than Money
Strategic Summary. The Role of Chande Kroll Stop in Trading
The Chande Kroll Stop is best understood as a structural risk-management tool rather than a directional signal generator. Its value lies in defining where price structure remains valid once volatility is accounted for, allowing traders to stay aligned with sustained trends while avoiding emotionally driven exits. By anchoring stop levels to both recent price extremes and volatility, it adapts naturally to changing market conditions without relying on fixed assumptions.
When used as part of a broader technical framework that includes trend context, momentum confirmation, and volume analysis, the Chande Kroll Stop becomes a practical and disciplined way to manage open positions. It does not attempt to predict market turning points. Instead, it responds objectively when the underlying structure that supported a trade begins to deteriorate. This makes it particularly useful for traders who prioritise consistency, risk control, and longevity over short-term precision.
The Chande Kroll Stop, along with a wide range of trend, momentum, and volatility indicators, is readily available on CubePlus, Tradejini’s advanced trading and analysis platform. CubePlus allows traders to apply these tools directly on live charts across multiple instruments and timeframes, making it easier to focus on structure, confirmation, and disciplined risk management within a single integrated environment.
Technical Specifications
| Specification | Recommendation | Notes |
|---|---|---|
| Ideal Timeframes | Daily and Weekly | Reduces noise and false signals |
| Intraday Use | Conditional | Requires lower ATR periods and multipliers |
| Positional Use | Yes | Default settings are effective |
| Volume Consideration | Important | Confirms structural validity |
| Best Market Conditions | Trending with clear volatility | Indicator performs best |
| Worst Market Conditions | Tight, range-bound markets | High whipsaw risk |
Disclaimer: The information provided in our blogs is for informational purposes only and should not be construed as financial, investment, or trading advice. Trading and investing in the securities market carries risk. Always conduct your own research and consult with a qualified financial advisor before making any investment decisions. Past performance is not indicative of future results. Copyrighted and original content for your trading and investing needs.
© 2026 — Tradejini. All Rights Reserved.


