


Understanding percentage gain is the first step to evaluating any investment. This simple yet powerful metric reveals your returns in clear, comparable terms, whether you're tracking a single stock or a full portfolio. Mastering it unlocks deeper insights like absolute return, relative performance, and long-term growth through CAGR. It also helps in evaluating portfolio health, profitability, and performance, allowing investors to make better decisions on allocation, diversification, and exposure to volatility.
Percentage gain measures how much your investment has grown, expressed as a percentage of the original amount you invested. It helps you understand the return on your investment relative to its starting value.
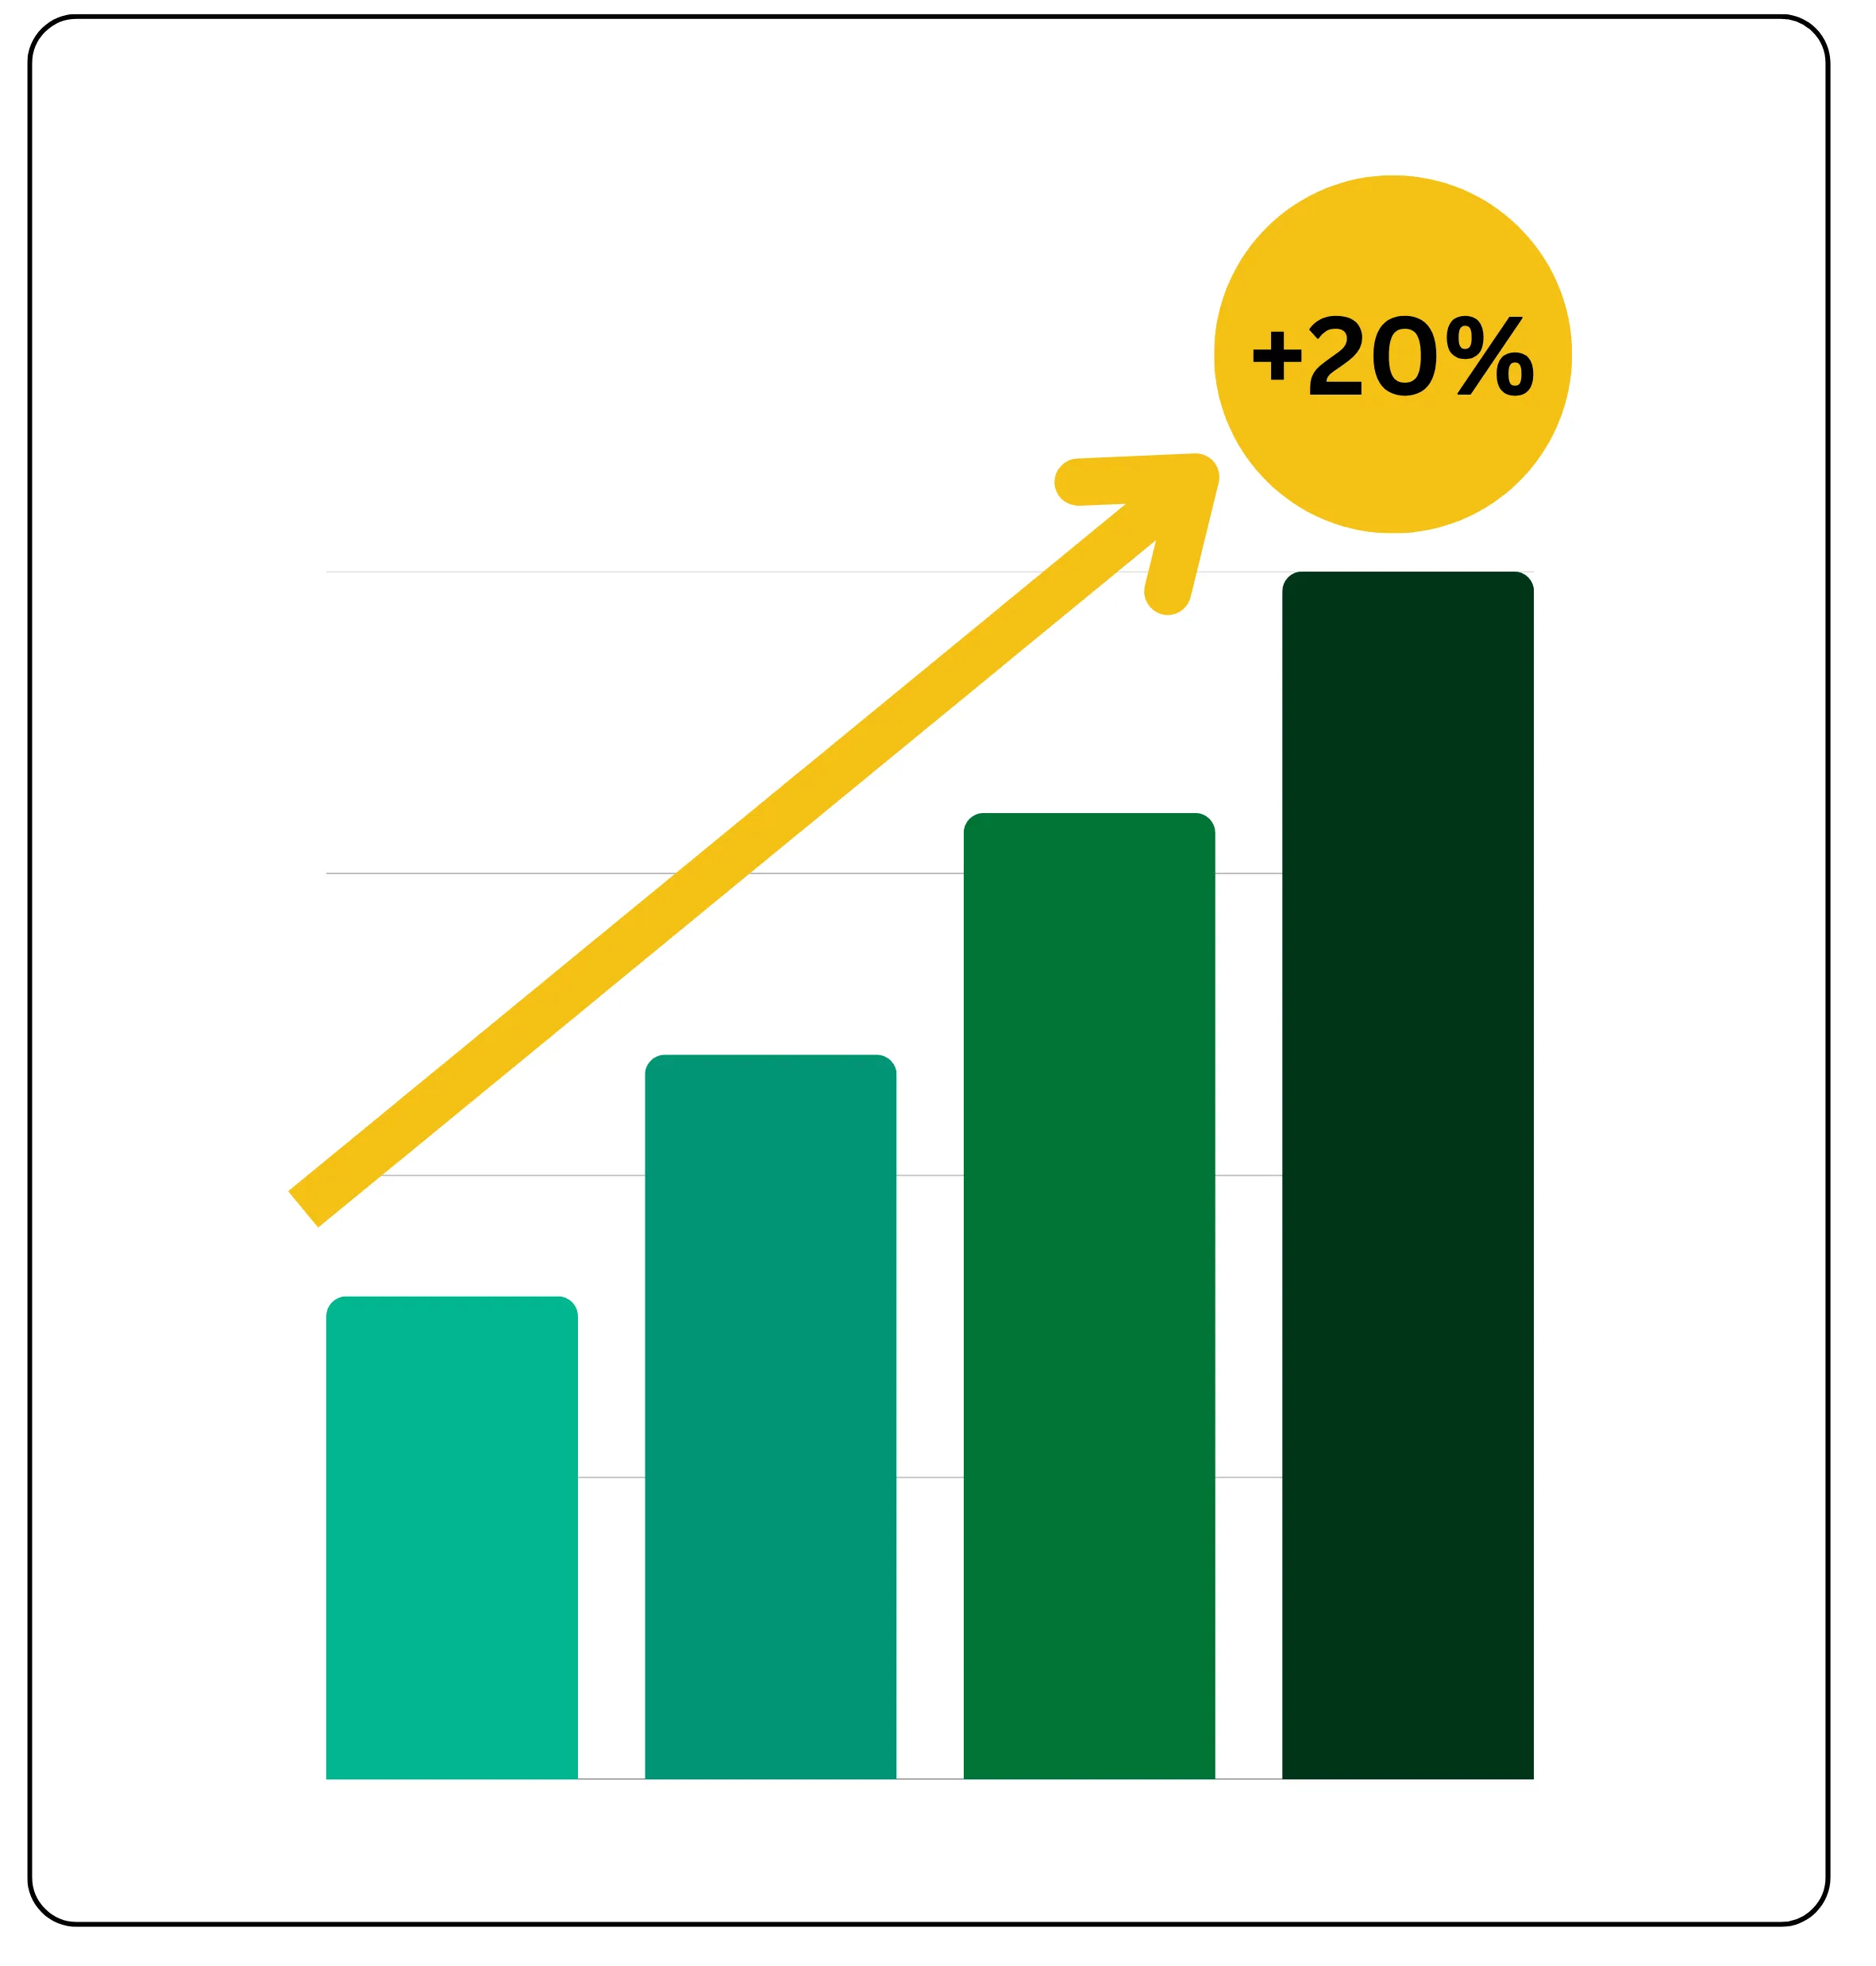
For example, if you invested ₹5,000 and its value increased to ₹6,000, your percentage gain would be 20%.
This metric makes it easy to compare the performance of different investments, regardless of their initial amounts. A positive percentage gain indicates profit, while a negative one signals a loss. Investors often use percentage gain to assess how well their investment strategy is working.
Percentage Gain formula
To calculate percentage gain, use the following formula:
% Gain = [(Selling Price – Purchase Price) / Purchase Price] × 100
Here:
Selling Price is the amount you sell the asset or security for.
Purchase Price is the original amount you paid to acquire it.
This formula helps determine the profit earned on an investment as a percentage of the initial cost. It provides a clear, standardized way to measure investment performance and compare returns across different assets or time periods.
Percentage gain is often the first metric used when analyzing earnings from a stock or mutual fund, setting the stage for tracking returns consistently over time.
Calculating Percentage Gain
To calculate the percentage gain on an investment, follow this simple method:
Formula:
Percentage Gain = [(Selling Price – Purchase Price) / Purchase Price] × 100
Example 1:
Suppose you invested ₹50,000 in a stock, and its value increased to ₹60,000.
The percentage gain would be:
[(₹60,000 – ₹50,000) / ₹50,000] × 100 = 20%
Example 2:
If you bought a stock at ₹100 and sold it at ₹150, the calculation would be:
[(₹150 – ₹100) / ₹100] × 100 = 50%
This method helps clearly evaluate investment performance.
These examples highlight how small changes in price can lead to significant gains in your yield, even on modest capital, reinforcing the importance of tracking percentage gain.
Also read: Investing in Precious Metals Through ETFs in India
What is CAGR?
CAGR, or Compounded Annual Growth Rate, represents the average annual growth of an investment over a specific period, assuming the profits are reinvested each year. It is commonly used to track performance metrics such as sales, revenue, or earnings, offering a clearer view of consistent growth by smoothing out short-term fluctuations.
For example, if a company’s earnings grew at a CAGR of 26.7%, it means they increased by an average of 26.7% each year over the given period. The formula to calculate CAGR is:
CAGR = (End Value / Beginning Value)^(1/n) – 1, where n is the number of years.
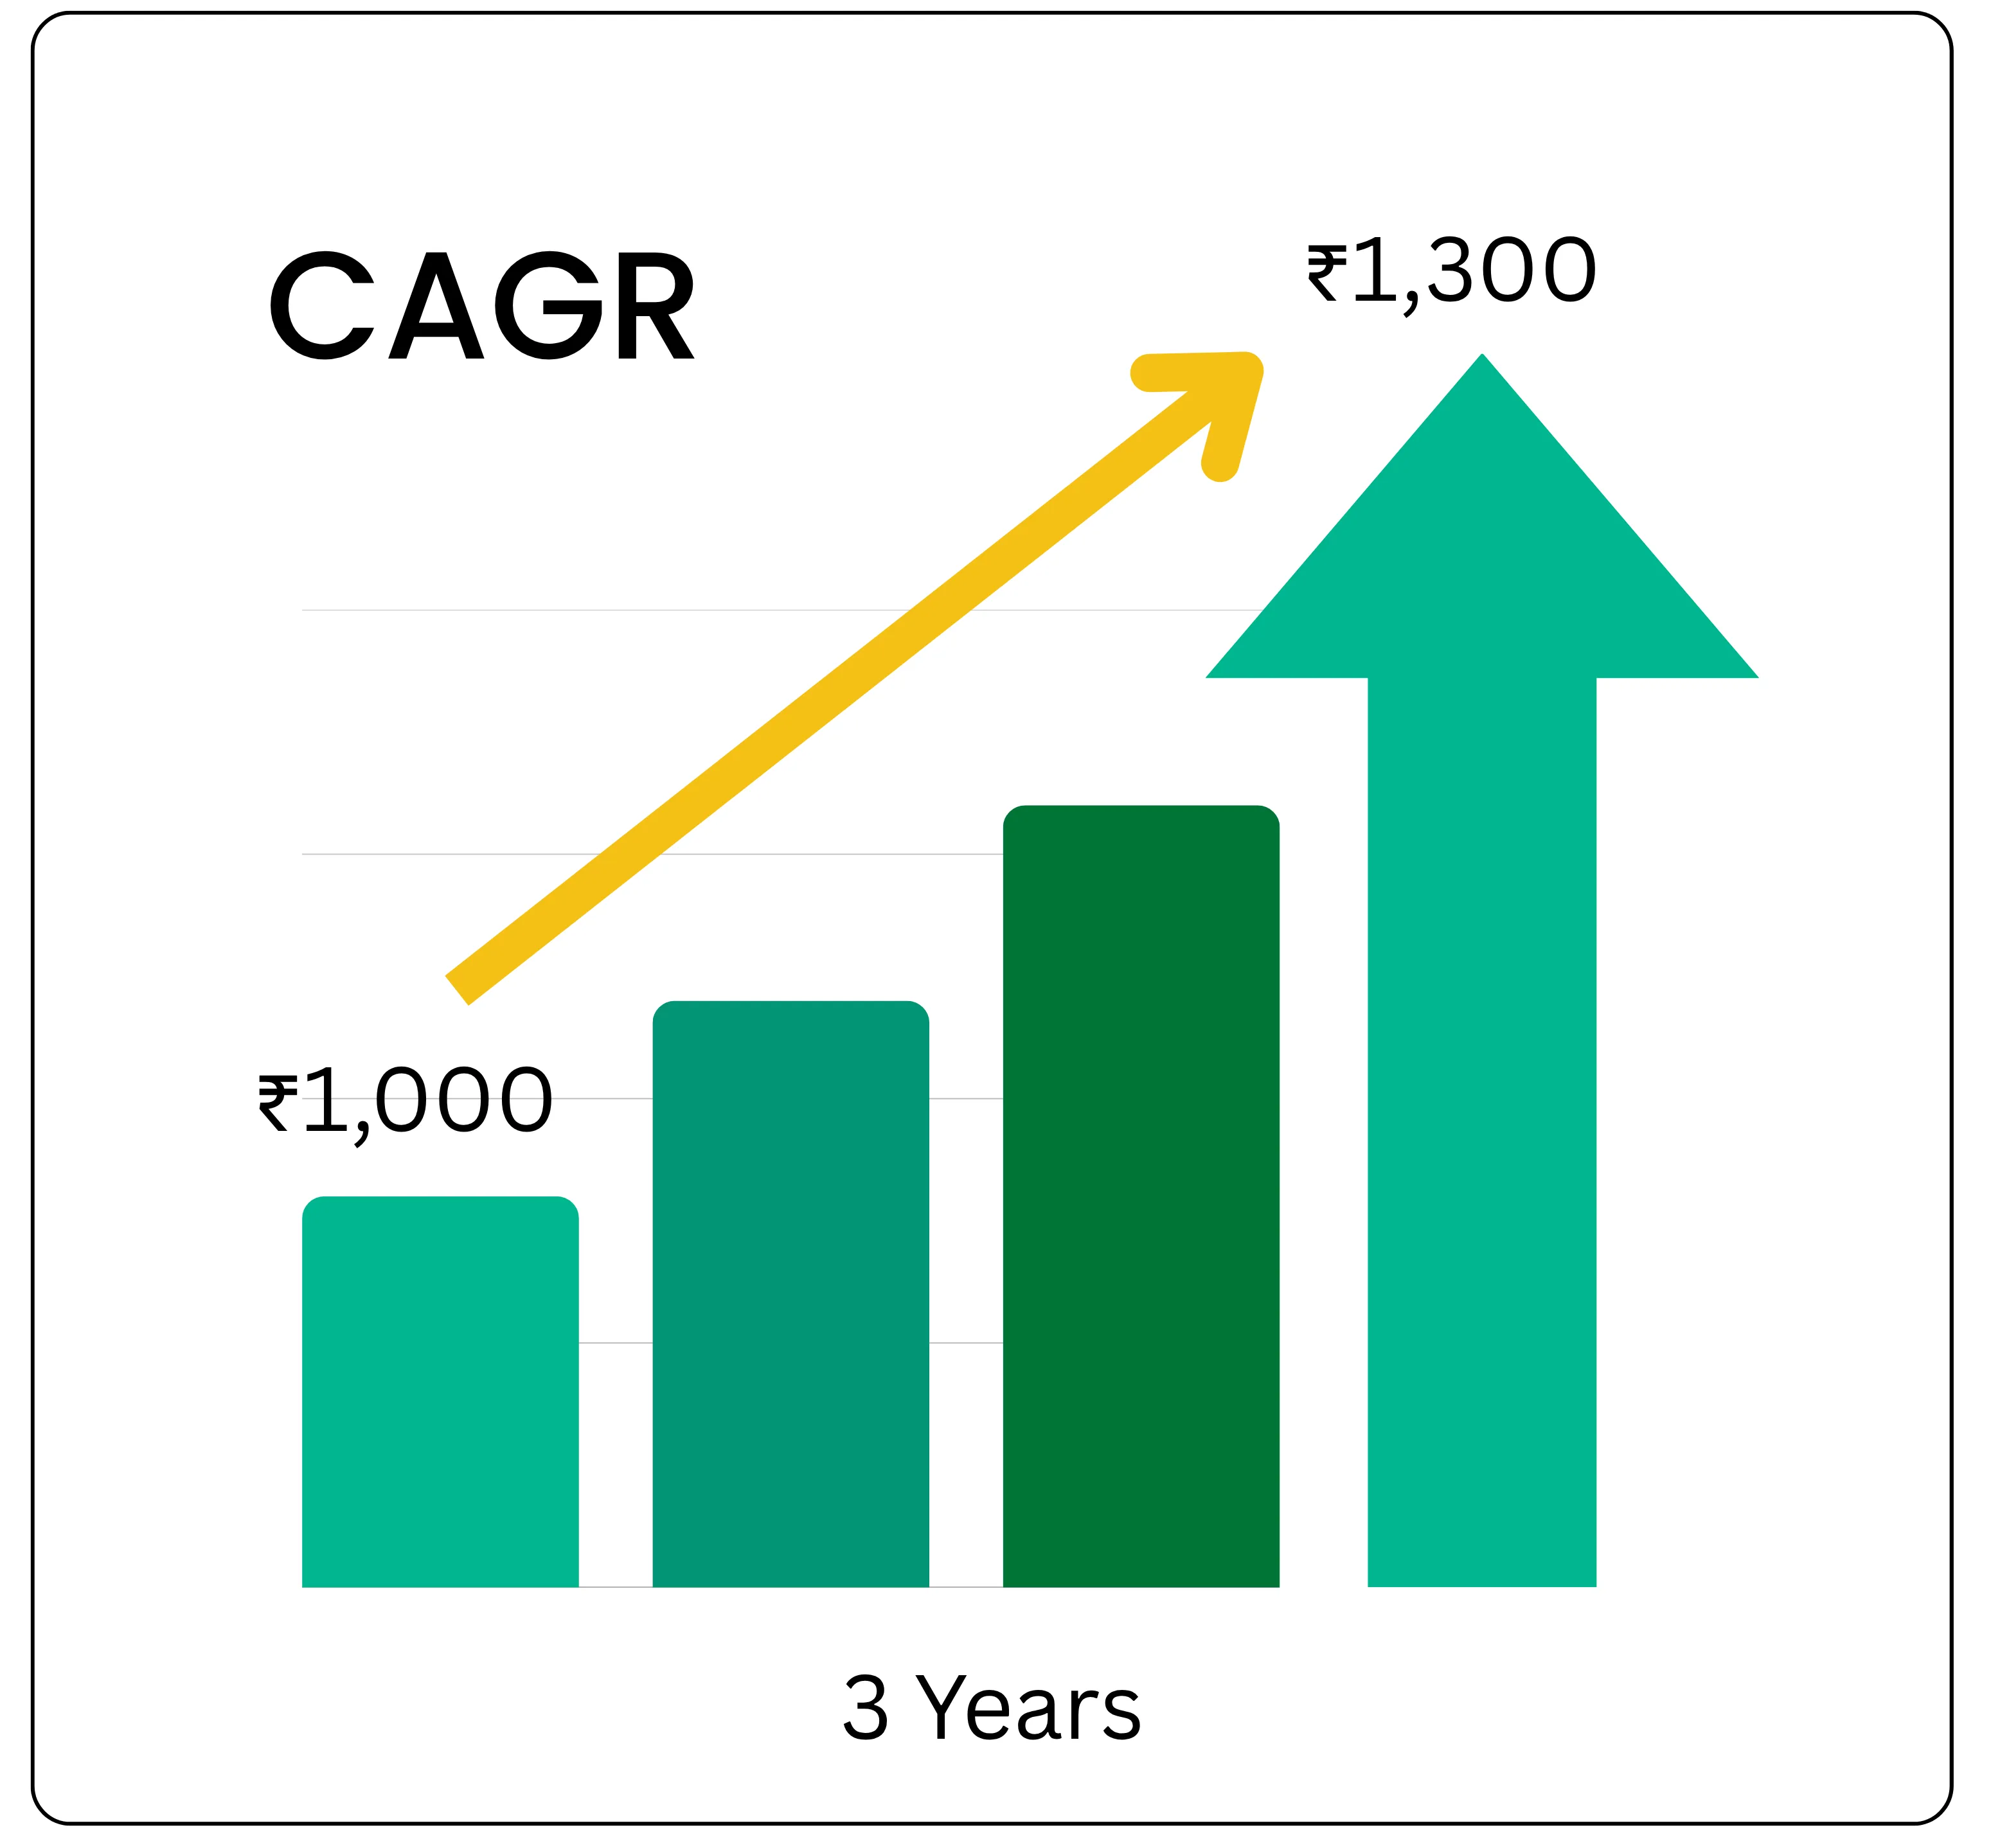
Suppose someone invested ₹1,000 in a mutual fund, and it grew to ₹1,300 in 3 years. Using the formula, the CAGR would be approximately 9.13%. This means the investment grew at an average annual rate of 9.13% over the three years.
CAGR is widely used to evaluate long-term investment performance, compare different investment options, assess potential returns, and make informed financial decisions. It is especially useful in stocks to measure consistent growth and eliminate short-term market noise, helping investors focus on sustained performance. CAGR also serves as a benchmarking tool for assessing the performance of investment options and the portfolio as a whole across different market cycles.
What Is Relative Percentage Change in Stock Market Investing?
Relative percentage change measures the performance of a stock or portfolio compared to a benchmark index or another asset. It shows how much better or worse an investment has performed relative to a standard.
Example:
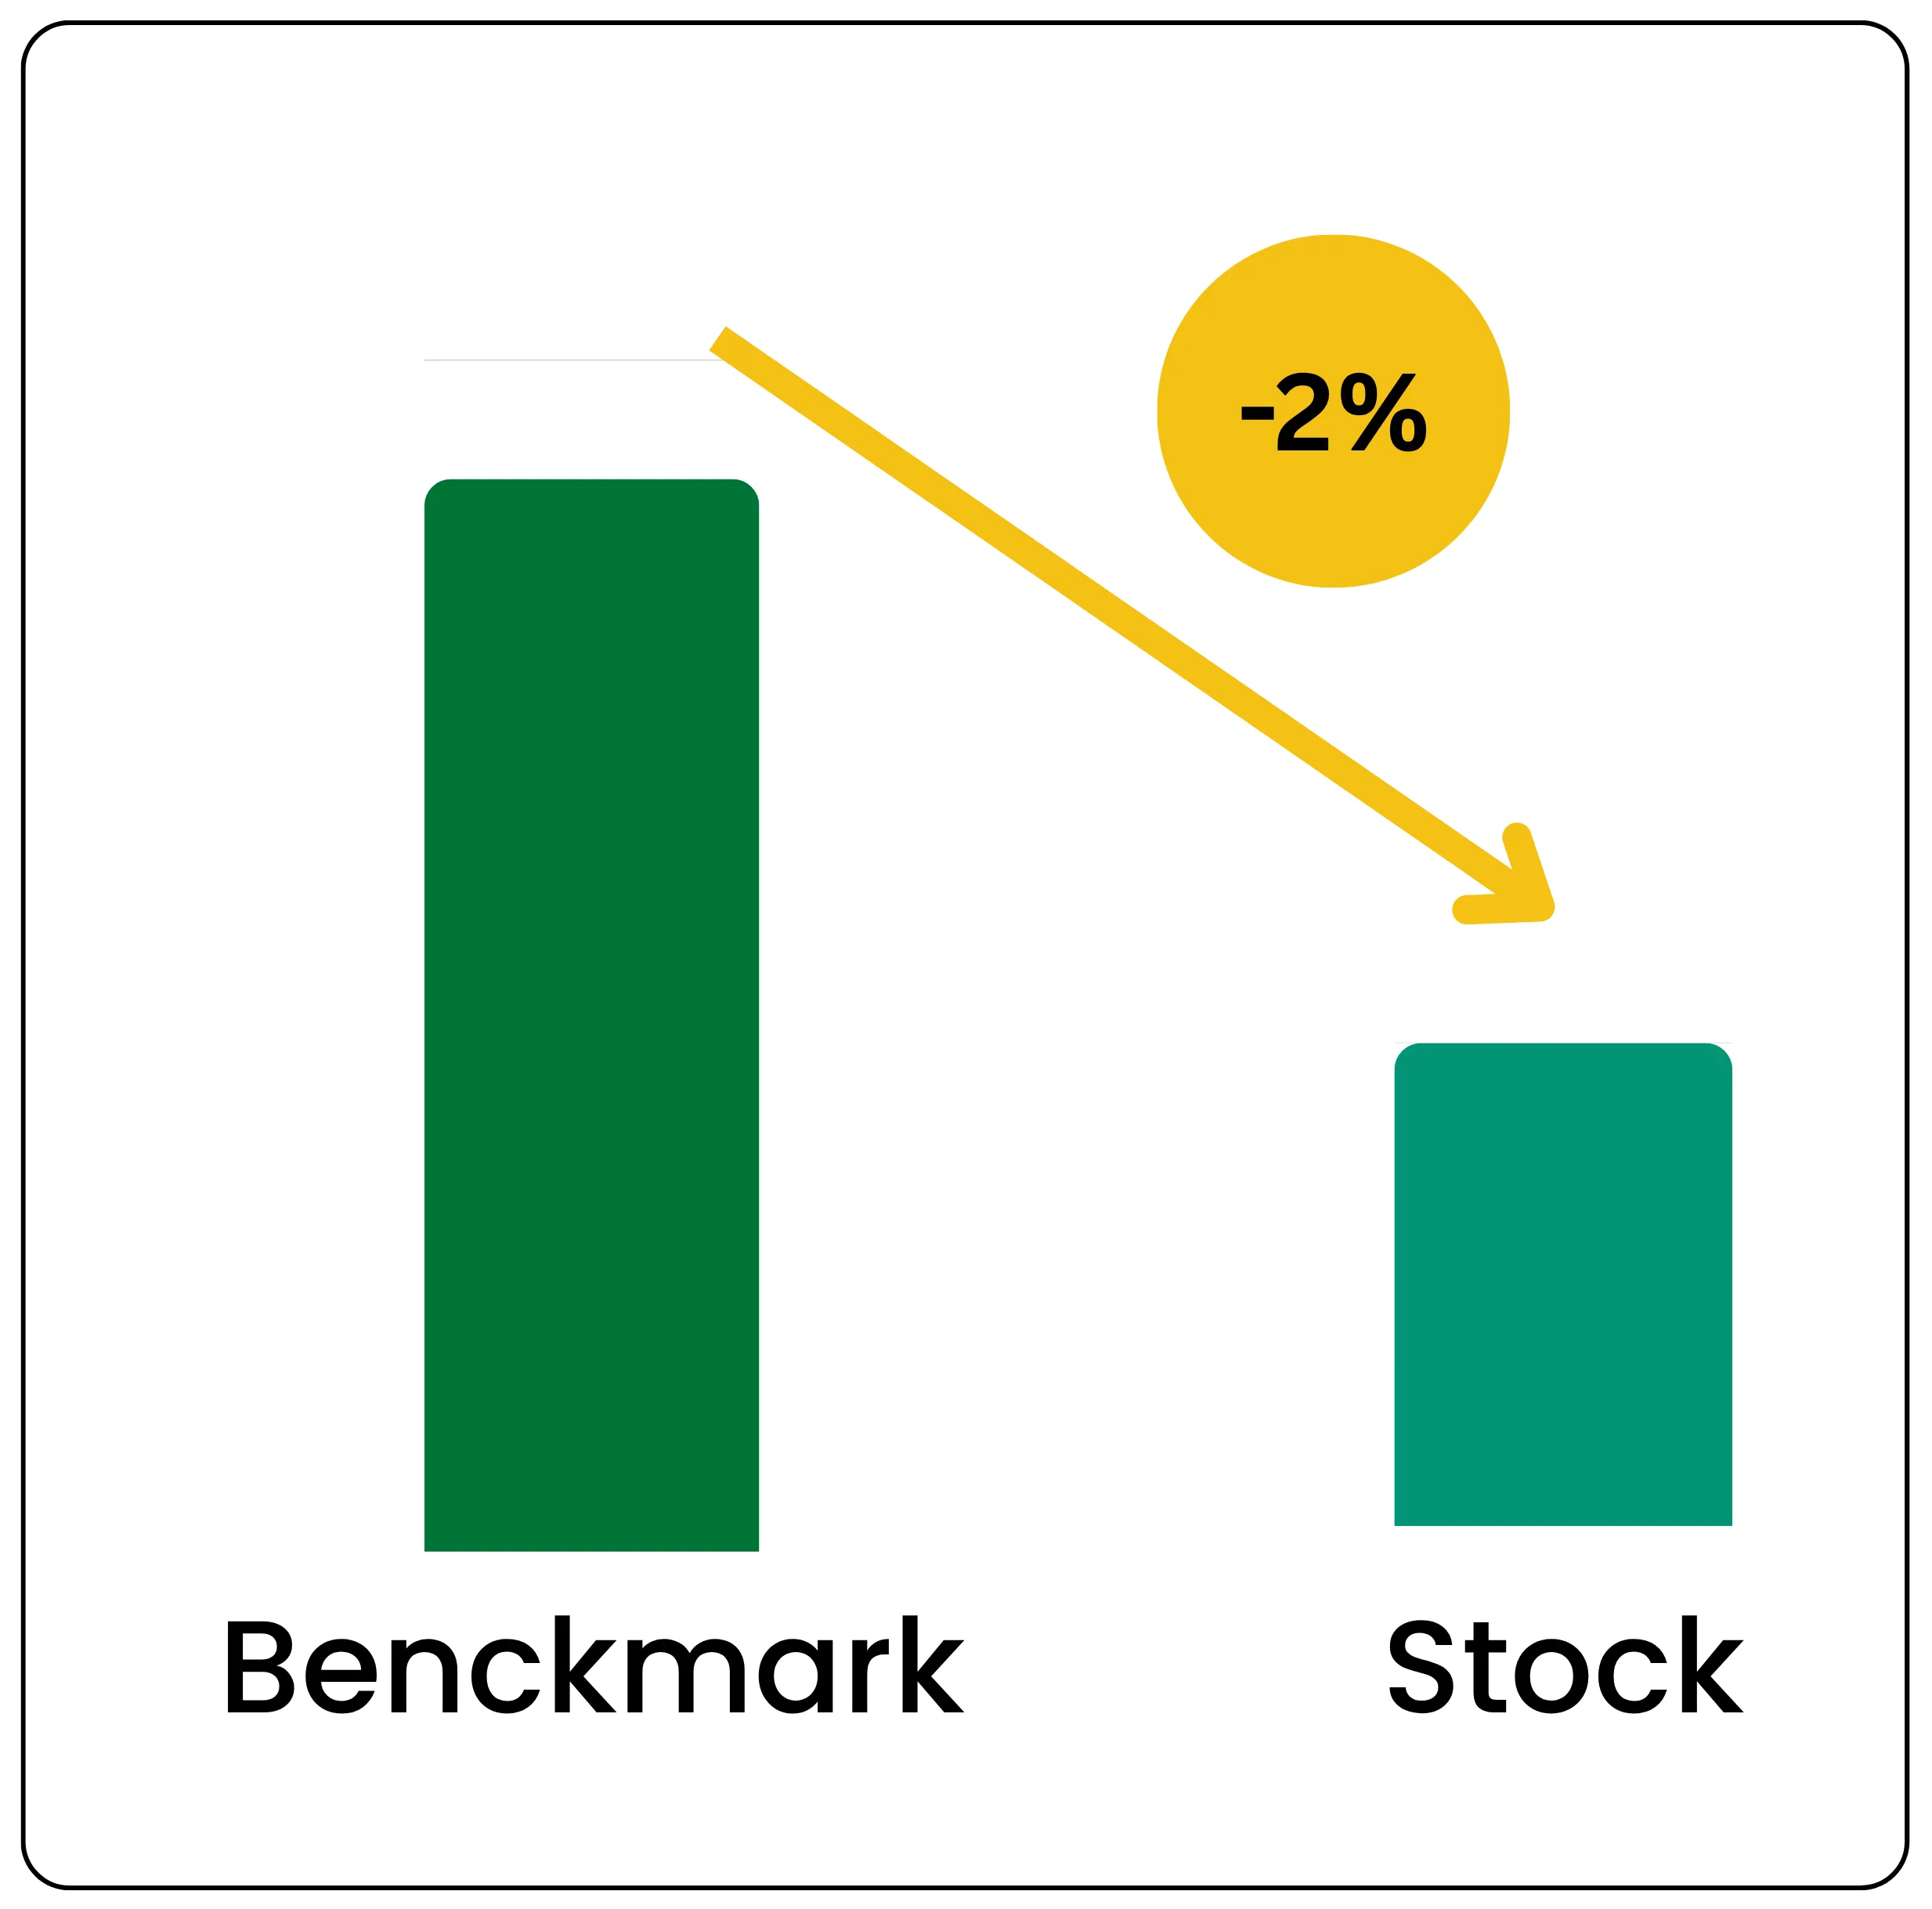
If your portfolio gained 8% while the benchmark index rose 10%, your relative return is -2%, meaning your investment underperformed the market by 2 percentage points.
Relative percentage change is commonly used by institutional investors to evaluate fund managers and investment strategies, focusing not just on gains, but on how those gains compare to the broader market or peers. This metric is a cornerstone of benchmarking, as it shows how well a strategy stacks up against a predefined index.
What is Absolute Return and how does it work?
Absolute return, also known as total return, measures the overall gain or loss an investment generates over a specific period, without reference to any benchmark or market index. It reflects the actual performance of an asset or portfolio, whether positive or negative, and is considered independent of broader market movements. Since absolute returns don’t depend on external benchmarks, they give a raw picture of profitability and highlight the true earning power of a fund or stock.
Also read: How Technology is Redefining the Future of Gold Demand
Absolute vs. Relative Returns
Traditional mutual funds typically follow a relative return strategy, aiming to outperform a benchmark, peer group, or market index. Performance is evaluated in comparison to these standards.
In contrast, absolute return funds aim to deliver positive returns regardless of market conditions. These funds employ diverse strategies such as short selling, derivatives, arbitrage, leverage, and alternative assets. The focus is solely on the investment’s own gains or losses, not its performance relative to the market or other funds.
What is Average Return?
Average return is the simple arithmetic mean of a series of investment returns over a period. It is calculated by adding up all annual returns and dividing by the number of years.
Formula:
Average Return = (R₁ + R₂ + ... + Rn) / n
Where R = return in each year, and n = number of years
Example:
If a stock returns 10%, 5%, and 15% over three years:
Average Return = (10 + 5 + 15) / 3 = 10%
Average Return vs. CAGR
Average return gives a simple overview, investors focused on sustainable earnings or portfolio growth often lean on CAGR for better clarity.
| Aspect | Average Return | CAGR (Compounded Annual Growth Rate) |
|---|---|---|
| Calculation | Simple arithmetic mean | Geometric average (compounding effect included) |
| Accounts for Volatility | No (ignores fluctuations) | Yes (smooths returns over time) |
| Assumes Reinvestment | No | Yes |
| Best for | Quick, rough estimates | Accurate long-term performance tracking |
| Example Use | Yearly stock returns summary | Long-term portfolio growth comparison |
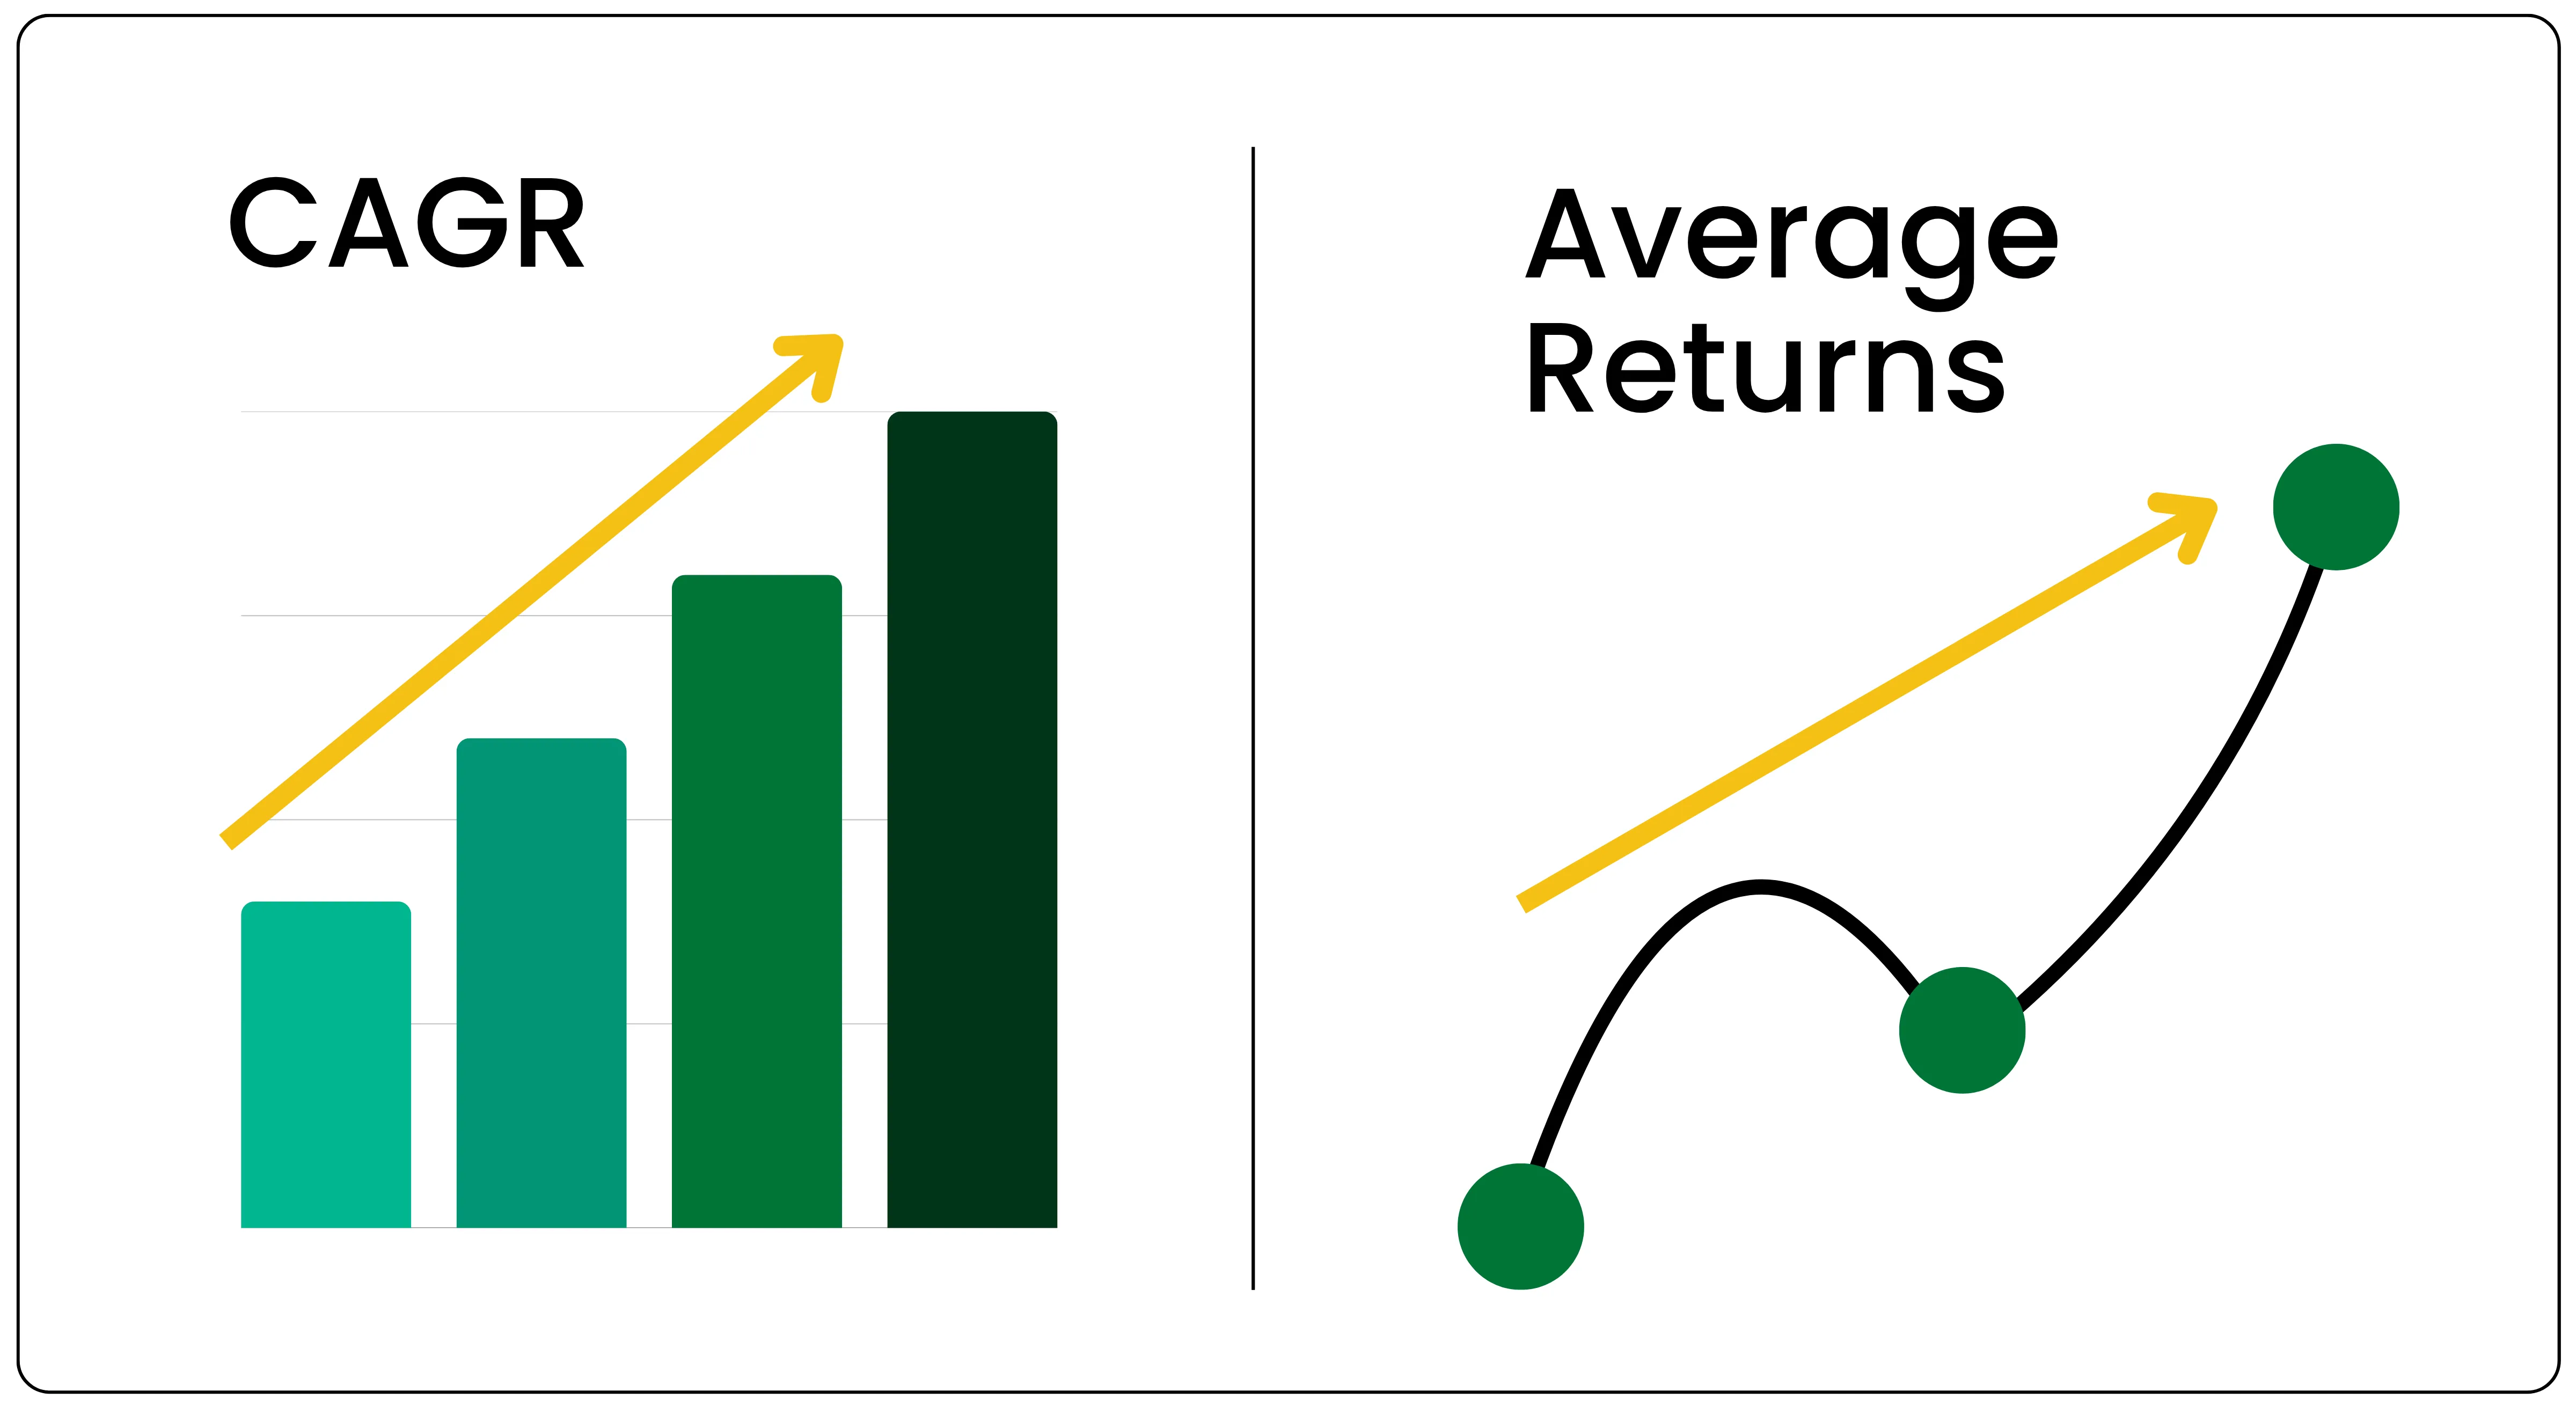
While average return gives a quick snapshot, CAGR provides a more accurate picture of long-term performance, especially when returns vary year-to-year. Investors rely on CAGR to better assess investment consistency and compounding impact.
Why Percentage Return matters in investing
Percentage return is more than just a basic metric; it’s the foundation of investment performance analysis. It tells you how much your investment has grown or declined relative to your initial capital, making it an essential starting point for evaluating success.
From this simple concept, several key return metrics are derived:I
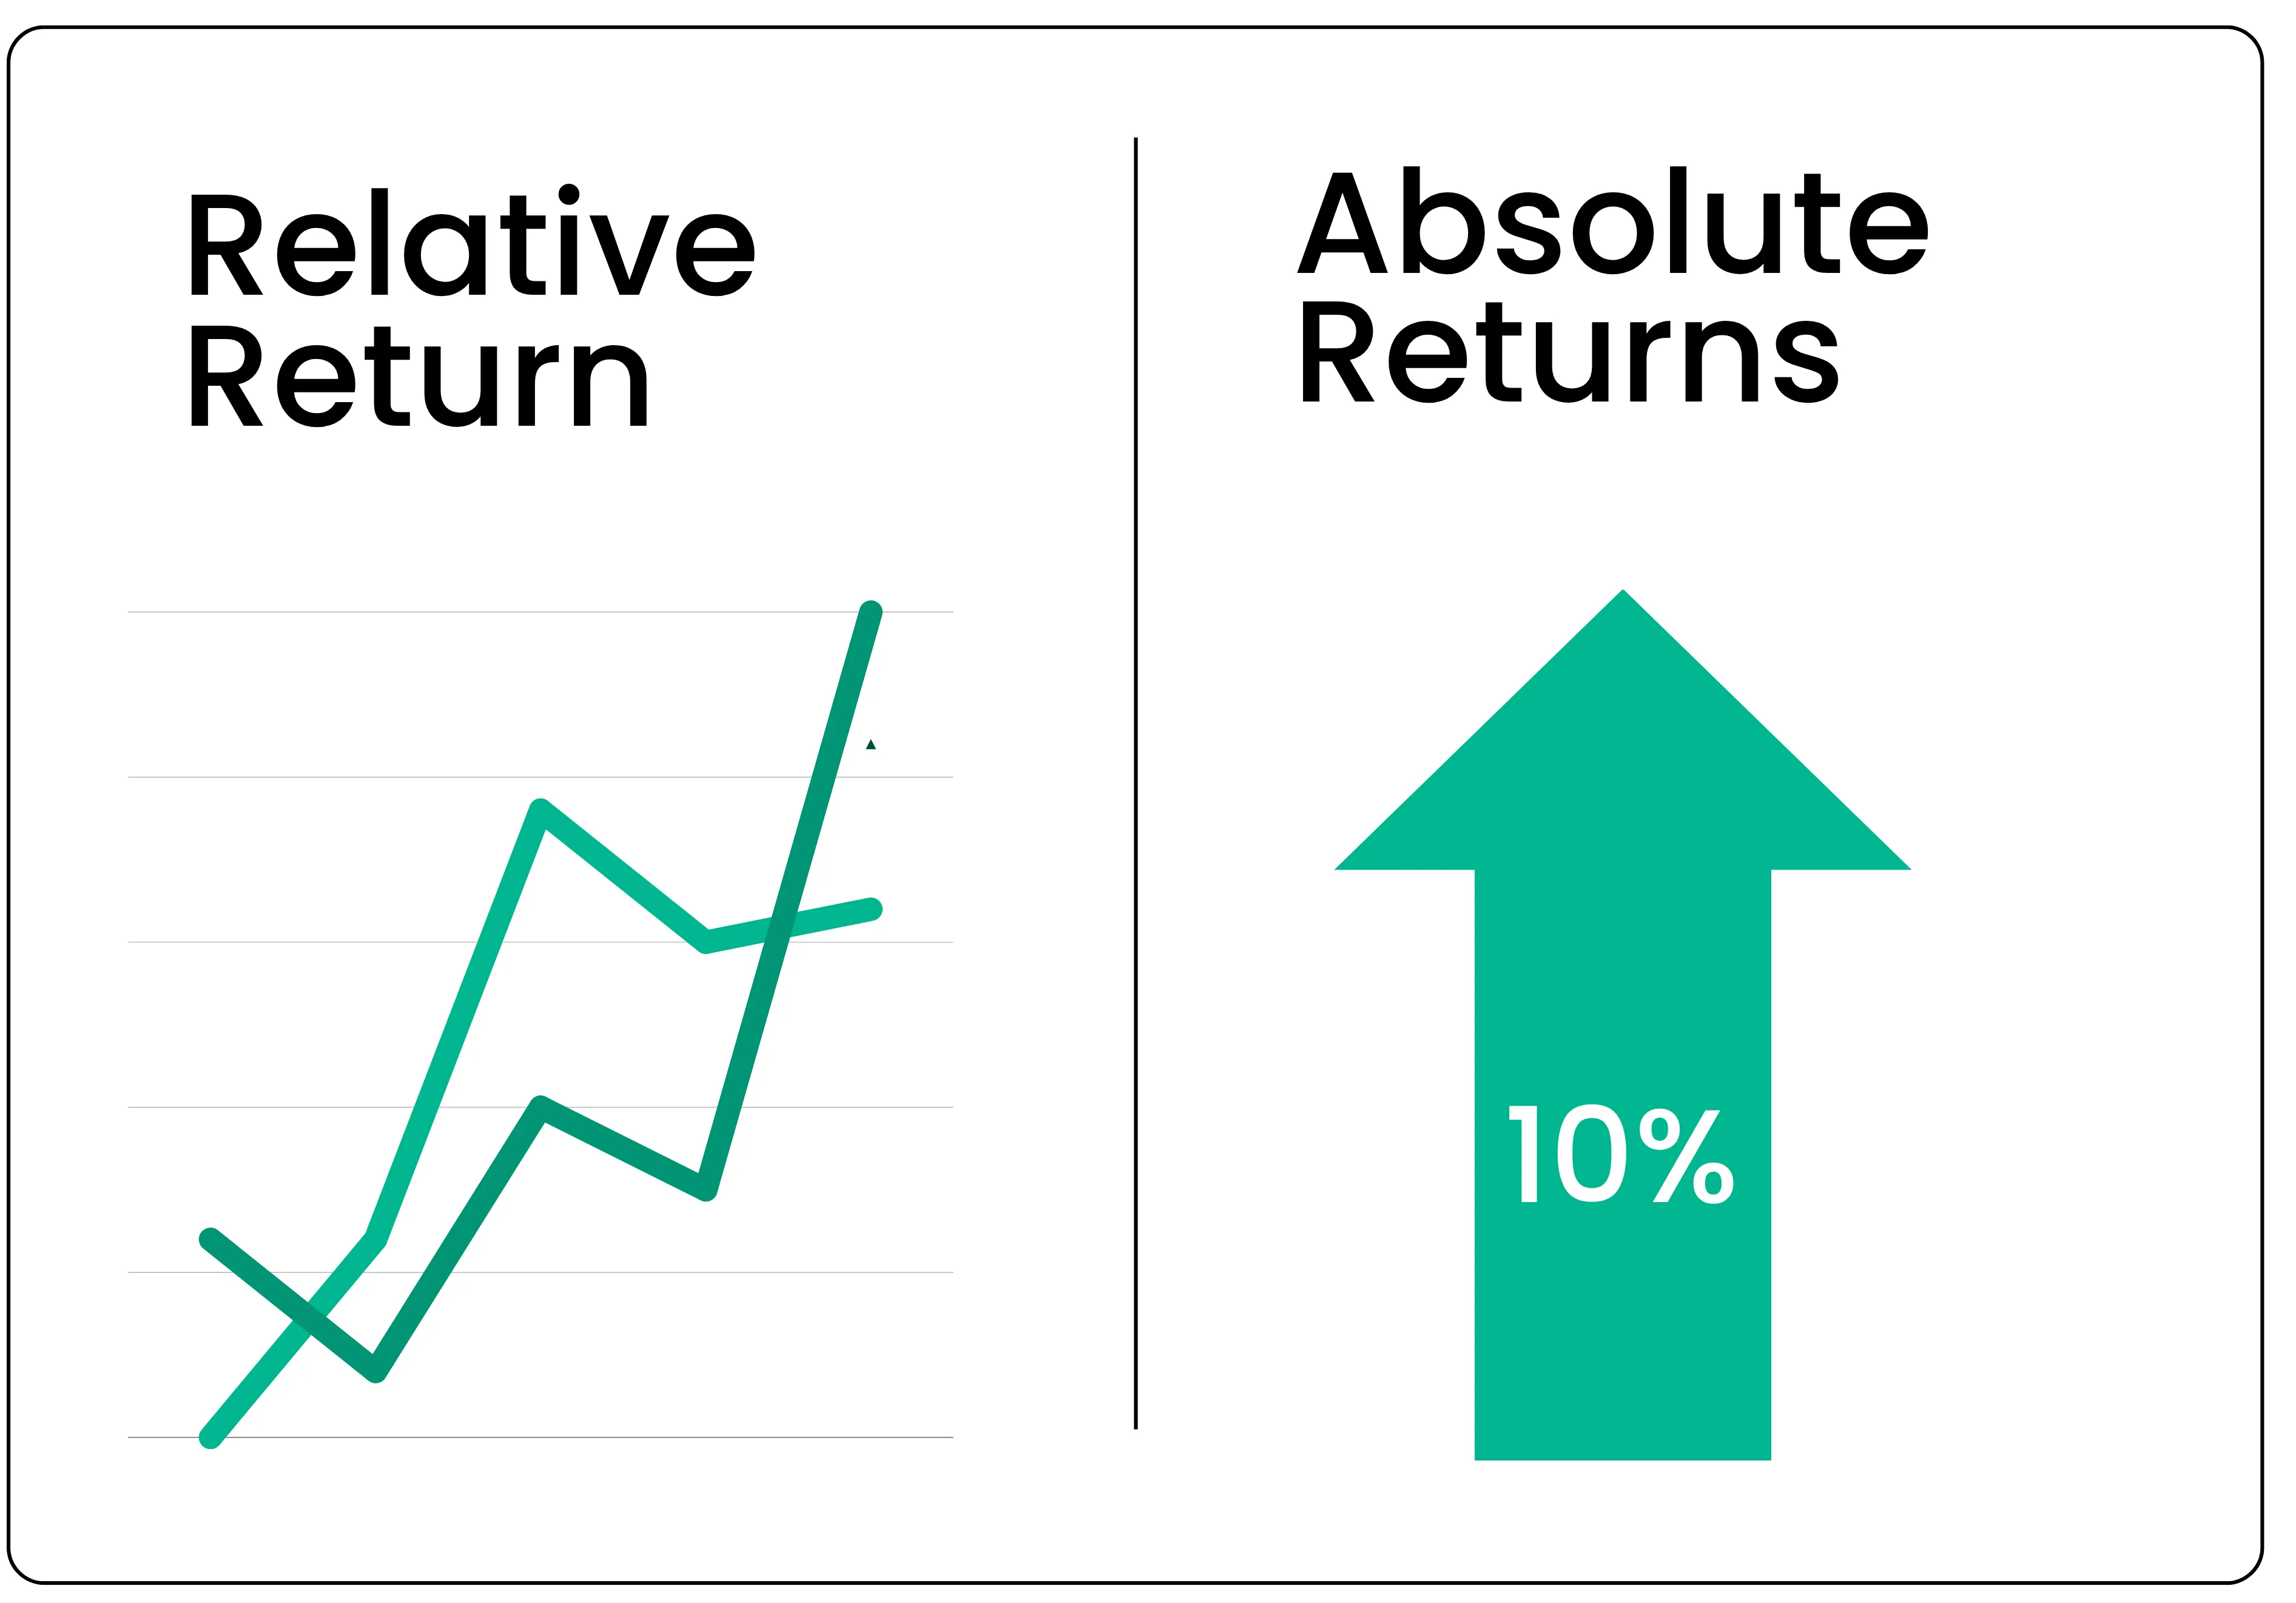
Absolute returns express the total gain or loss without any reference to a benchmark, helping you track progress in clear terms.
Relative returns compare your investment to a market index or peer group, showing whether you’re outperforming or underperforming.
Average returns provide a quick snapshot of typical yearly performance over a period but may not fully capture compounding or volatility.
CAGR (Compounded Annual Growth Rate) refines percentage return by showing the consistent annual growth rate, accounting for compounding over time.
Together, these metrics help investors assess performance from different angles—but they all stem from one core idea: percentage return. Understanding it equips you to analyze results, compare opportunities, and make informed investment decisions with greater confidence. Whether you’re evaluating returns on individual stocks or total portfolio gains, percentage return remains your foundational metric. Understanding it enhances your ability to manage volatility, optimize diversification, and assess strategies through benchmarking.
Also read: Cash vs Non‑Cash Component: How Brokers Allocate Your Margin
Disclaimer: The information provided in our blogs is for informational purposes only and should not be construed as financial, investment, or trading advice. Trading and investing in the securities market carries risk. Always conduct your own research and consult with a qualified financial advisor before making any investment decisions. Past performance is not indicative of future results. Copyrighted and original content for your trading and investing needs.
© 2025 — Tradejini. All Rights Reserved.