


Markets don’t move in straight lines. Prices surge, stall, and drift sideways. For traders, the real challenge isn’t predicting the next move but figuring out whether the market is actually trending or just stuck in a range. That’s where the Directional Movement Indicator (DMI) and the Average Directional Index (ADX), designed by J. Welles Wilder, come into play.
What is the Directional Movement Indicator?
The Directional Movement Indicator DMI is built on a simple assumption:
When the trend is up, today’s high should be greater than yesterday’s high.
When the trend is down, today’s low should be lower than yesterday’s low.
From this, Wilder introduced four key lines that together make up the DMI system:
+DI (Positive Directional Indicator): Measures upward movement by comparing today’s high to yesterday’s high.
-DI (Negative Directional Indicator): Measures downward movement by comparing today’s low to yesterday’s low.
ADX (Average Directional Index): A smoothed 14-period moving average showing the strength of the trend, regardless of direction.
ADXR (Average Directional Index Rating): An average of today’s ADX and the ADX from 14 periods ago, helping confirm trend strength.
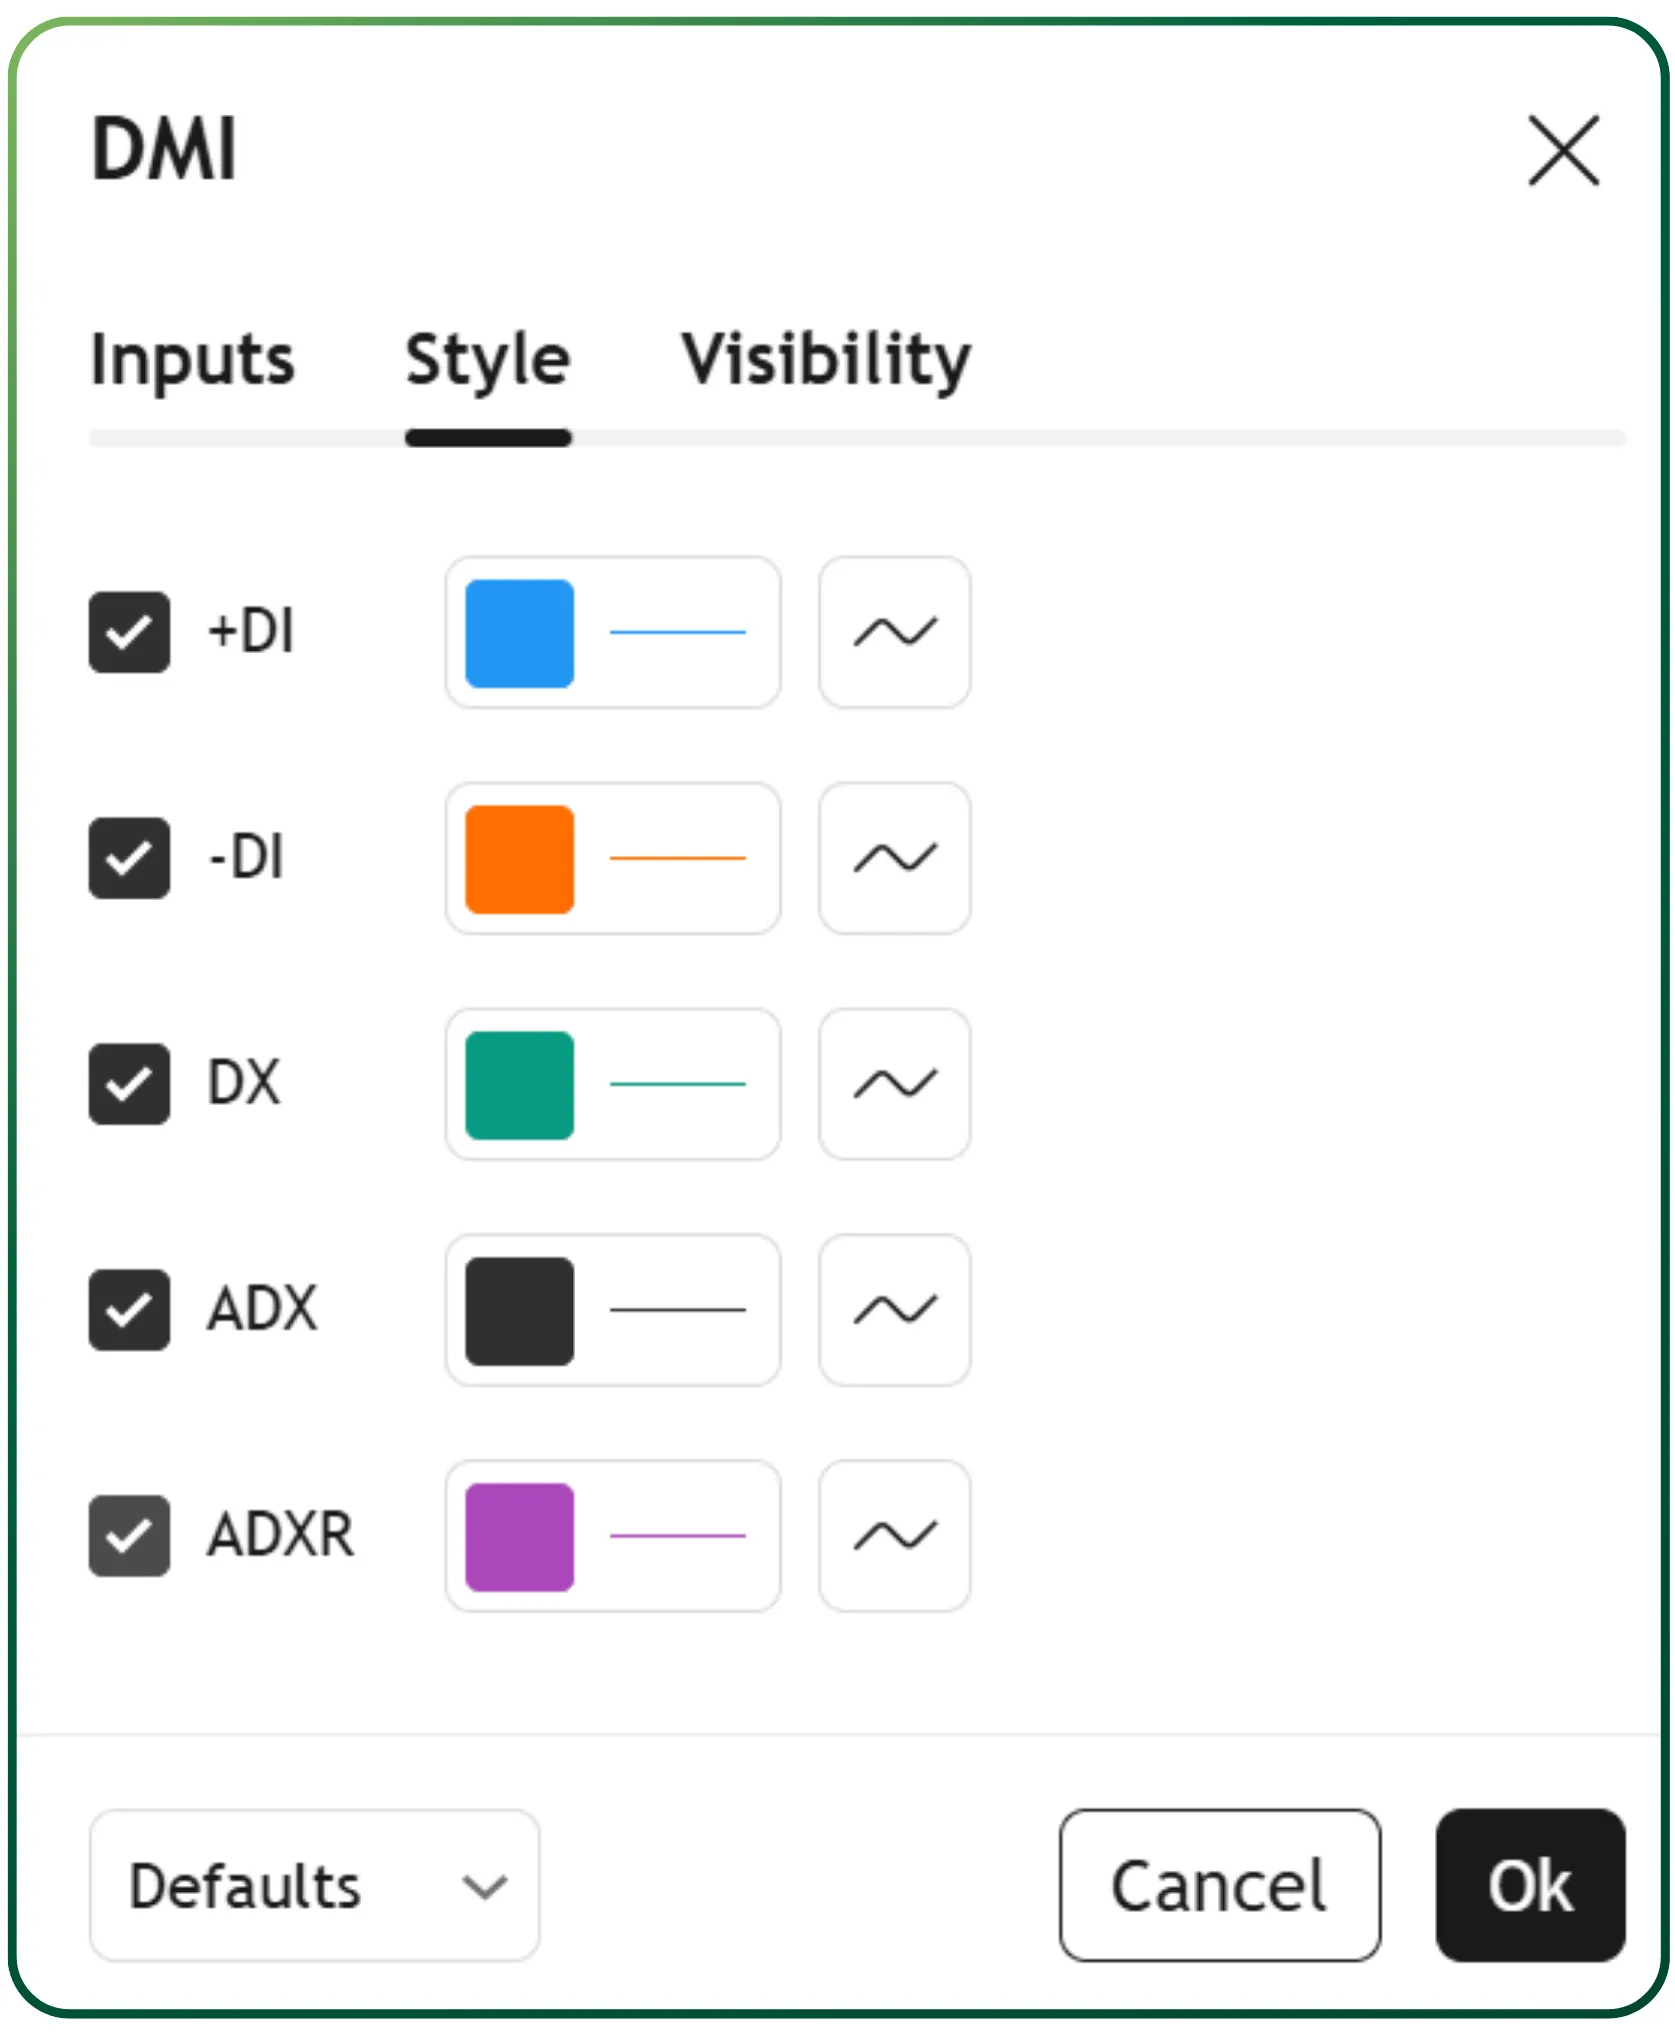
The Directional Movement Indicator (DMI) can be applied using CubePlus, as illustrated below, with the chart highlighting which line represents each component.
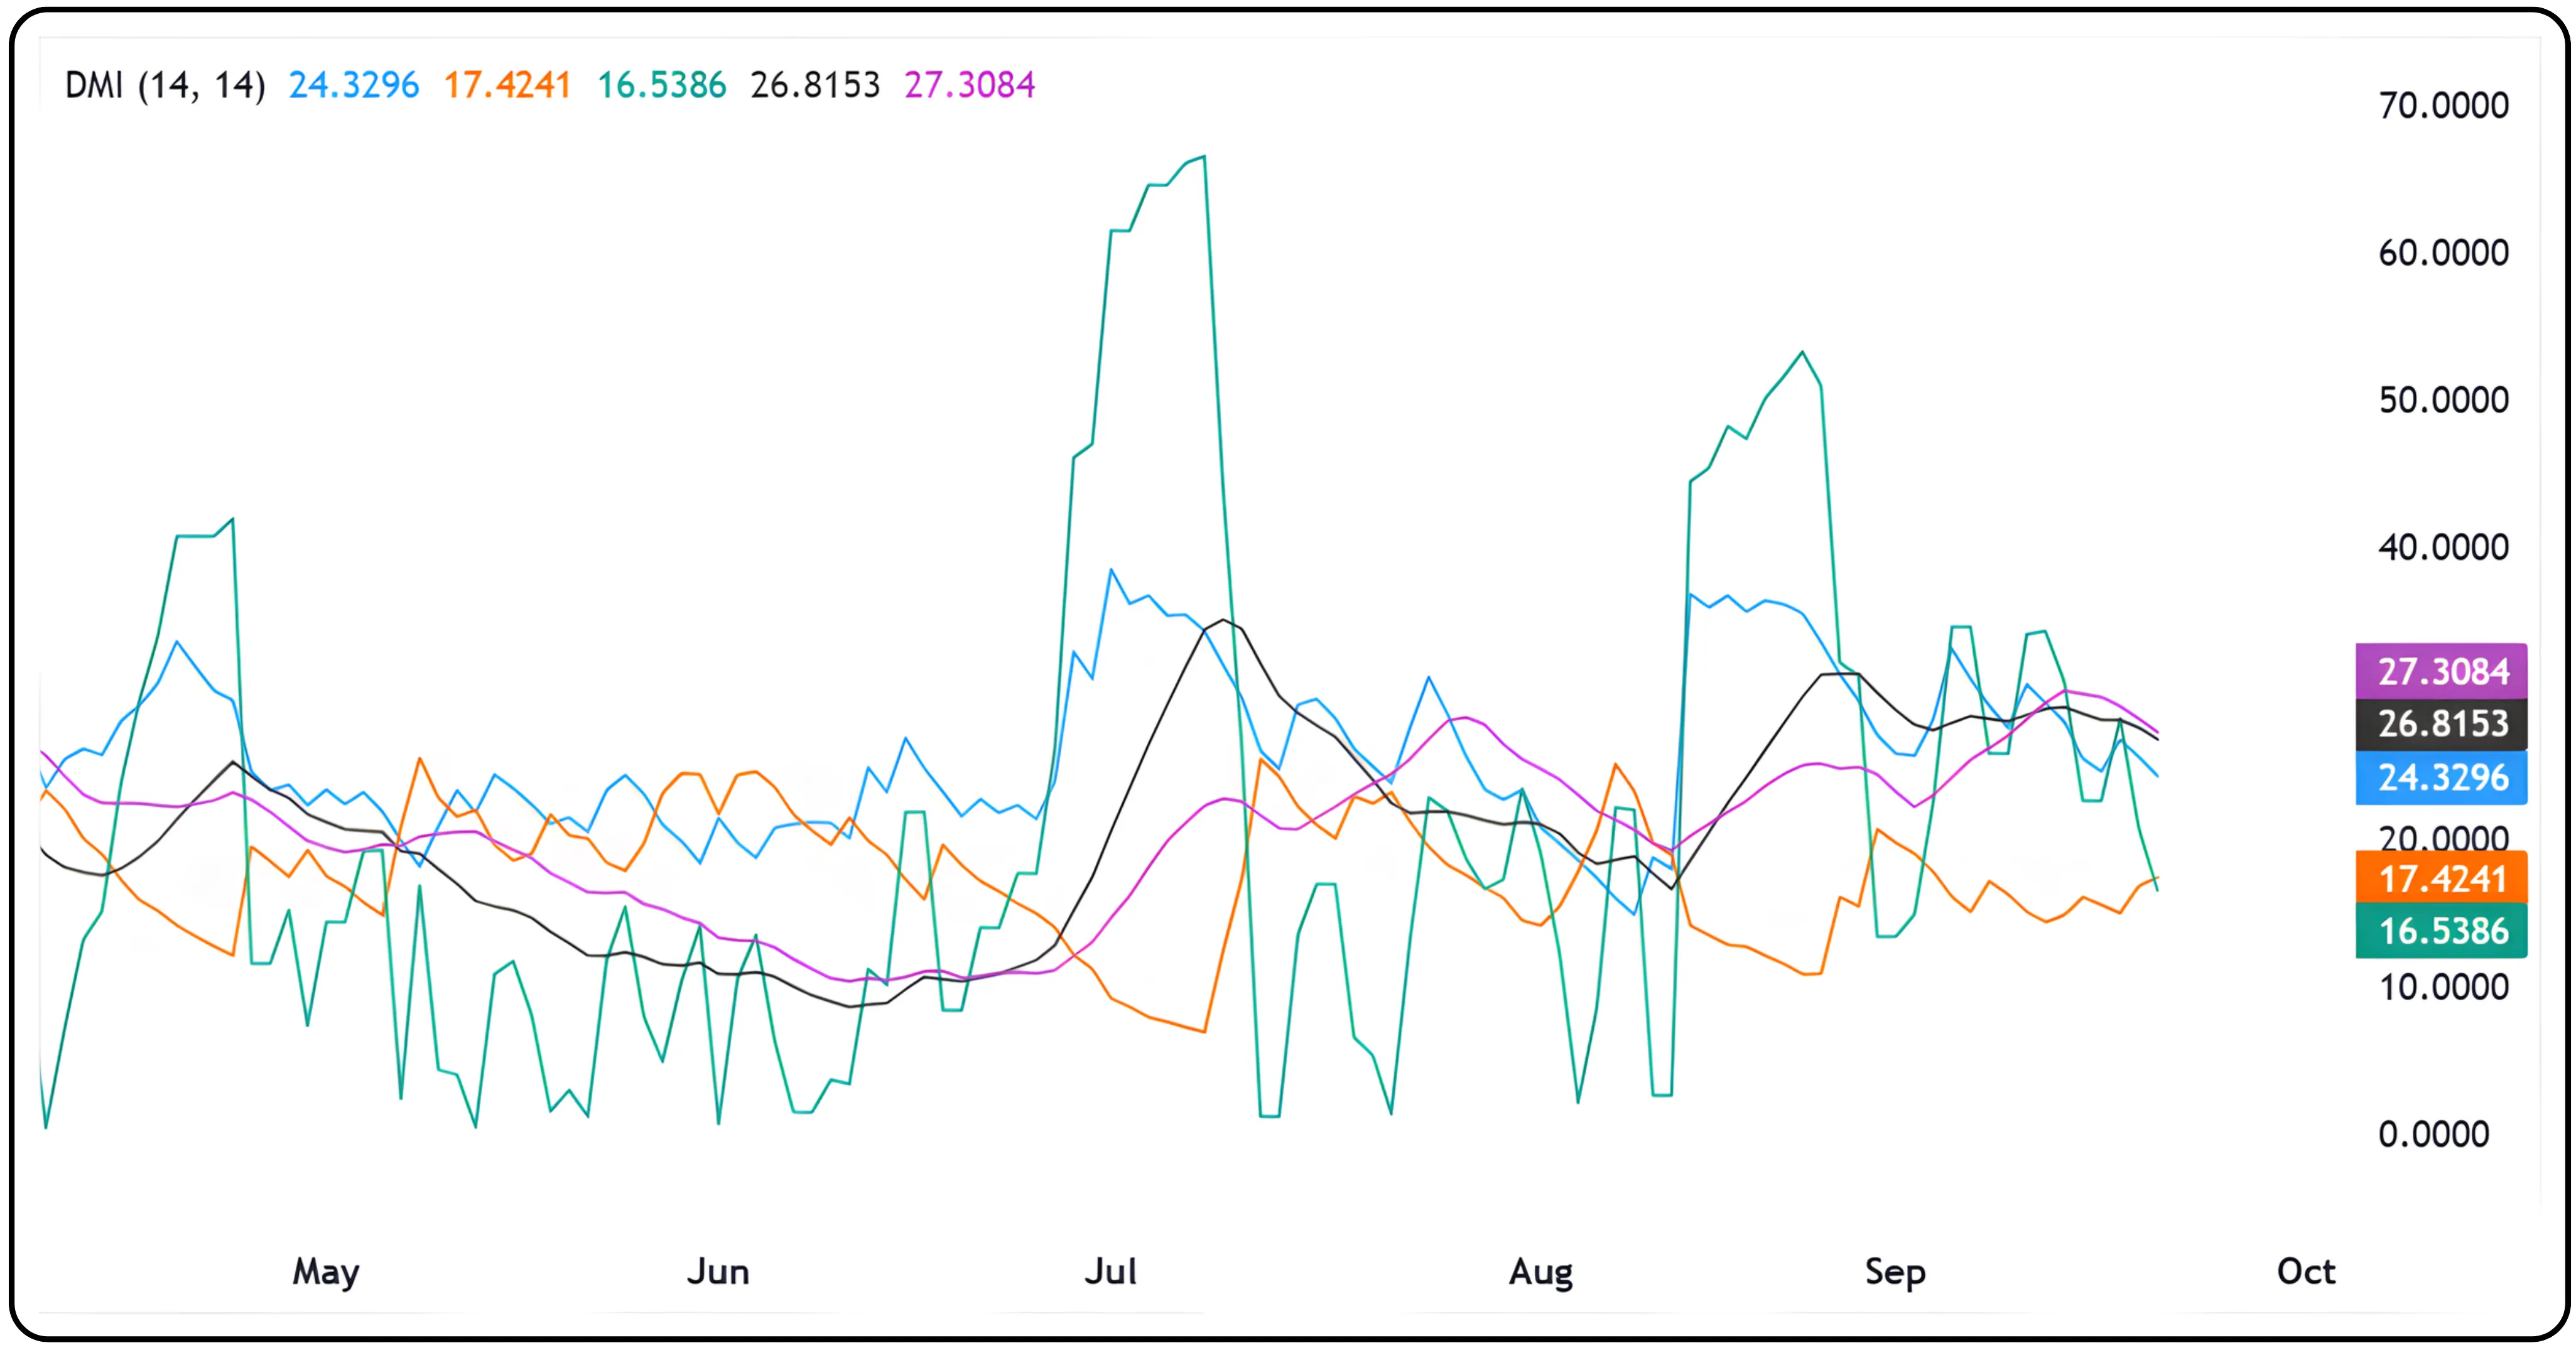
The greater the gap between +DI and -DI, the stronger the trend.
ADX indicator
The Average Directional Index (ADX) does not indicate whether the market is moving up or down. Instead, it only shows how strong the current trend is. To identify direction, traders must look at the +DI and -DI lines.
If +DI is above -DI and ADX is rising, the uptrend is strengthening.
If -DI is above +DI and ADX is rising, the downtrend is strengthening.
If ADX is falling, it means the existing trend, whether upward or downward, is losing momentum and the market may shift into a sideways or range-bound phase.
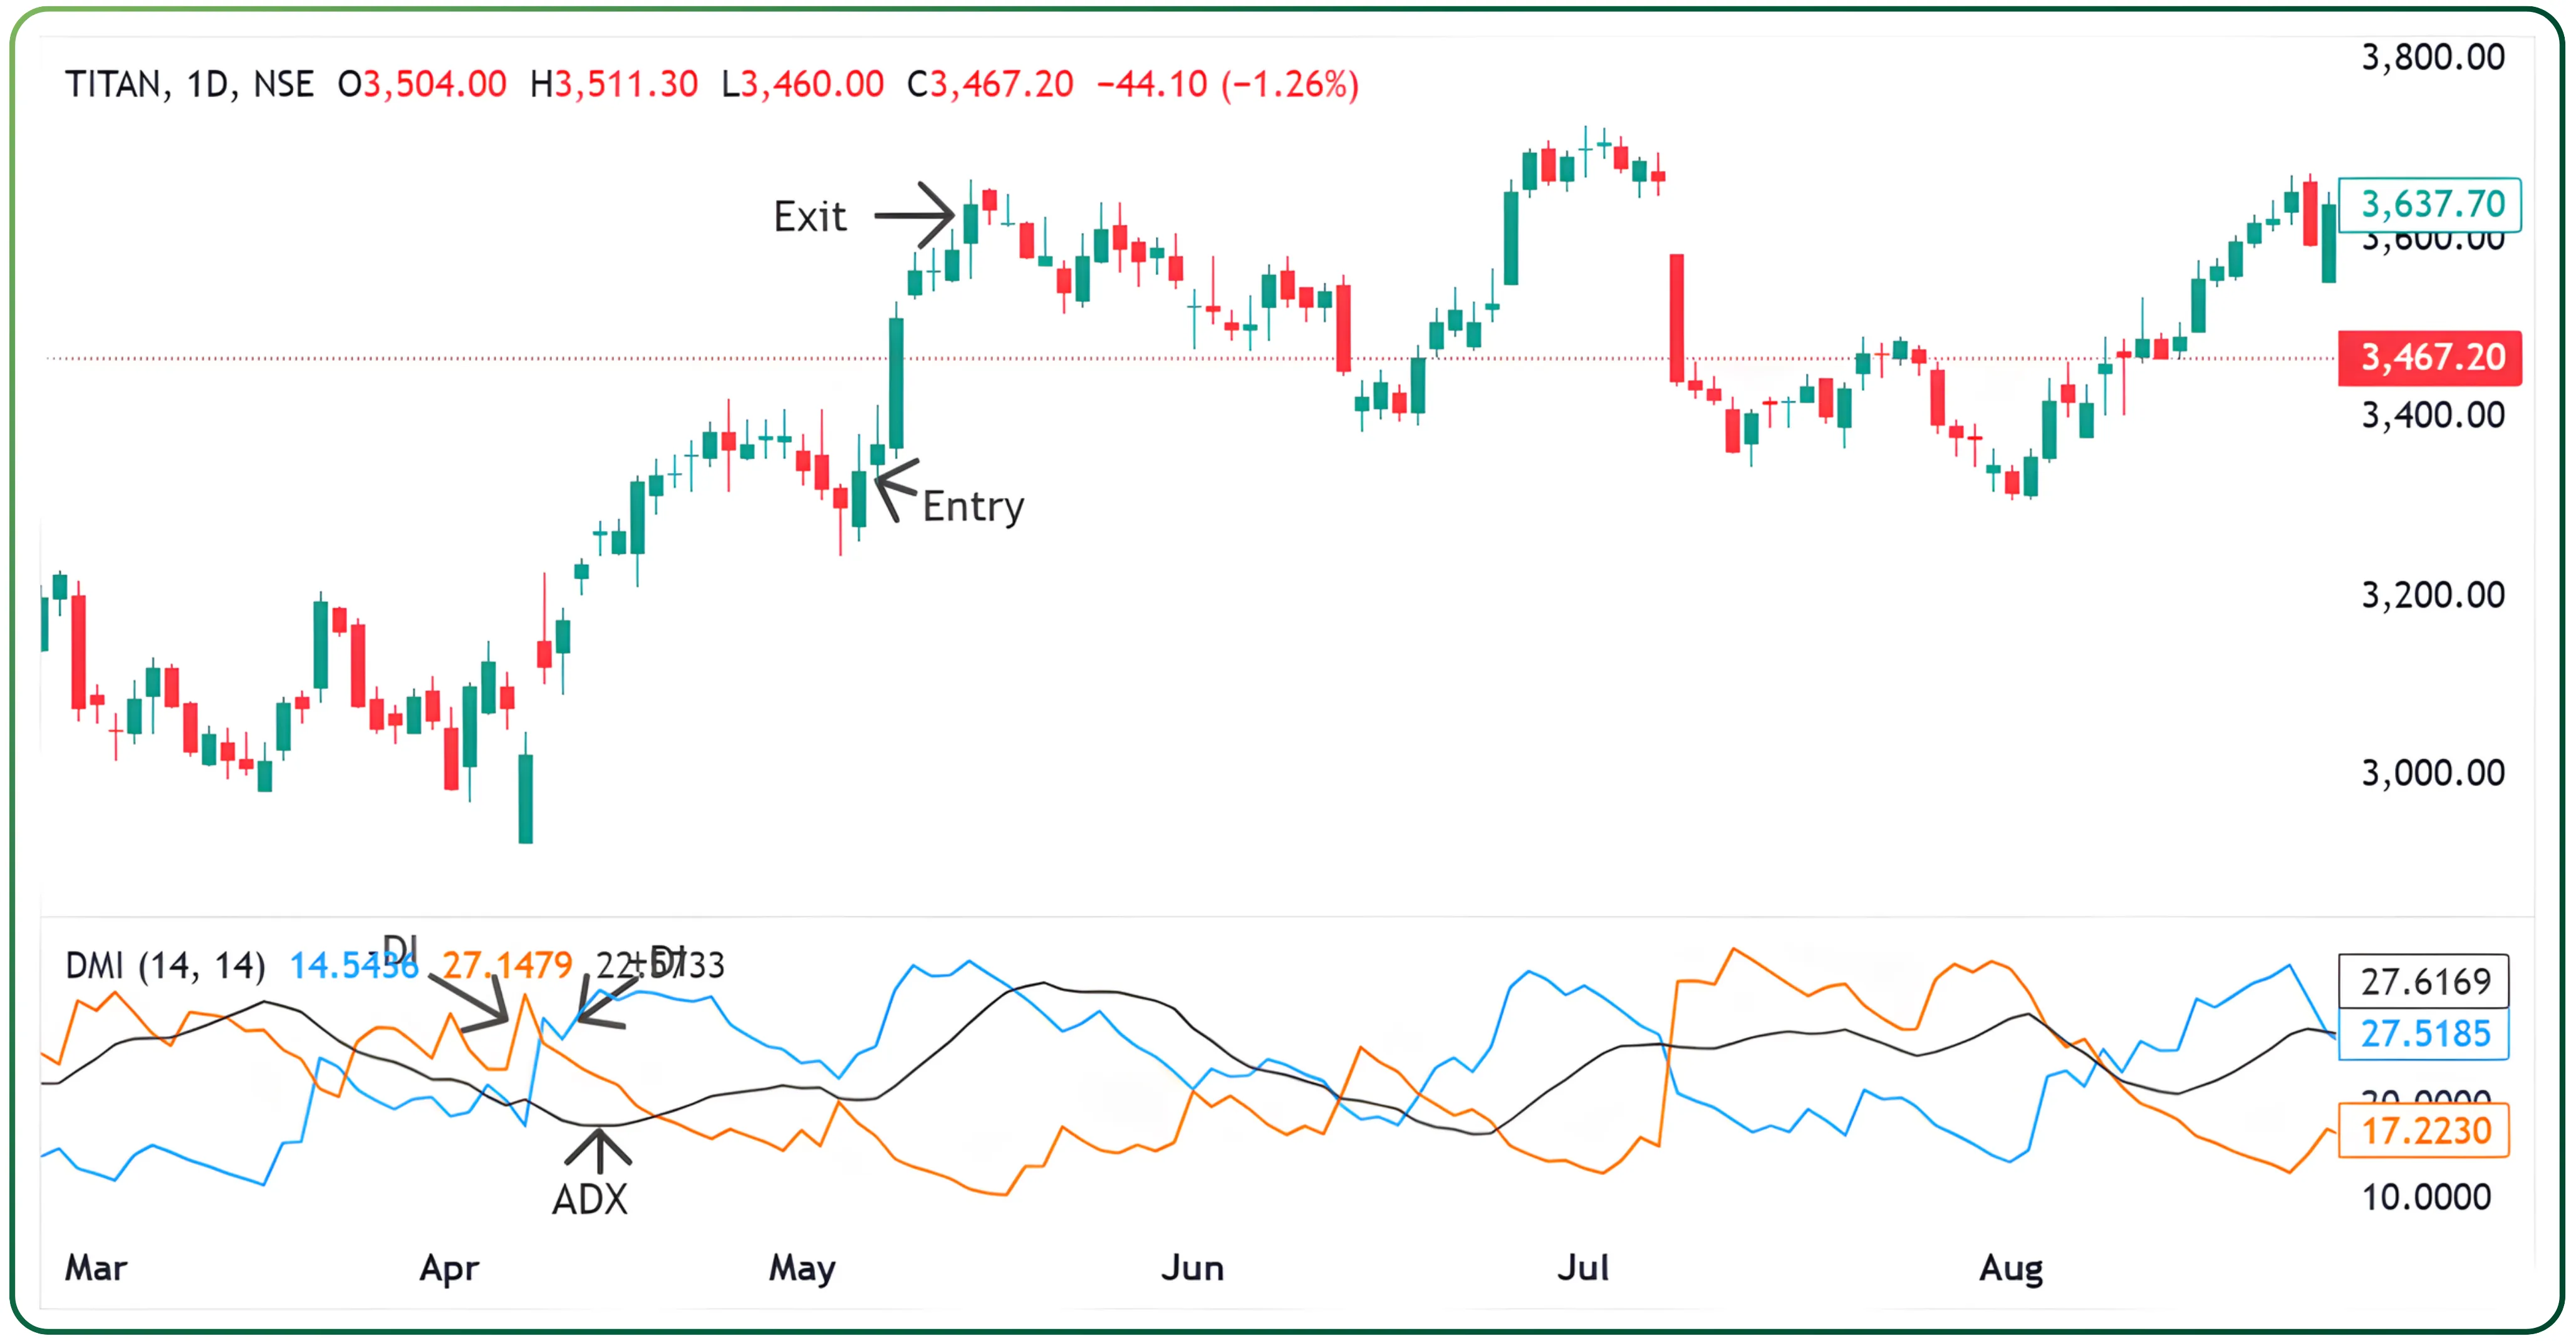
For instance, on the TITAN chart dated 8th April 2025, the +DI was positioned above the –DI, indicating an ongoing uptrend. However, the ADX remained flat, suggesting that trend strength was not yet confirmed. By 9th May 2025, the ADX began to rise, validating the strength of the move. This triggered a long entry around ₹3,400, with the trade closing near ₹3,630—yielding a gain of roughly 230 points. A stop-loss could be placed at the nearest resistance level or managed using a 1:2 risk–reward ratio, depending on the trader’s preferred strategy.
How ADXR confirms ADX signals in trend trading
How to read ADXR-
Below 20: Weak or range-bound market.
20–40: Healthy trend developing.
Above 40: Strong trend, but watch for potential exhaustion.
The ADXR complements this by smoothing fluctuations and confirming whether the market’s strength is sustained.
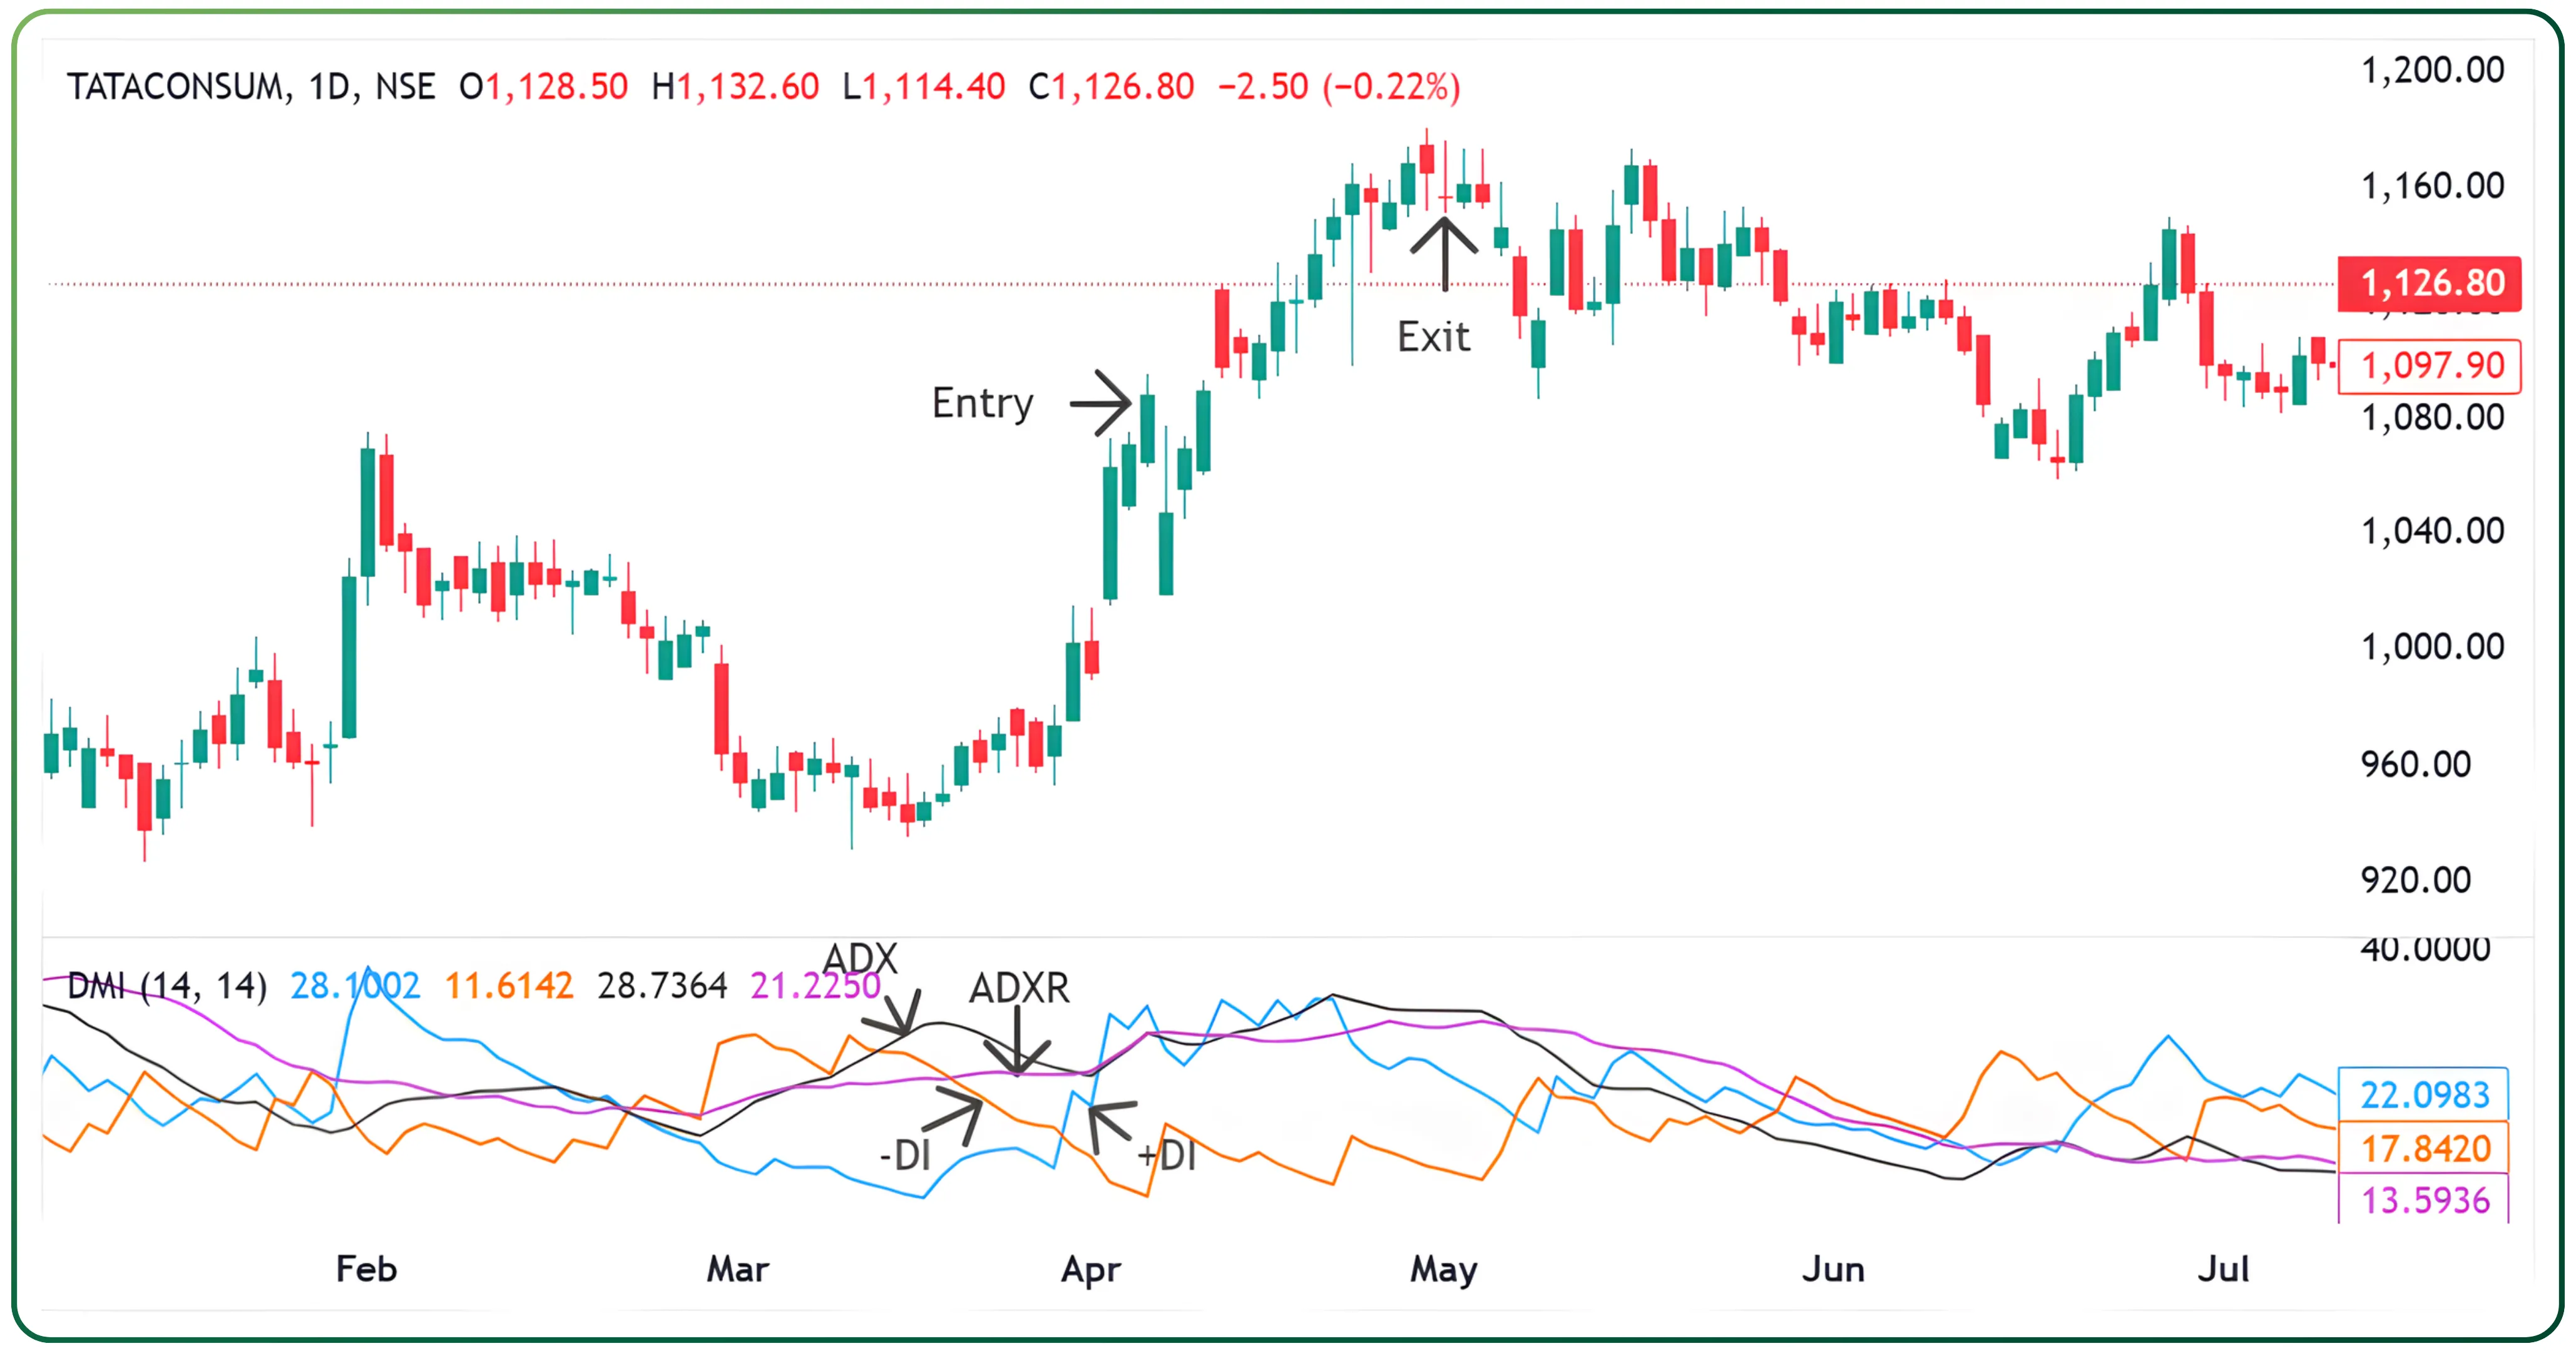
For instance, in the TATACONSUM chart on 4th April 2025, the +DI crossed above the –DI while the ADX was rising, signaling the start of a potential uptrend. At the same time, the ADXR was trading around the 30 level, providing strong confirmation that the trend was sustainable. This setup triggered a long entry near ₹1,075, with an exit around ₹1,185, capturing a gain of 90 points. This illustrates how ADXR can be effectively used to validate market strength and improve trade confidence.
Also read: A Reliable Intraday Gap-Up & Gap-Down Strategy Using the 20 EMA
DMI crossovers and trading signals
Wilder’s DMI crossovers form the heart of this trading strategy:
Buy Signal: When +DI crosses above -DI.
Sell Signal: When +DI crosses below -DI.
But Wilder added a safeguard known as the Extreme Point Rule. On the day of the crossover, don’t jump in immediately. Instead, note the extreme point (the day’s high if it’s a buy signal or the day’s low if it’s a sell signal). Only enter the trade if the price breaks that extreme point the next day. This reduces false signals and avoids being whipsawed in a sideways market.
Also read: How to Use the Chaikin Oscillator for Trading Success
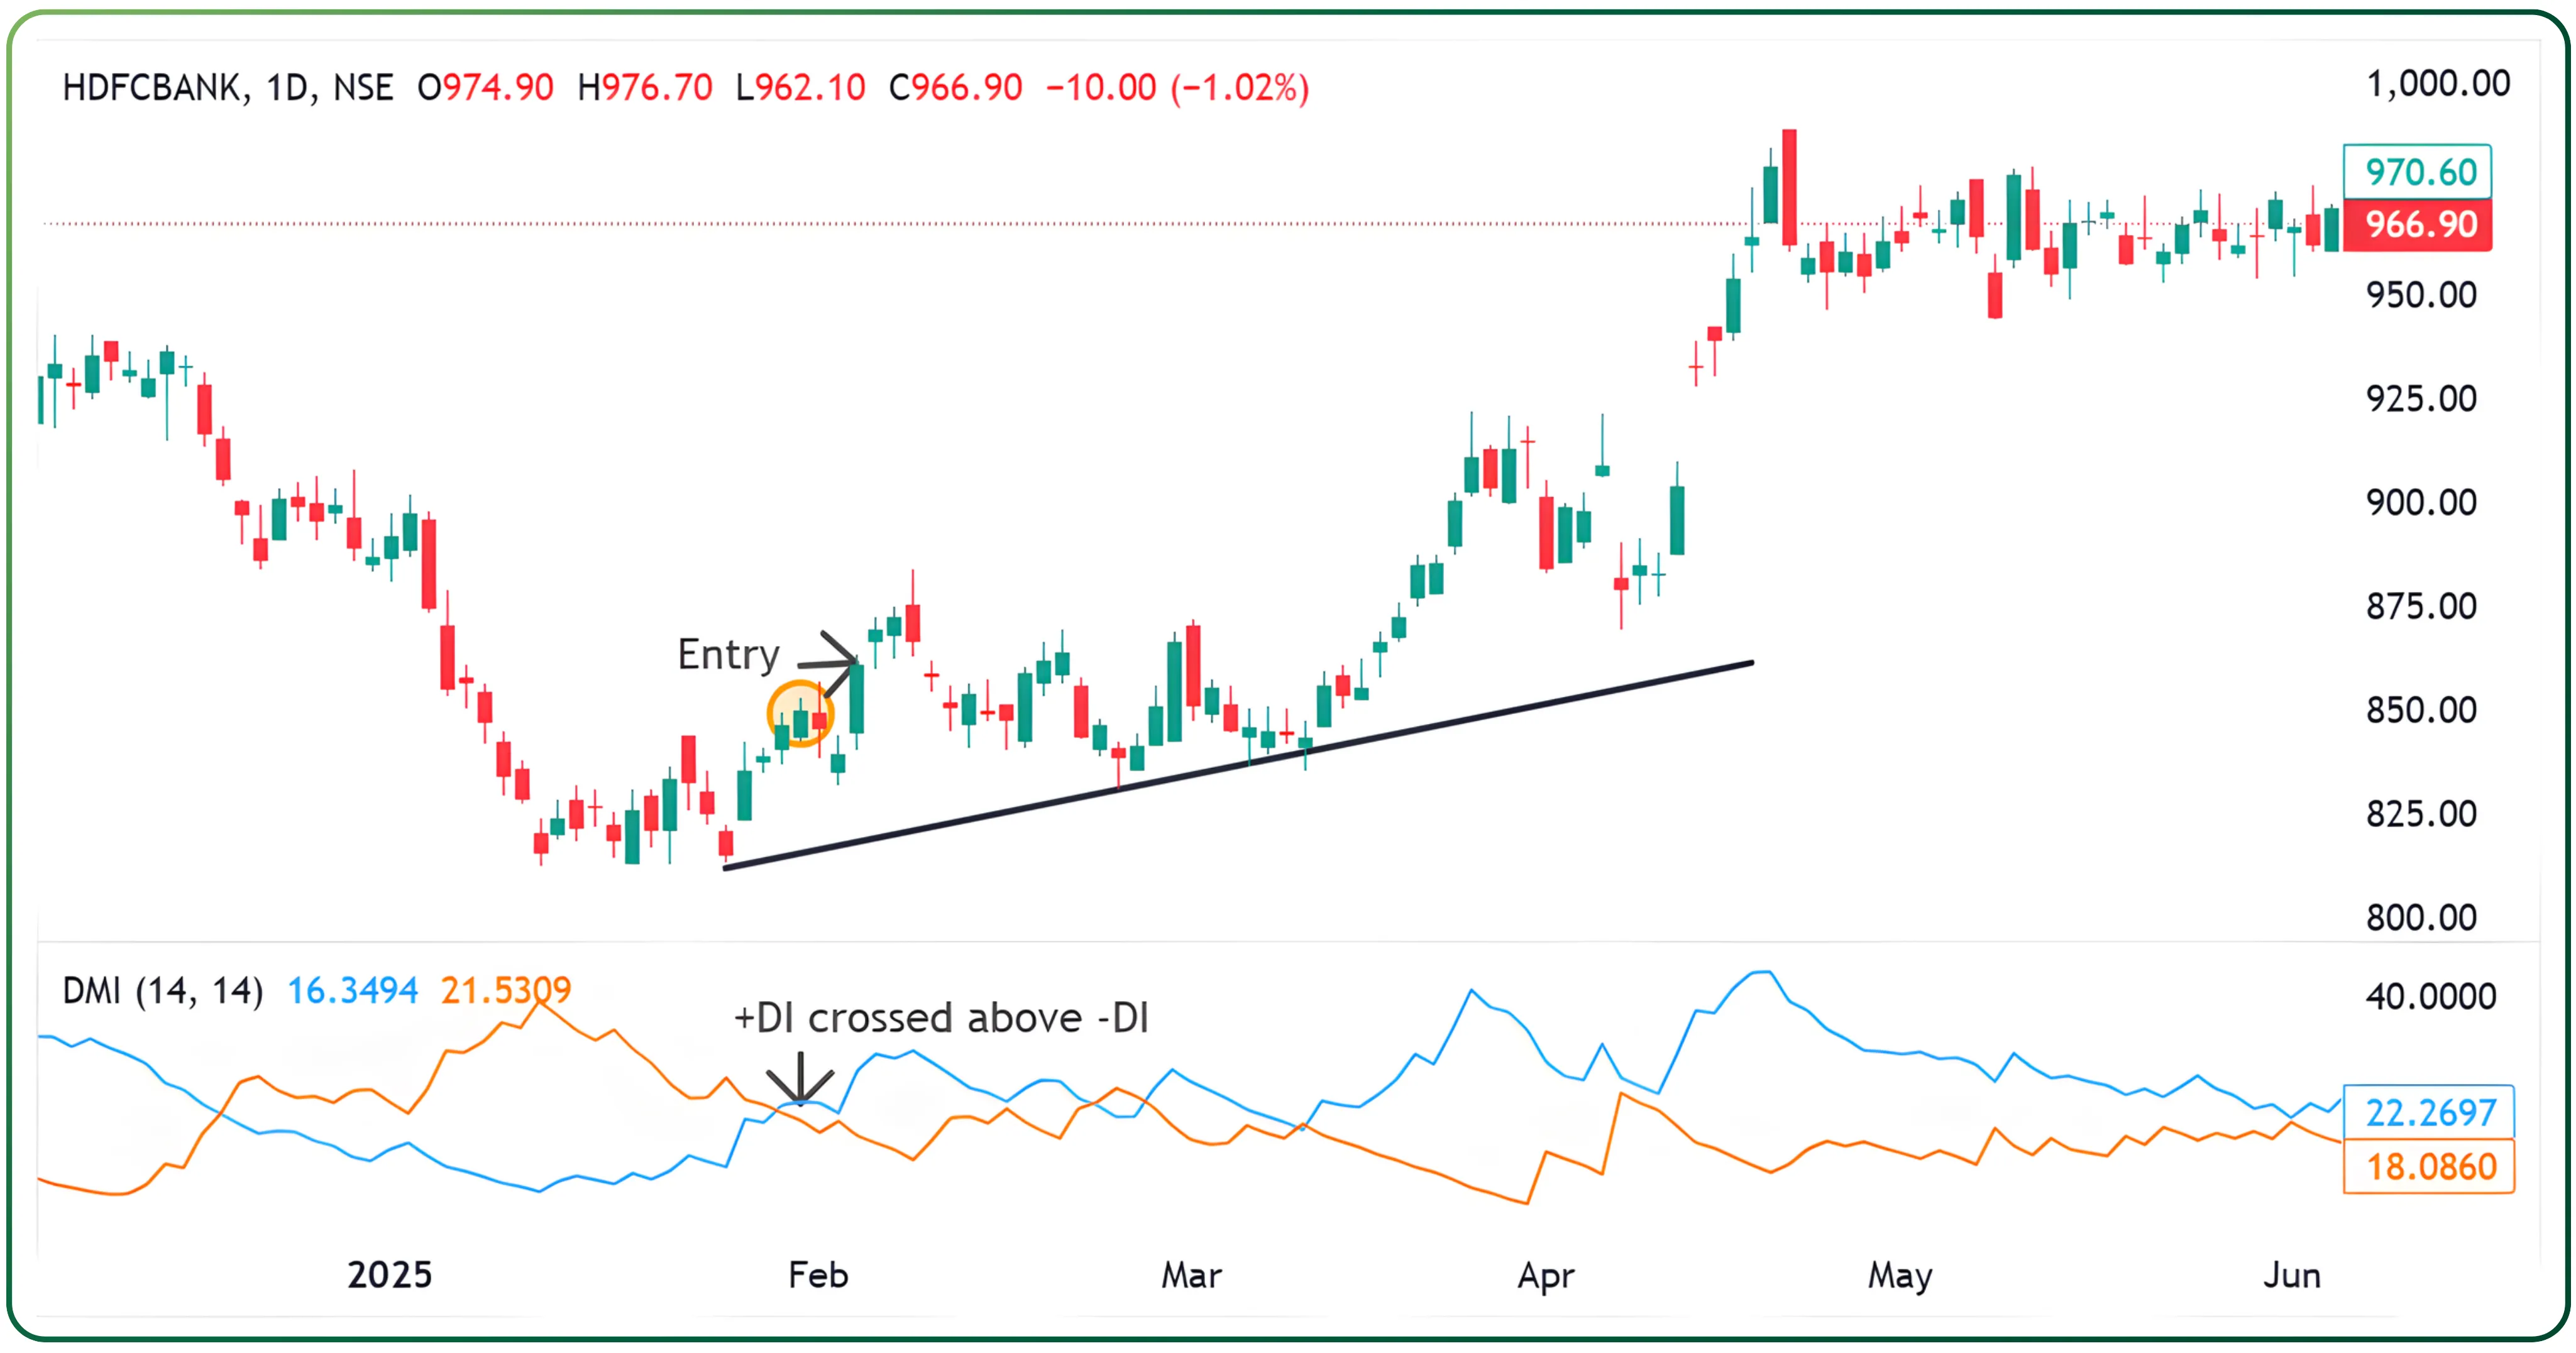
As seen on the HDFCBANK chart on 31st Jan 2025, the +DI crossed above the –DI, but an entry should not be taken immediately at the crossover. Instead, the entry is triggered only when the high of the crossover candle is broken. This approach helps filter out false signals and avoids trades during sideways market conditions.
As seen on the INDUSINDBK chart on 25th July 2025, the -DI crossed above the +DI, but an entry should not be taken immediately at the crossover. Instead, the entry is triggered only when the low of the crossover candle is broken. This approach helps filter out false signals and avoids trades during sideways market conditions.
ADX trading strategy in action
Let’s make this more practical with some examples of ADX scans used by traders:
ADX Crossing 25 from Below: Signals the start of a trending phase.
ADX Crossing 25 from Above: Suggested trend is weakening, moving into consolidation.
ADX Crossing 40 from Below: Market is entering a strong trend zone.
+DI Crossing –DI from Below: Bullish signal, probable start of an uptrend.
+DI Crossing –DI from Above: Bearish signal, probable start of a downtrend.
Traders can also look for +DI or –DI crossing the 25 level, which often indicates continuation of the existing momentum.
Why use the Directional Movement Indicator?
Markets only trend about 30% of the time, while the other 70% is spent in consolidation or range-bound moves. Without a tool like the DMI, it’s easy to chase trades that go nowhere. By combining +DI, -DI, ADX, and ADXR, traders get a clearer picture of:
Whether a trend exists.
How strong the trend is.
When to enter or exit trades.
This makes the DMI and ADX system not just a momentum indicator but also a trend strength indicator that can keep traders on the right side of the market.
Filtering noise and capturing strong trends
The Directional Movement Index is a classic tool in technical analysis, but it remains highly relevant today. Whether you’re trading stocks, forex, or commodities, using the ADX indicator in your trading strategy helps filter out noise, identify genuine trends, and avoid getting stuck in a range-bound market.
By respecting the Extreme Point Rule and watching how +DI and -DI interact with ADX, traders can confidently position themselves in the direction of the market’s strongest moves, just as J. Welles Wilder intended.
Disclaimer: The information provided in our blogs is for informational purposes only and should not be construed as financial, investment, or trading advice. Trading and investing in the securities market carries risk. Always conduct your own research and consult with a qualified financial advisor before making any investment decisions. Past performance is not indicative of future results. Copyrighted and original content for your trading and investing needs.
© 2025 — Tradejini. All Rights Reserved.