


In trading, volume often speaks louder than price. While price can sometimes be misleading, volume reveals whether money is truly flowing into or out of a security. This is where the Chaikin Oscillator stands out. It helps traders measure momentum by showing changes in buying and selling pressure, offering an early indication of potential reversals.
The Chaikin Oscillator is especially useful for those who want to catch trend changes early. It combines price and volume into a single visual that reveals the underlying strength or weakness in a stock’s move. Whether you are looking for a better entry point or trying to time your exit more precisely, this tool can add significant value to your trading decisions.
Understanding the logic behind the Chaikin Oscillator
The Chaikin Oscillator was developed by Marc Chaikin and is based on a simple but powerful assumption: price and volume typically move together. When this relationship breaks down, it often signals a potential shift in trend.
The indicator is built on the Accumulation/Distribution Line (ADL), which attempts to quantify whether a stock is being accumulated (bought) or distributed (sold) based on its price and volume.
Here is how the ADL calculated:
ADL = [(Close – Low) – (High – Close)] × Volume ÷ (High – Low)
This formula calculates the money flow volume for the day. A positive value indicates buying pressure, while a negative one suggests selling pressure.
The Chaikin Oscillator is then calculated by subtracting a 10-day simple moving average of the ADL from a 3-day simple moving average of the ADL:
Chaikin Oscillator = 3-day SMA of ADL – 10-day SMA of ADL
The result is a line that fluctuates above and below zero, capturing short-term shifts in volume momentum.
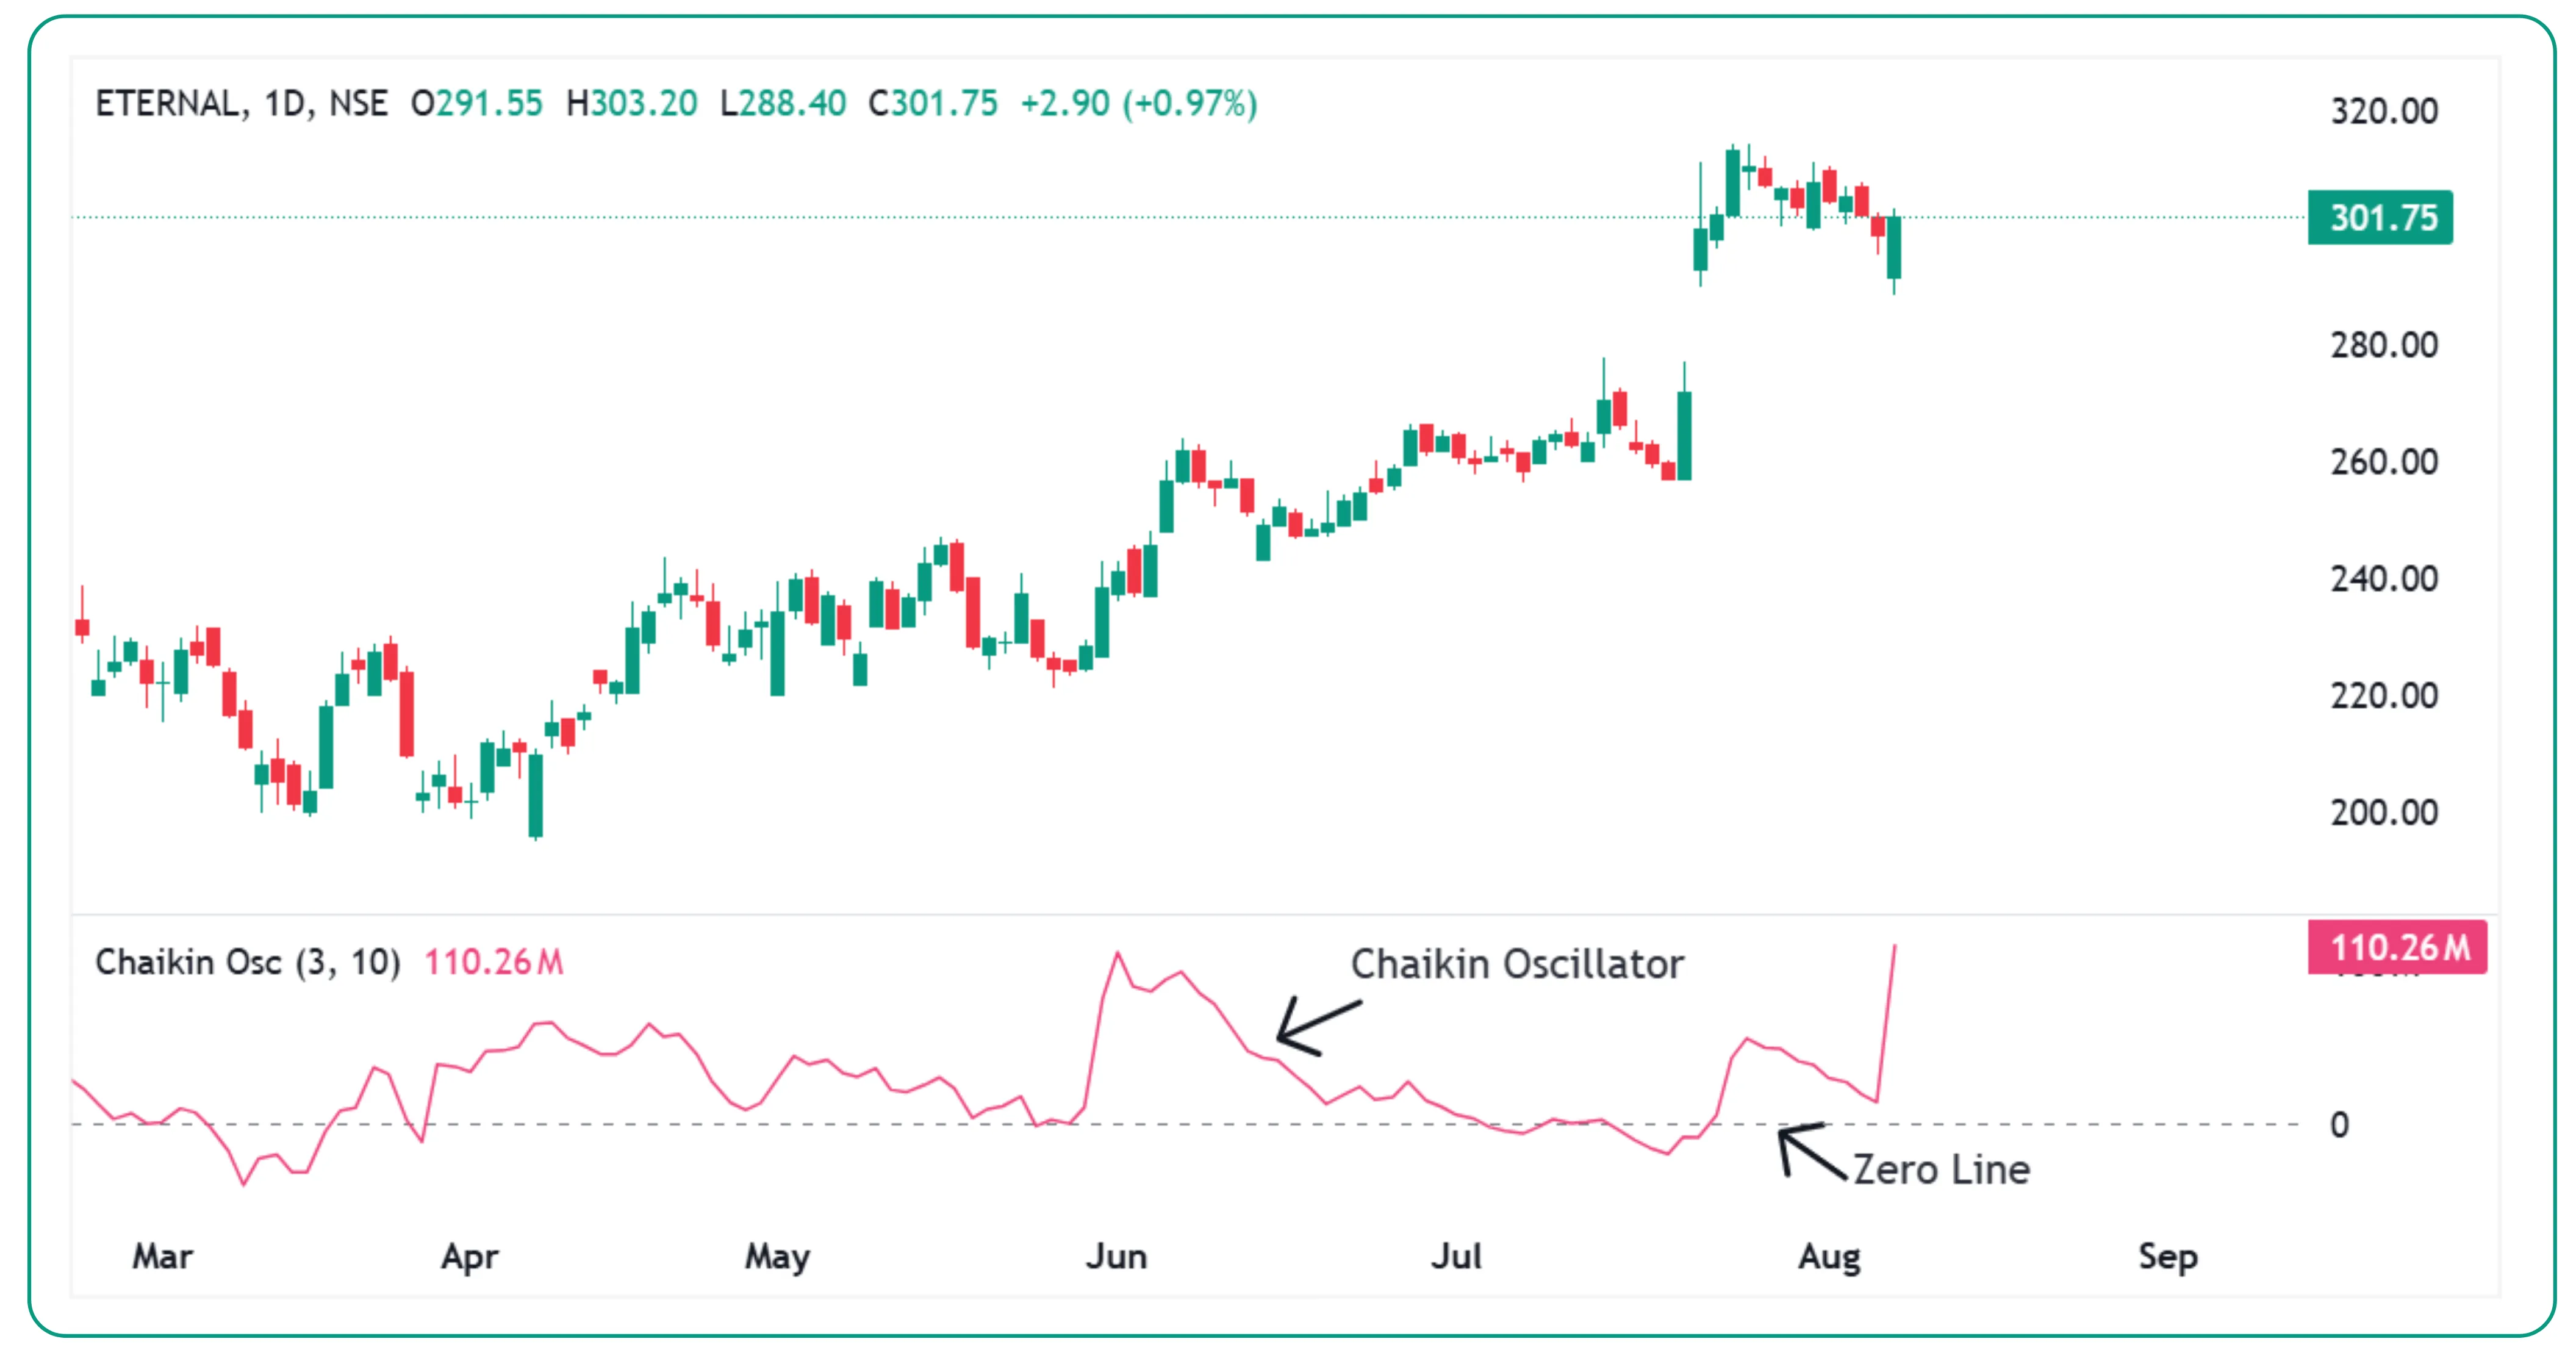
What the Oscillator tells you
At its core, the Chaikin Oscillator shows whether volume is flowing into or out of a security. This helps traders confirm whether a price trend is backed by strong buying or selling interest.
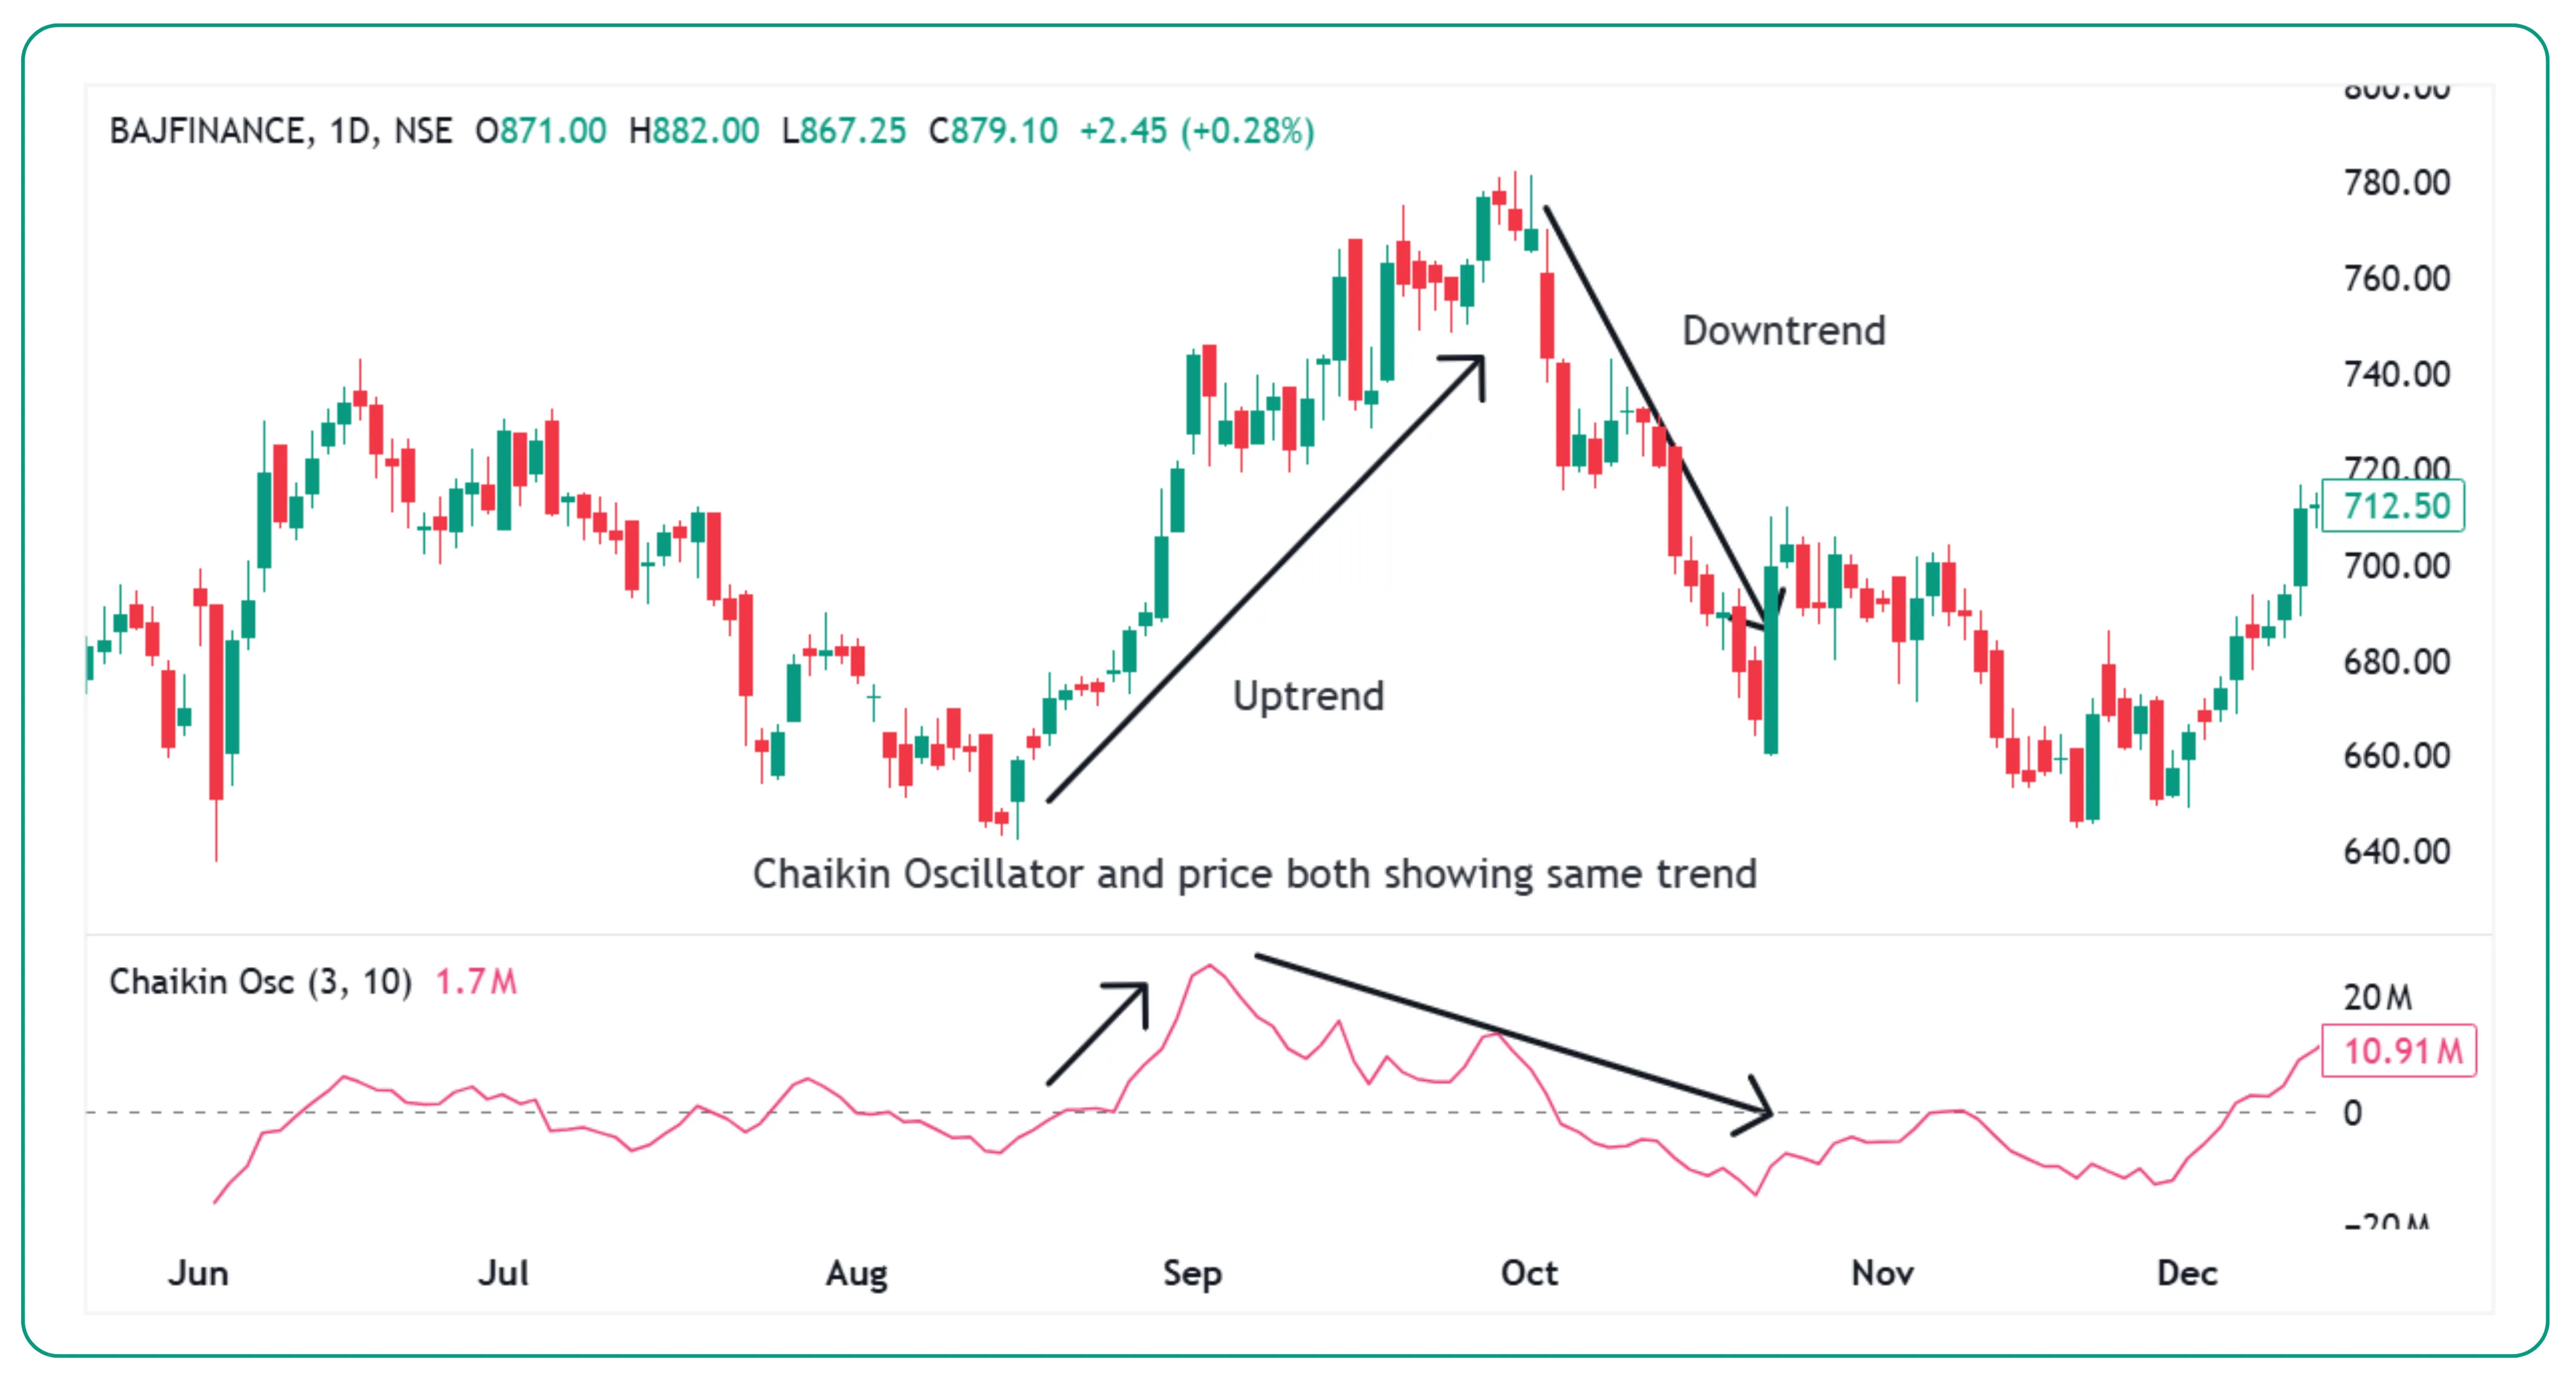
When the oscillator is rising, it indicates growing accumulation. When it is falling, it suggests distribution or selling pressure. A strong upward move in the oscillator can confirm bullish sentiment, while a sharp decline may validate bearish momentum.
For example, on the Bajaj Finance chart, the Chaikin Oscillator turned upward on 16th August 2024, indicating improving buying momentum. The Price action followed in the same direction, confirming the signal. Later, on 27th September 2024, the oscillator turned downward and formed a lower high, pointing to weakening accumulation. The price also moved lower in line with this shift, reinforcing the bearish indication.
Divergences: The most powerful signal
One of the most valuable uses of the Chaikin Oscillator is spotting divergences between the oscillator and price.
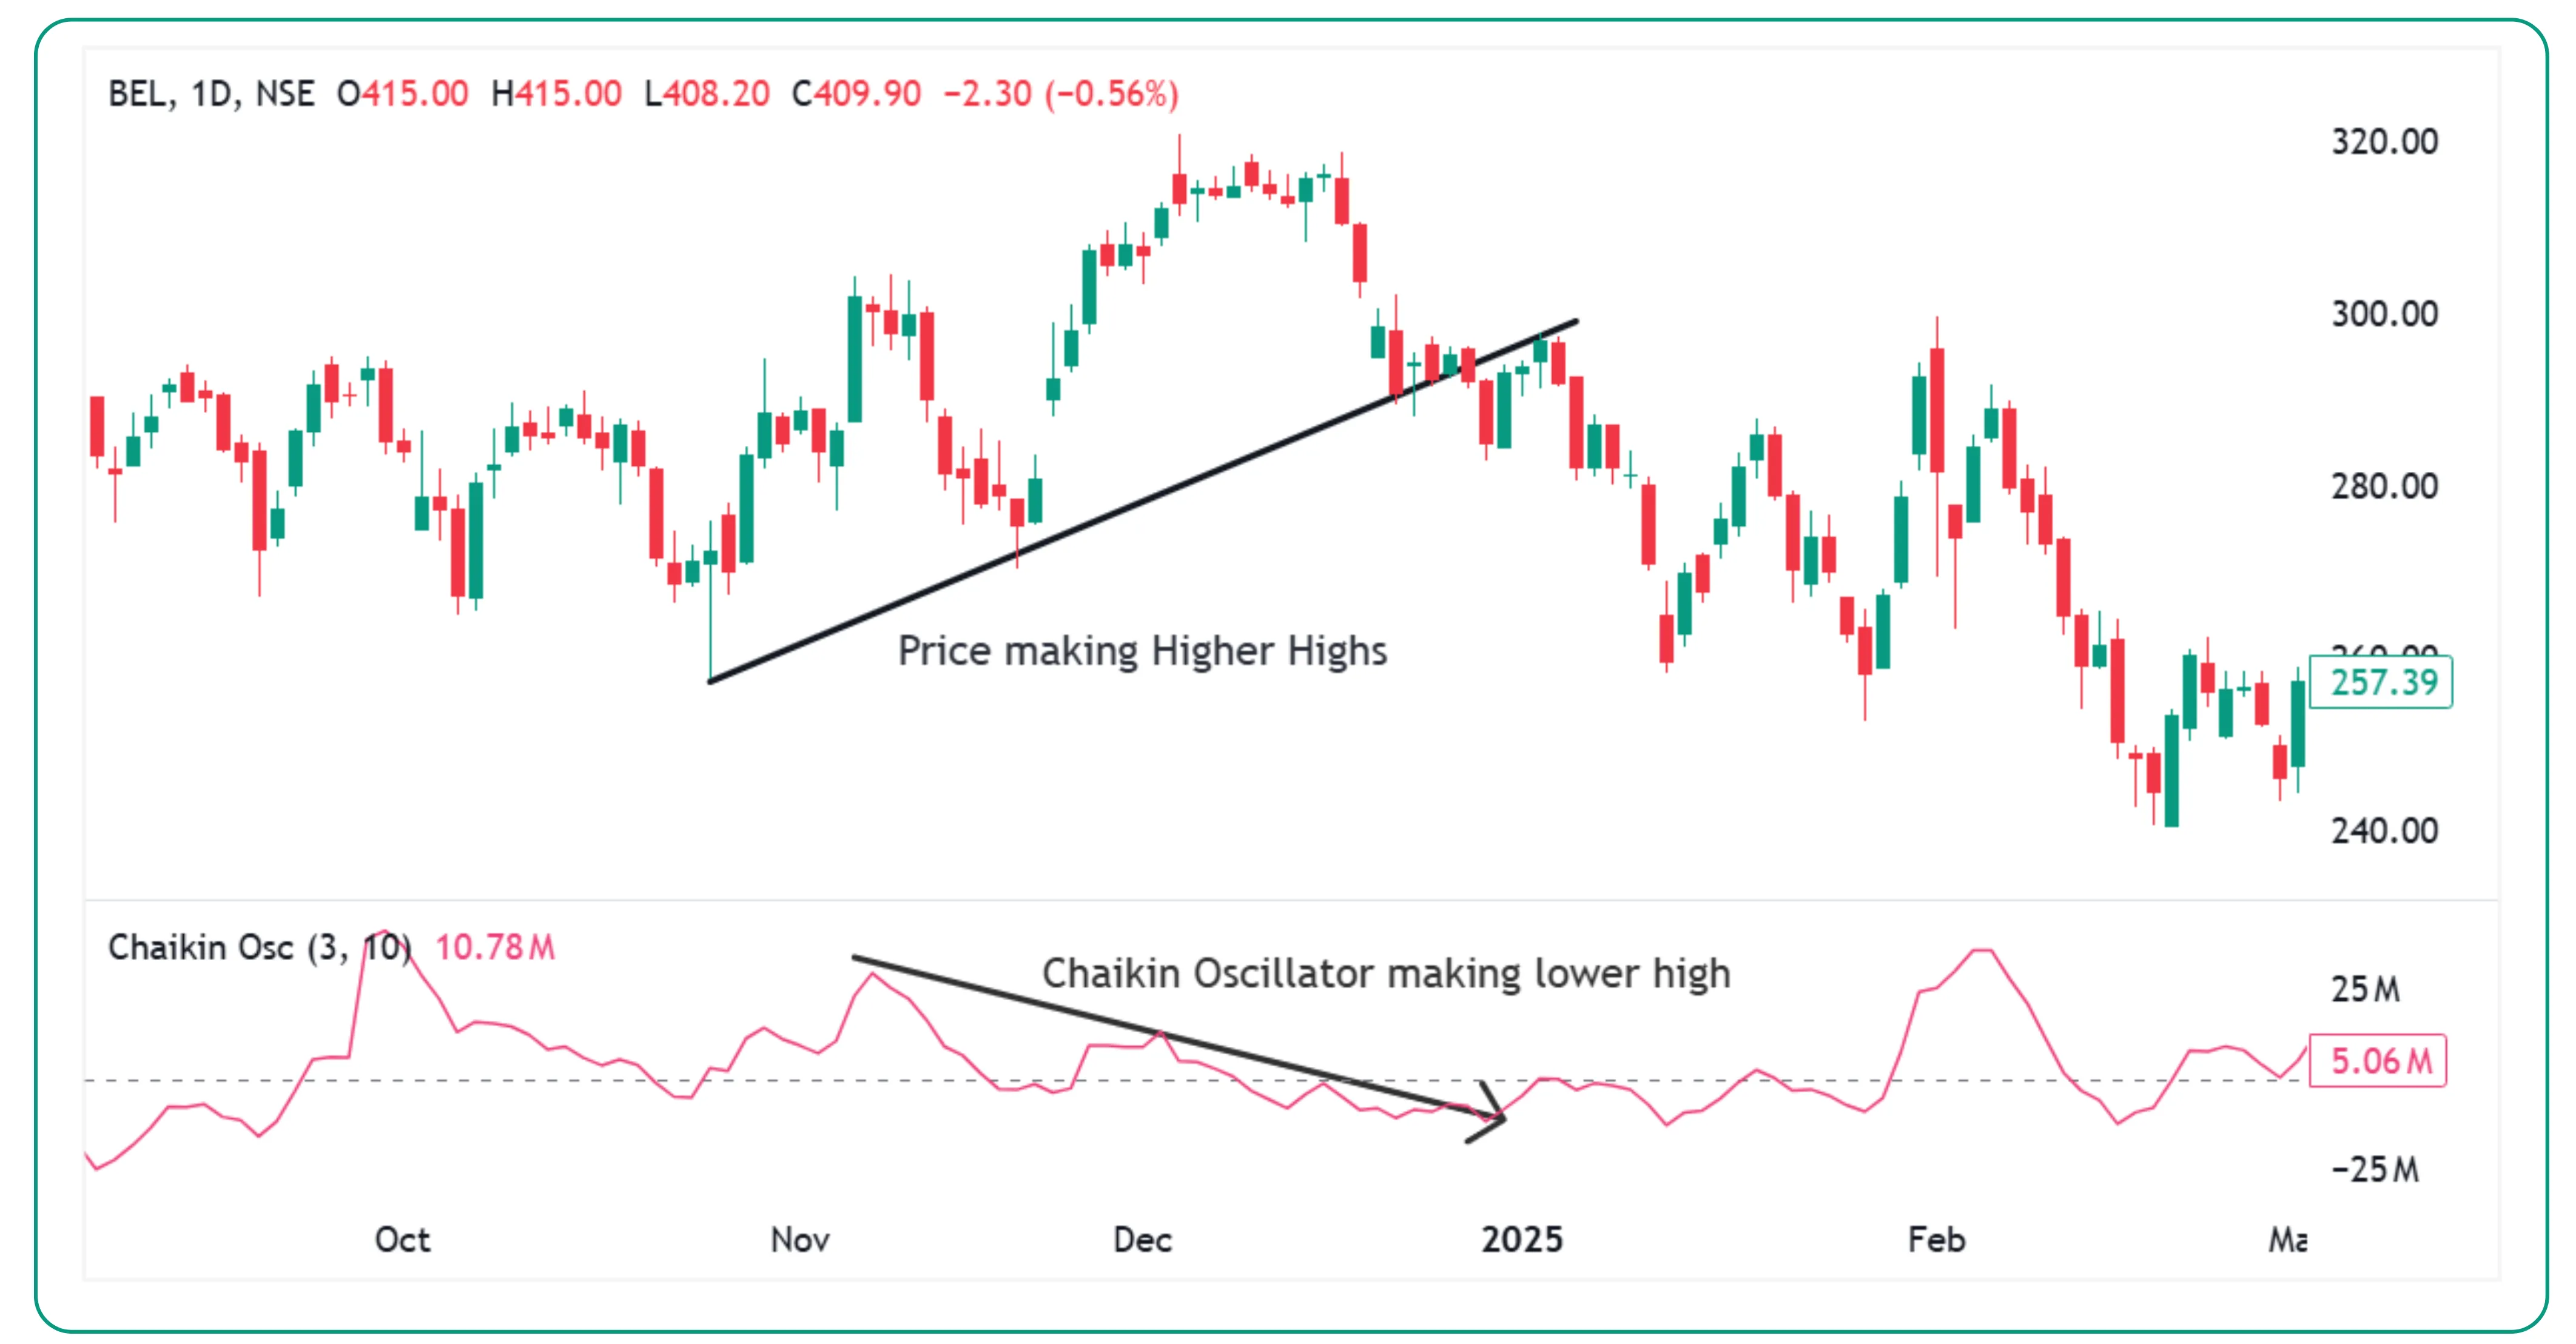
A bearish divergence occurs when the price makes a new high, but the oscillator fails to do so and instead turns downward. This suggests weakening momentum and may signal that the trend is running out of strength.
On the other hand, a bullish divergence forms when the price hits a new low, but the oscillator does not and instead begins to rise, indicating that the downtrend may be nearing exhaustion.
These divergence signals are often seen as early warnings of potential reversals and can be especially useful when used in combination with other technical indicators or support and resistance levels.
For instance, on the BEL chart, the Chaikin Oscillator formed a lower low on 7th November and again on 3rd December 2024, suggesting weakening accumulation and potential bearish momentum. However, the price moved higher during this period and formed a higher high, creating a clear bearish divergence. This indicated that the price rise was not backed by strong volume support. The divergence acted as an early warning, and from 17th December 2024 onward, bearish candles appeared, and the stock began to decline, aligning with the signal from the indicator.
Directional changes and moving average confirmation
Beyond divergences, the Chaikin Oscillator can also give useful signals when it changes direction around key levels.
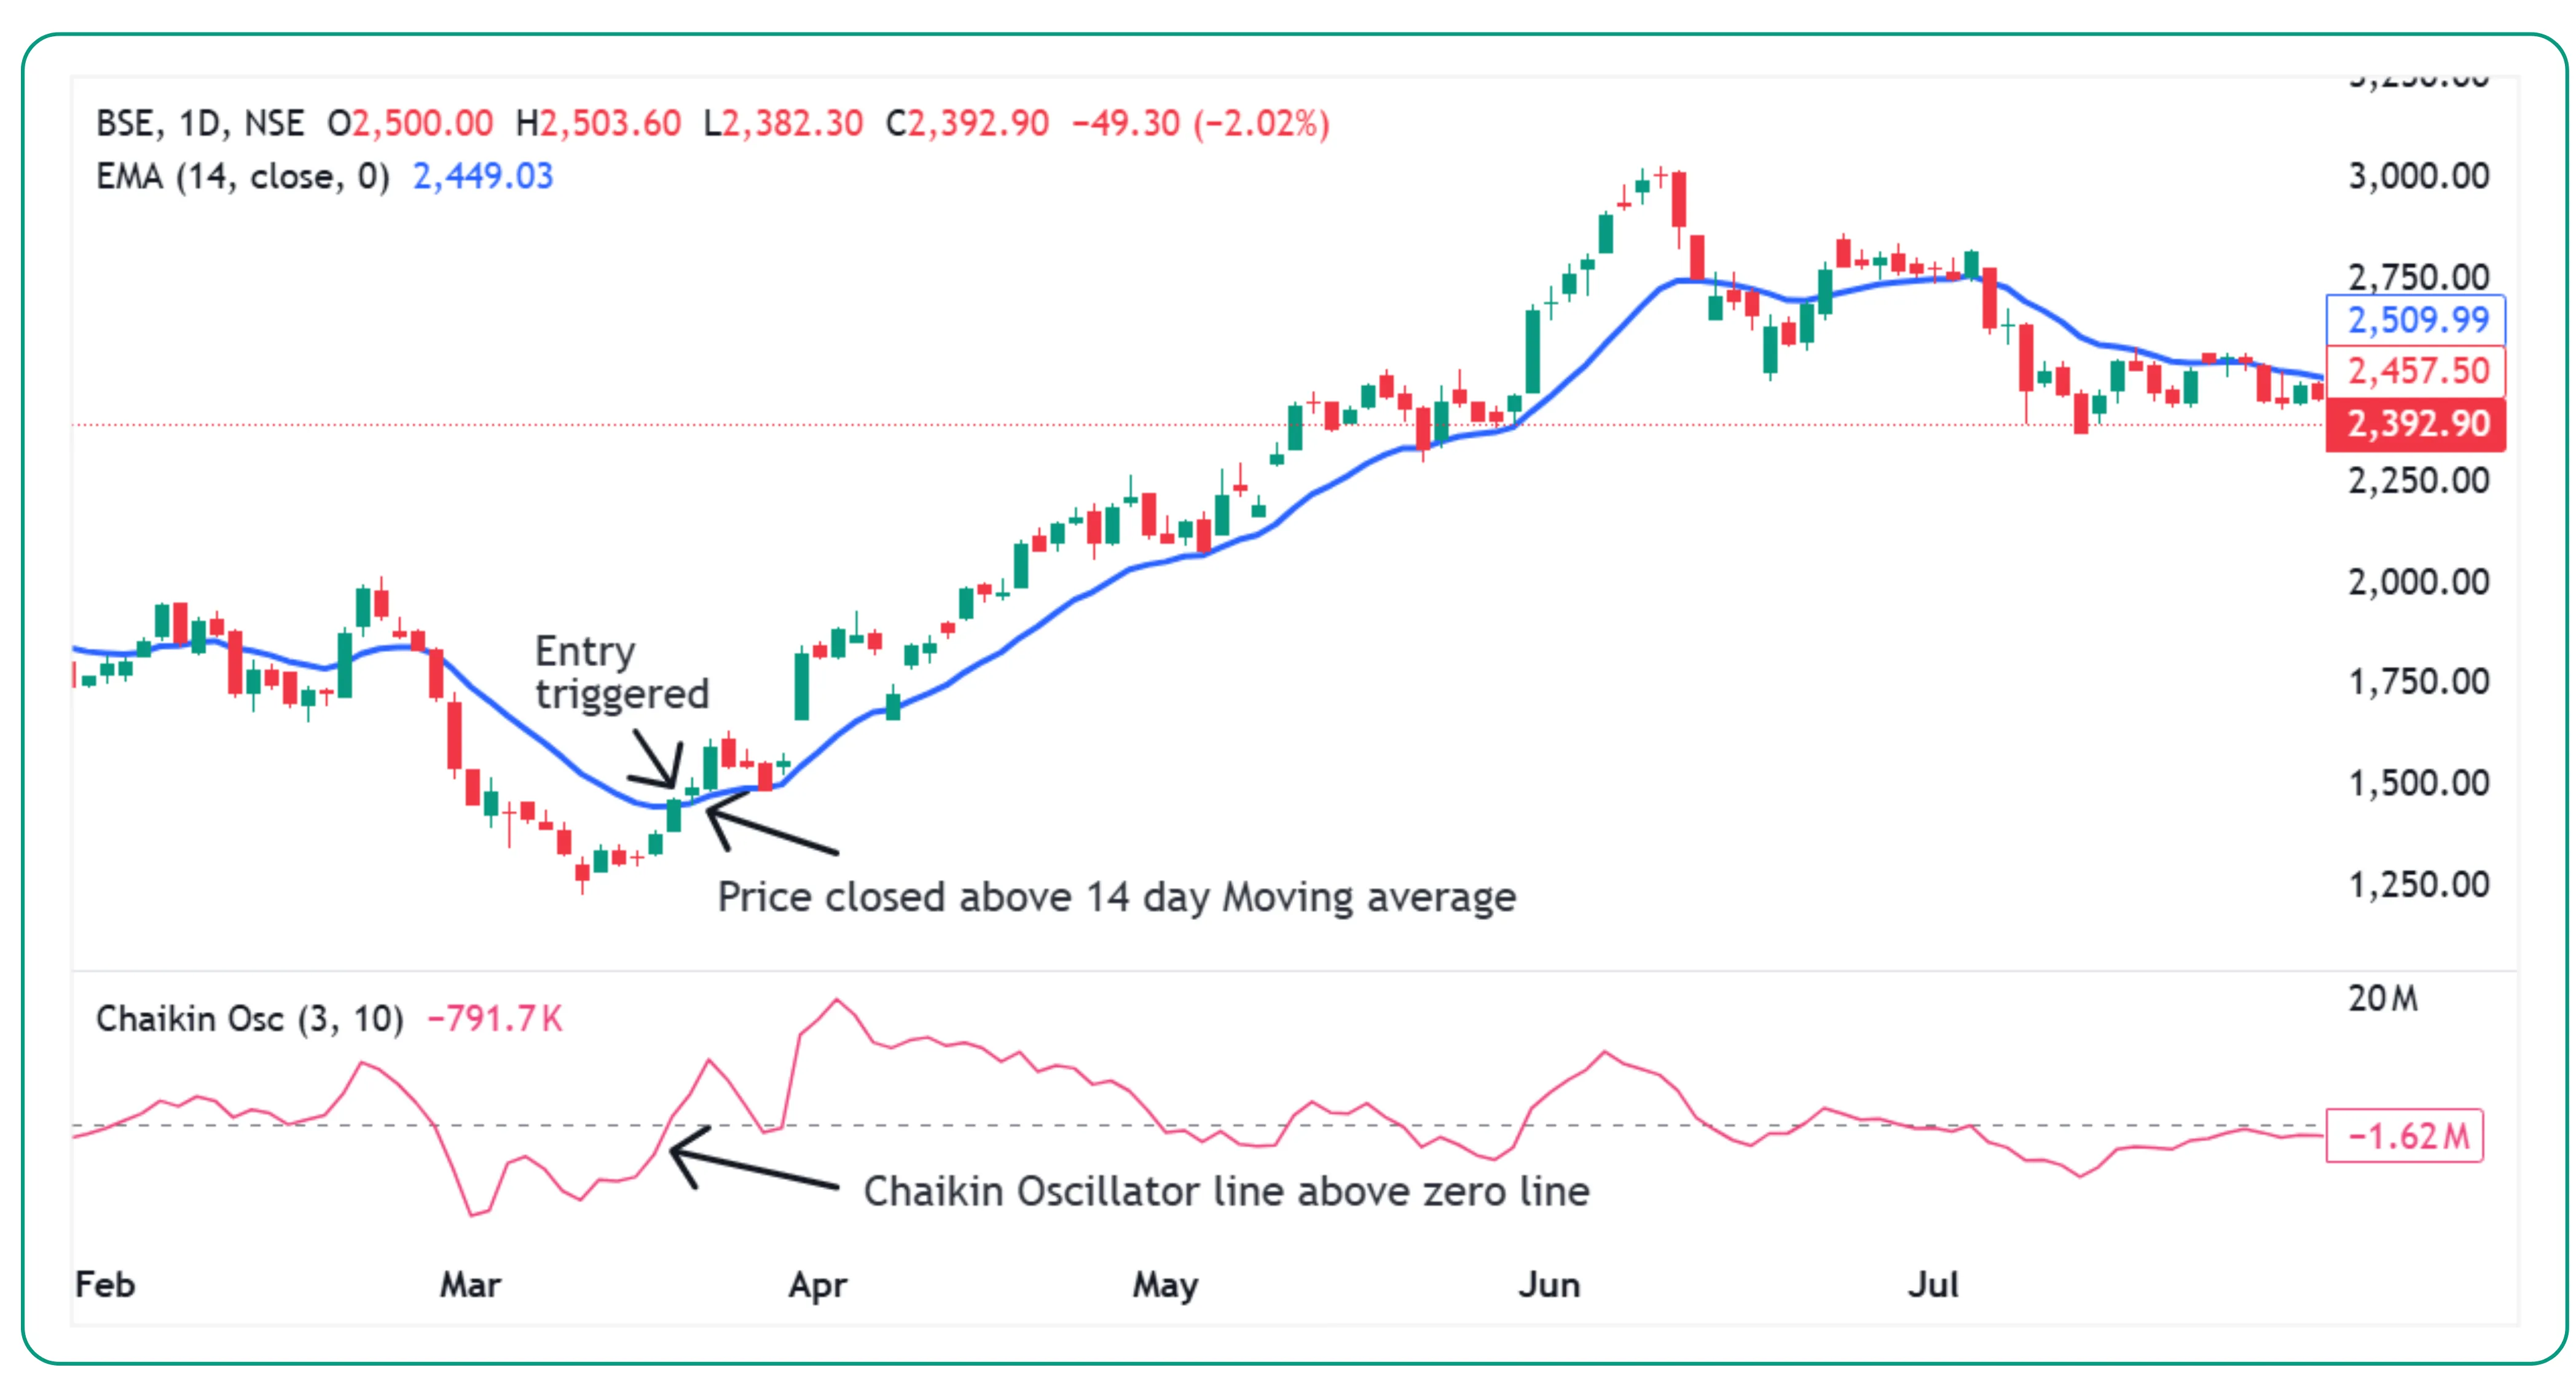
A buy signal is typically generated when all of the following conditions are met:
The price of the security is above its 14-day exponential moving average (EMA).
The oscillator turns upwards.
The oscillator value is turning upward from negative territory.
This combination suggests that the stock is likely in an uptrend and that the recent weakness may be ending, supported by increasing volume.
On 20 March 2025, on the BSE chart, the Chaikin Oscillator line moved from negative to positive territory, while the price closed above the 14-day moving average, generating a buy signal for the stock.
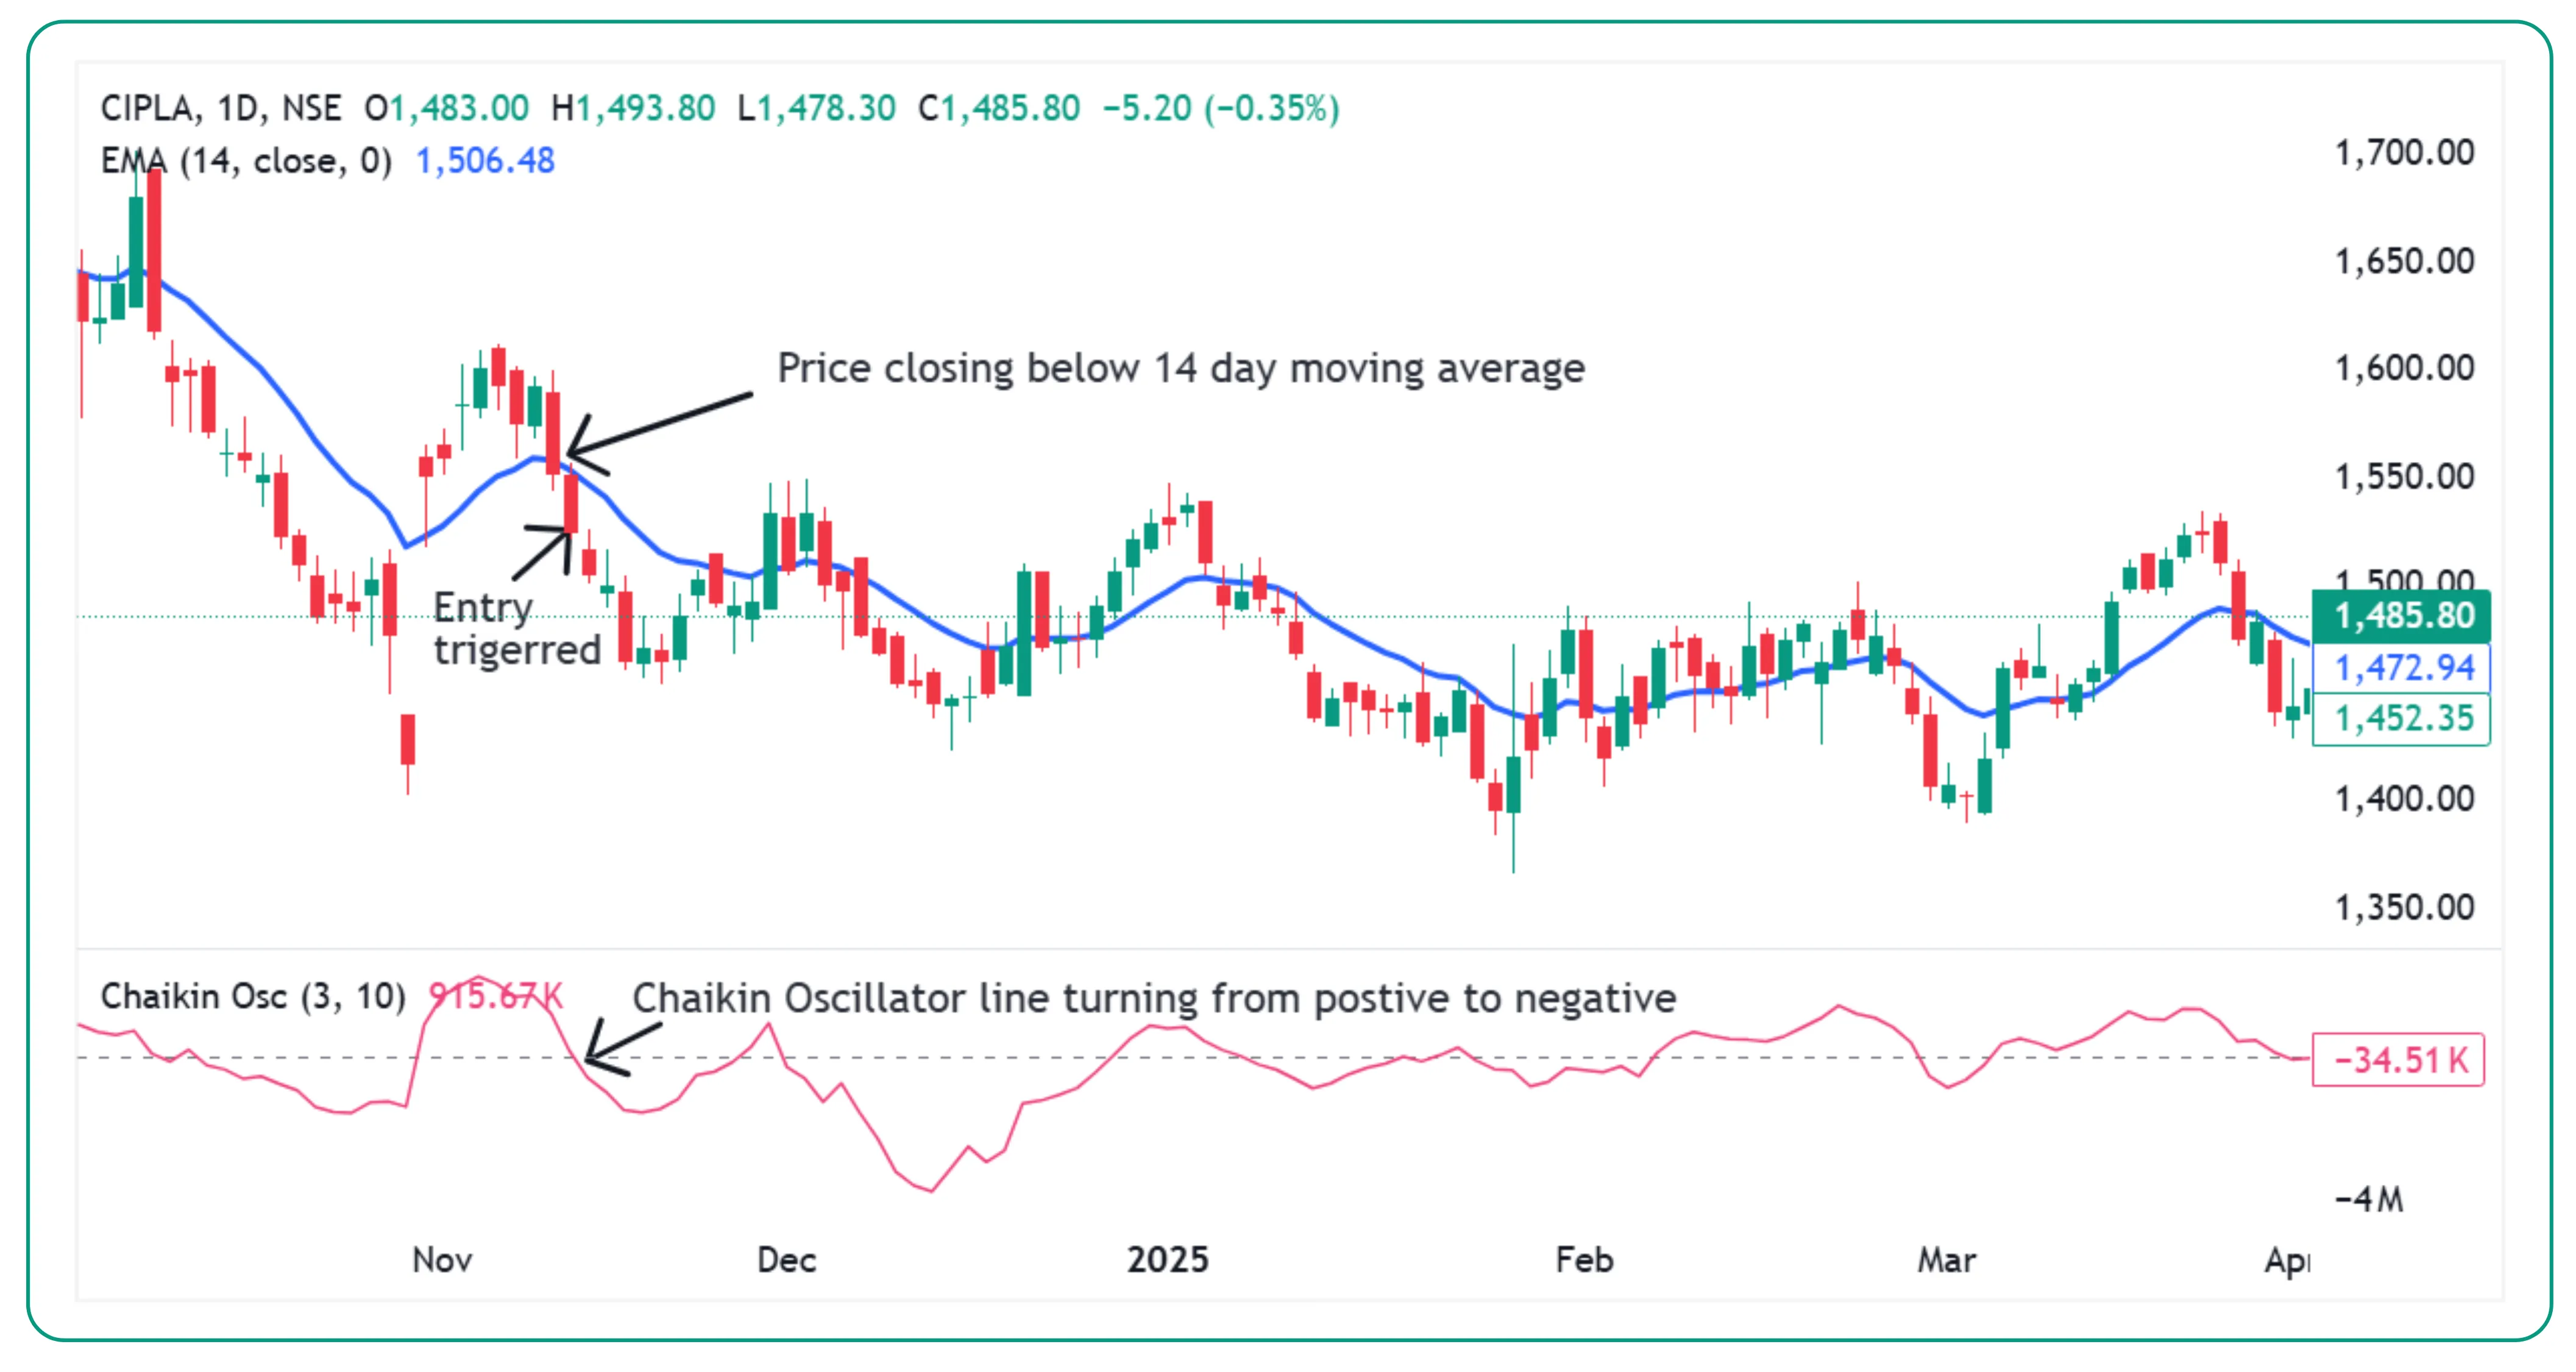
A sell signal is generated when all of the following conditions are met:
The price is below the 14-day exponential moving average (EMA).
The oscillator turns downward.
The oscillator value is turning downward from positive territory.
This setup indicates that, despite recent gains, volume pressure is shifting, and a reversal could be near.
On 12 November 2024, on the CIPLA chart, the Chaikin Oscillator line crossed from positive to negative territory, while the price also closed below the 14-day exponential moving average. This indicated a sell signal for the stock.
Applying the indicator effectively
To get the most from the Chaikin Oscillator, it should not be used in isolation. It works best when combined with other forms of analysis such as trendlines, support and resistance levels, candlestick patterns, or volume spikes.
For example, if a bullish divergence appears just as the price tests a key support level, it could offer a high-confidence long trade. Similarly, a bearish divergence near a resistance level might signal a good opportunity to exit or short the position.
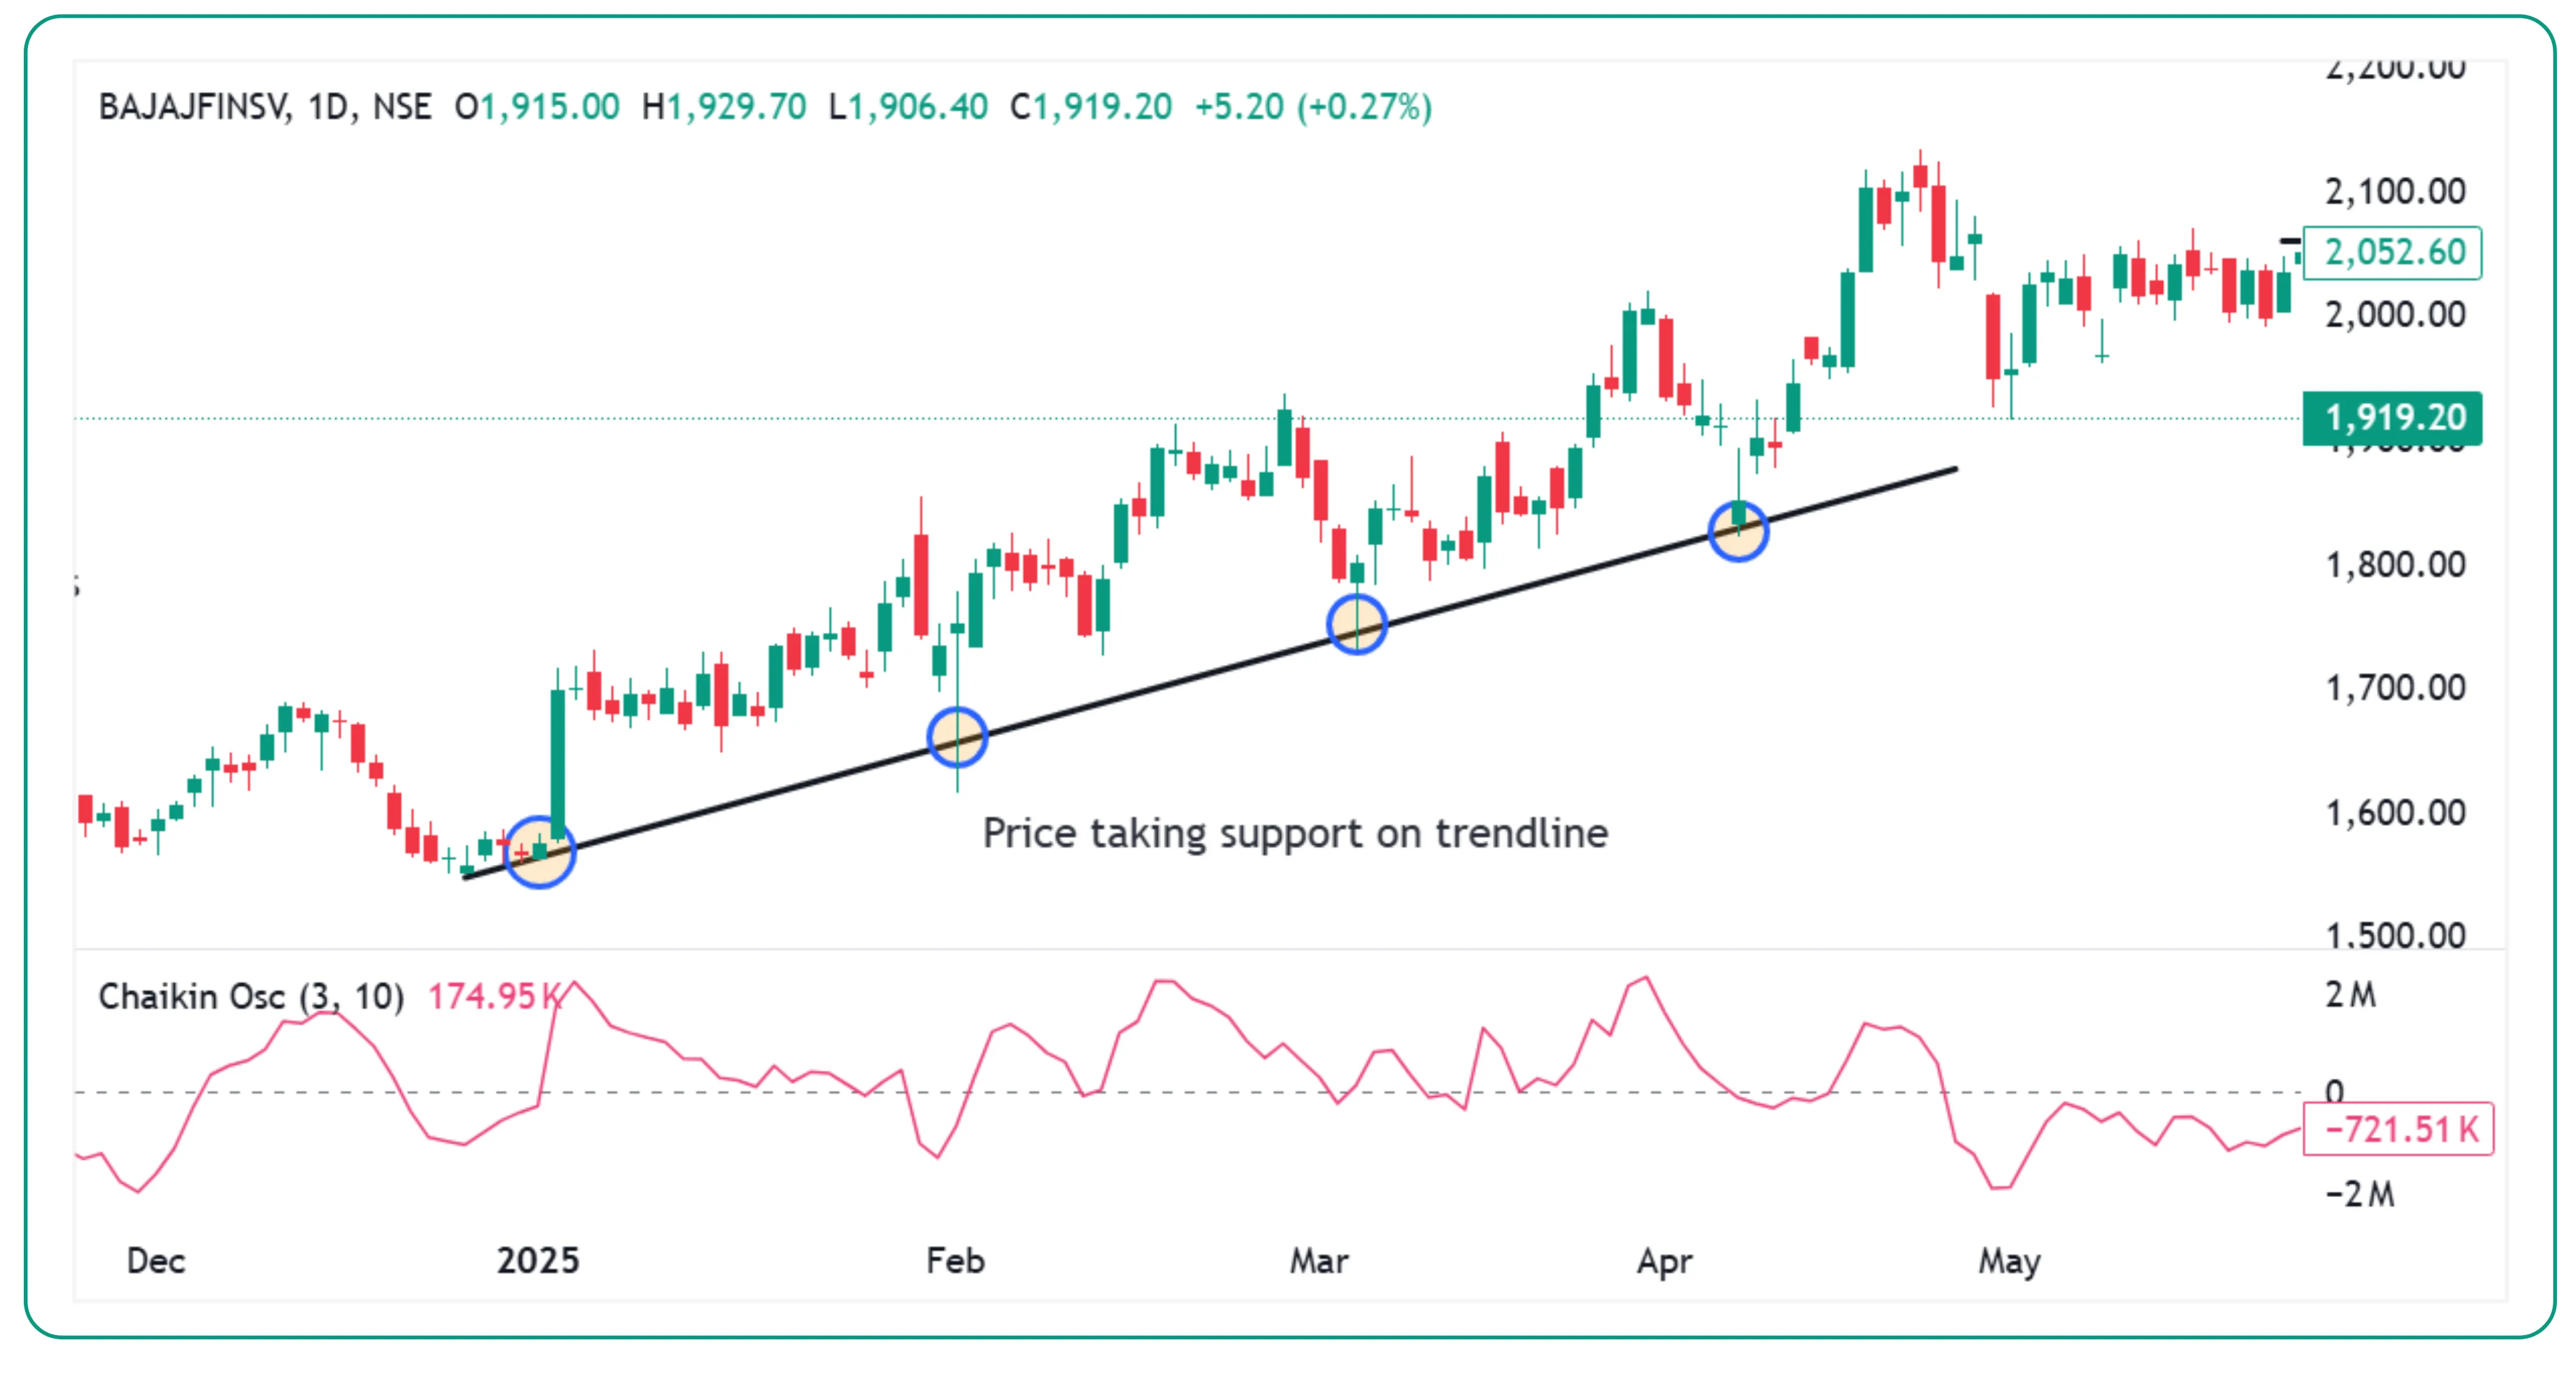
Additionally, traders should also adjust their approach based on market conditions. In strong trending markets, the oscillator can help confirm momentum, while in sideways markets, it may produce more false signals and should be used with caution.
For example, from 1st January 2025 to 8th April 2025, the BAJAJFINSERV chart showed the price consistently taking support along a rising trendline. During this period, the Chaikin Oscillator also generated a buy signal. Using the indicator alongside trendline analysis strengthened the trade confirmation, as the price moved from around 1,600 to nearly 2,100. This move not only gave confidence to existing holders to continue their positions but also encouraged fresh entries.
The strategic edge of the Chaikin Oscillator
The Chaikin Oscillator offers a unique window into the balance between price and volume. It helps traders detect whether buying or selling pressure is increasing, even before the price shows visible movement. By highlighting divergences and directional shifts, it can help refine entries and exits and offer a more complete picture of market momentum.
When paired with disciplined analysis and smart risk management, the Chaikin Oscillator becomes more than just another line on the chart. It becomes a tool that helps you stay in tune with the market's internal rhythm.
Disclaimer: The information provided in our blogs is for informational purposes only and should not be construed as financial, investment, or trading advice. Trading and investing in the securities market carries risk. Always conduct your own research and consult with a qualified financial advisor before making any investment decisions. Past performance is not indicative of future results. Copyrighted and original content for your trading and investing needs.
© 2025 — Tradejini. All Rights Reserved.


