


Flags and pennants are short-term chart patterns that typically appear during strong price trends. These formations represent a pause or consolidation before the price continues in its original direction. While they may sometimes signal reversals, they are most often considered continuation patterns.
Flag and Pennant pattern – time frame guidelines
| Component | Pattern | Description | Ideal Time Duration |
|---|---|---|---|
| Pole | Flag & Pennant | A strong, sharp price move (usually vertical) on high volume |
3 to 15 trading days (can extend up to 20) |
| Consolidation | Flag | A small, downward or sideways consolidation phase with parallel trendlines |
1 to 4 weeks (5 to 20 trading days) |
| Consolidation | Pennant | A small, symmetrical triangle formed by converging trendlines |
1 to 3 weeks (5 to 15 trading days) |
| Breakout | Flag | Continuation of the original trend (same direction as the pole); should happen quickly after the flag forms |
Ideally, within a few sessions |
| Breakout | Pennant | Price resumes in the same direction as the pole with strong momentum and volume |
Ideally, within a few sessions |
The difference between flag and pennant pattern
A flag looks like a small rectangle that slopes against the prevailing trend. The price movement within a flag is confined by two parallel or nearly parallel trendlines.
- Bullish Flag – Appears in an uptrend
- Bearish Flag – Appears in a downtrend
A pennant resembles a small symmetrical triangle. The trendlines that form a pennant converge towards each other, giving it a pointed streamer-like appearance.
Think of a pennant like those triangular flags often seen strung up at festivals or events. In trading, pennants appear midway through a strong price move, which is why traders often call them "half-staff" patterns.
How to identify Flags and Pennants
| Characteristic | Explanation |
|---|---|
| Strong price trend | There must be a sharp move (called the flagpole) leading into the flag or pennant. |
| Shape | Flags are bound by parallel lines; pennants are formed by converging lines. |
| Volume | Volume typically decreases during the formation of the pattern. |
| Breakout | The price can break out in either direction, but it usually follows the trend leading to the pattern. |
| Duration | These are short-term patterns and usually last less than three weeks. |
| Flagpole | A strong, straight-line price movement before the pattern is a must for it to be a valid flag or pennant. |
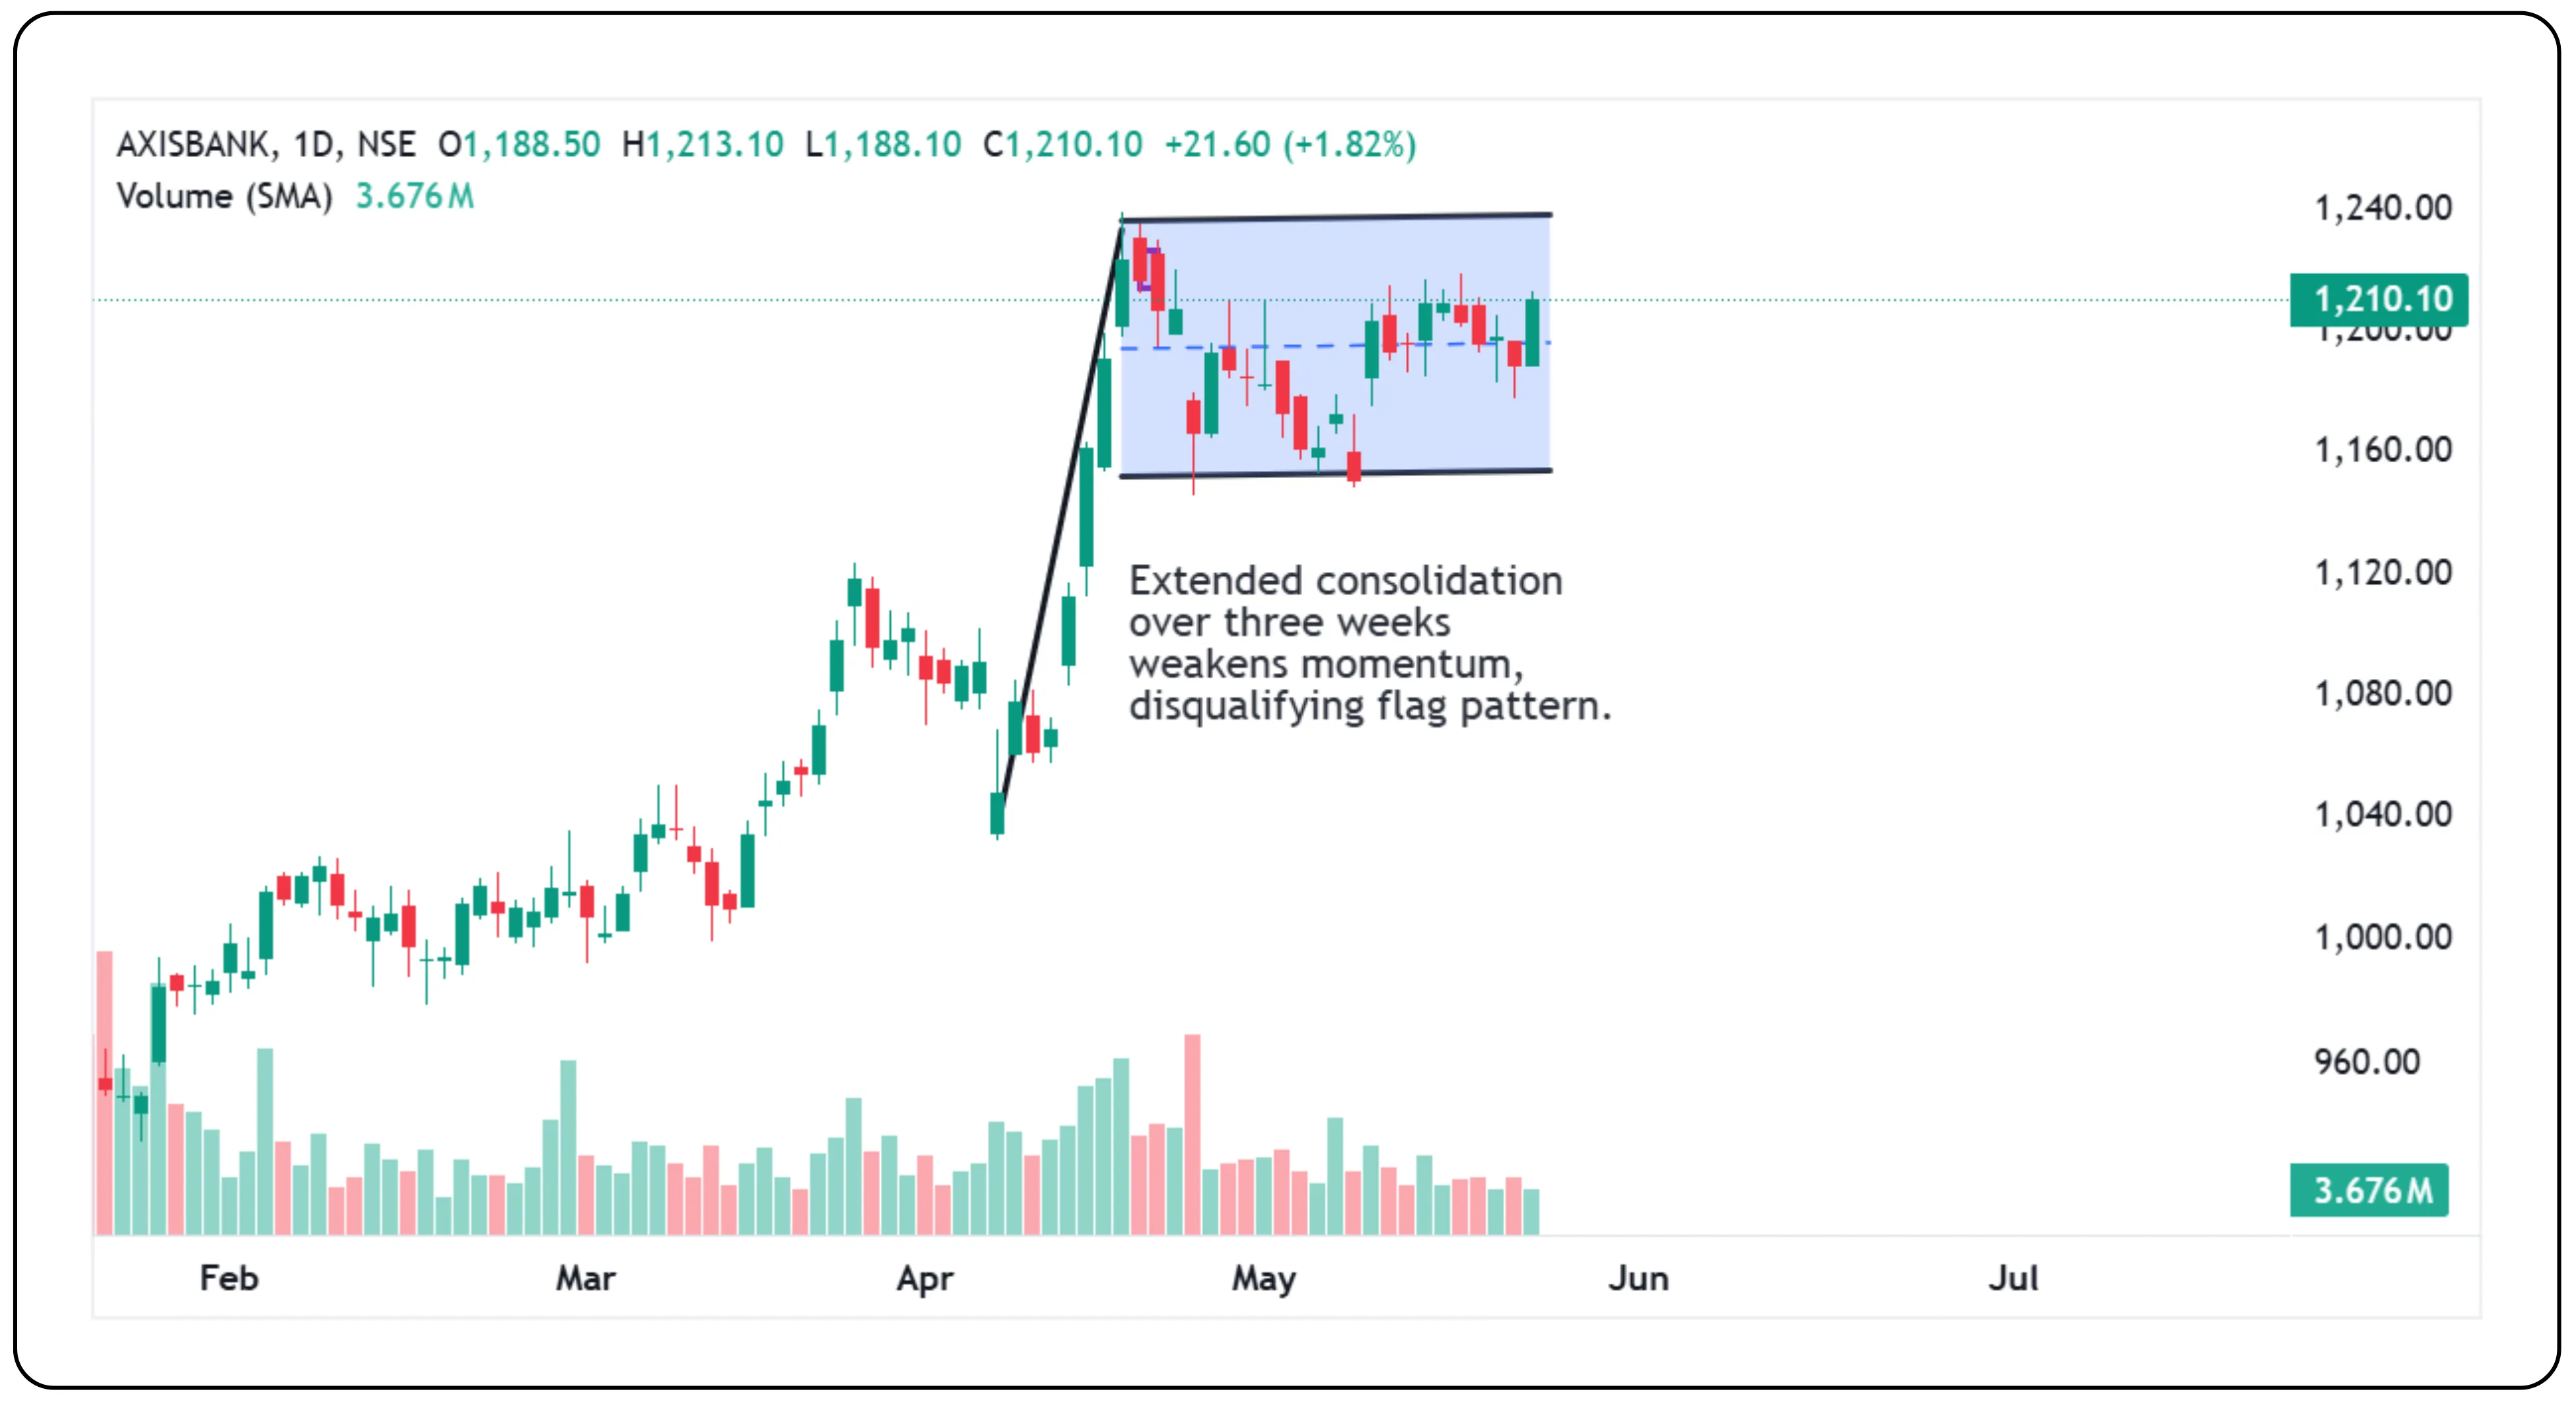
Why does Axis Bank's setup not qualify as a true flag and pole pattern?
Smart tips for spotting these patterns
- Start by locating the flagpole, which is a sharp price movement.
- Consolidation after a strong move will usually form a small knot or congestion area; this is your flag or pennant.
- The trendlines in flags are parallel; in pennants, they converge.
- Do not worry about how many times the price touches the trendlines.
- Price within the flag or pennant can move sideways or slope slightly, often against the prevailing trend.
- Volume should decrease during the pattern.
- Once the pattern breaks, the price generally continues in the direction of the initial trend.
The psychology behind Flag and Pennant patterns
In technical analysis, flag and pennant chart patterns, including both the bull flag pennant pattern and the bear flag pennant, are widely used to analyze price action in the stock market for Intraday or positional. These patterns often appear after a sharp price movement, forming what is known as the pole and pennant pattern. The sharp move forms the pole, while the consolidation forms the flag or pennant.
This temporary consolidation reflects a balance between buyers and sellers. It may appear as a pennant triangle pattern, a candlestick pennant, or even a pennant candlestick pattern. Traders observe these pennant patterns to anticipate the continuation of the prior trend. In a bull flag pennant, the pattern begins with strong buying, often triggered by institutional investors who anticipate positive news like better-than-expected earnings or dividend increases. Once the news becomes public, more buyers enter the market, pushing the price higher. The consolidation that follows shows a tug-of-war between profit-takers and new buyers, forming the flag or pennant.
Similarly, a bear flag pennant can form when sellers dominate after a downward move. During the consolidation phase, traders often look for a bear pennant target to estimate where the price might go if the pattern breaks lower. This setup may signal a continuation of the bearish trend or act as a reversal pennant in certain conditions.
Patterns like the flag pennant chart pattern, pennant flag stocks, and pennant flag pattern stock are commonly used in stock market pennant pattern analysis. Understanding technical analysis flags and pennants helps traders identify entry points with better risk-to-reward ratios.
By recognizing the psychology behind the pennant pattern trading setup and mastering the pennant technical analysis, traders can make more informed decisions. Whether using the pennant and flag pattern, flags and pennants pattern, or focusing on a specific pennant reversal pattern, these formations offer insights into market sentiment and potential breakout directions.
Flag and Pole – quick recap
- A flag forms after a strong price move (the pole), followed by a small rectangular consolidation (the flag).
- Flags typically slope slightly against the trend and often break in the direction of the pole.
- Example: In an uptrend, a rising pole followed by a small downward or sideways rectangle is considered a bullish flag.
Pennants – quick recap
- A pennant appears after a sharp price move but consolidates in the form of converging trendlines, creating a small symmetrical triangle.
- During formation, volume contracts and then expands sharply at the breakout point.
How to trade the flag and pole pattern
Bearish Flag and Pole Pattern on BAJAJFINSV (14th Oct 2024 – 11th Nov 2024)
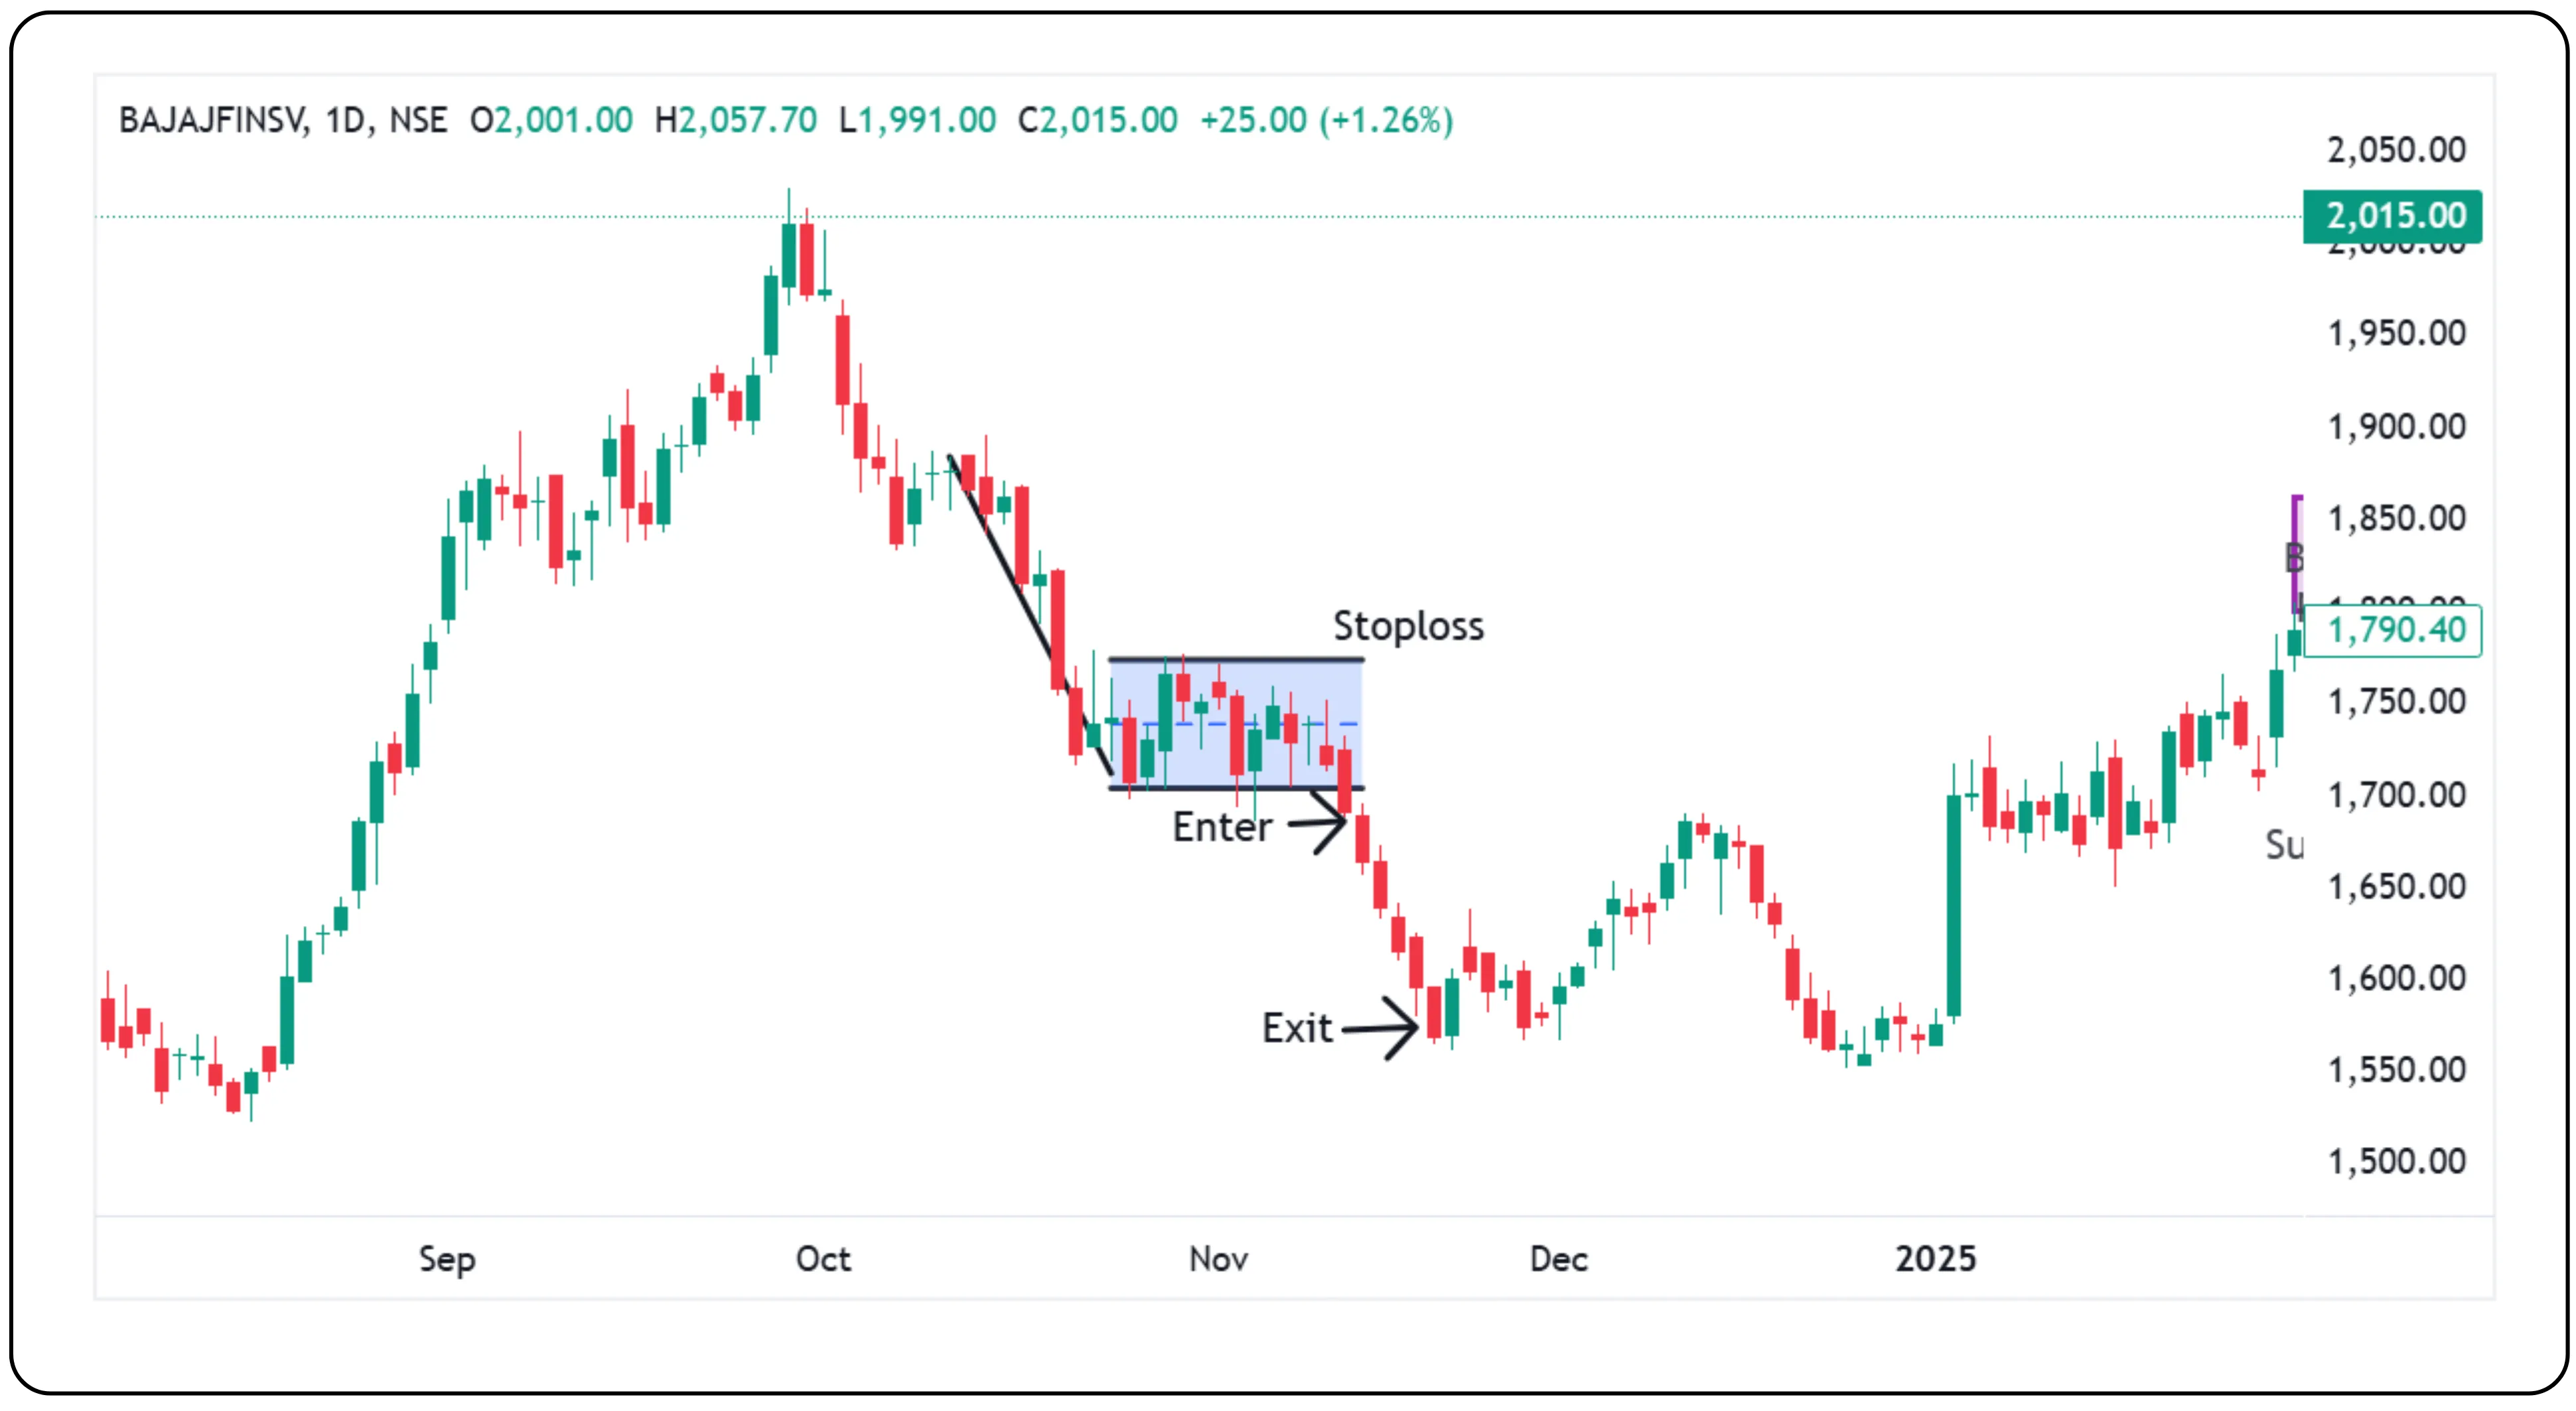
BAJAJFINSV Date Range:14th Oct 2024 – 11th Nov 2024
- Pattern Explanation: A flag and pole pattern is a continuation pattern. In this case, the sharp price rally formed the pole, followed by a small consolidation range forming the flag.
- Entry Point: Entry was triggered when the price broke below the lower boundary of the flag on the downside at ₹1688. This confirms bearish continuation.
- Stop Loss: Stop loss should be placed just above the upper boundary of the flag at ₹1773, which marks the recent swing high within the consolidation zone.
- Exit Point: Exit triggered at ₹1574 near the previous swing support level, which typically acts as the next potential bounce zone.
Bullish Flag and Pole Pattern on Apollo Hospitals (7th April 2025 – 30th April 2025)
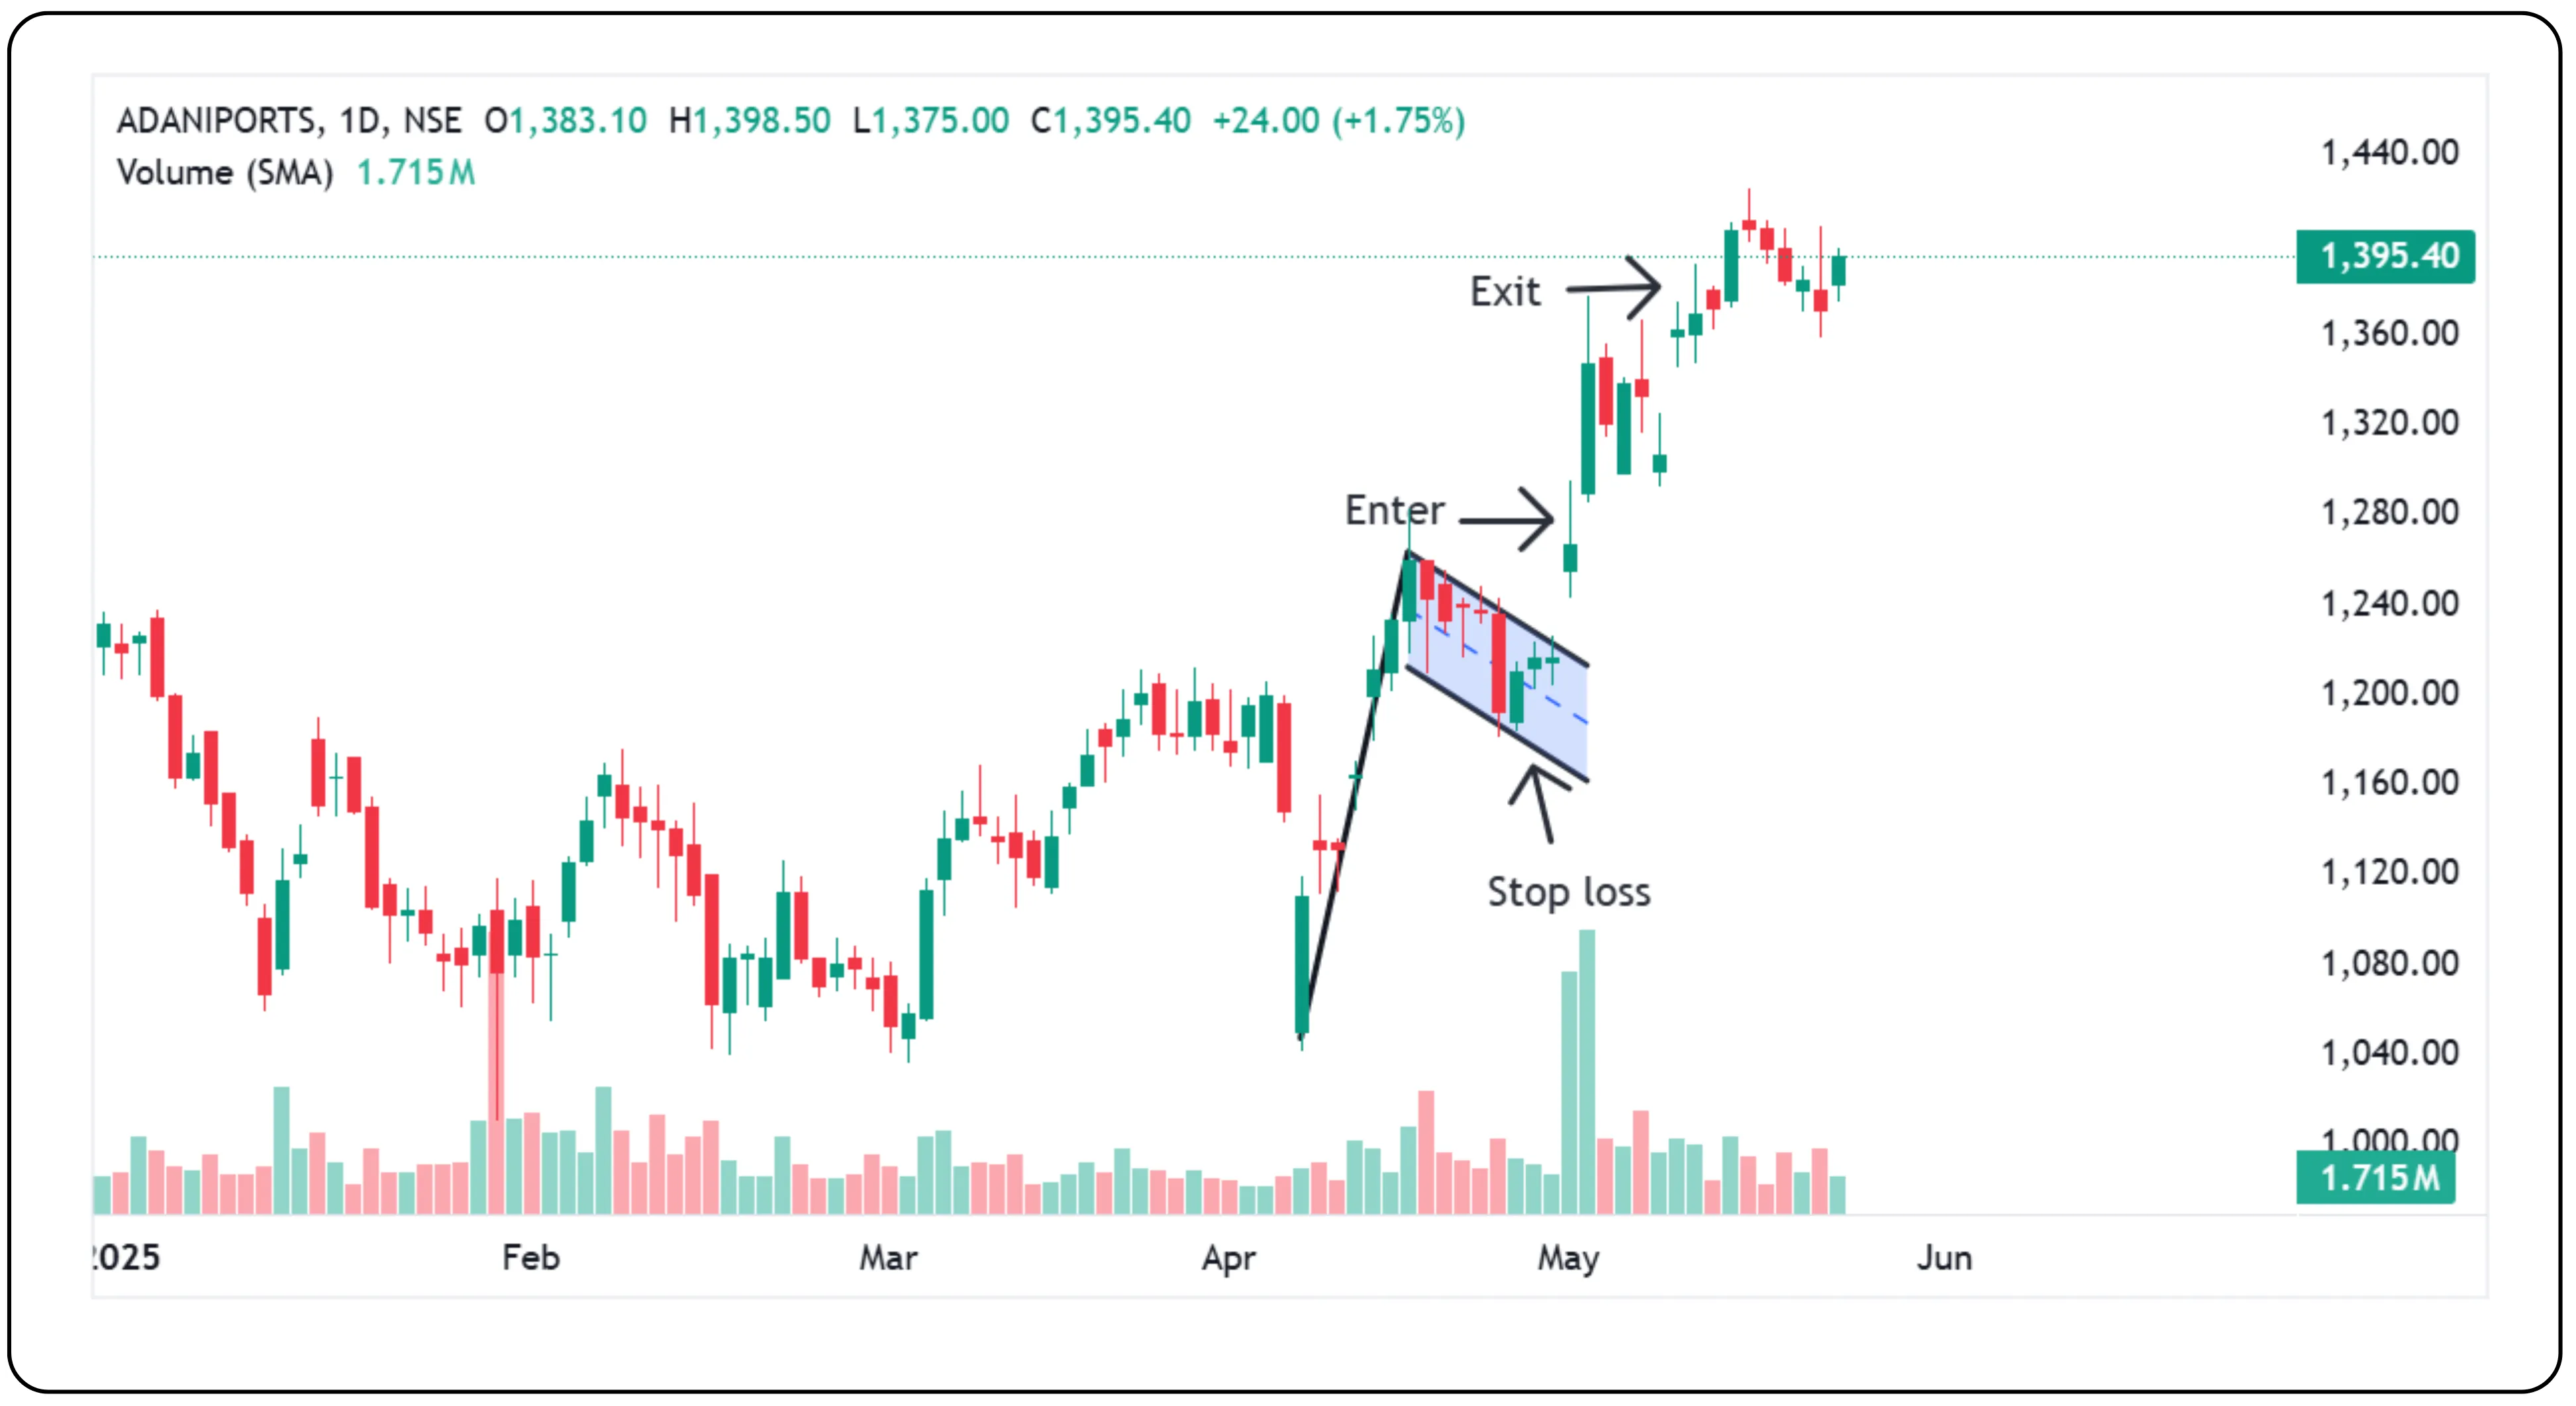
Date Range: 2nd April to 22nd April
Stock: Adani Ports
Pattern Explanation: This chart illustrates a classic bullish flag and pole pattern. A sharp upward price rally forms the pole, followed by a narrow rectangular consolidation forming the flag. This pattern signals a brief pause before the trend continues upward.
Entry Point: The entry is taken when the price breaks above the upper boundary of the flag. This breakout confirms bullish continuation and indicates renewed buying interest.
Stop Loss: The stop loss is placed just below the lower boundary of the flag. This level acts as a support zone during consolidation and protects against false breakouts.
Exit Point: Exit is taken after the price reaches the next significant resistance or shows signs of exhaustion, ideally near the projected target based on the length of the pole.
Note: Always confirm the breakout with volume expansion and broader market conditions.
Test Your Knowledge
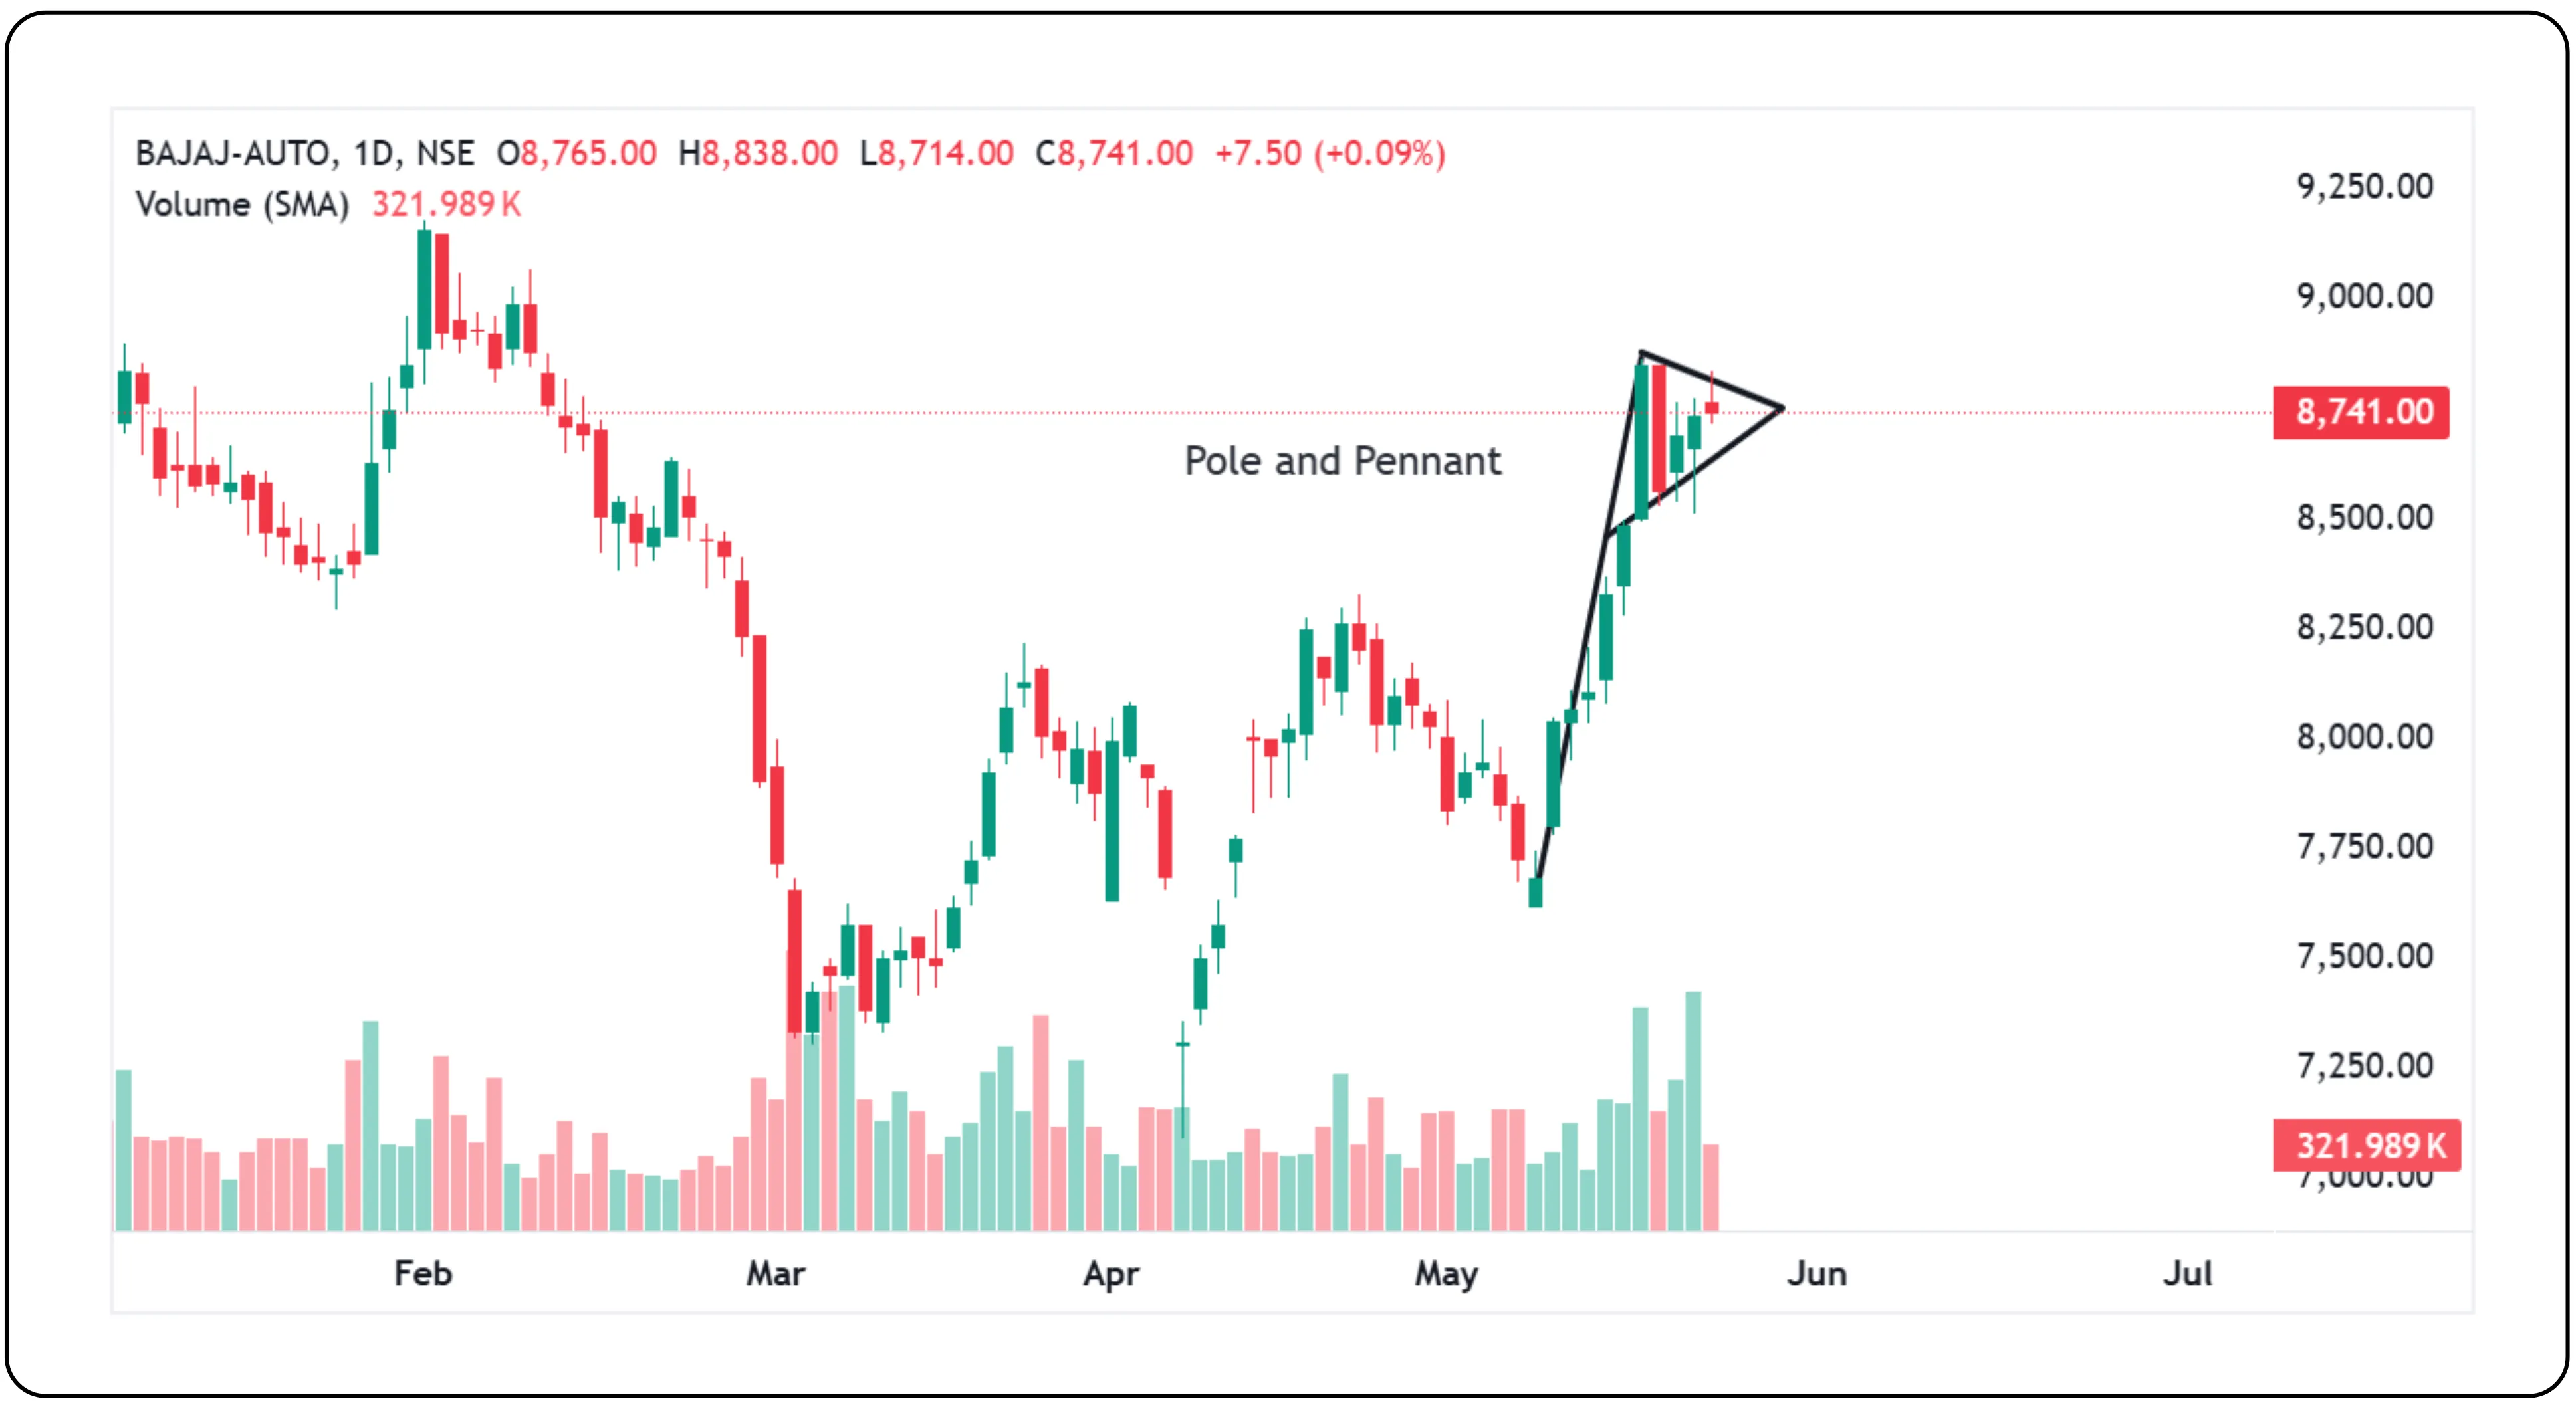
Bajaj Auto formed a Flag and Pole pattern between 12th May 2025 and 23rd May 2025.
- What would your action be?
- Would you buy? If yes, at what price?
- If not, why would you avoid the trade?
Keep watching this stock whenever you come across it and observe how this pattern plays out over time
Spotting fake breakout
Date Range: 22nd August to 12th September 2024, Indigo showed a flag and pole pattern. But did it really break out?
Check what happened next. Was it a strong move up or a reversal?
This is a reminder — do not trust patterns blindly. Always wait for confirmation.
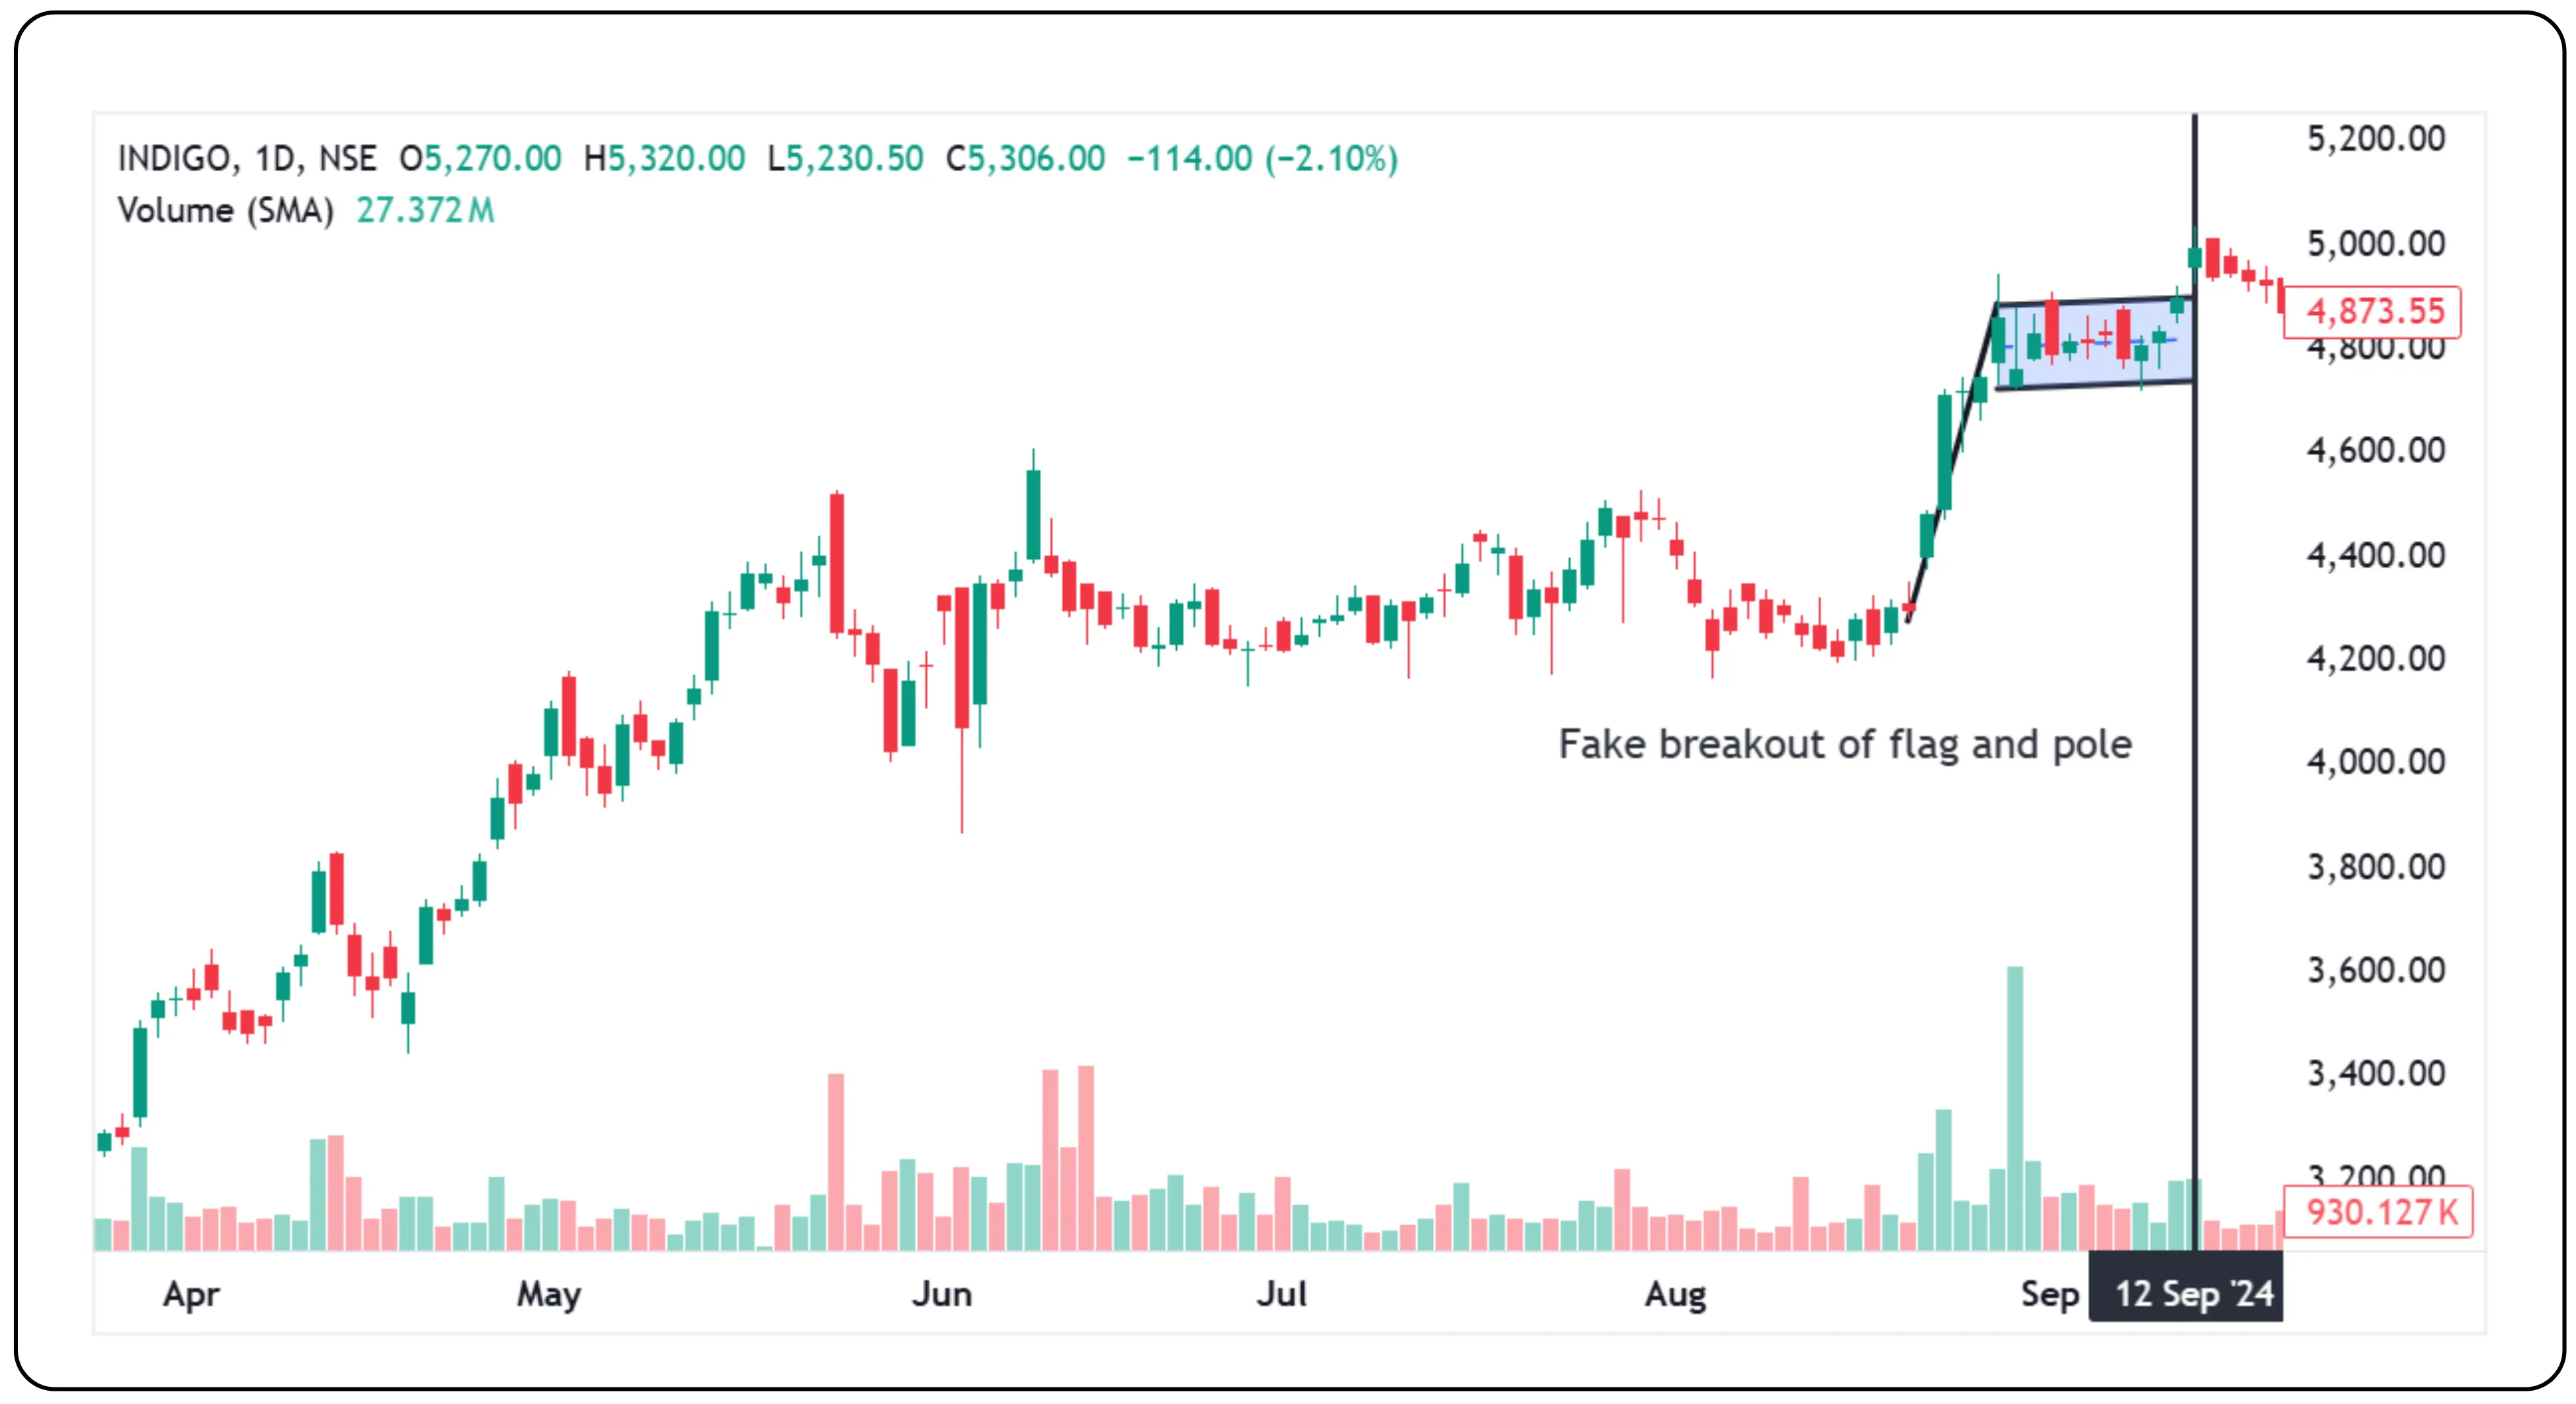
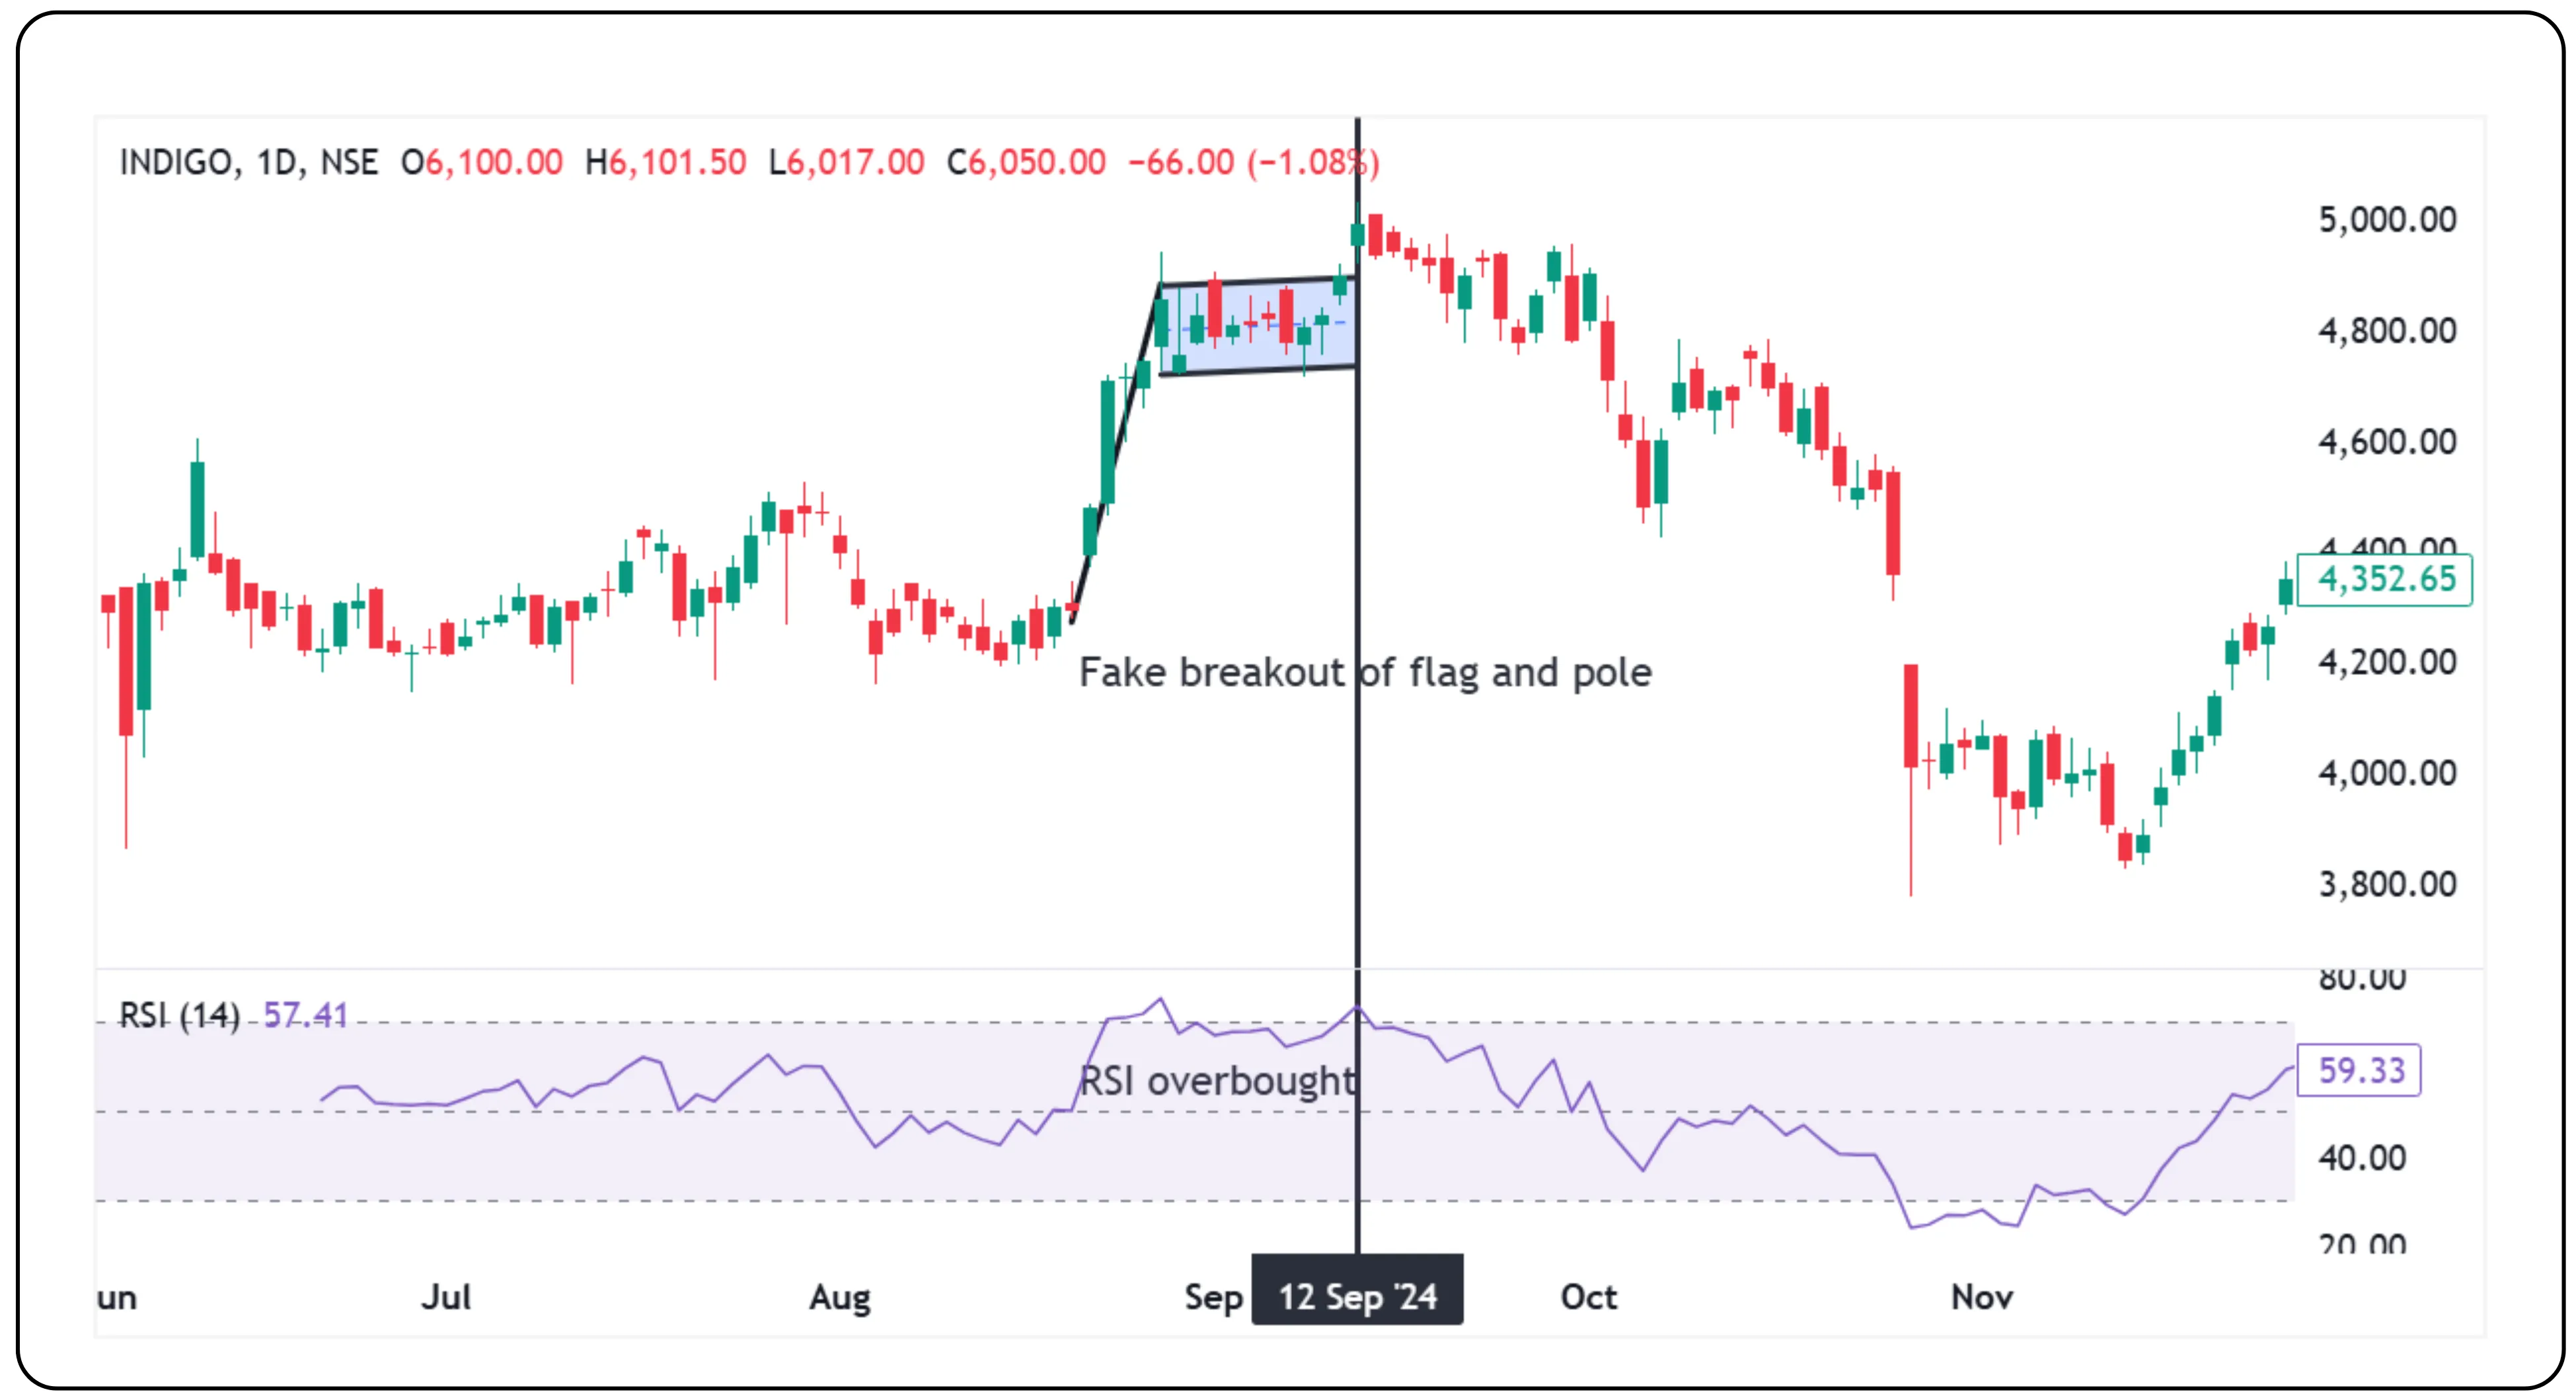
On Indigo’s chart from 22nd August to 12th September 2024, a flag and pole pattern appeared. But the breakout candle’s high was not crossed by the next candle, a key sign that entry confirmation was missing.
RSI also indicated an overbought condition at the same time.
With proper discipline and the right use of indicators, this setup could have warned you to stay out and avoid a false breakout.
The Strategic Role of Flags and Pennants in Trend Continuation
Flags and pennants are not just visually identifiable chart formations; they represent critical pauses within strong trends that can offer high-probability trading setups. Their real power lies in their ability to signal the continuation of momentum after a brief consolidation. These patterns typically emerge when the market temporarily balances between profit-taking and renewed buying or selling interest, often driven by institutional activity. Identifying a clear flagpole followed by a well-defined consolidation can provide traders with precise entry and exit points, especially when confirmed by volume behavior and breakout direction. While not infallible, their consistent appearance in trending markets makes them valuable tools in technical analysis. When interpreted in the context of market psychology and trend strength, flags and pennants can significantly enhance decision-making in both short-term and swing trading strategies.
Disclaimer: The information provided in our blogs is for informational purposes only and should not be construed as financial, investment, or trading advice. Trading and investing in the securities market carries risk. Always conduct your own research and consult with a qualified financial advisor before making any investment decisions. Past performance is not indicative of future results. Copyrighted and original content for your trading and investing needs.
© 2025 — Tradejini. All Rights Reserved.