


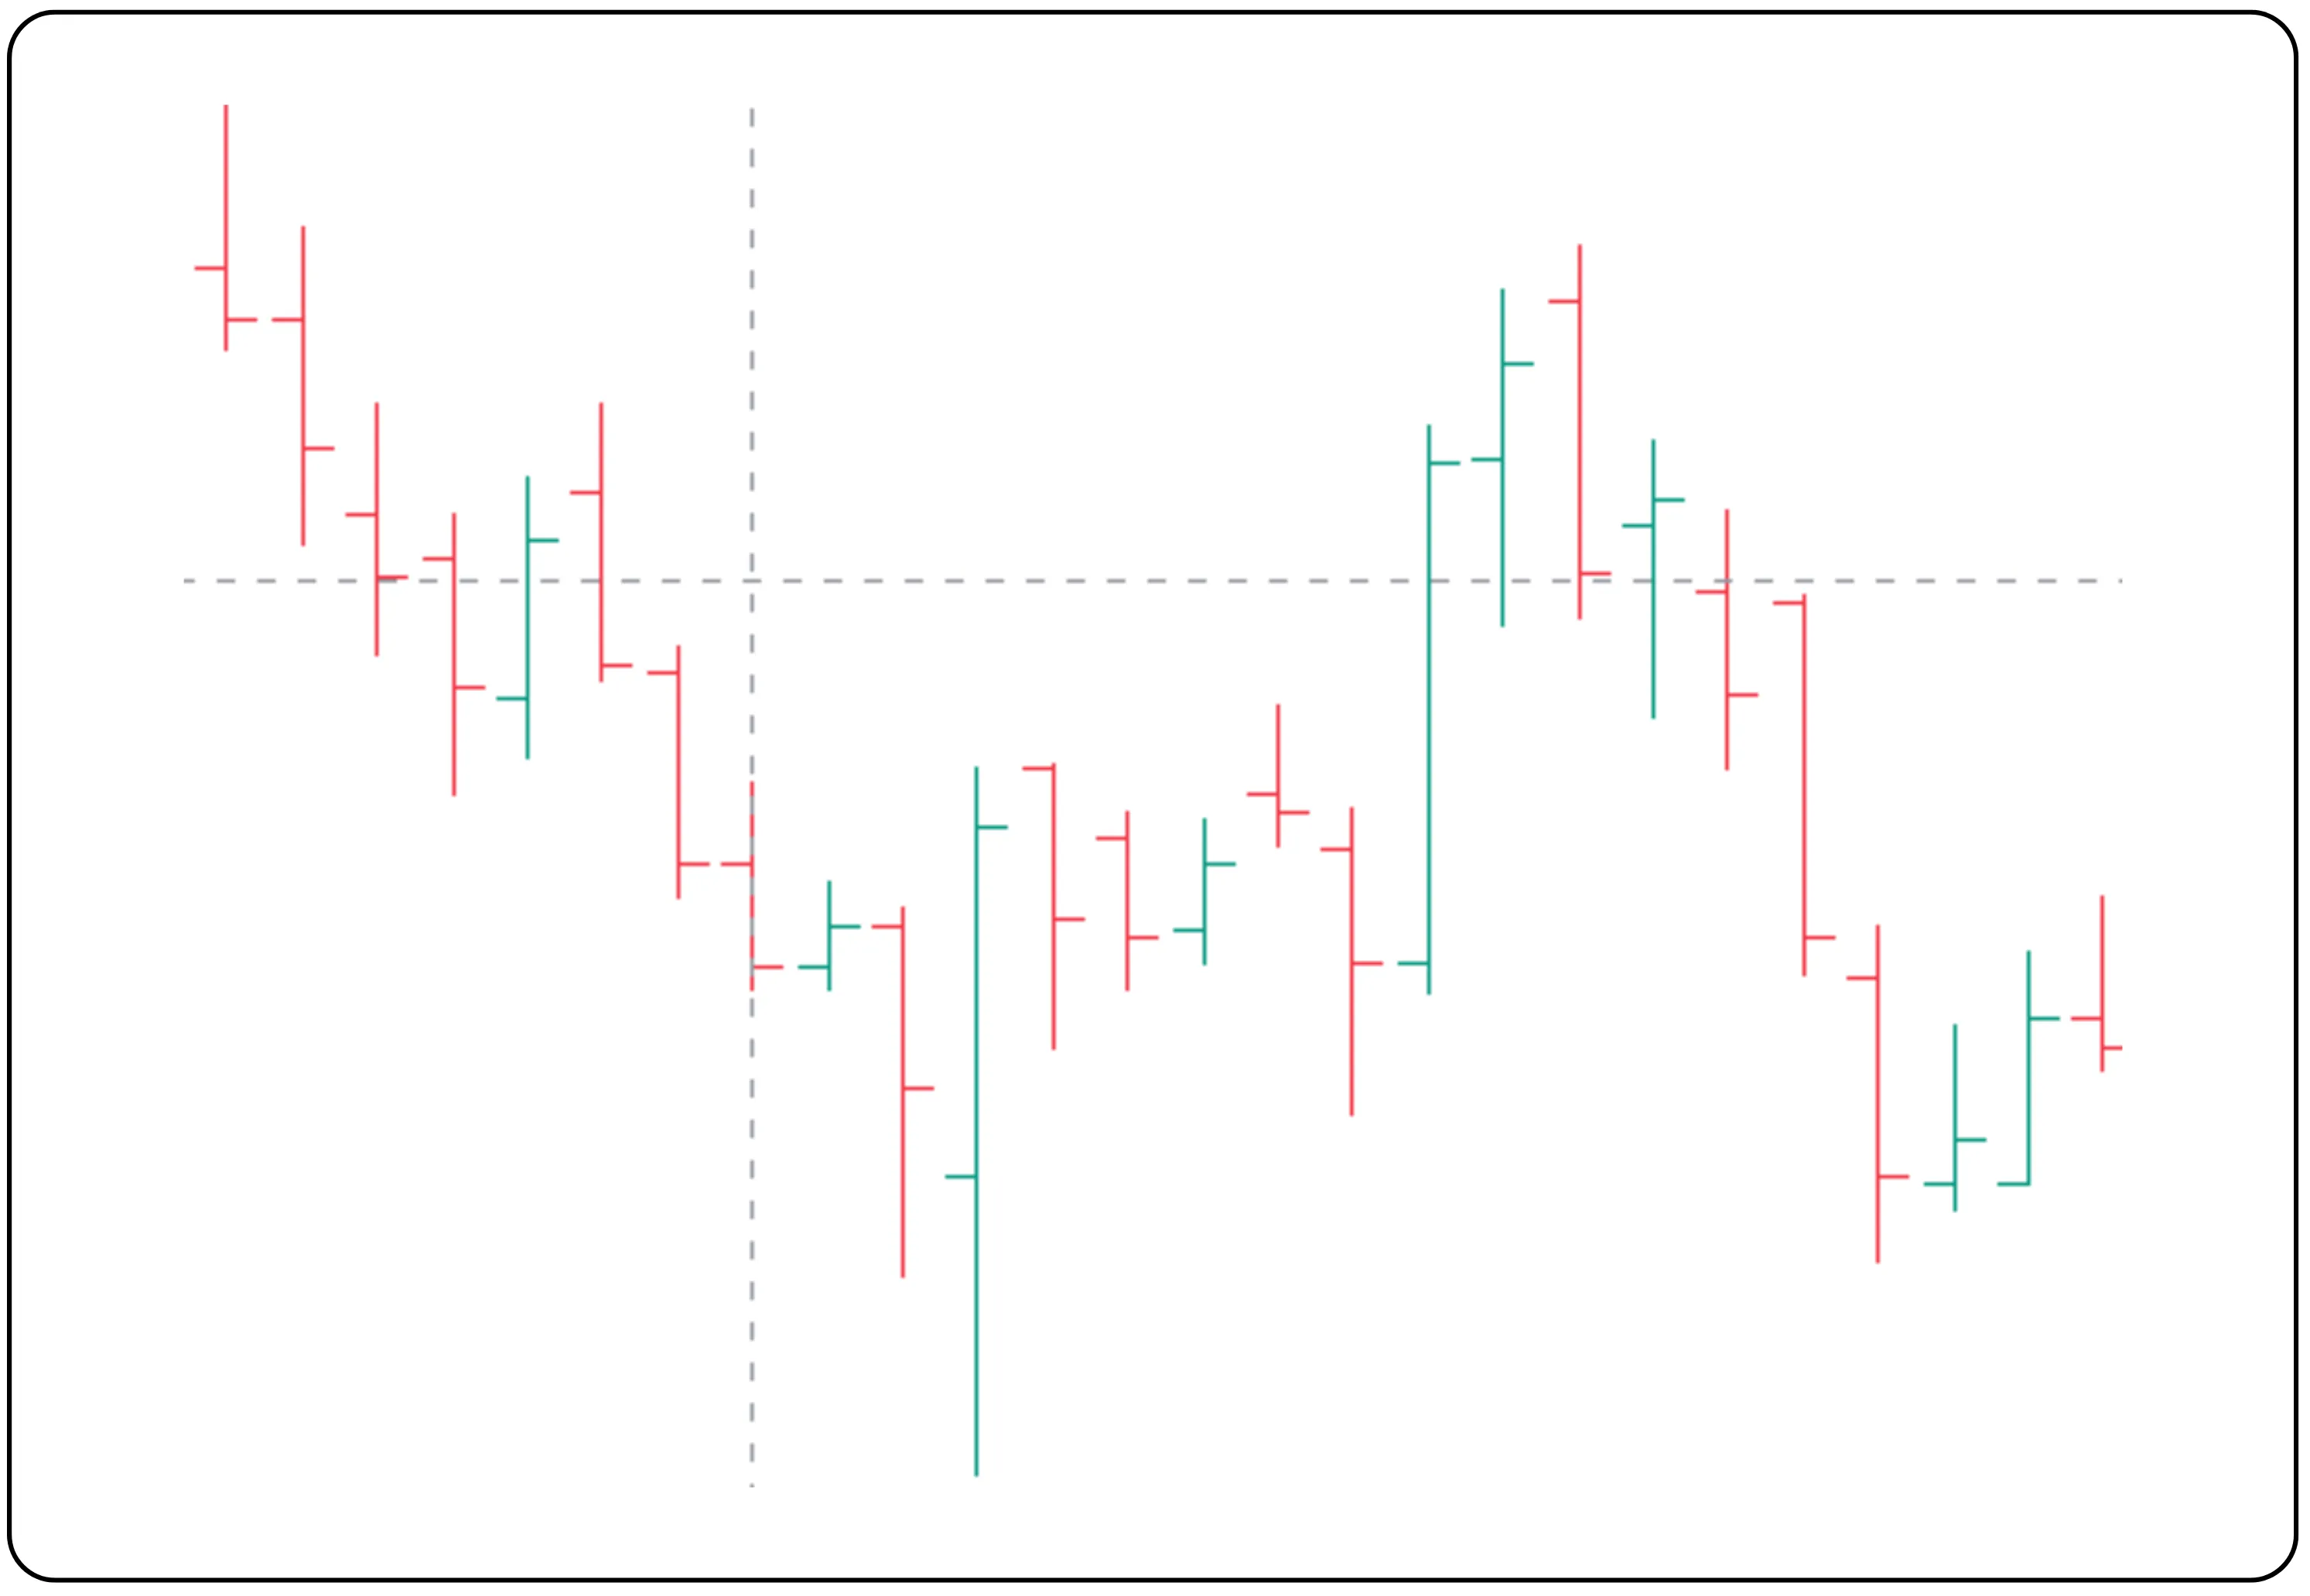
In the stock market, most traders use candlestick charts, but bar charts, which are less commonly used, offer traders a clear view of market activity. They can be applied in technical analysis, as they display the open, high, low, and close prices for a selected market over a chosen time frame. This format provides deeper insights than a simple line chart, making it a valuable choice for traders who seek precision and detail in market tracking. The pattern of each bar, a single thin vertical line with small marks on the sides for the open and close, helps traders know at a glance where the price started and ended in that period, making quick analysis possible without going through complex details.
How to Read a Bar Chart
Each vertical bar represents a single period of trading activity. This period can be set to daily, weekly, monthly, quarterly, yearly, or even to minute intervals for intraday trading. On a daily chart, the top of the bar represents the highest price reached during the day, while the bottom represents the lowest. The small mark on the left side indicates the opening price, and the mark on the right shows the closing price. Understanding this structure is crucial for any trader learning to read a bar chart effectively.
Why Bar Charts Matter
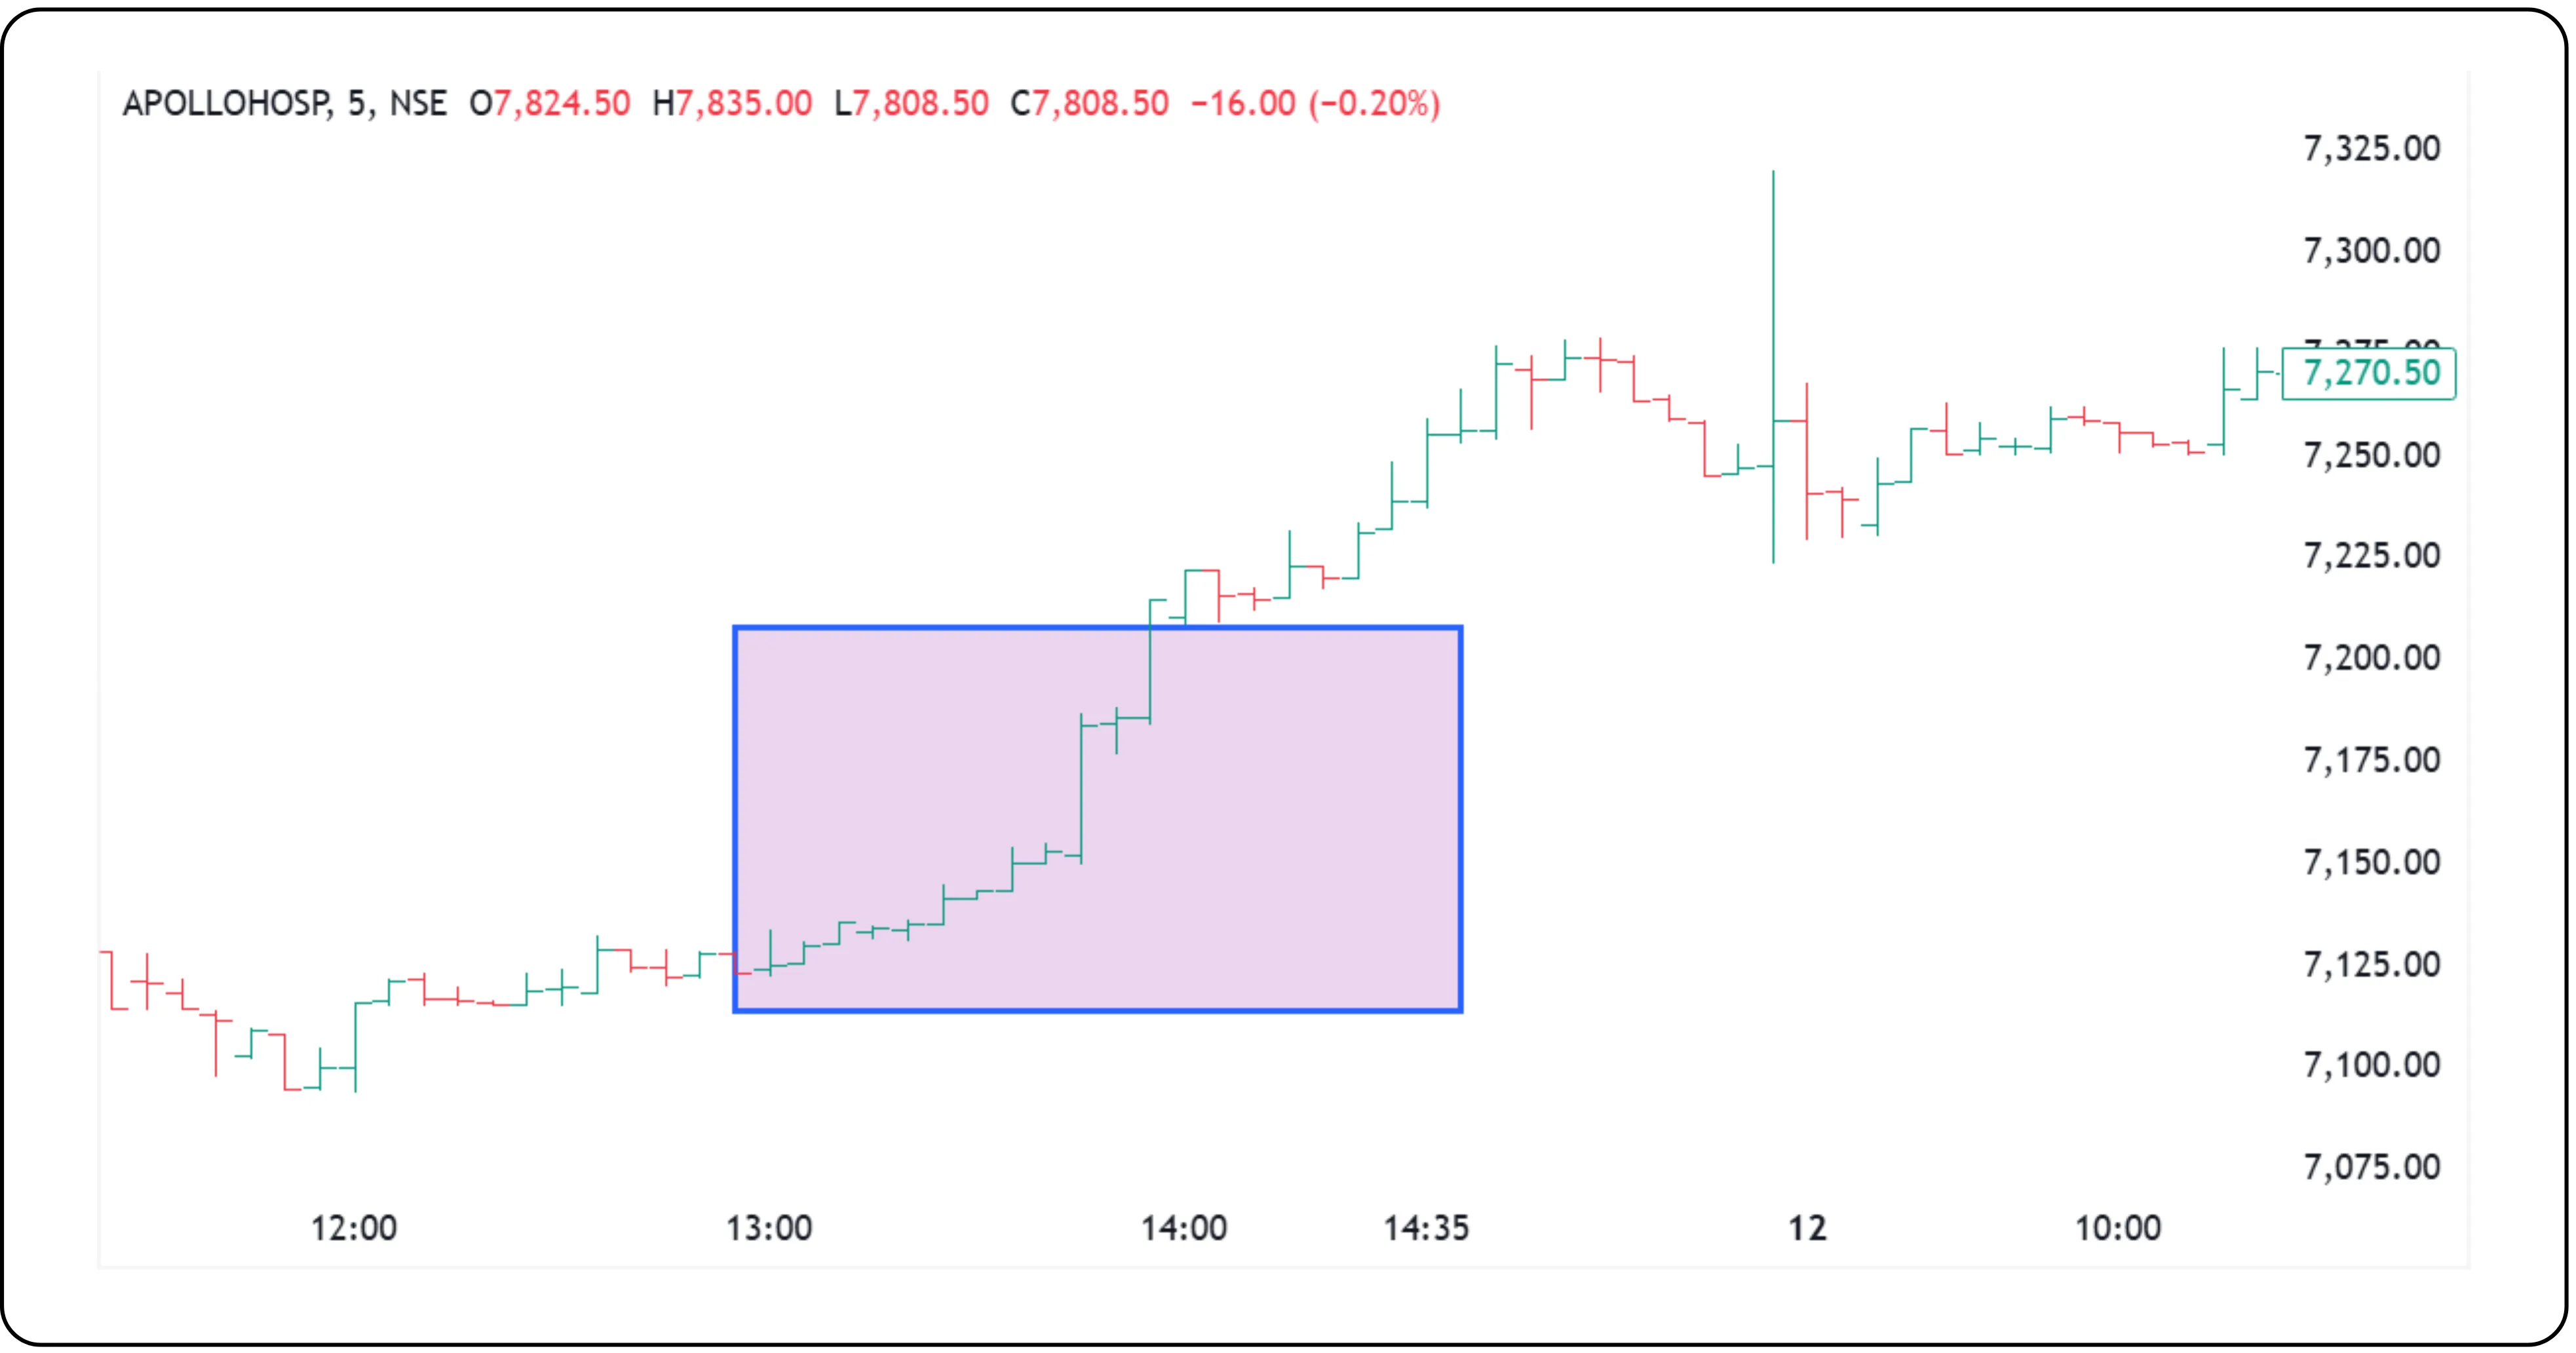
By combining open, high, low, and close data, bar charts stock market visuals provide traders with a detailed view of market trends and volatility. They make it easier to identify price ranges, patterns, and potential breakout levels. The ability to add moving averages, volume, and open interest further enhances analysis, giving traders a comprehensive market picture for better decision-making. One of the key advantages of a bar chart is that the open and close prices are instantly visible through the small marks on the left and right of the bar. This makes it easy to judge whether a price is opening high and closing high, and if this pattern continues across consecutive bars, it often signals that the stock is in a sustained uptrend.
On 11 June 2025, Apollo Hospital's stock formed a bar where the opening price was higher than that of the previous bar. This indicated the start of an upward move in the stock for that time interval.
Bar Charts vs Candlestick Charts
| Feature | Bar Chart | Candlestick Chart |
|---|---|---|
| Visual Style | Simple lines with open and close marks | Colored bodies with wicks |
| Detail Level | Shows open, high, low, close | Shows open, high, low, and close with emphasis on body |
| Ease of Reading | Preferred for precise price points | Preferred for quick sentiment view |
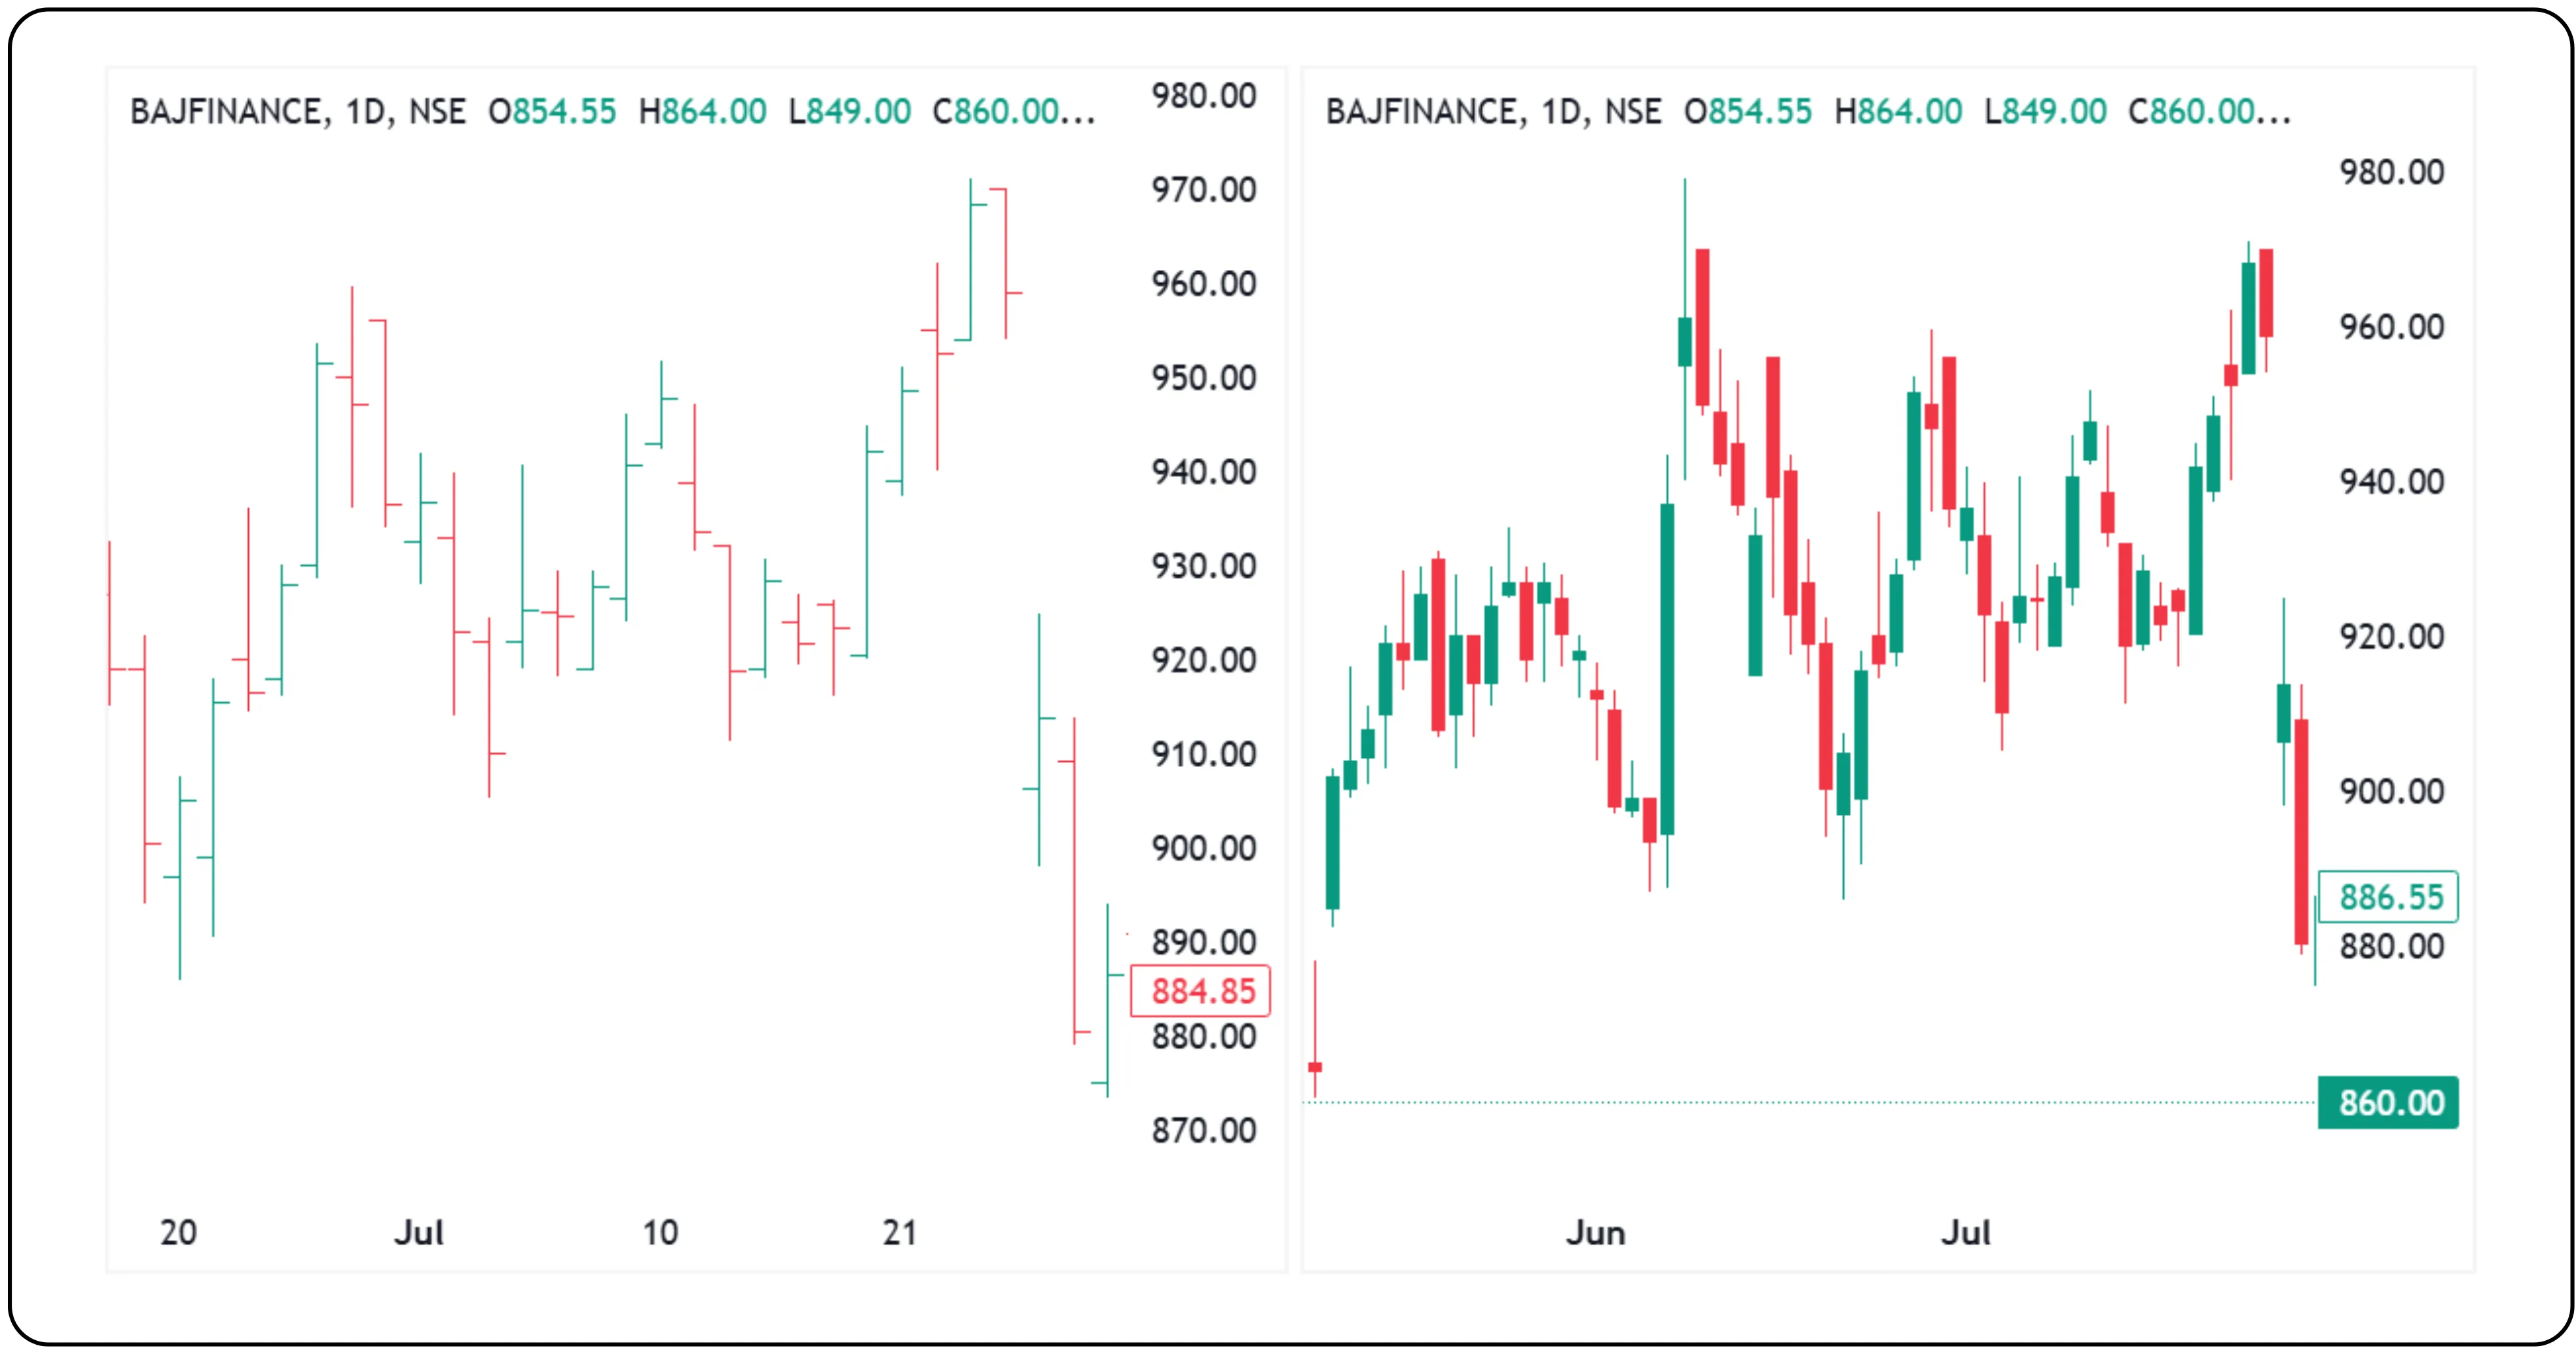
The image below reflects the Bar chart and Candlestick chart for comparison.
Identifying momentum shifts with a combination of indicators on bar charts
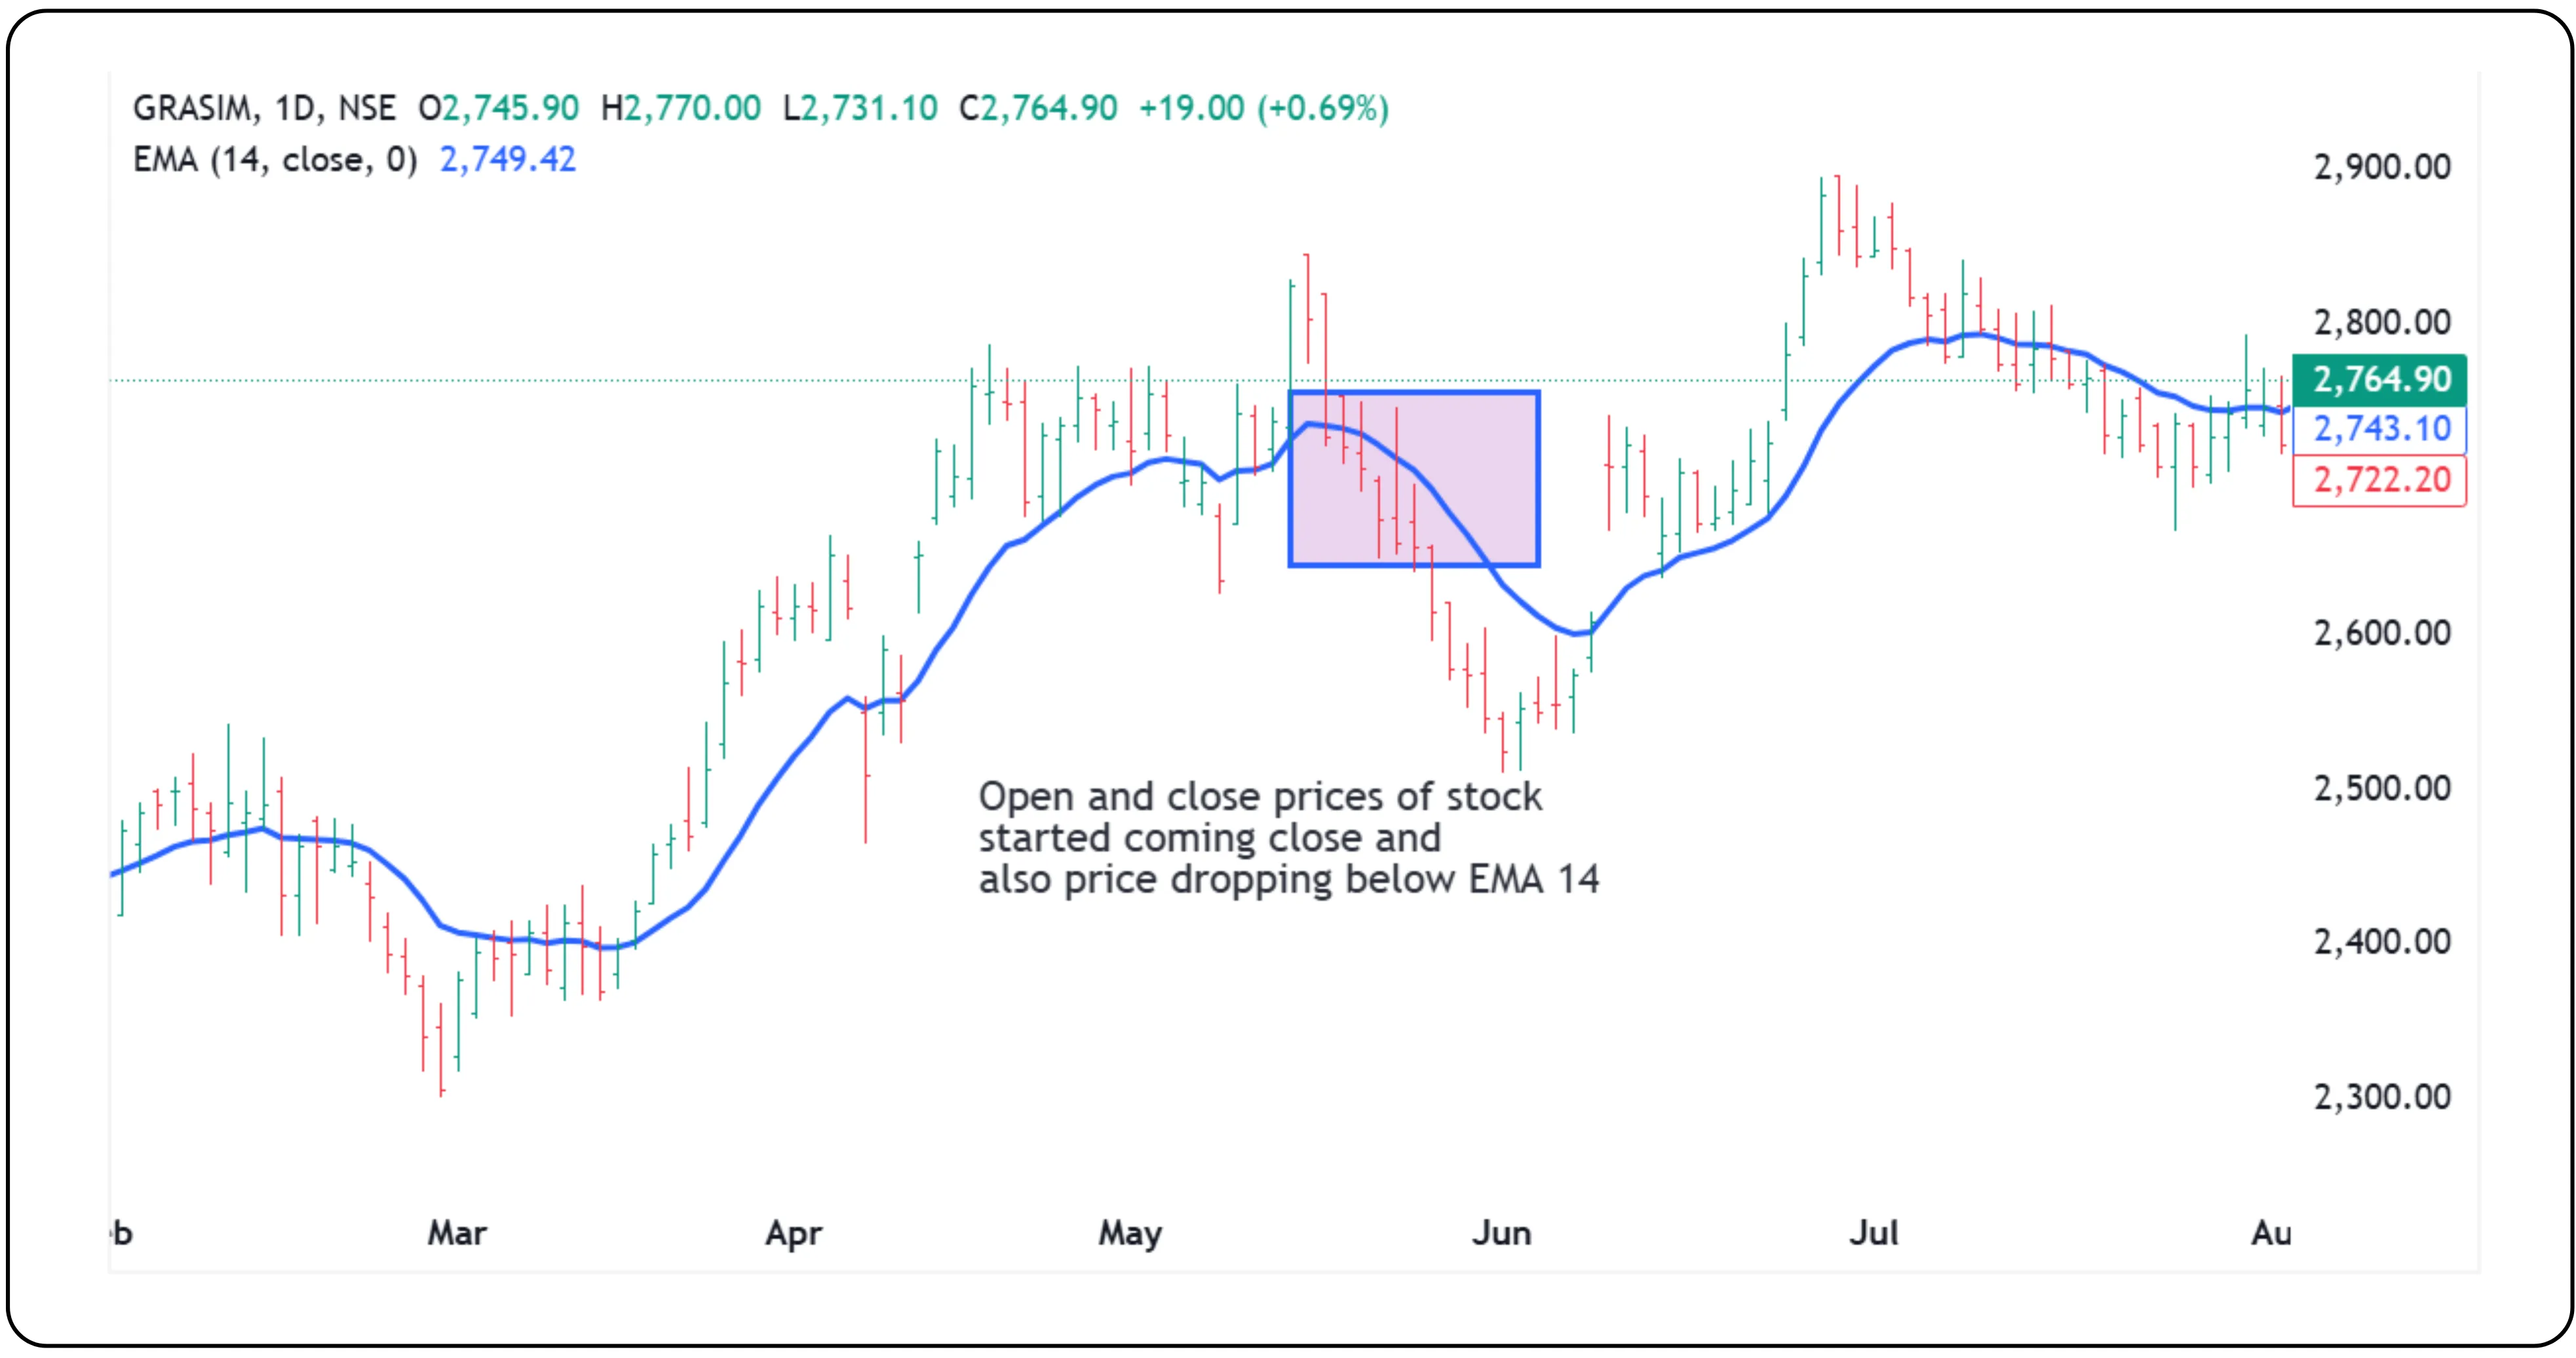
Imagine a trader analyzing a stock over several days or a week. The bar chart shows that prices have been closing higher each day, but the highs and lows are getting closer together. This pattern might indicate that upward momentum is slowing down, and a potential reversal could be coming. By pairing the bar chart with a moving average, the trader could decide whether to hold the position or take profits early. Most modern charting tools allow traders to overlay technical indicators directly on bar charts. You can display moving averages not only on price but also on volume, value traded, or open interest. Adjusting these settings helps you track the market’s longer-term behavior while still keeping an eye on short-term fluctuations.
On 20 May, the GRASIM chart showed that the stock’s opening and closing prices were the same. The following day, the opening and closing prices were also close to each other. Additionally, the price closed below the 14-period EMA, which is another bearish signal. These indicate that it may be a good time to book profits.
When to Use a Bar Chart
- When you need precise price data for each period
- When analyzing historical market performance across various time frames
- When you are combining price action with volume or open interest data
- When you want a clean, less noisy chart compared to candlesticks
A key to smarter trading decisions
Bar charts may be less flashy than candlesticks, but they are a powerful ally for traders seeking accuracy, flexibility, and integration with advanced market metrics. They work well for intraday to long-term analysis, allow the overlay of technical indicators, and help traders spot trends or reversals early. Learning how to read a bar chart gives traders an edge in applying technical analysis to bar charts effectively. Whether you’re using a bar chart in trading, exploring Heiken Ashi bars, testing Renko bar formats, or studying bar charts' stock market data, a skilled bar chart trader can unlock insights that lead to better decisions.
Disclaimer: The information provided in our blogs is for informational purposes only and should not be construed as financial, investment, or trading advice. Trading and investing in the securities market carries risk. Always conduct your own research and consult with a qualified financial advisor before making any investment decisions. Past performance is not indicative of future results. Copyrighted and original content for your trading and investing needs.
© 2025 — Tradejini. All Rights Reserved.


