


Every trader watches price charts, indicators, and economic data, but very few ever look upward toward the sky. Yet for centuries, people have believed the moon does not just pull the tides; it may also tug at our emotions and even influence market behavior.
Today, some modern traders are revisiting this ancient belief using modern tools, testing whether lunar cycles in trading can uncover hidden rhythms in market trends.
And it is not just mystical talk anymore. When we look at historical market data, certain patterns seem to repeat during specific lunar phases. Could the waxing and waning of the moon really have a measurable impact on market sentiment?
Moon phases and market trends: what the data reveals
In the financial markets, traders rely on technical analysis, price action, and fundamental analysis methods such as corporate earnings, interest rates, or economic policies. But moon phases add a unique, if controversial, layer to this study.
Interestingly, market volatility often occurs around these key phases. During the full moon phase, traders may display heightened investor sentiment, while the new moon often coincides with more cautious or reflective behavior.
The logic behind this is that human behavior and market psychology might subtly mirror celestial patterns, especially when collective emotions drive trading decisions.
Moon cycle and market analysis
Unlike proven indicators such as moving averages or RSI, a moon phases indicator lacks strict scientific validity. Yet many traders find it an intriguing supplementary tool that helps explain certain market moods.
By combining lunar cycles with historical data, traders attempt to identify patterns and explore whether lunar phases correlate with bullish or bearish price movements.
For instance:
Waxing phases, when the moon grows brighter, are sometimes commonly linked to rising optimism.
Waning phases, as it fades, might correspond with declining market activity or profit-taking.
There is no confirmed logical mechanism explaining these shifts in a strict mathematical sense. But when you see similar emotional swings across multiple cycles, you begin to wonder if there is a causal relationship or just coincidence supported by confirmation bias.
A modern twist on an ancient belief
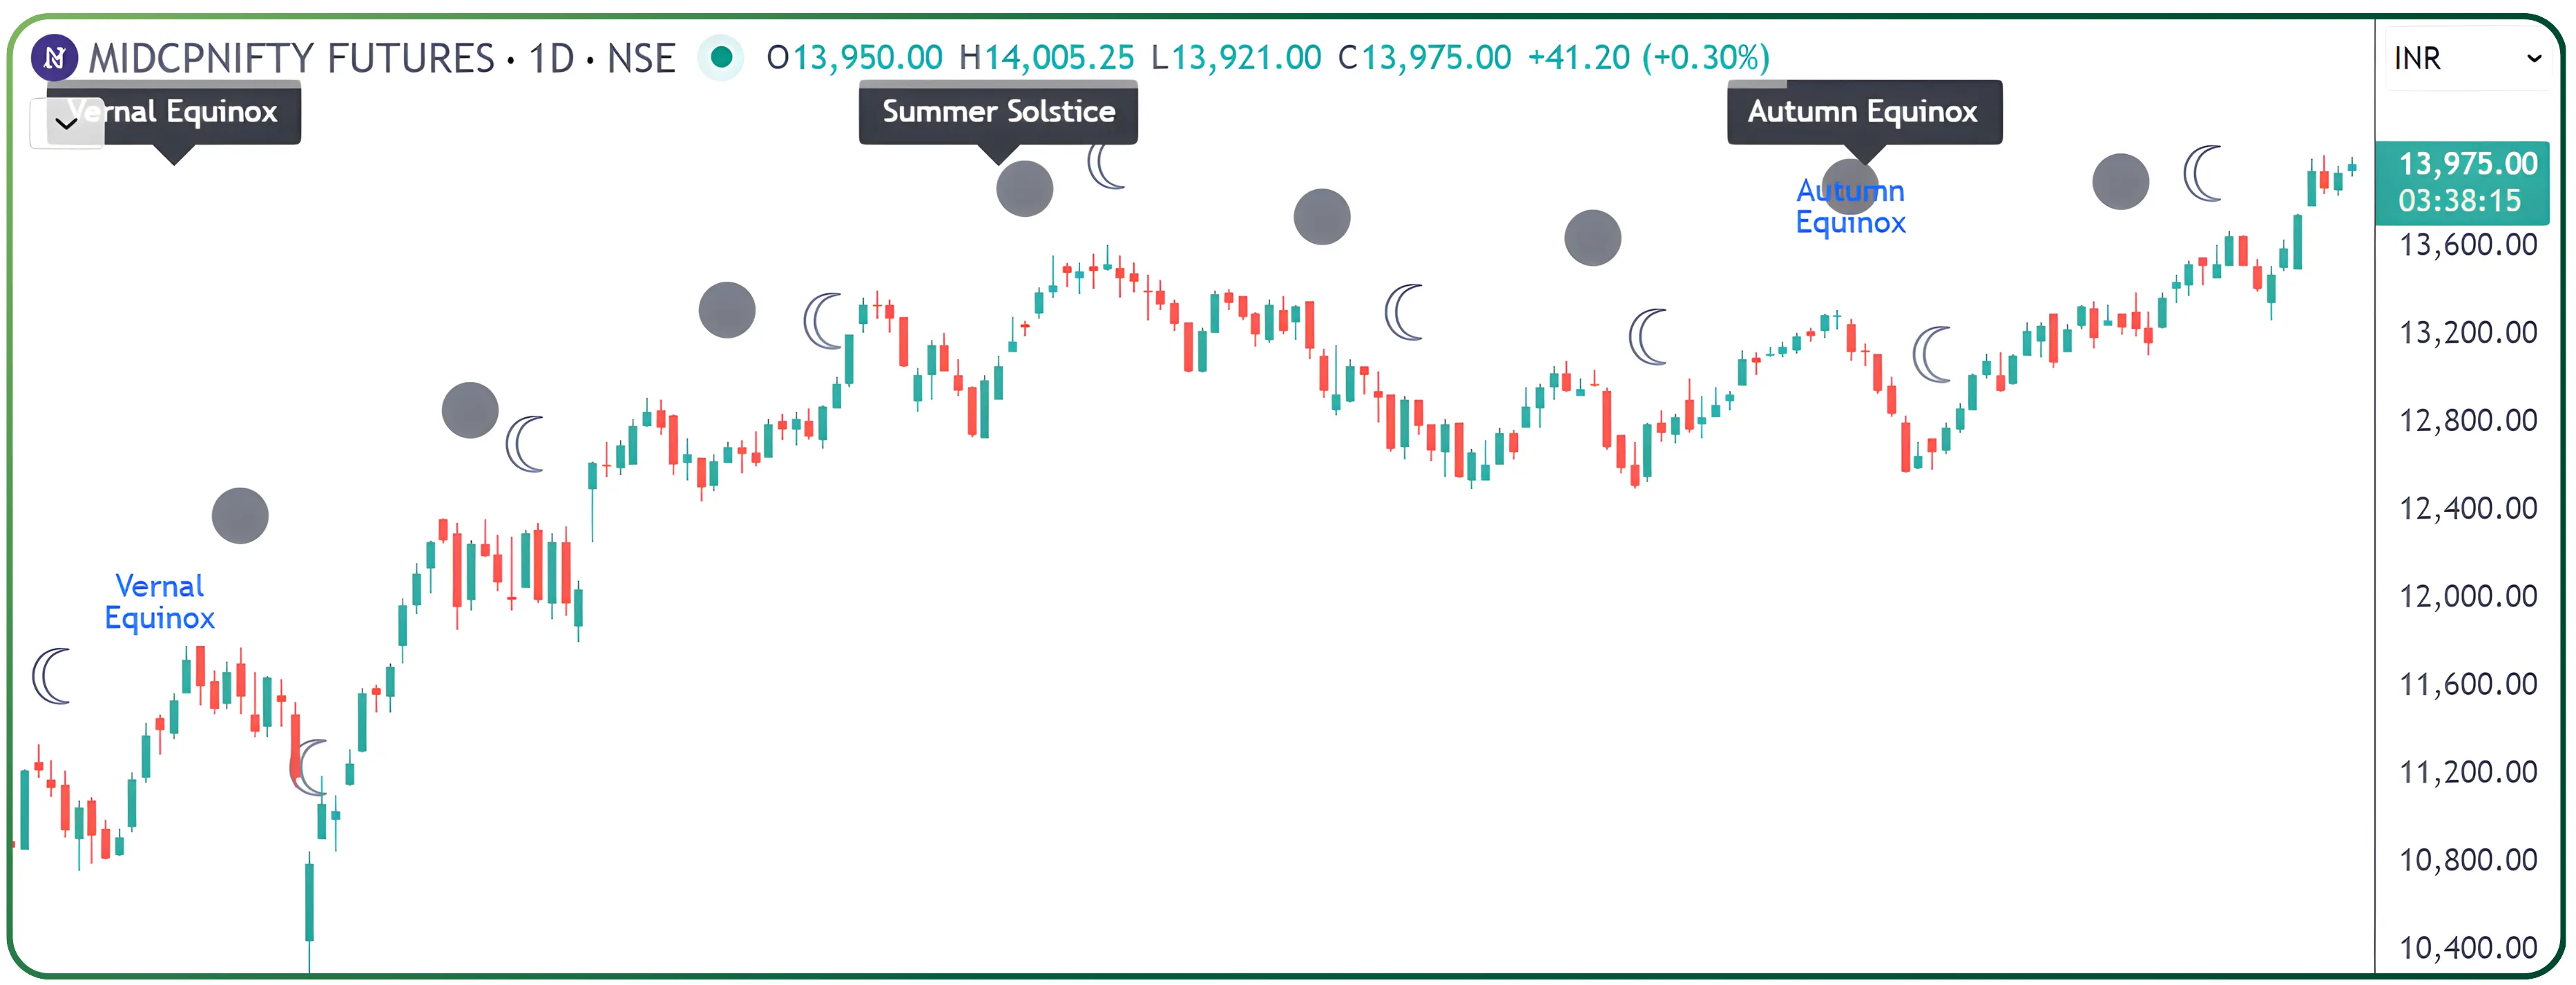
Interestingly, a few traders have gone one step further by creating the moon phases indicator. This visual overlay marks the full moon and new moon directly on price charts, showing how market movements line up with specific lunar phases. It looks simple at first glance, with alternating shaded areas or icons representing each moon cycle, but it can be surprisingly revealing. Many traders use this indicator as an experimental layer to spot subtle emotional shifts or volatility spikes that align with these celestial moments. While it may not be a proven technical indicator, it offers a fascinating visual representation of how lunar data might influence price movements and investor sentiment.
In this chart, the Vernal Equinox marks the point where day and night become nearly equal, signalling the start of spring. Traders who study seasonal or celestial cycles treat this moment as a natural reset, and in the chart you can see the market beginning to lift shortly after this point, reflecting a shift in sentiment and fresh momentum.
The Summer Solstice appears later, marking the longest day of the year and the beginning of summer. It often represents a peak in natural energy cycles, and on the chart it aligns with the market reaching a high before gradually cooling off. Together, the Vernal Equinox and Summer Solstice act as seasonal markers that help traders observe how broader natural cycles may line up with changes in trend, mood, or market strength.
Human behavior and market psychology under celestial influence
At its core, the market is a mirror of human emotions like fear, greed, hope, and anxiety. And what is more emotional than the moon itself, long tied to cycles of mood and energy?
Financial astrology, though often dismissed, explores how celestial bodies and celestial phenomena such as eclipses and half illuminated moons might affect stock prices through shifts in investor sentiment. While traditional technical and fundamental analysis methods rely on quantifiable data, astrological insights focus on deeper understanding of human behavior.
This blend of psychology and pattern recognition makes the moon cycle a fascinating backdrop for traders seeking valuable insights into market conditions beyond just numbers.
Also Read : Decoding Price Battles Through Point & Figure Charts
Historical data, logical thinking, and modern strategy
Serious traders today use lunar data not as a primary strategy, but as an experimental overlay on proven technical systems.
Think of it like this: you use your price charts, mathematical principles, and risk management plan as your solid foundation. Then you observe how the moon cycle might amplify or soften market trends during certain lunar phases.
When integrated carefully, it becomes a systematic approach that is not superstition, but a blend of curiosity and data-driven insights exploring various aspects of market behavior.
Also read : The Blueprint to trading Gartleys
Financial astrology or market psychology? You decide.
So, does the moon really influence market behavior?
Maybe. Or maybe the markets simply mirror us, and since we are affected by the moon, the pattern emerges naturally.
Whether or not there is a reliable tool in this idea, exploring it reminds us that markets are not just about numbers. They are about people, and people are deeply cyclical creatures. Perhaps the next time you are studying market analysis or scanning price charts, glance at the night sky. You might find that the full moon or new moon adds a subtle but intriguing relationship to your investment decisions.
The moon’s whisper in market trends
Lunar cycles in trading may not replace your favorite technical indicators, but they can expand how you view market trends. If nothing else, they remind traders that market movements are not purely mechanical; they are emotional, collective, and sometimes even celestial. Still, lunar analysis lacks scientific validity, which is why it should only complement and never replace your core trading strategies, traditional tools, and proven systems. When approached correctly, lunar observations can sit alongside data-driven insights, helping traders explore psychological or cyclical patterns without compromising the logic, discipline, and structure of their primary market approach.
Ready to apply these strategies in real markets? Get started with CubePlus and open your account and begin your journey toward smarter, goal-driven trading. Join now and trade with clarity, confidence, and an edge
Disclaimer: The information provided in our blogs is for informational purposes only and should not be construed as financial, investment, or trading advice. Trading and investing in the securities market carries risk. Always conduct your own research and consult with a qualified financial advisor before making any investment decisions. Past performance is not indicative of future results. Copyrighted and original content for your trading and investing needs.
© 2025 — Tradejini. All Rights Reserved.


