


Candlestick patterns are more than simply lines and rectangles on a chart; they are a window into the minds of traders and investors. These formations reflect the emotions and cognitive biases that drive market behavior. By understanding the psychology behind candlestick patterns, you will gain valuable insights into market sentiment and make better informed trading decisions.
The Role of Emotion in Candlestick Patterns
Fear and Greed: Fear and greed are two of the most powerful emotions influencing market behavior. Fear can cause selling pressure as investors panic and exit their positions, while greed may lead to excessive buying as market participants become overly optimistic and chase higher prices. These emotional responses are often reflected in candlestick patterns and can signal shifts in the market.
FOMO (Fear of Missing Out): The fear of missing out (FOMO) pushes traders to follow market trends late, driven by seeing others' successes and feeling pressured to join the momentum. Candlestick patterns, such as long bullish candles, capture the flow of market sentiment by indicating buyer confidence and upward momentum, while long bearish candles suggest selling pressure. These patterns provide a visual roadmap for gauging market direction, but FOMO often causes traders to neglect this information in favor of emotionally driven decisions. Social media further amplifies FOMO with curated success stories and viral trends. Staying focused on predefined strategies and using candlestick patterns as a guide can help traders avoid ill-timed trades and unnecessary losses.
Regret: Regret often arises when a trader hesitates to enter a position and later sees the asset’s price rise. This feeling can lead to impulsive actions, such as buying at higher prices without proper analysis, which may result in losses. The fear of repeating past mistakes often drives traders to act emotionally rather than strategically, increasing the risk of poor decisions.
By recognizing these emotional triggers and observing how they manifest in candlestick patterns, you will better understand potential market movements and react with greater confidence.
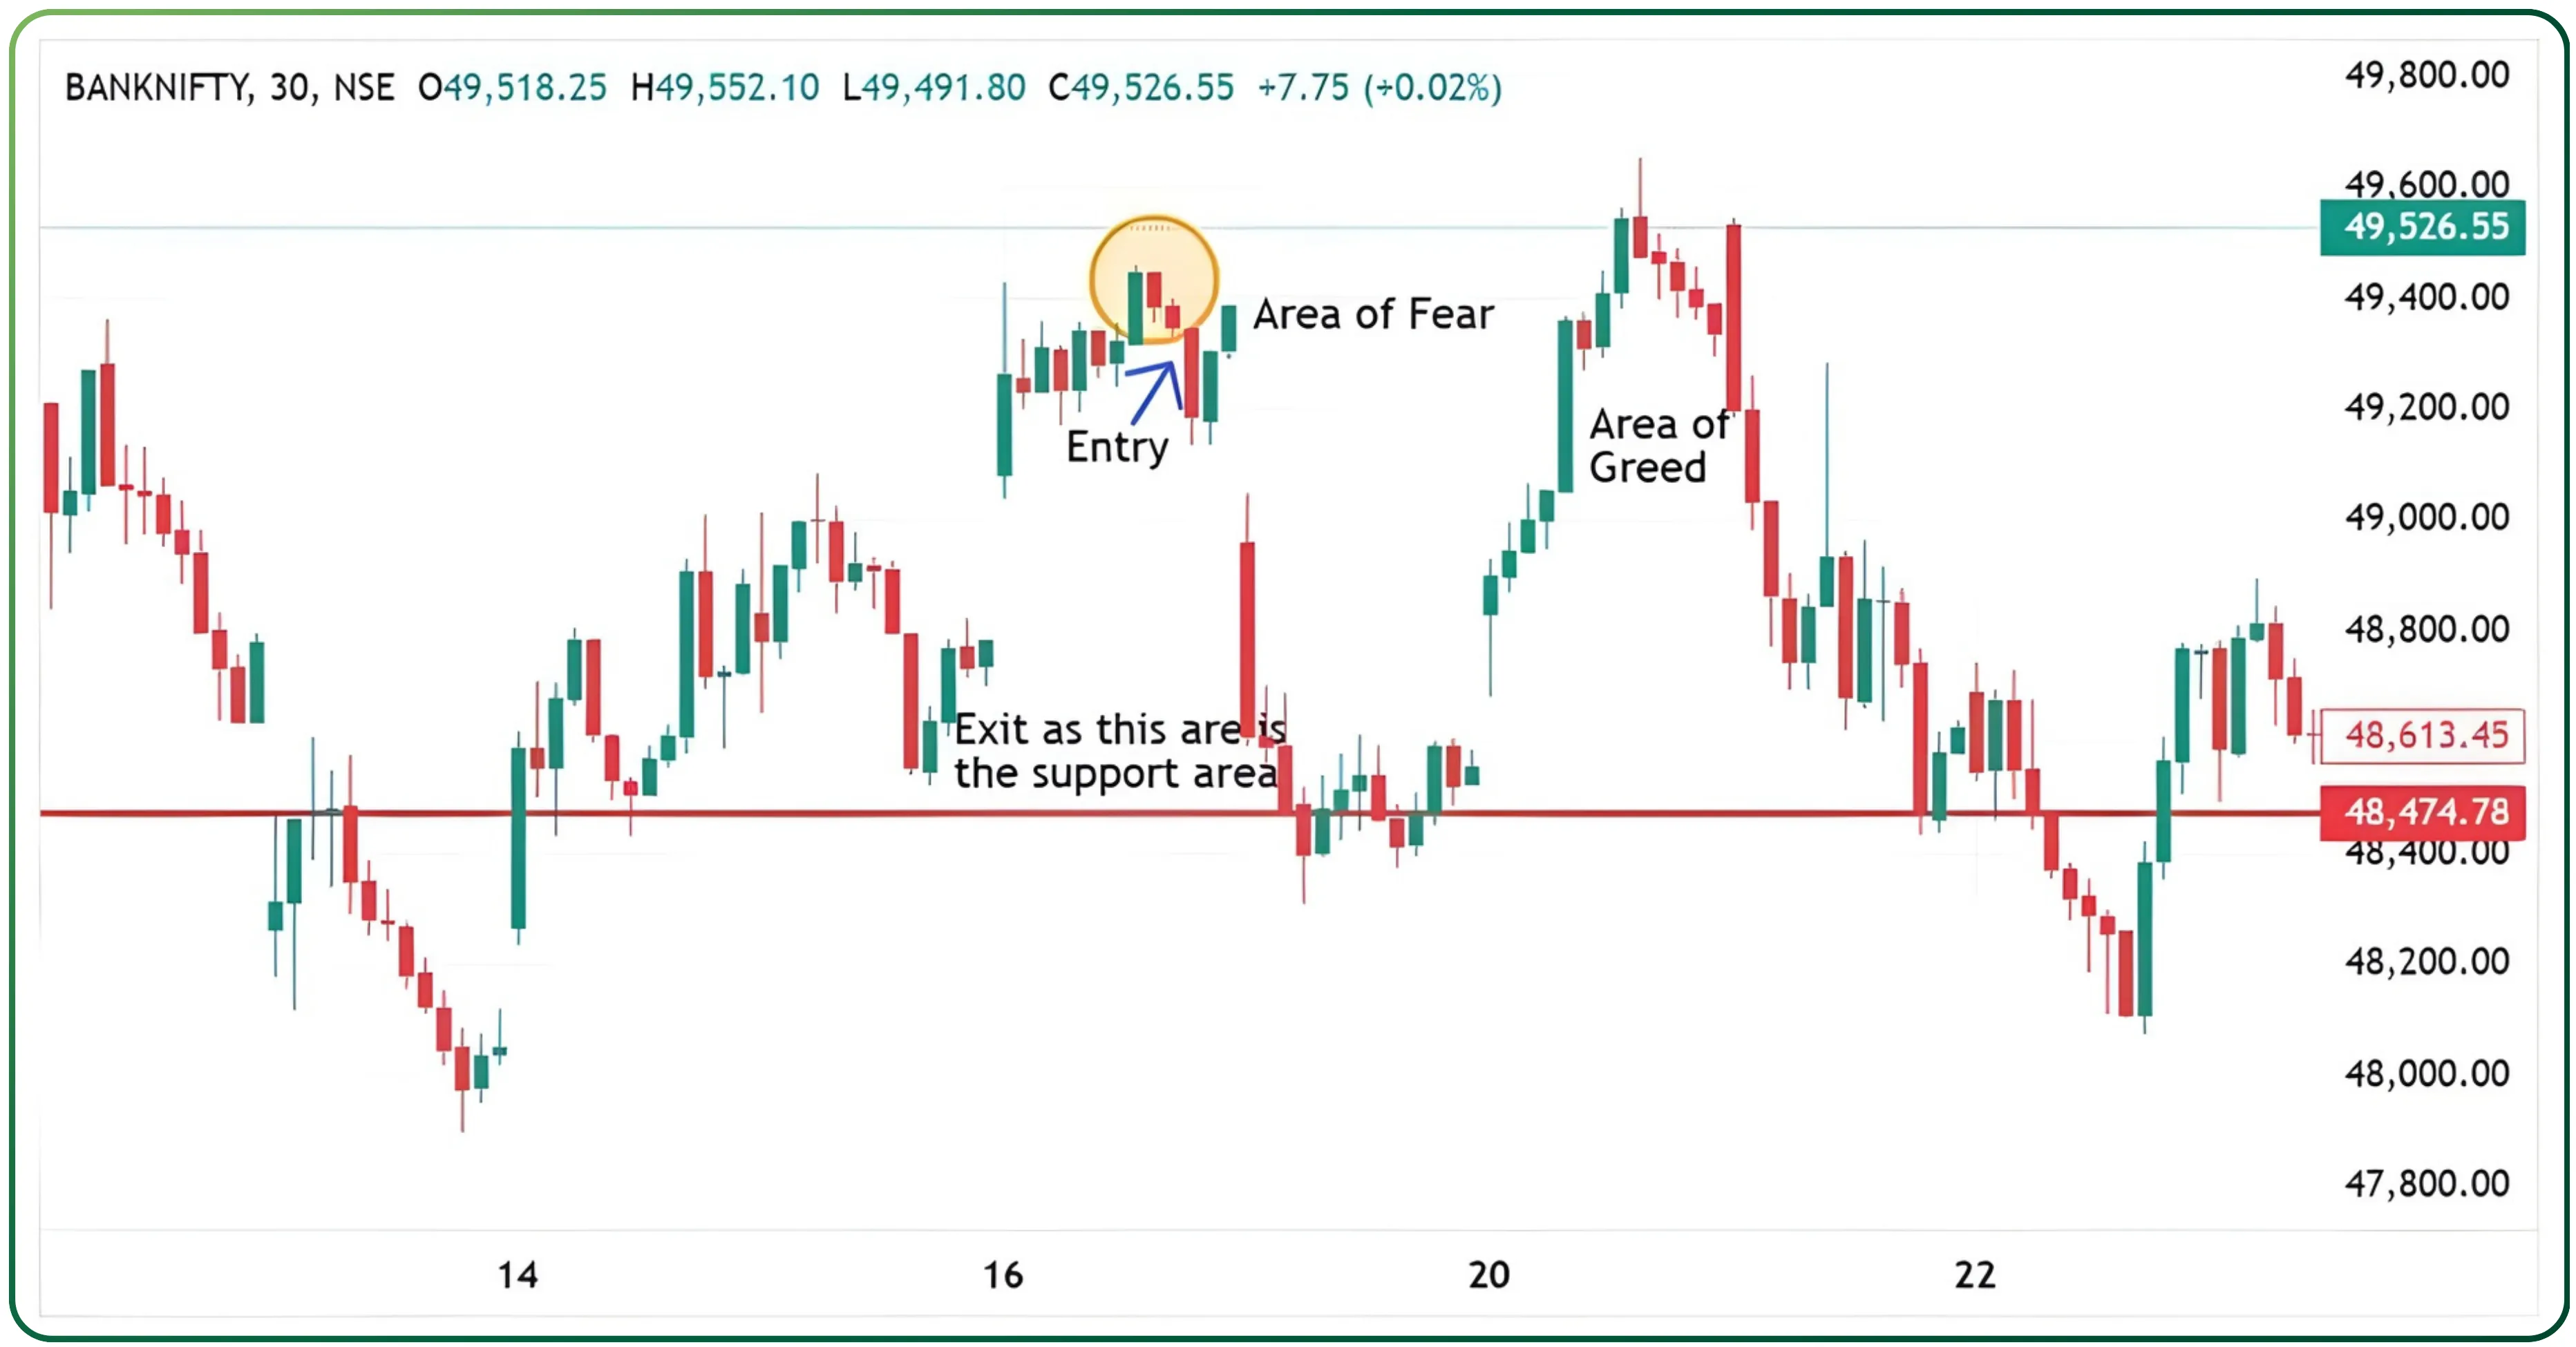
Fear and greed play a huge role in trading decisions, and understanding them is crucial for success. Take the scenario in the image as an example. After entering a trade, a green candle forms, giving a hint of a potential upward move. But soon after, the price pulls back to the buying level. This is where emotions kick in.
Some traders, driven by fear of losing money, might panic and exit the trade prematurely, even though their stop loss has not been hit. On the other hand, there are those who stick with the trade since the stop loss is intact. Now, imagine the trade goes on to deliver a 2% return. Instead of locking in profits, greed takes over. These traders hold on, expecting even bigger gains. Unfortunately, the market doesn’t always align with expectations, and the price might reverse, leaving them exiting at breakeven or even a loss.
This is why having a solid risk-to-reward ratio and sticking to your stop loss is so important. It helps you avoid letting fear or greed dictate your actions. By staying disciplined and controlling your emotions, you give yourself a much better chance of consistently staying in profit.
Candlestick Patterns and Their Psychological Implications
Candlestick patterns tell the story of market sentiment in real time. A Doji signals indecision, often hinting at a reversal after a trend. The Hammer shows buyers stepping in during a downtrend, while a Hanging Man suggests potential weakness in an uptrend. Patterns like Three White Soldiers indicate strong buying momentum, while Three Black Crows point to increased selling pressure. Recognizing these patterns helps you better understand market dynamics and plan your trades effectively.
Imagine a stock nearing a key resistance level. Retail traders might see a bullish candlestick and jump in, expecting a breakout. But institutional players often drive the price slightly above resistance just enough to trigger stop-losses and attract retail buyers. Then, they quickly reverse the move—this is a false breakout, taking advantage of retail traders' mistakes. On the other hand, a real trend confirmation shows steady momentum, increased volume, and confirmation from indicators like MACD divergence or RSI signals, ensuring the move has strength. This shows the importance of using multiple confirmations to avoid traps set by smart money.
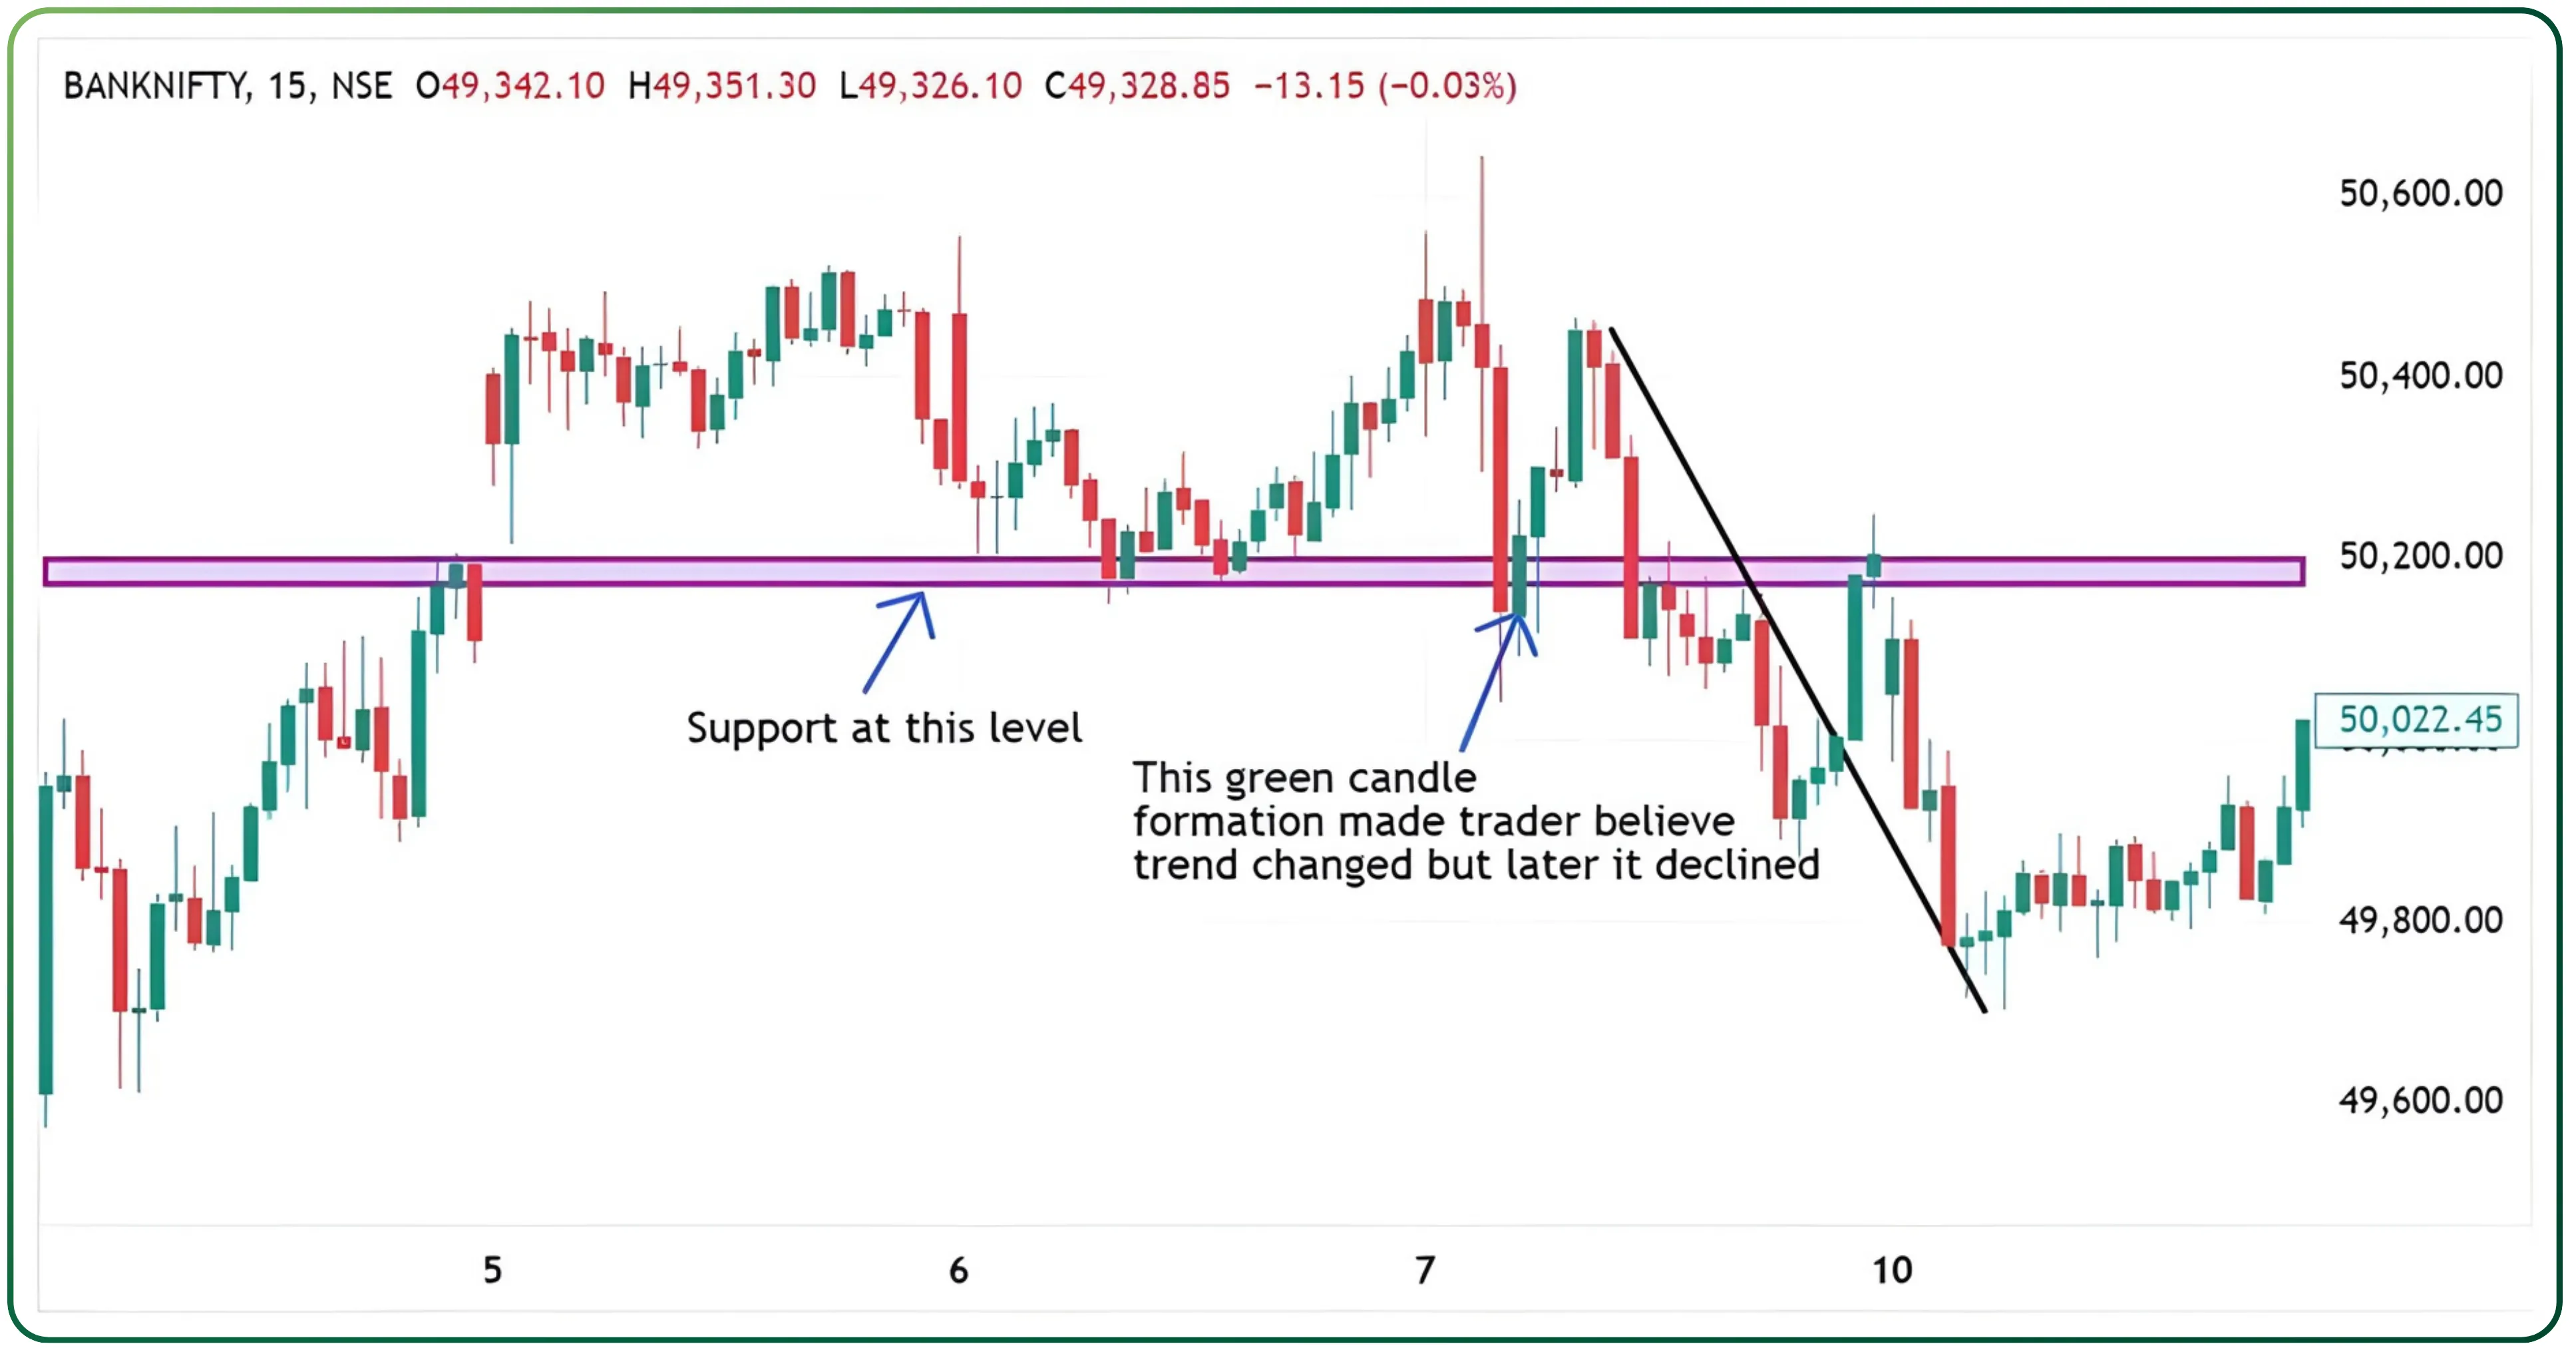
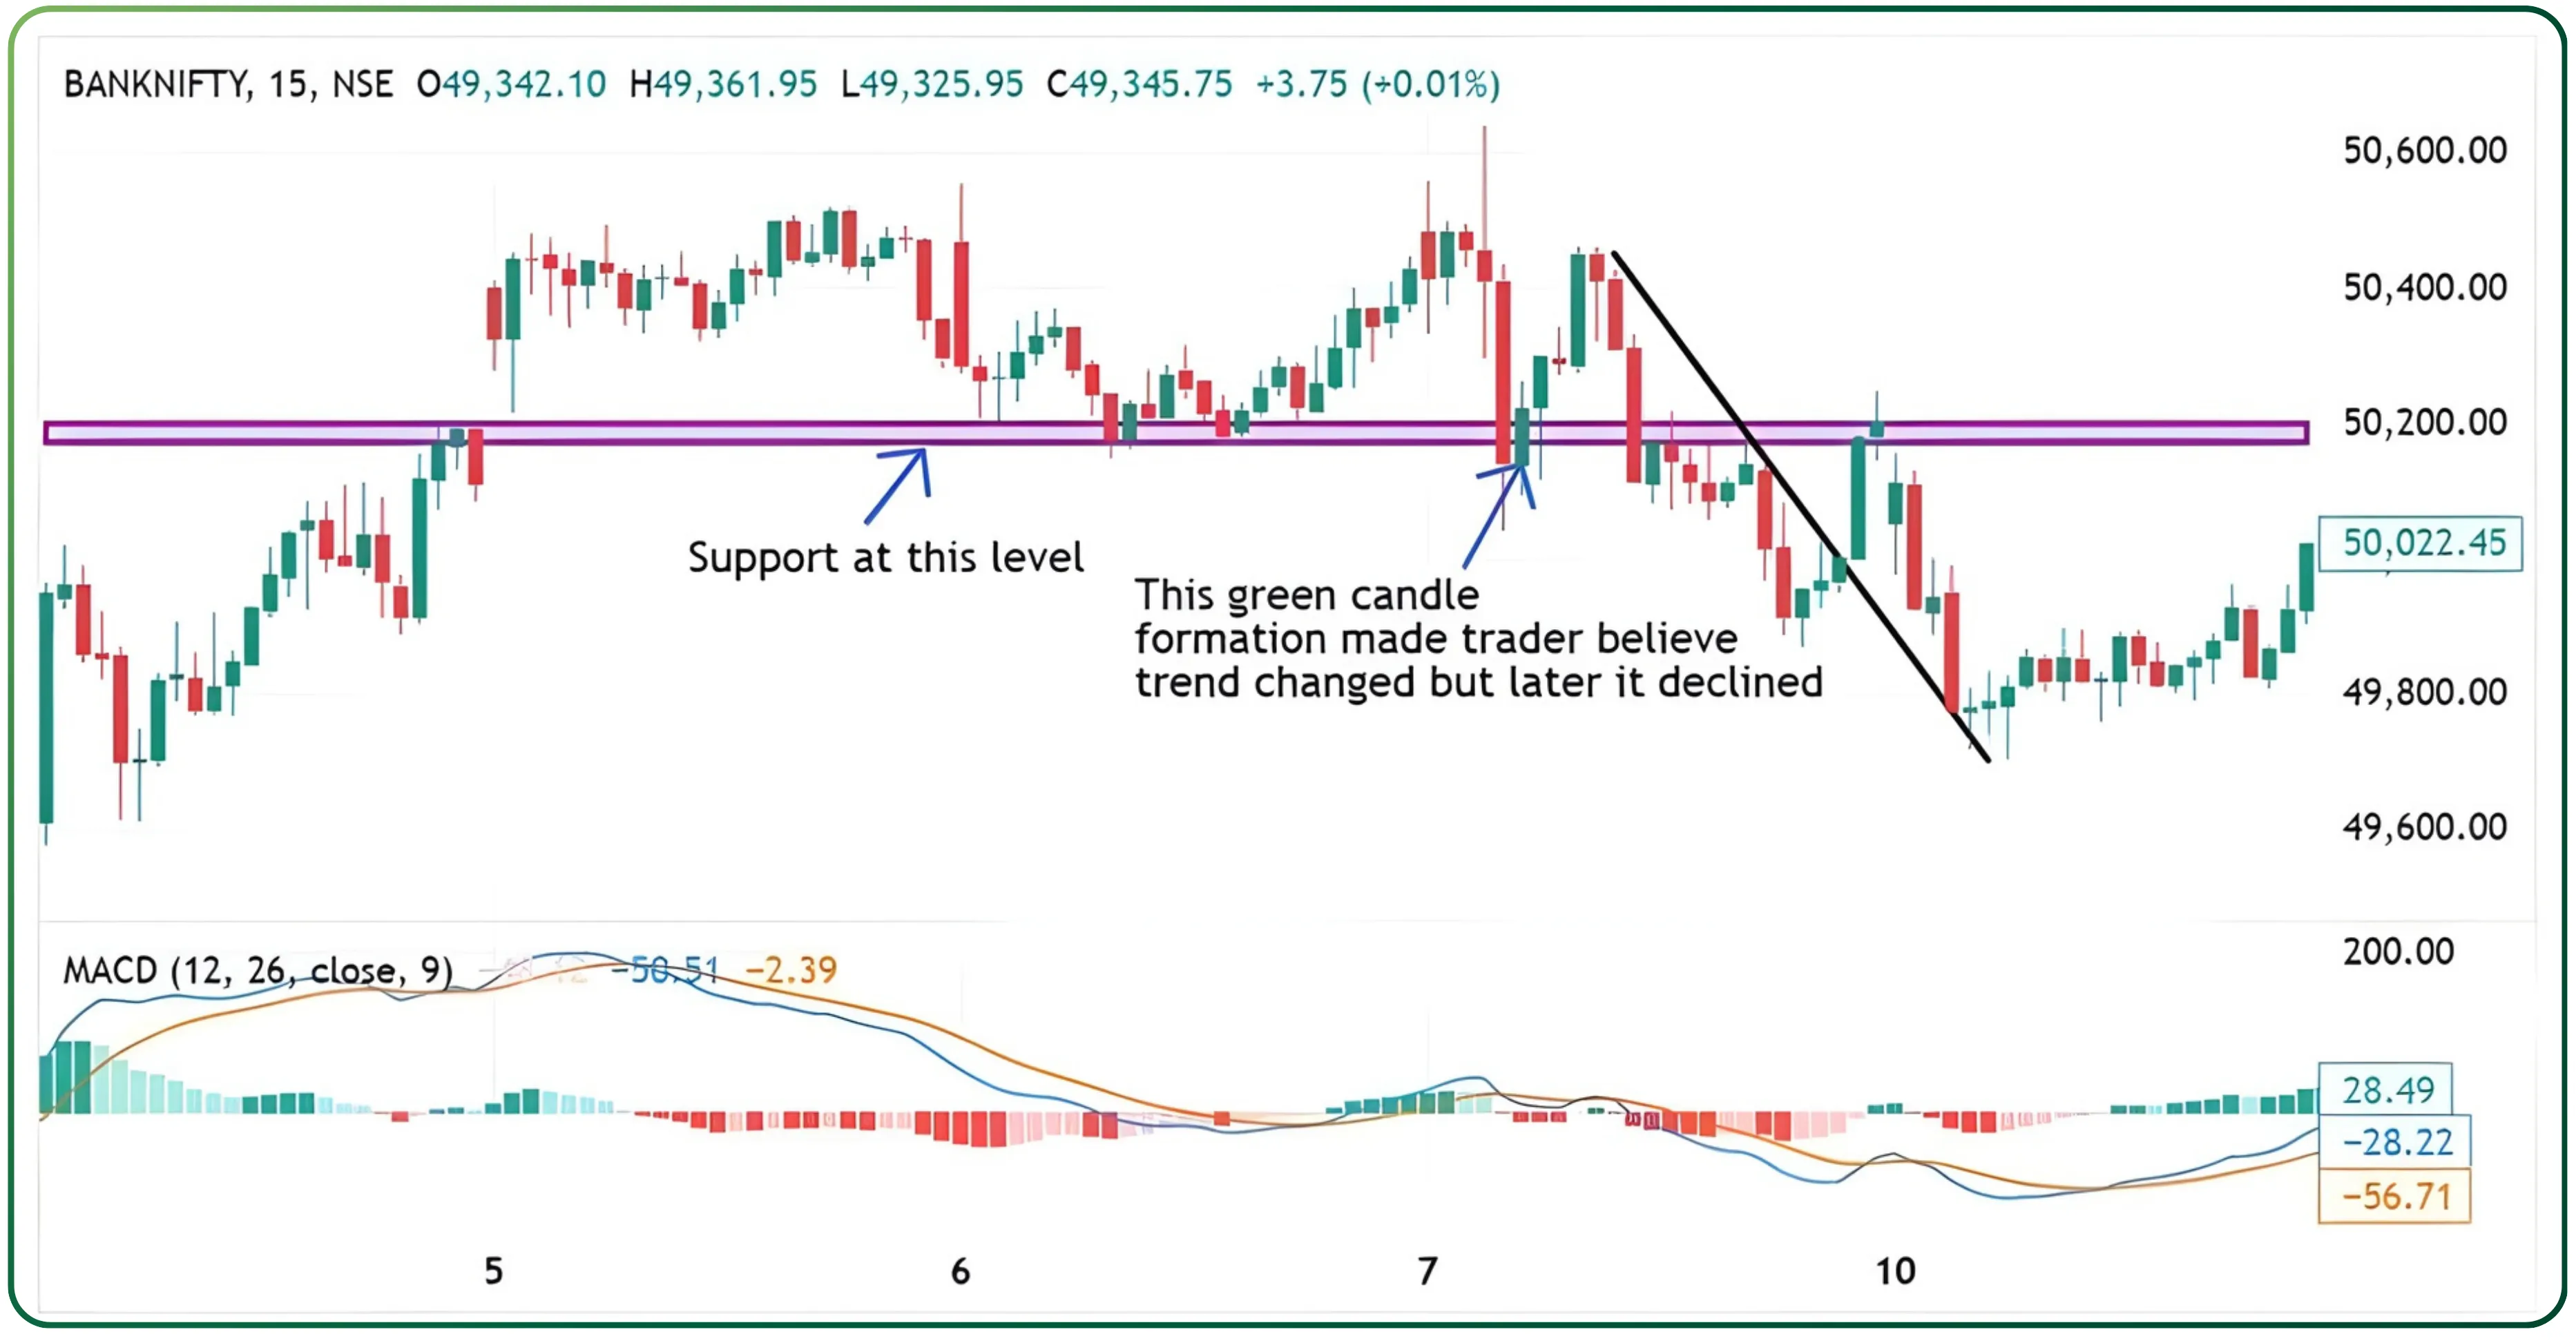
If one had applied supporting indicators, it could have helped prevent a wrong entry, as shown in the image below. For example, the MACD did not signal a buy trade, which could have saved traders from making the incorrect decision.
Reading Market Sentiment: Smart Money Versus Retail Traders
Not all market participants behave in the same manner. Institutional investors, sometimes known as smart money, have strategies that often differ from those of retail traders. Certain candlestick formations, such as false breakouts, may be used by institutional players to test retail sentiment. This understanding will help you differentiate between genuine market signals and traps set to provoke hasty reactions among less experienced traders. By learning how these formations work, you will be in a better position to identify real trend confirmations rather than following the herd.
How to Use Candlestick Psychology in Your Trading
Understanding the psychological aspects of candlestick patterns can provide you with a competitive edge. You will learn to keep your emotions in check by recognizing the influence of fear and greed on your trading decisions. Setting predefined entry and exit points, as well as using stop-loss orders, are essential strategies for managing risk. It is also important to avoid confirmation bias by using additional technical indicators or fundamental analysis to verify the signals you observe.
Recognize the impact of herd behavior and do not allow it to drive your decisions. Instead, develop a well-rounded strategy that combines candlestick analysis with other technical tools. This approach will help you manage risks better and enhance your overall trading performance.
Blueprint Hidden in Every Candlestick Pattern
Candlestick patterns are not merely technical signals; they are reflections of the human psyche in the financial markets. By balancing technical analysis with psychological insights, you will be able to navigate the unpredictable world of trading with greater confidence. At Tradejini, we believe in empowering you with insights that extend beyond the basics. Recognizing the emotional narratives behind each candlestick can provide you with the edge you need to make informed and confident trading decisions.
Embrace the story behind every candle. Allow your analysis to be guided by the interplay of market emotions and take control of your trading journey.
Disclaimer: The information provided in our blogs is for informational purposes only and should not be construed as financial, investment, or trading advice. Trading and investing in the securities market carries risk. Always conduct your own research and consult with a qualified financial advisor before making any investment decisions. Past performance is not indicative of future results. Copyrighted and original content for your trading and investing needs.
© 2025 — Tradejini. All Rights Reserved.