


Ever noticed how prices on a chart sometimes move within tight, converging lines like they are coiling up, waiting to spring in a new direction? These formations are known as triangle patterns, and they are some of the tools traders use to make sense of market hesitation.
Triangle patterns are among the most reliable and commonly seen chart formations in technical analysis They represent a phase of consolidation. However, this quiet phase often leads to a strong breakout once the balance between buyers and sellers shifts. The shape of the triangle gives clues about the potential direction of the move.The three most widely used triangle patterns are Ascending triangle, Descending triangle and Symmetrical triangle.
Ascending Triangle
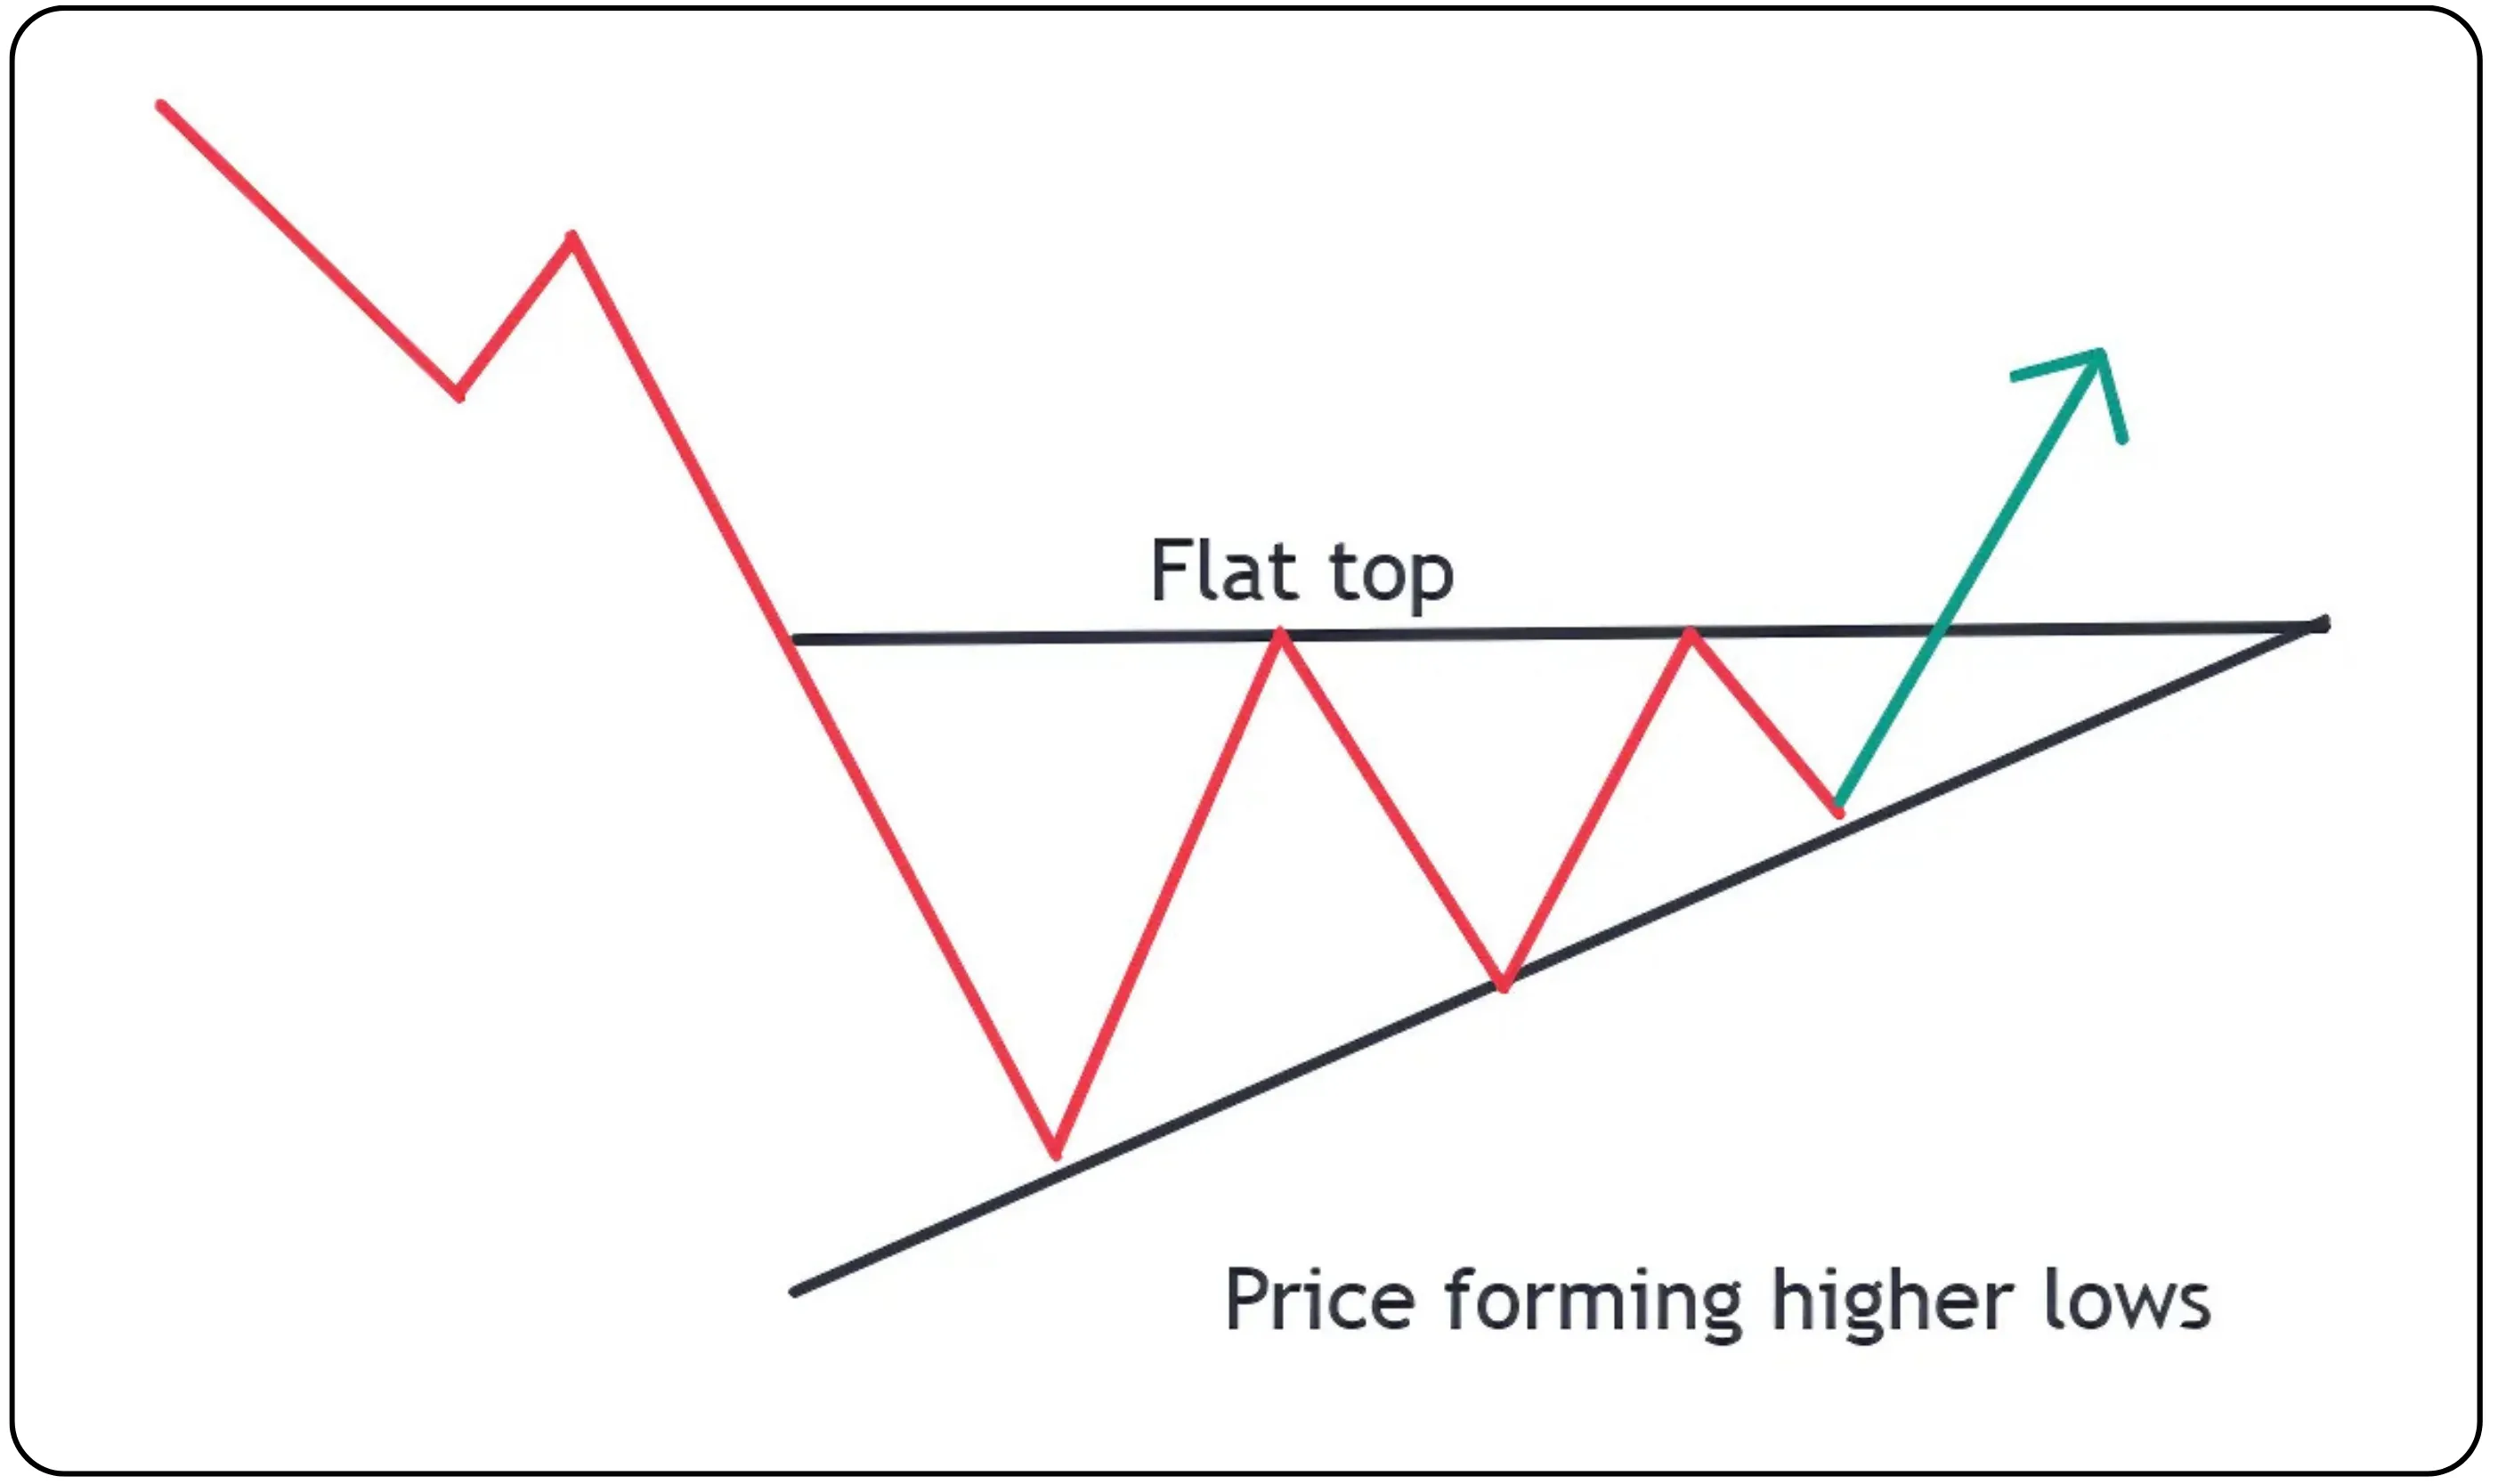
Imagine a price chart where the top stays flat, but the bottom keeps rising. That is an Ascending Triangle — a bullish pattern that shows buyers are getting more aggressive while sellers are holding their ground at a resistance level.
What It Looks Like:
Flat resistance line on top: The price keeps hitting a ceiling.
Rising support line on bottom: Buyers keep stepping in at higher levels.
Triangle narrows toward the point of breakout.
This pattern often forms when traders expect a bullish breakout, especially if it appears during an uptrend.
Market Psychology
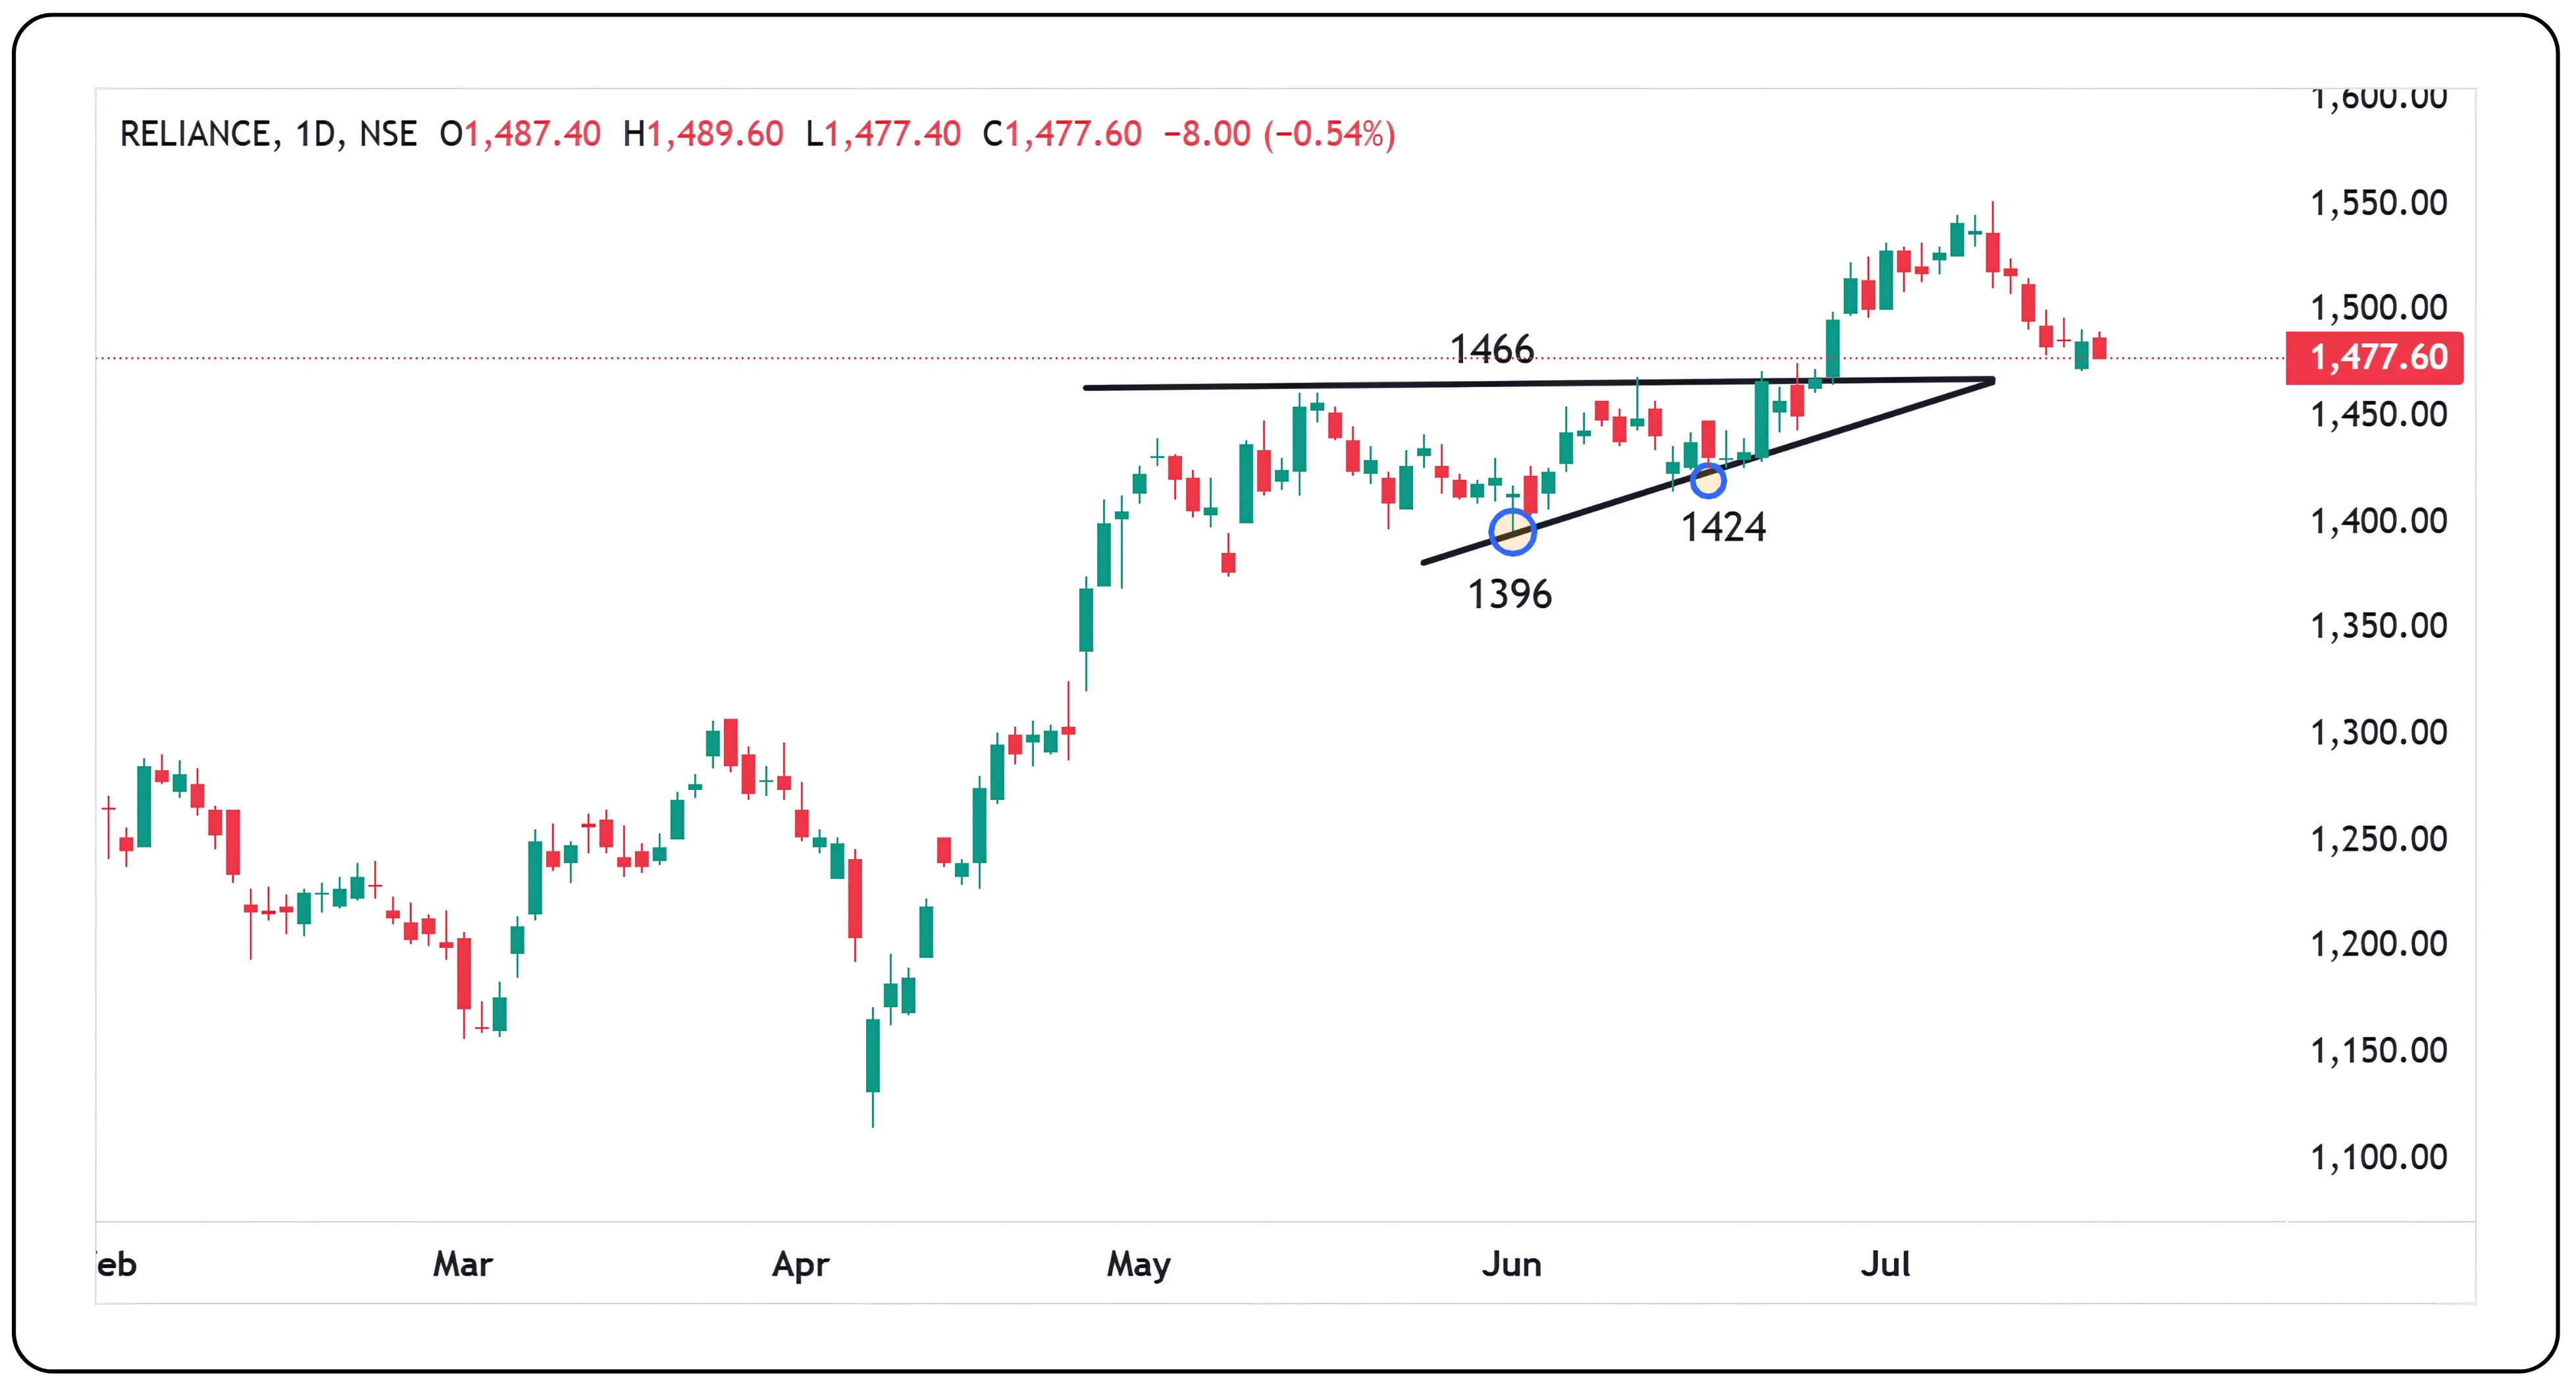
Let us say a stock is facing strong resistance at ₹1466. Every time it hits that level, it pulls back. But each pullback is smaller than the last — ₹1396, ₹1424. That tells you the bulls are gaining strength. They are not waiting for discounts. Eventually, they overpower the sellers and push the stock above ₹1466.
Ascending Triangles often break out upwards — around 63% to 70% of the time — and are considered continuation patterns.
How to Identify:
At least two highs at the same level (flat top)
At least two higher lows (rising bottom)
Volume shrinks as the pattern progresses
Breakout confirmed with a strong candle and volume spike
How to trade Ascending triangle
CONCORDBIO – Ascending Triangle Breakout Trade (November–December 2023)
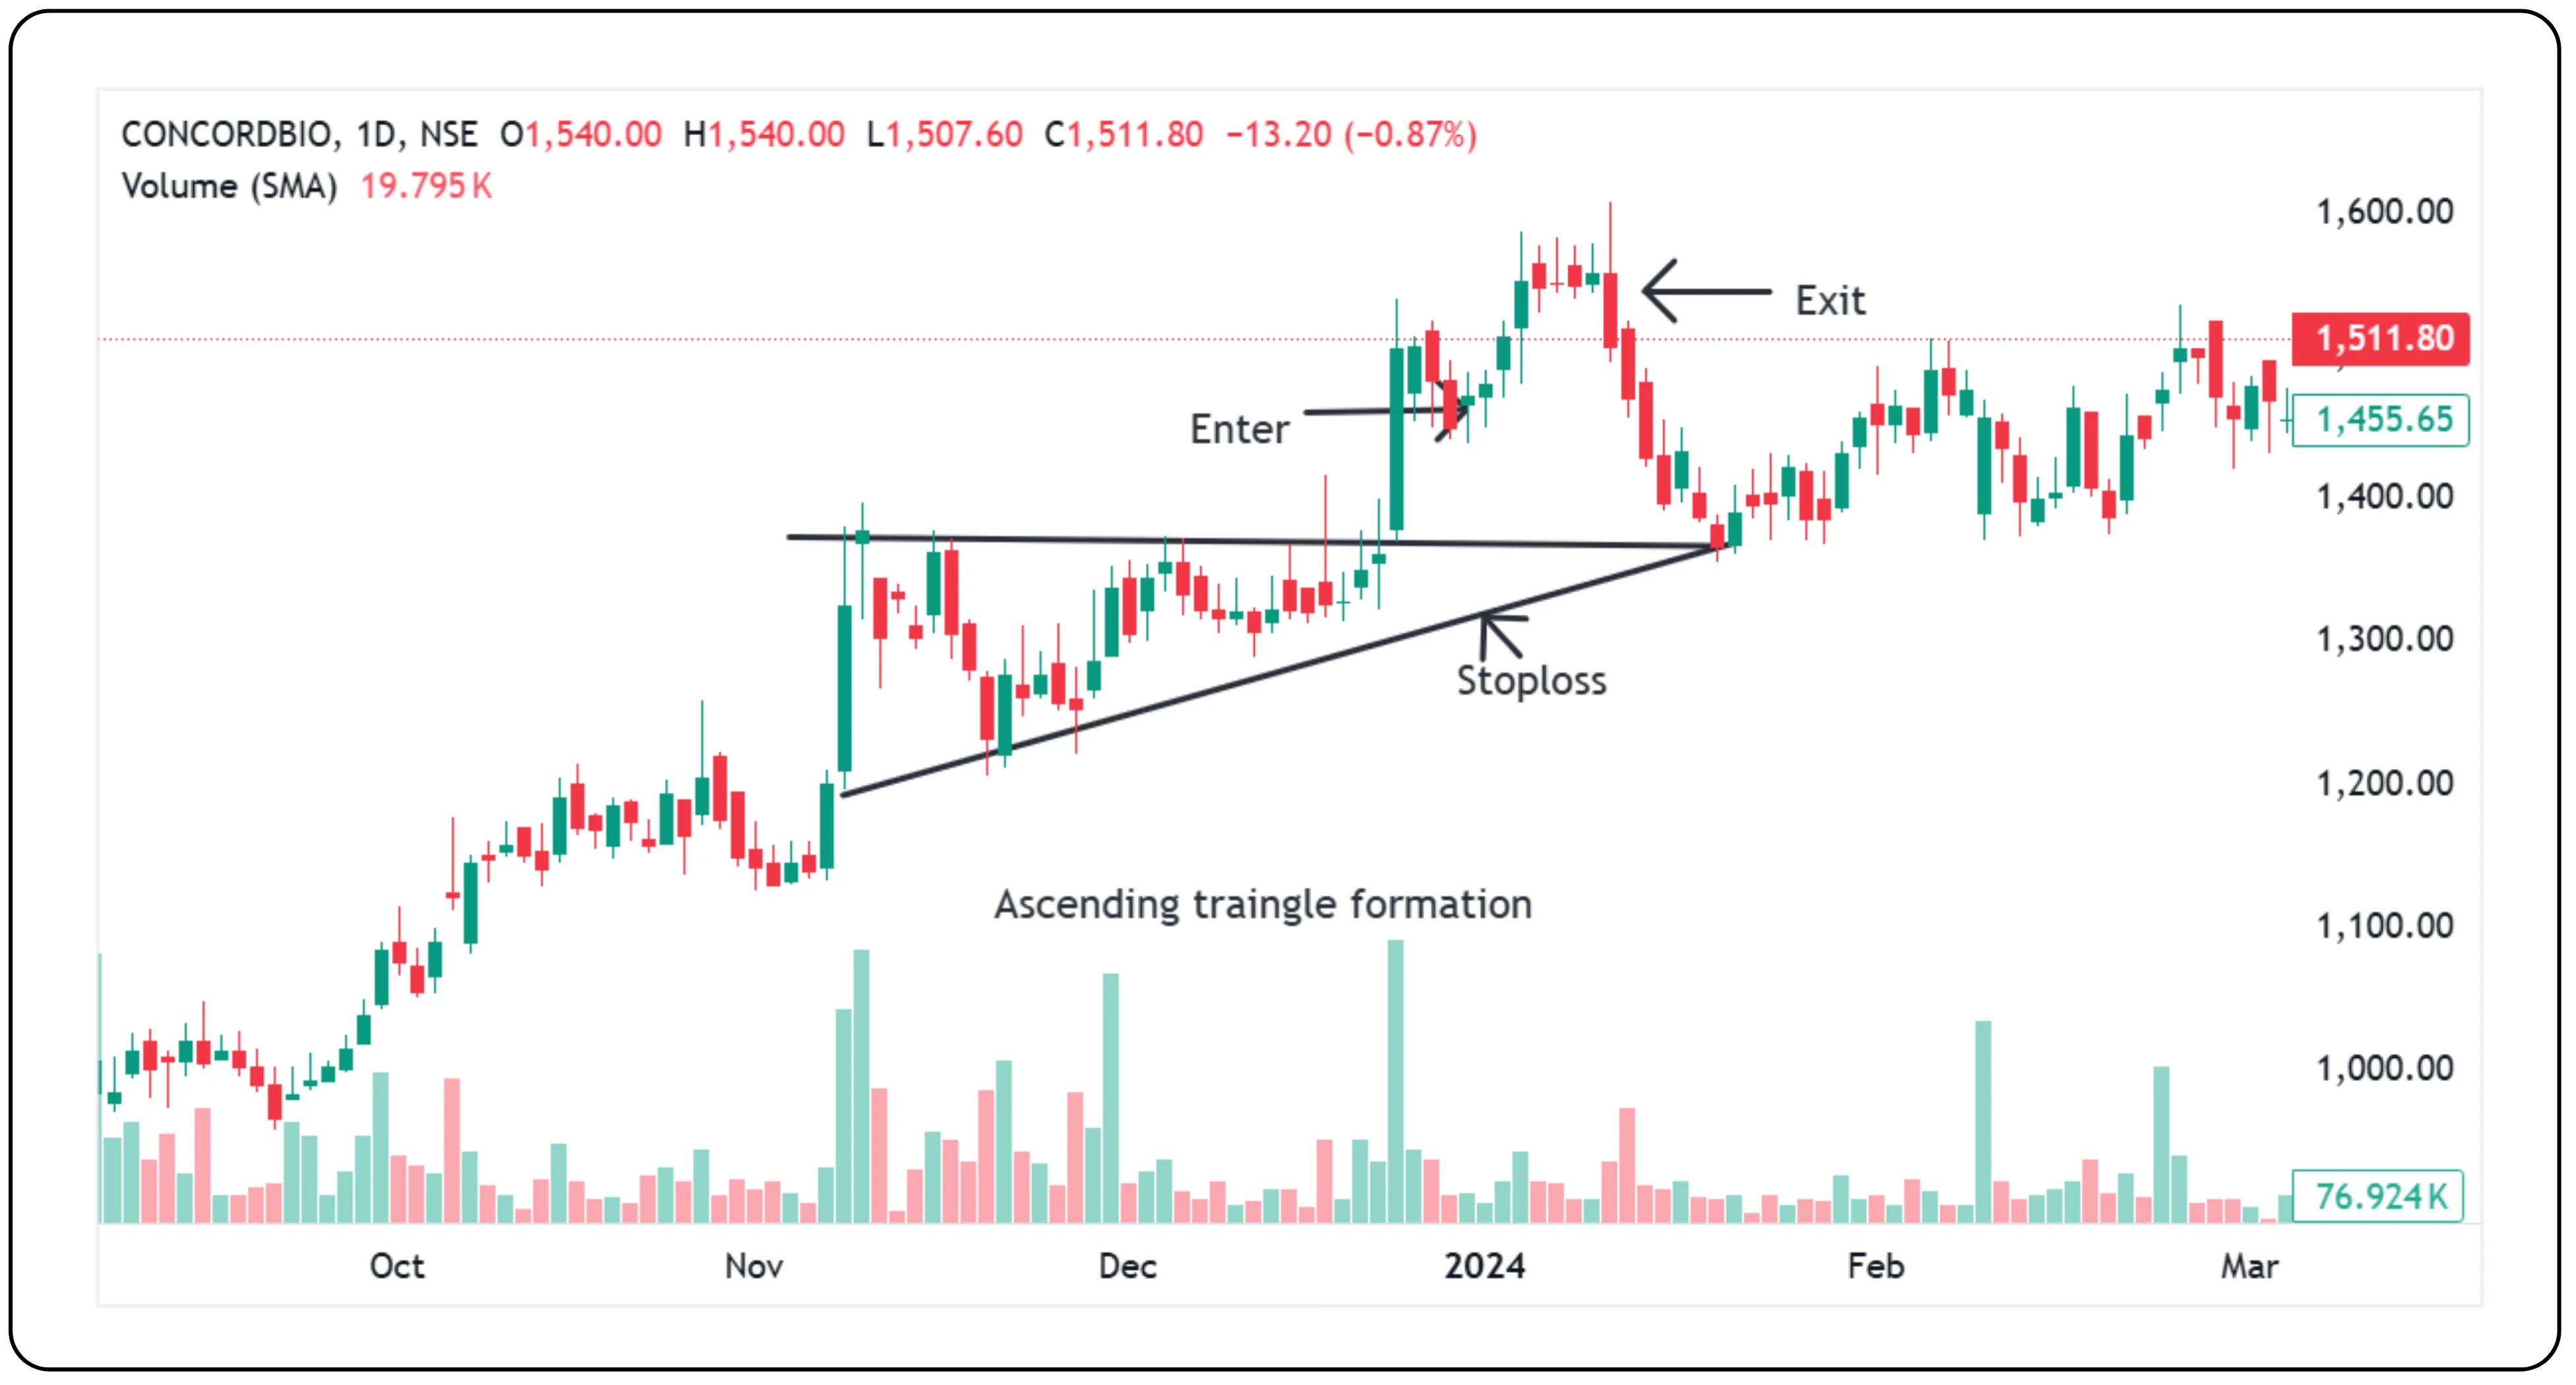
An ascending triangle pattern was observed on CONCORDBIO between 8th November and 1st December 2023. The breakout candle on 1st December was large and accompanied by good volume. However, entering immediately after such a big breakout candle can be risky, as price often pulls back slightly before continuing upward.
In this case, the entry was taken at ₹1464 during the minor pullback following the breakout.
Stop Loss: Placed just below the upper trendline of the triangle pattern.
Exit Strategy: Based on whichever occurred first —
The previous swing high
A 1:2 risk-to-reward ratio
The exit was successfully triggered at ₹1547, meeting the desired target.
Descending Triangle
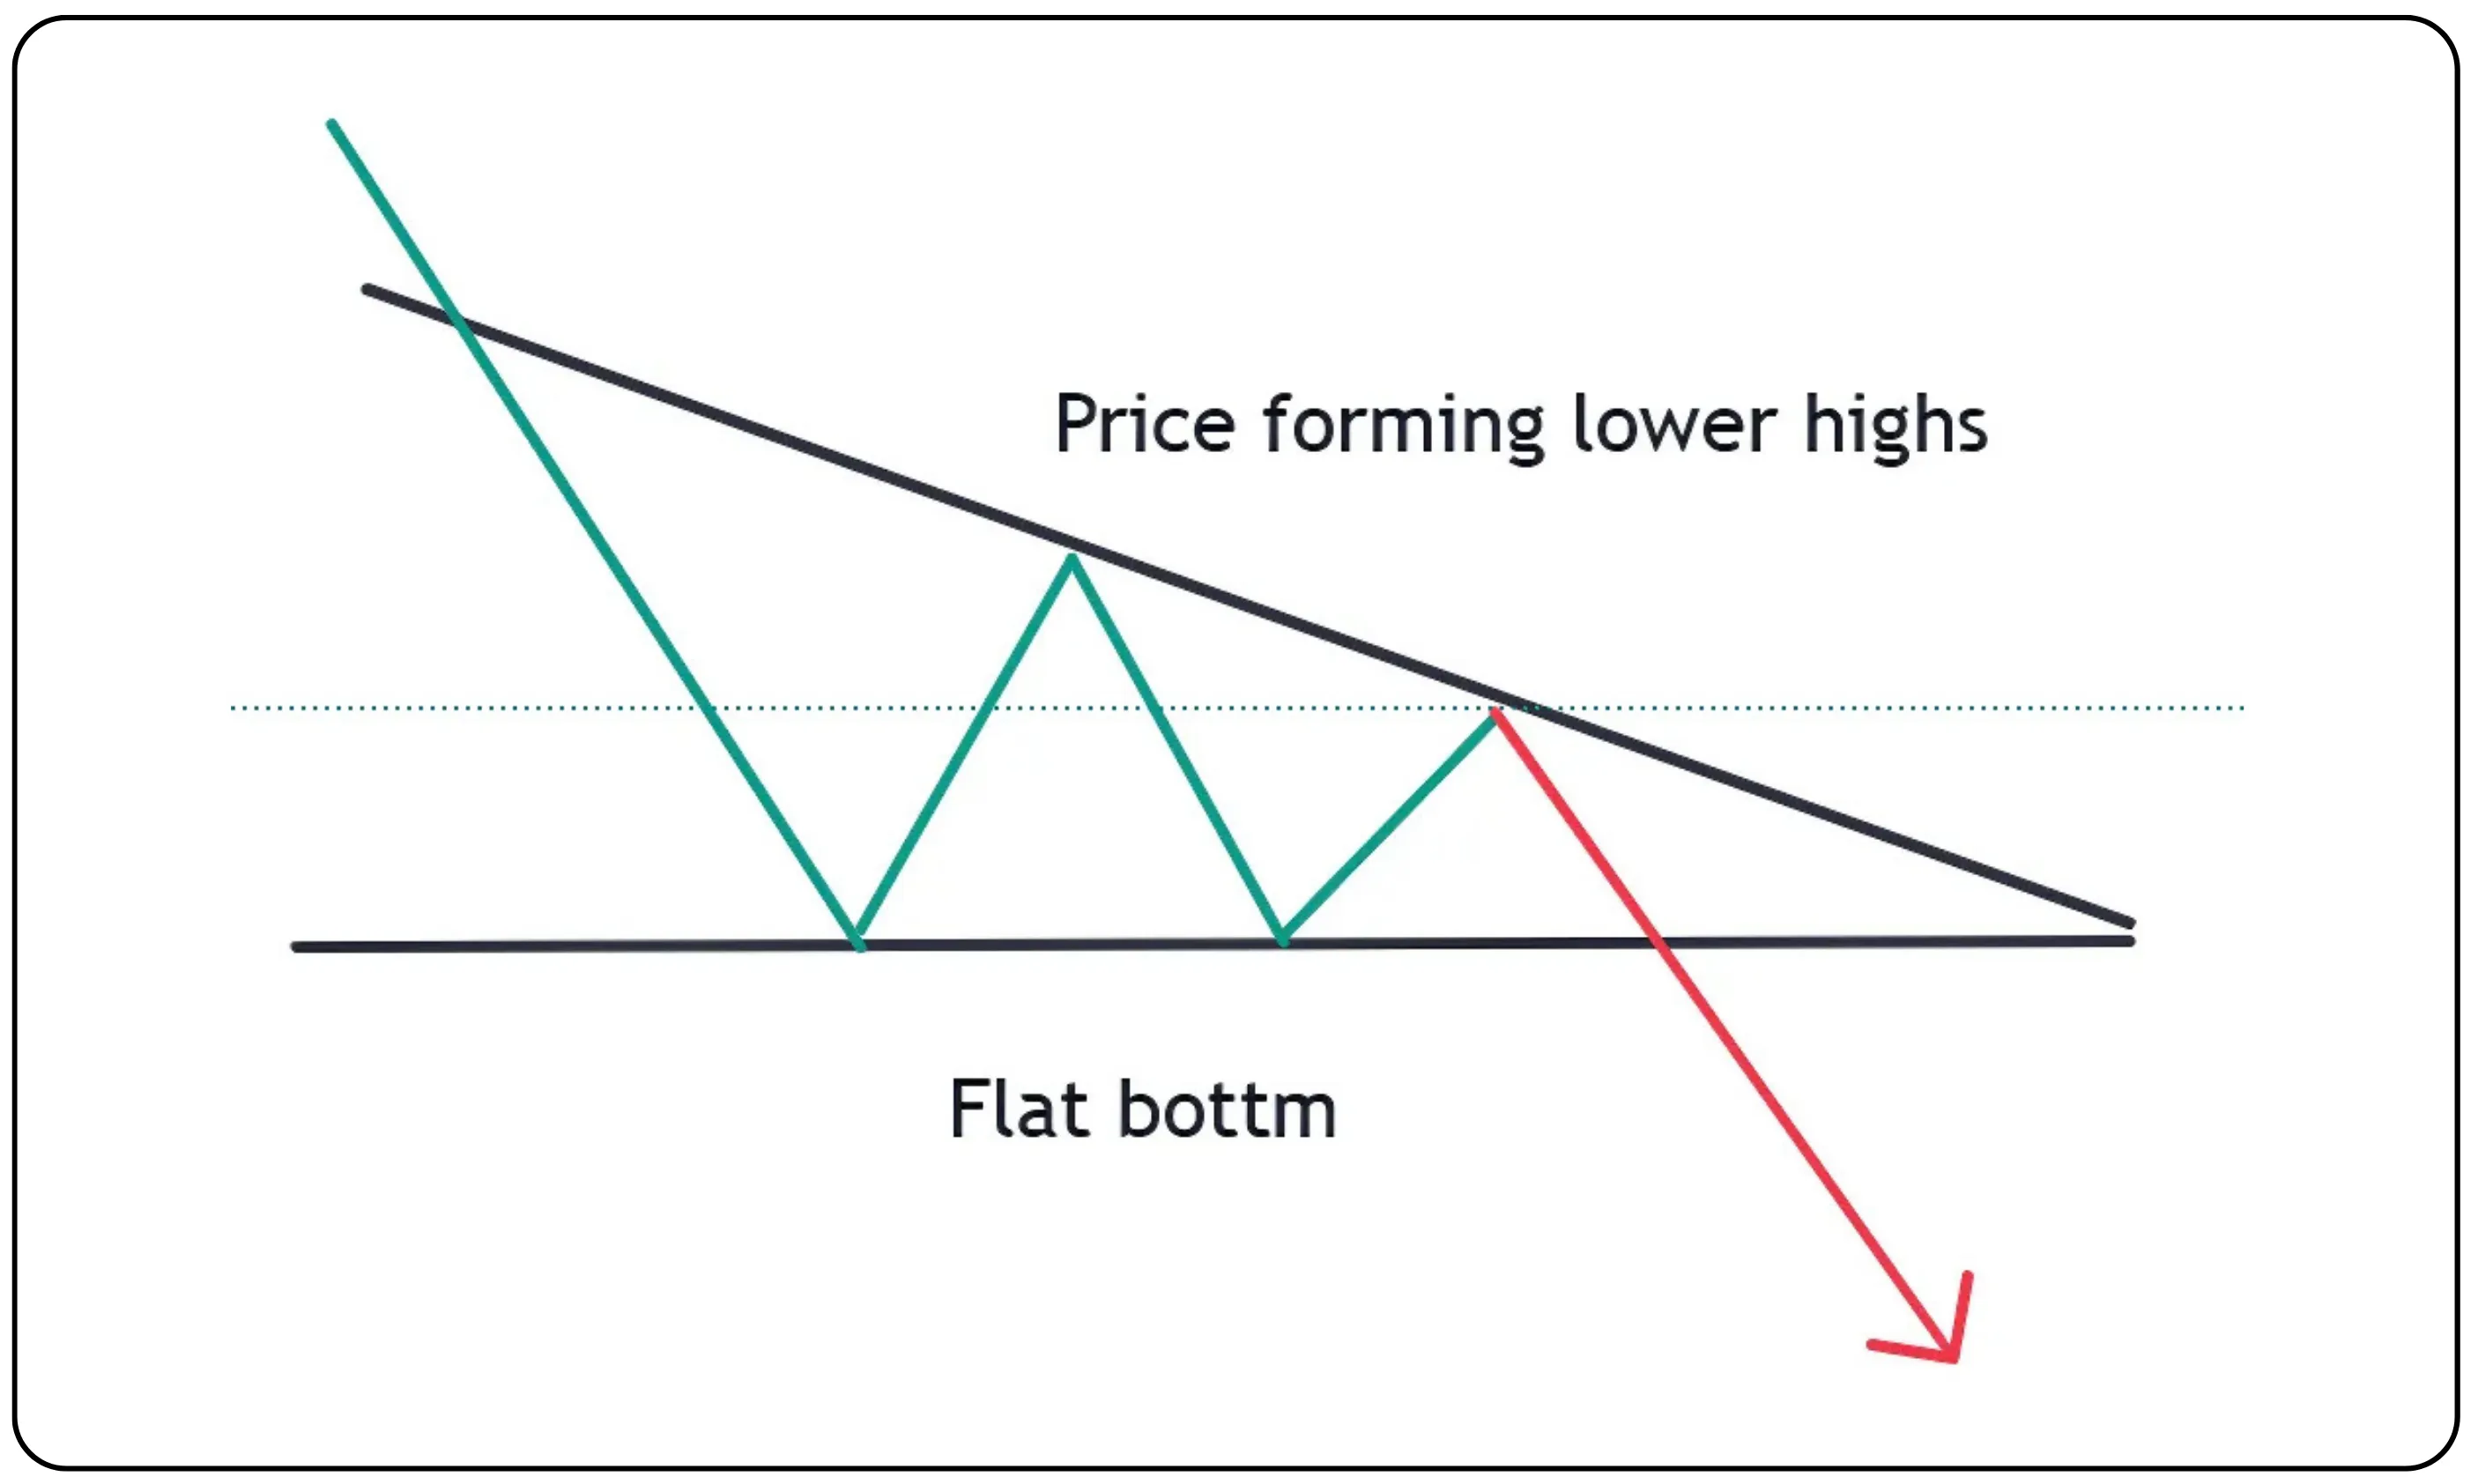
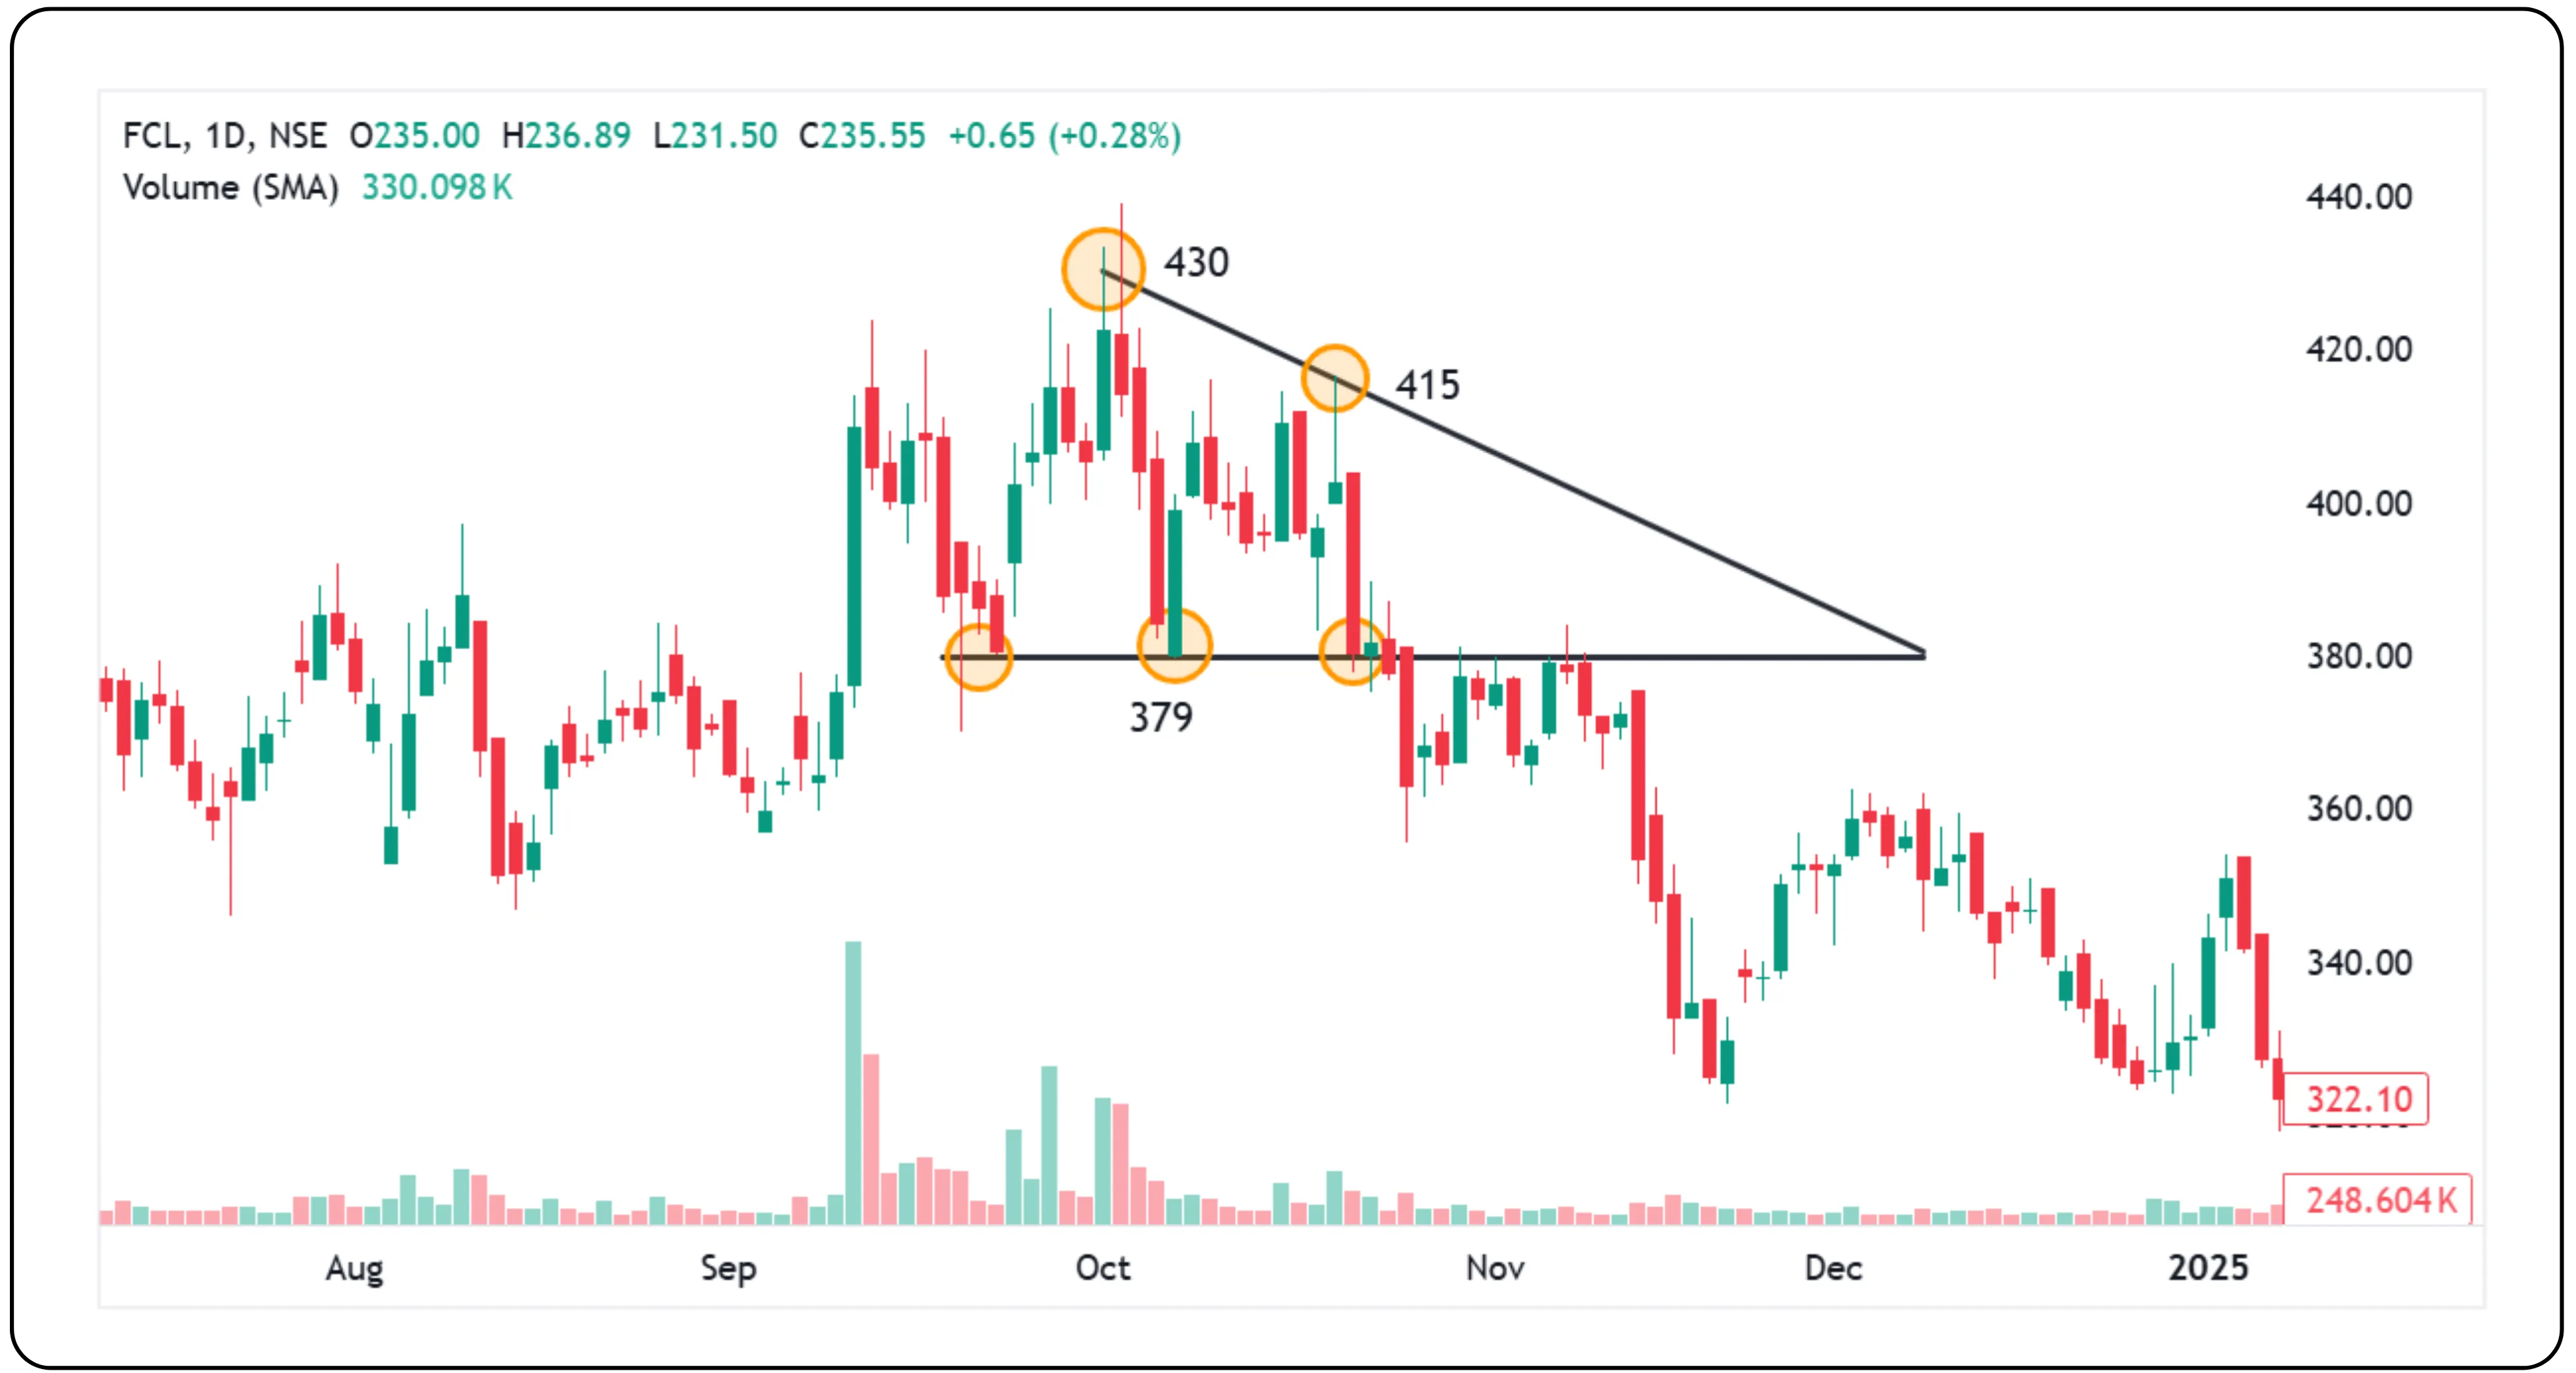
Now flip the pattern. A Descending Triangle has a flat support line on the bottom and a falling resistance line on the top. It is a bearish pattern that shows sellers are pushing harder while buyers are defending a price floor.
What It Looks Like:
Flat support on bottom: Price keeps bouncing at the same level.
Falling resistance: Each rally is weaker than the last.
Triangle squeezes as buyers run out of steam
This pattern often signals a downward breakout and is usually seen during downtrends.
Market Psychology
Suppose a stock finds support at ₹379. Every time it dips there, buyers step in. But sellers show up earlier and earlier — ₹430, ₹415. That falling trendline tells us that bearish pressure is increasing. If buyers give up, the price breaks ₹379 and can fall sharply.
- Descending Triangles break downwards about 57% to 65% of the time, making them a classic bearish continuation pattern.
Quick Checklist to Identify:
At least two lows at the same level (flat bottom)
At least two lower highs (falling top)
Volume typically declines inside the triangle
Watch for a breakdown below support with rising volume
How to trade Descending triangle
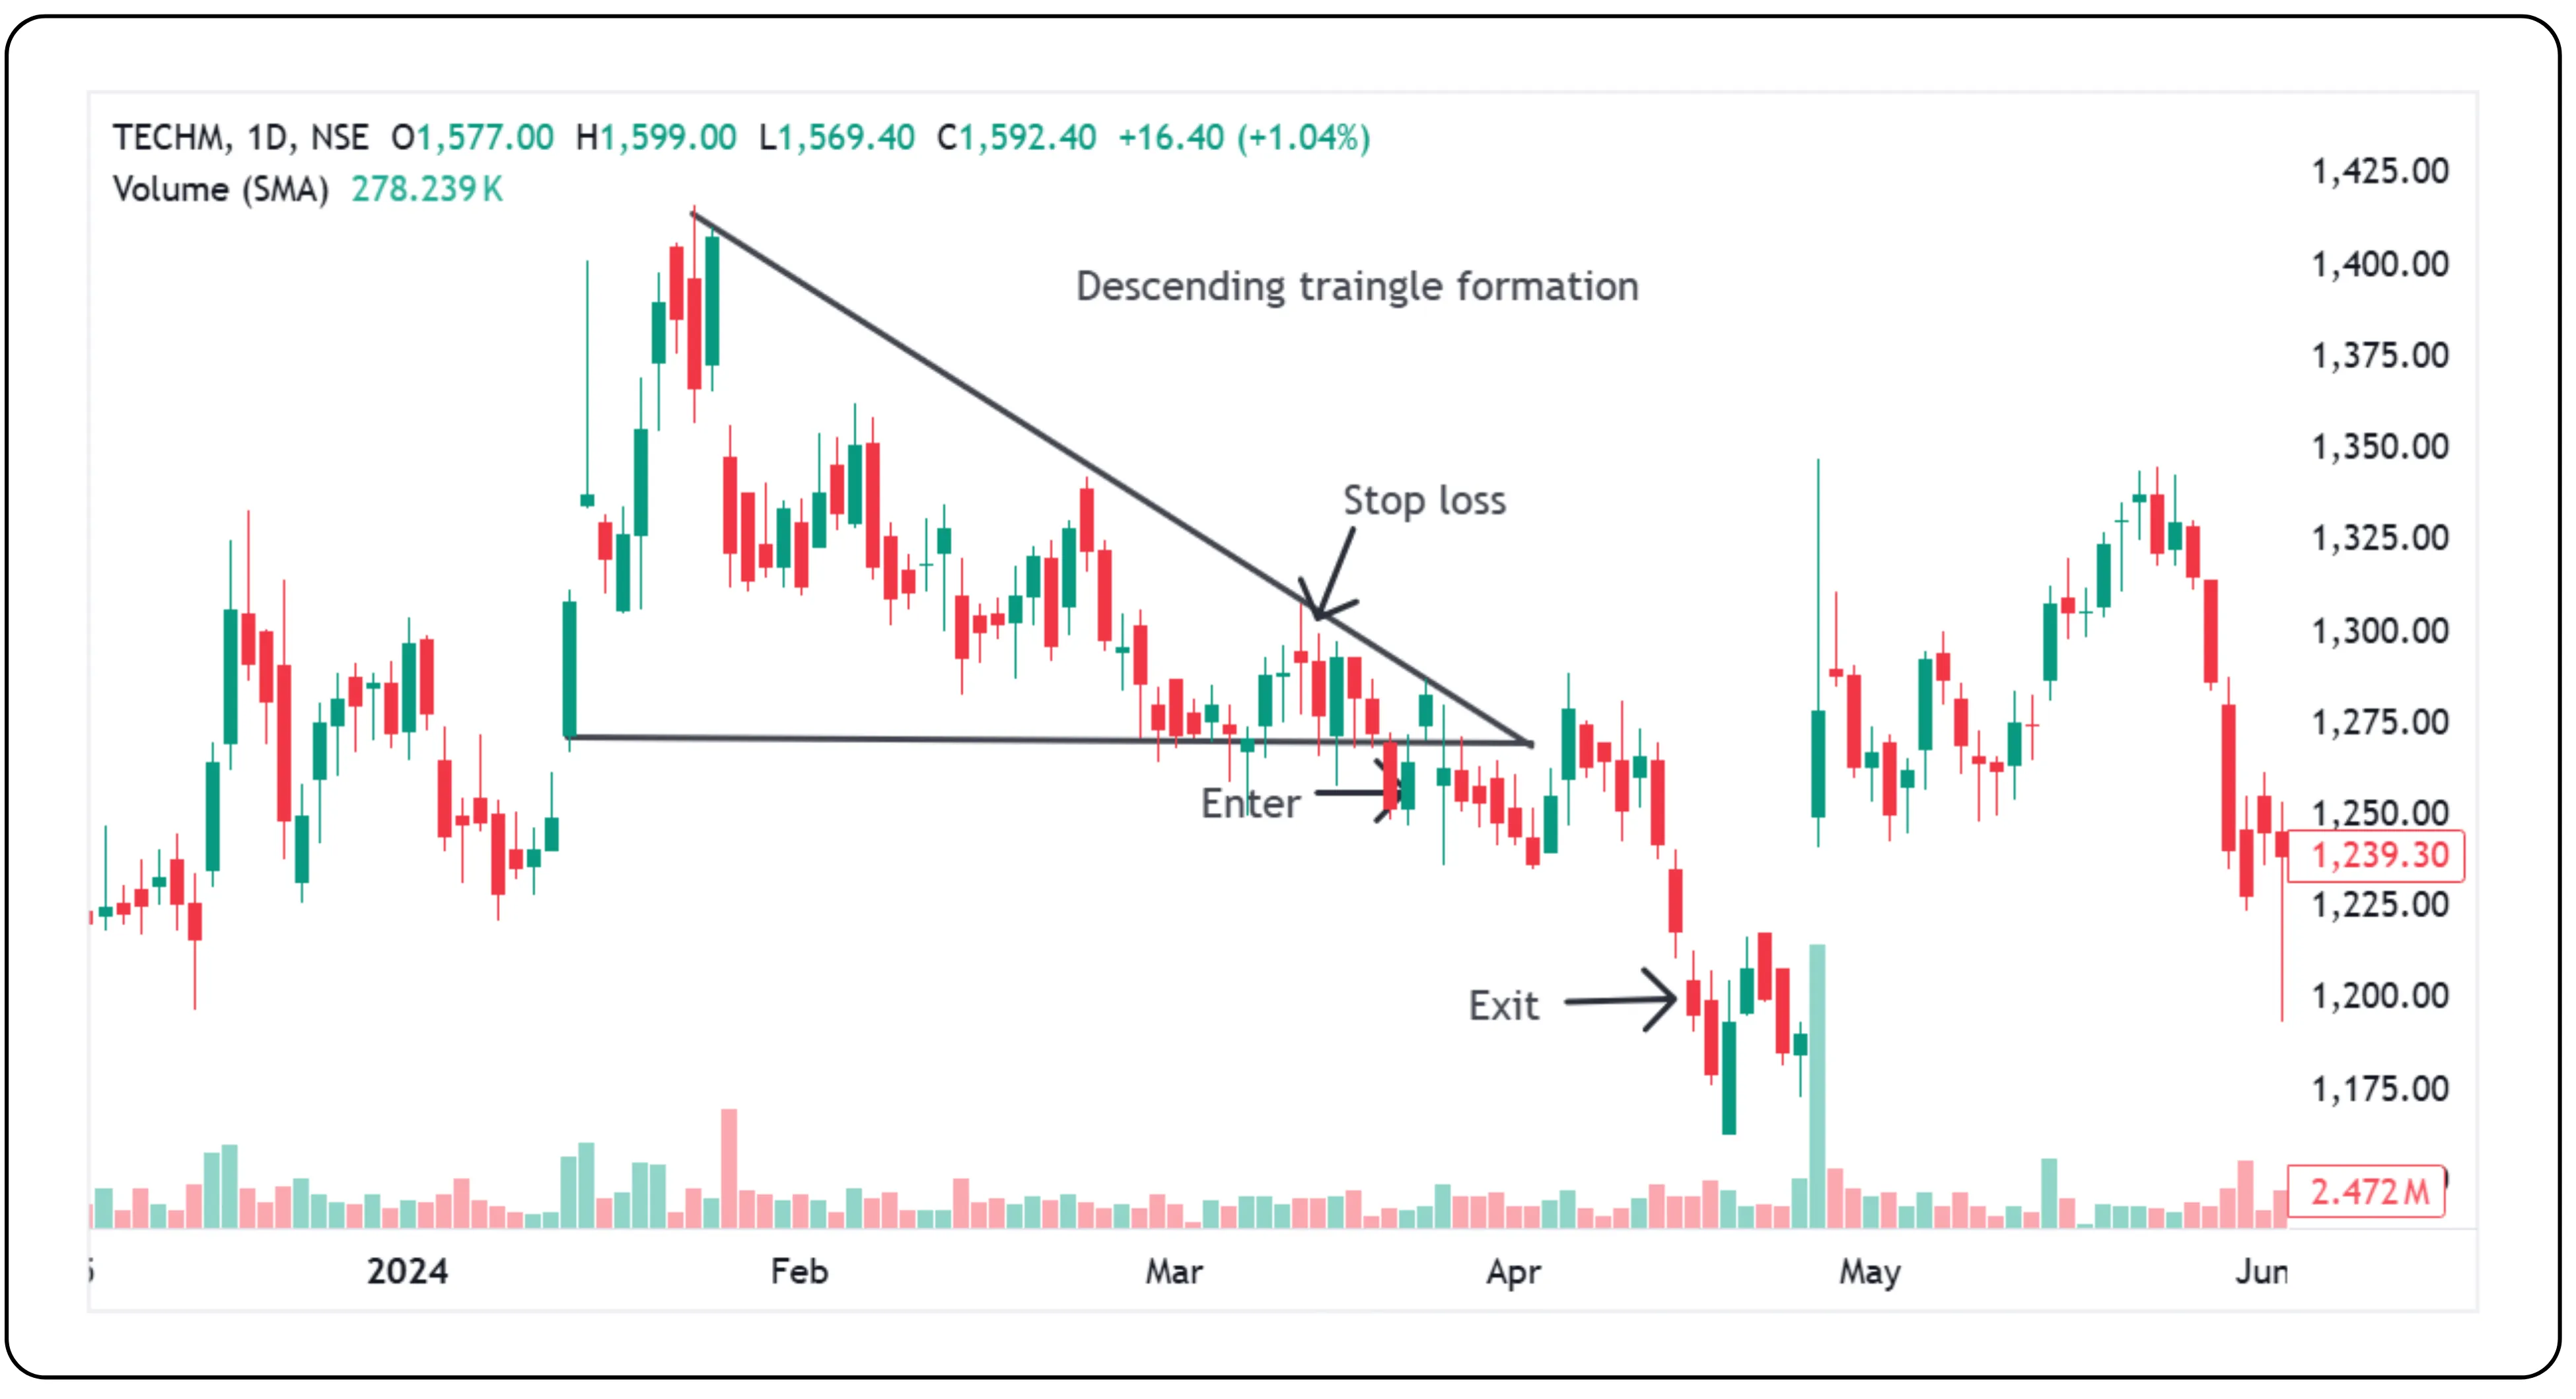
A descending triangle pattern was observed on the TECHM chart between January 2024 and March 2024. The entry was triggered at ₹1261 when the price broke below the flat support line of the triangle, indicating bearish momentum. As is common with such breakouts, the stock pulled back slightly, but crucially, it did not hit the stop-loss and then resumed its downward move.
Entry: ₹1261, on breakdown confirmation
Stop Loss: Placed just above the last swing high before the breakdown, at ₹1300
Exit Strategy: Based on whichever occurred first —
The previous swing support
A 1:2 risk-to-reward ratio
The exit was successfully triggered at ₹1199, aligning with the earlier swing support level and meeting the risk-to-reward target.
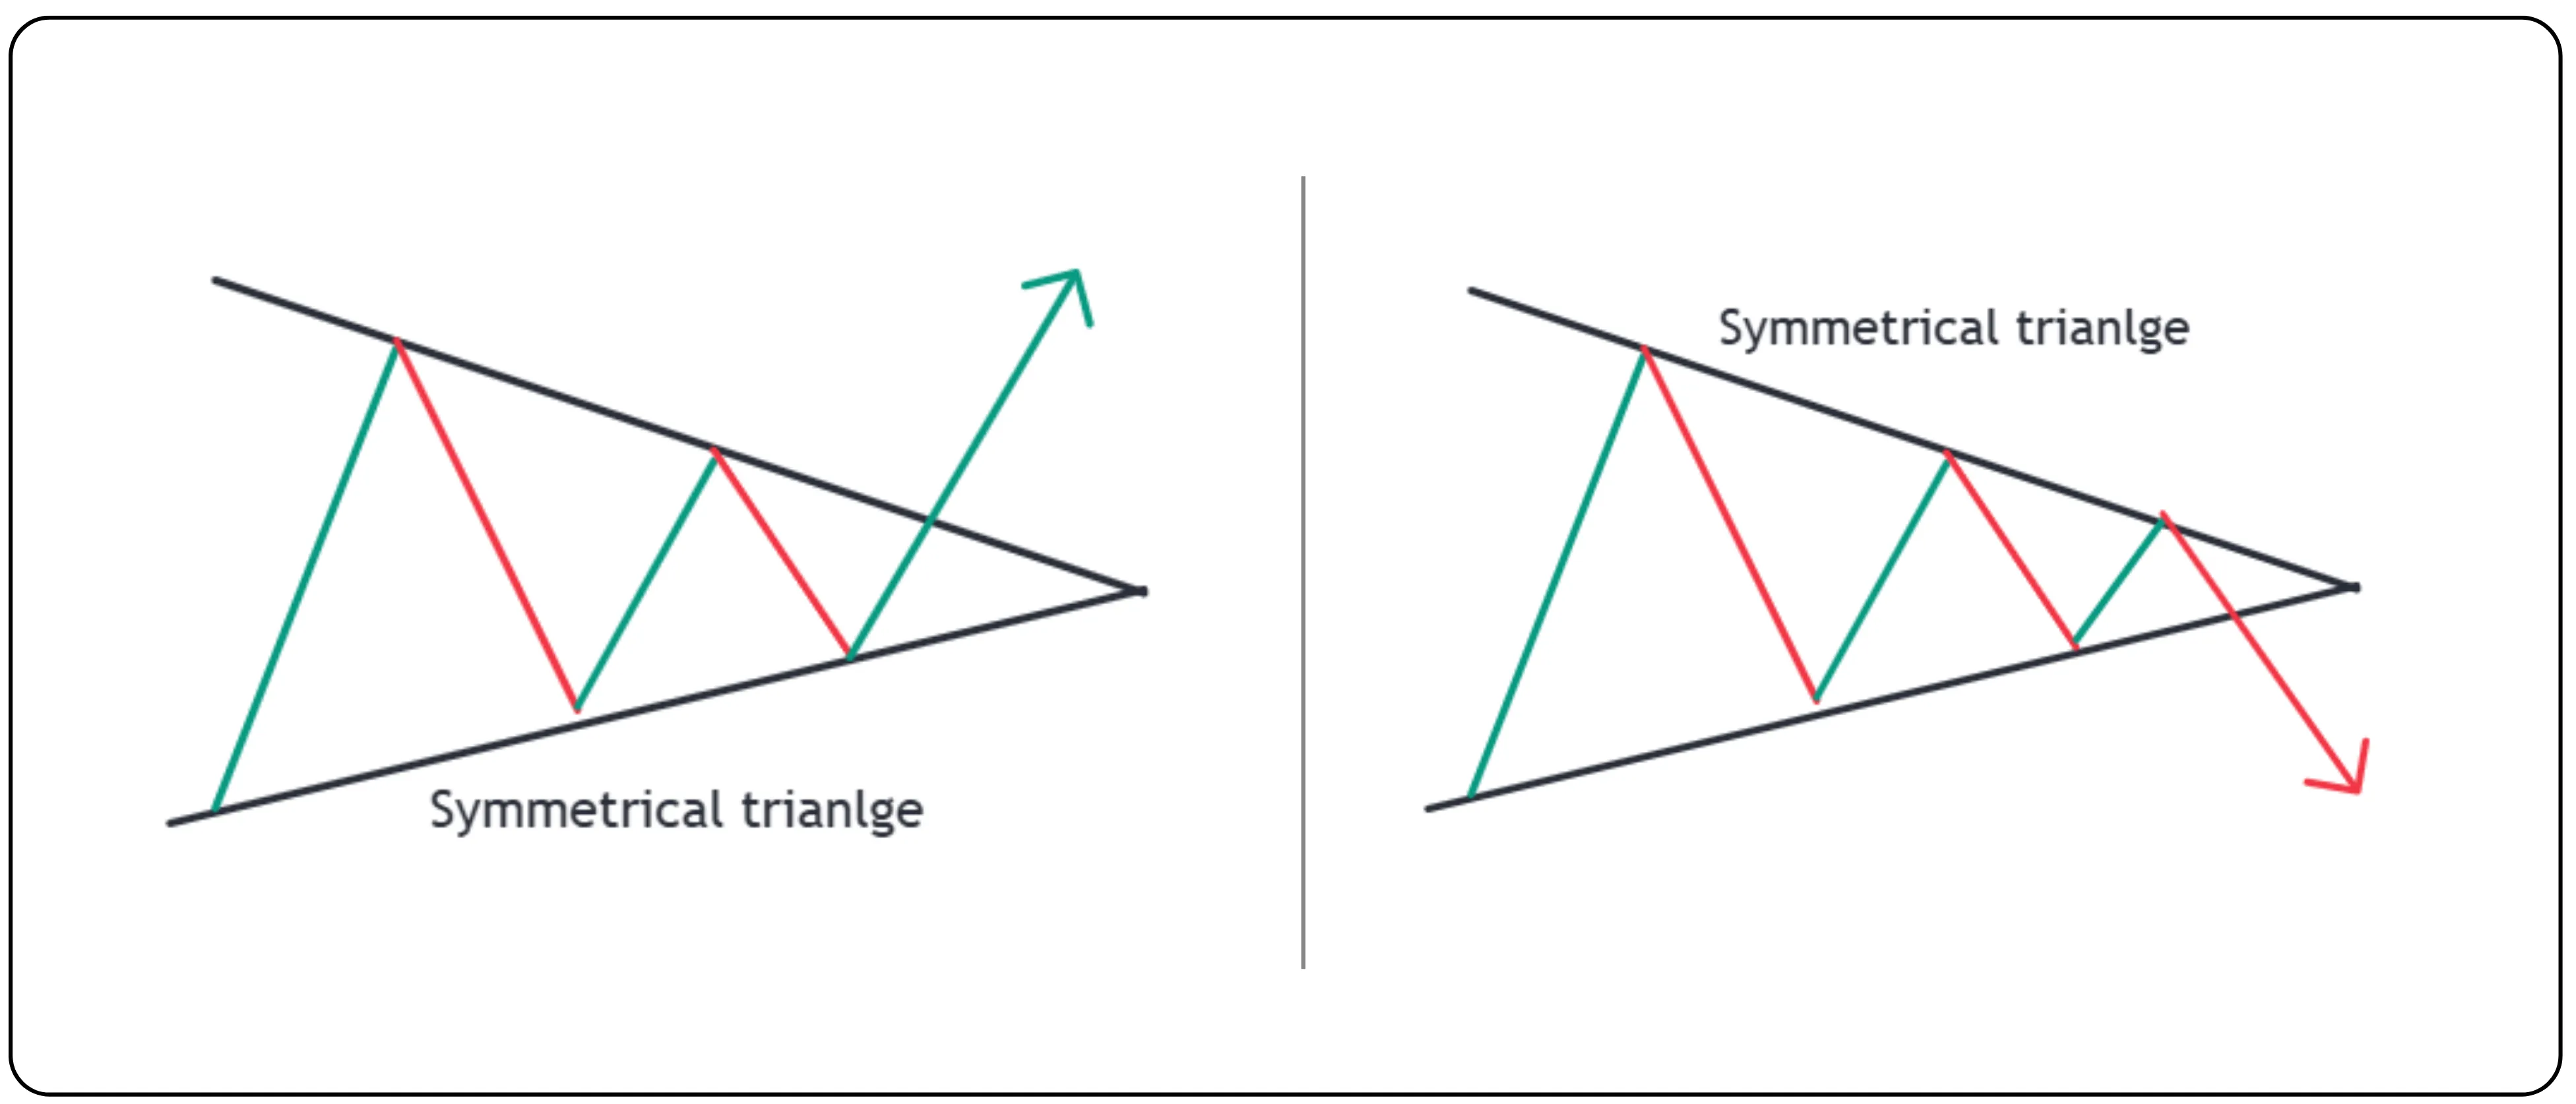
A symmetrical triangle, Now balance the battle.
It is a neutral pattern that reflects a standoff between buyers and sellers. Neither side is clearly in control. Price keeps bouncing between narrowing highs and lows until a breakout occurs, which can go in either direction.
What It Looks Like:
Falling resistance on top: Each high is lower than the last.
Rising support on bottom: Each low is higher than the last.
Triangle compresses: Price moves within a tightening range, forming a symmetrical shape.
This pattern typically appears during a trend pause — before the market resumes in the direction of the breakout, either up or down.
Market psychology
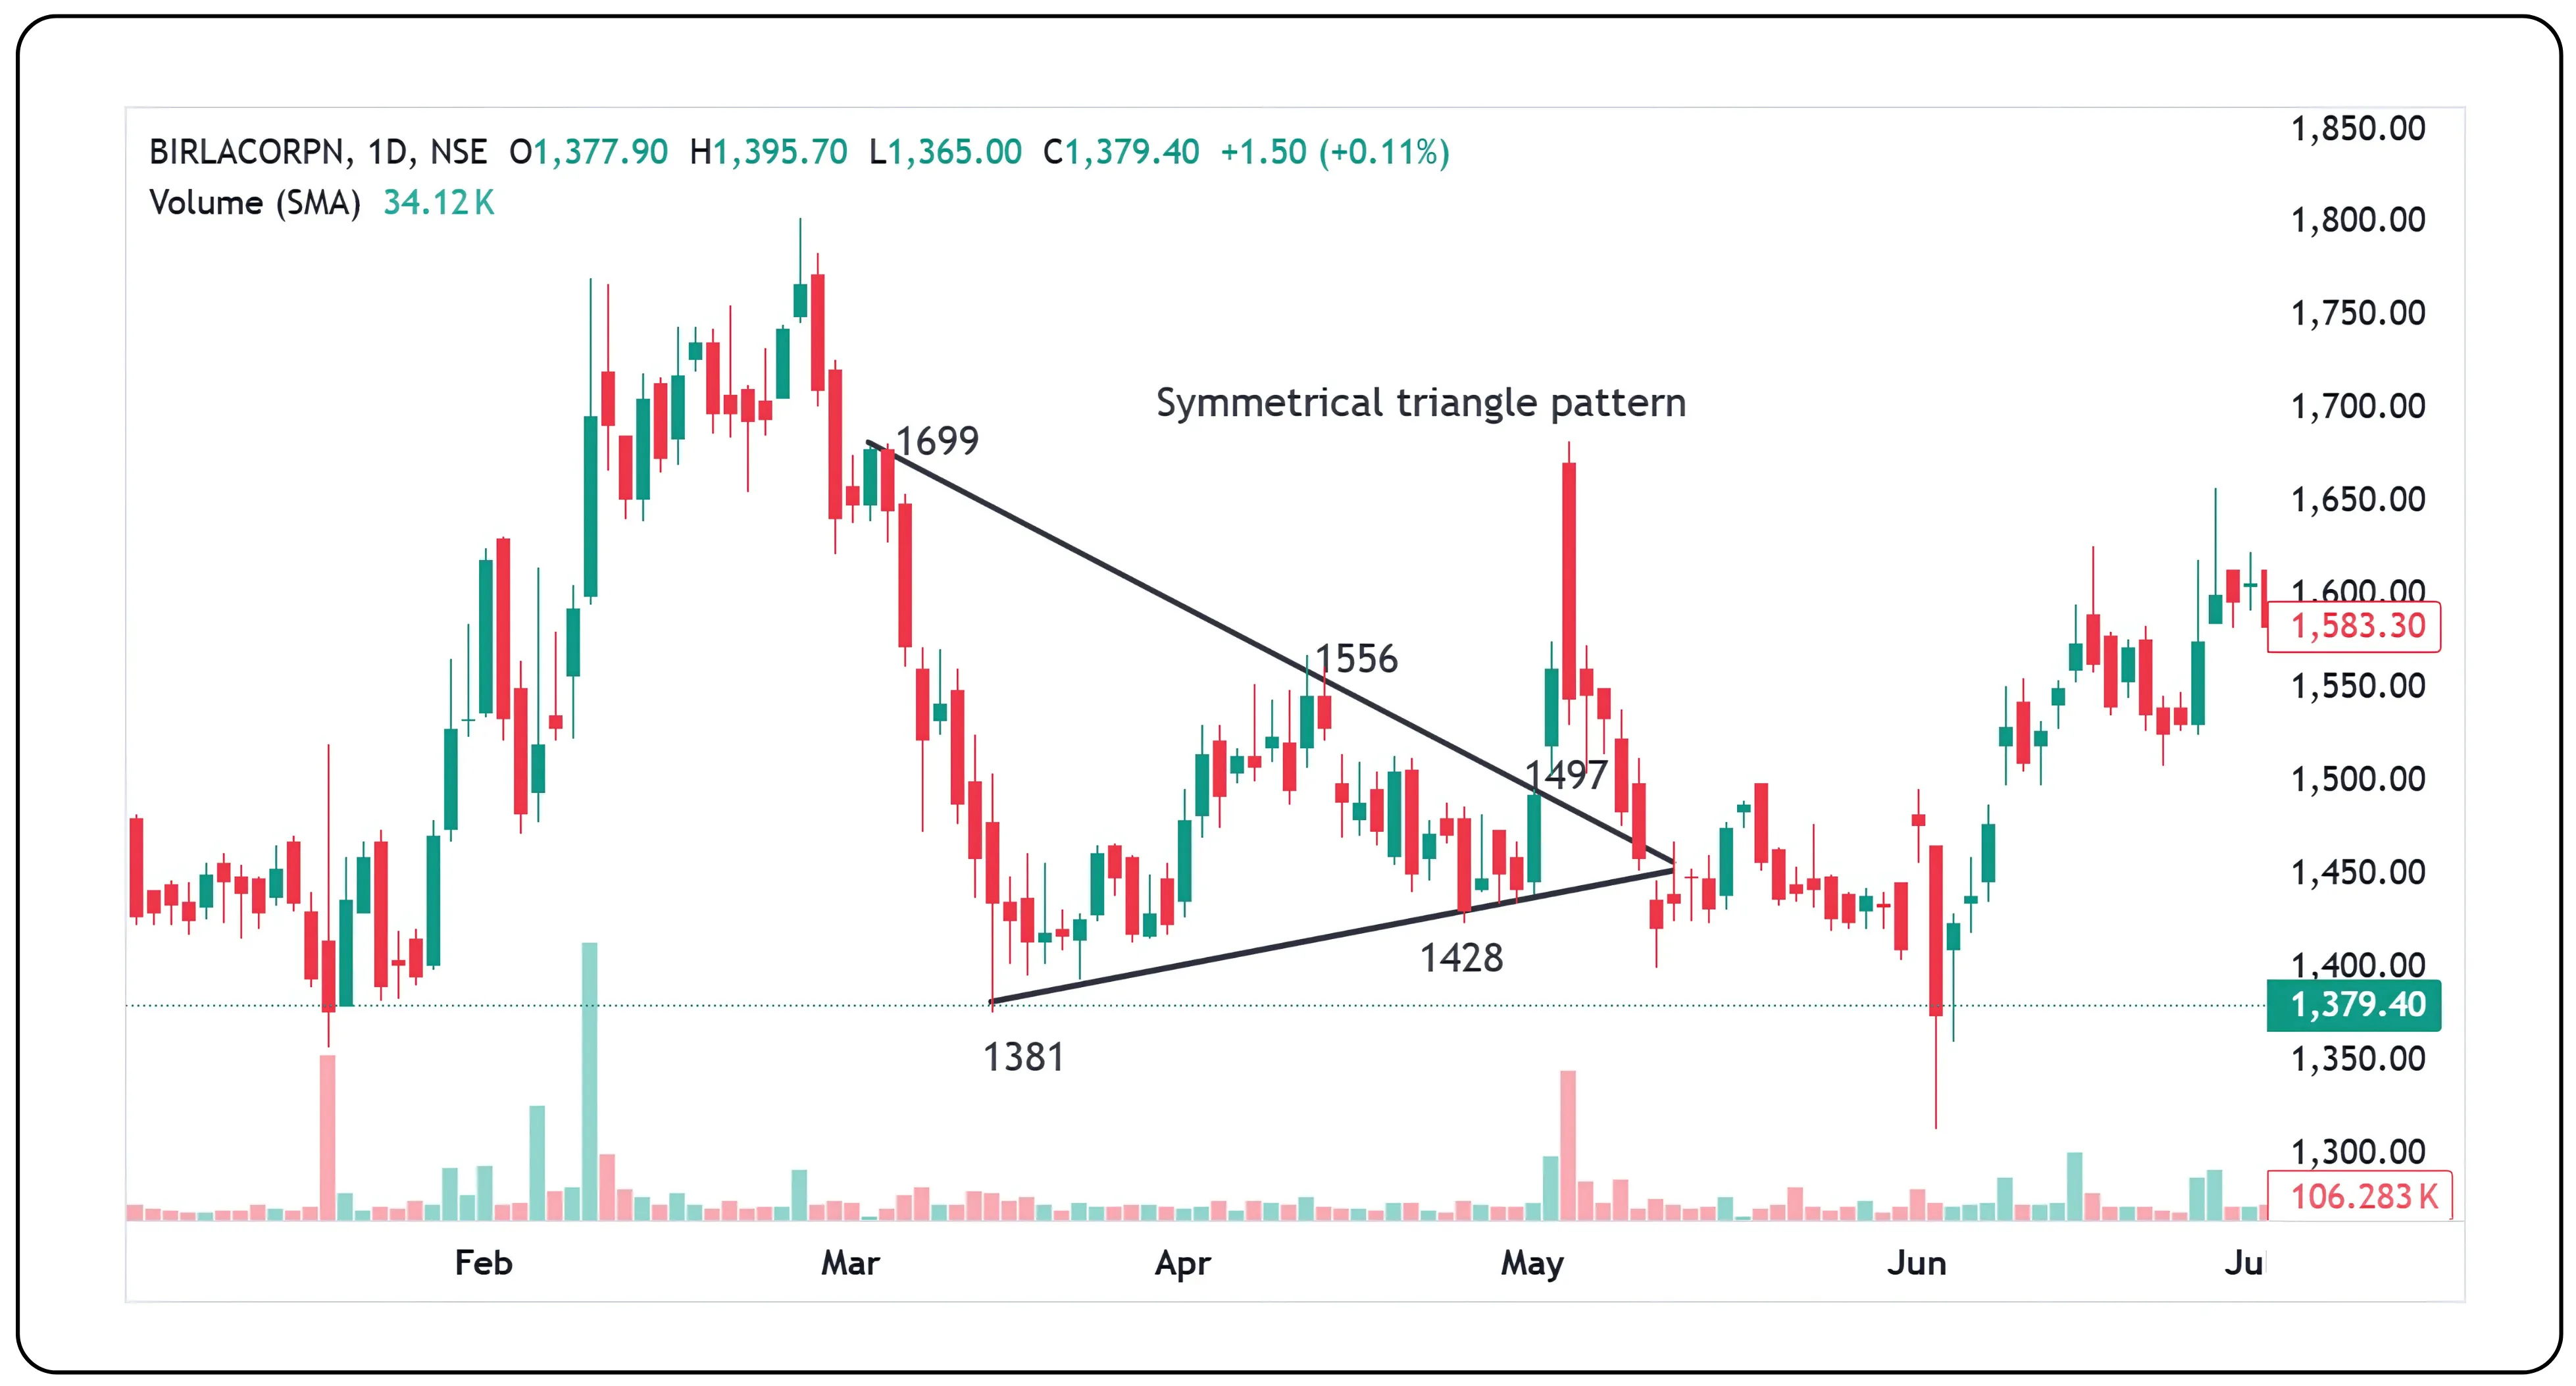
Imagine a stock consolidating between ₹1,699 and ₹1,381. Over time, buyers stop chasing higher levels — first ₹1,556, then ₹1,497. At the same time, sellers no longer push as low — holding the line at ₹1,428 instead of ₹1,381. This creates a tug-of-war where both sides are tightening their grip. The price action compresses, forming a symmetrical triangle. Eventually, tension builds up enough that one side gives in — leading to a breakout with strong momentum.
Symmetrical triangles break upward or downward with almost equal probability — roughly 50–60% in either direction — making them a versatile but less predictable chart pattern.
Quick checklist to Identify:
At least two lower highs (falling resistance)
At least two higher lows (rising support)
Volume usually shrinks during formation
Watch for breakout in either direction with a volume surge
How to trade Symmetrical triangle pattern
On CONCOR chart the symmetrical triangle formation
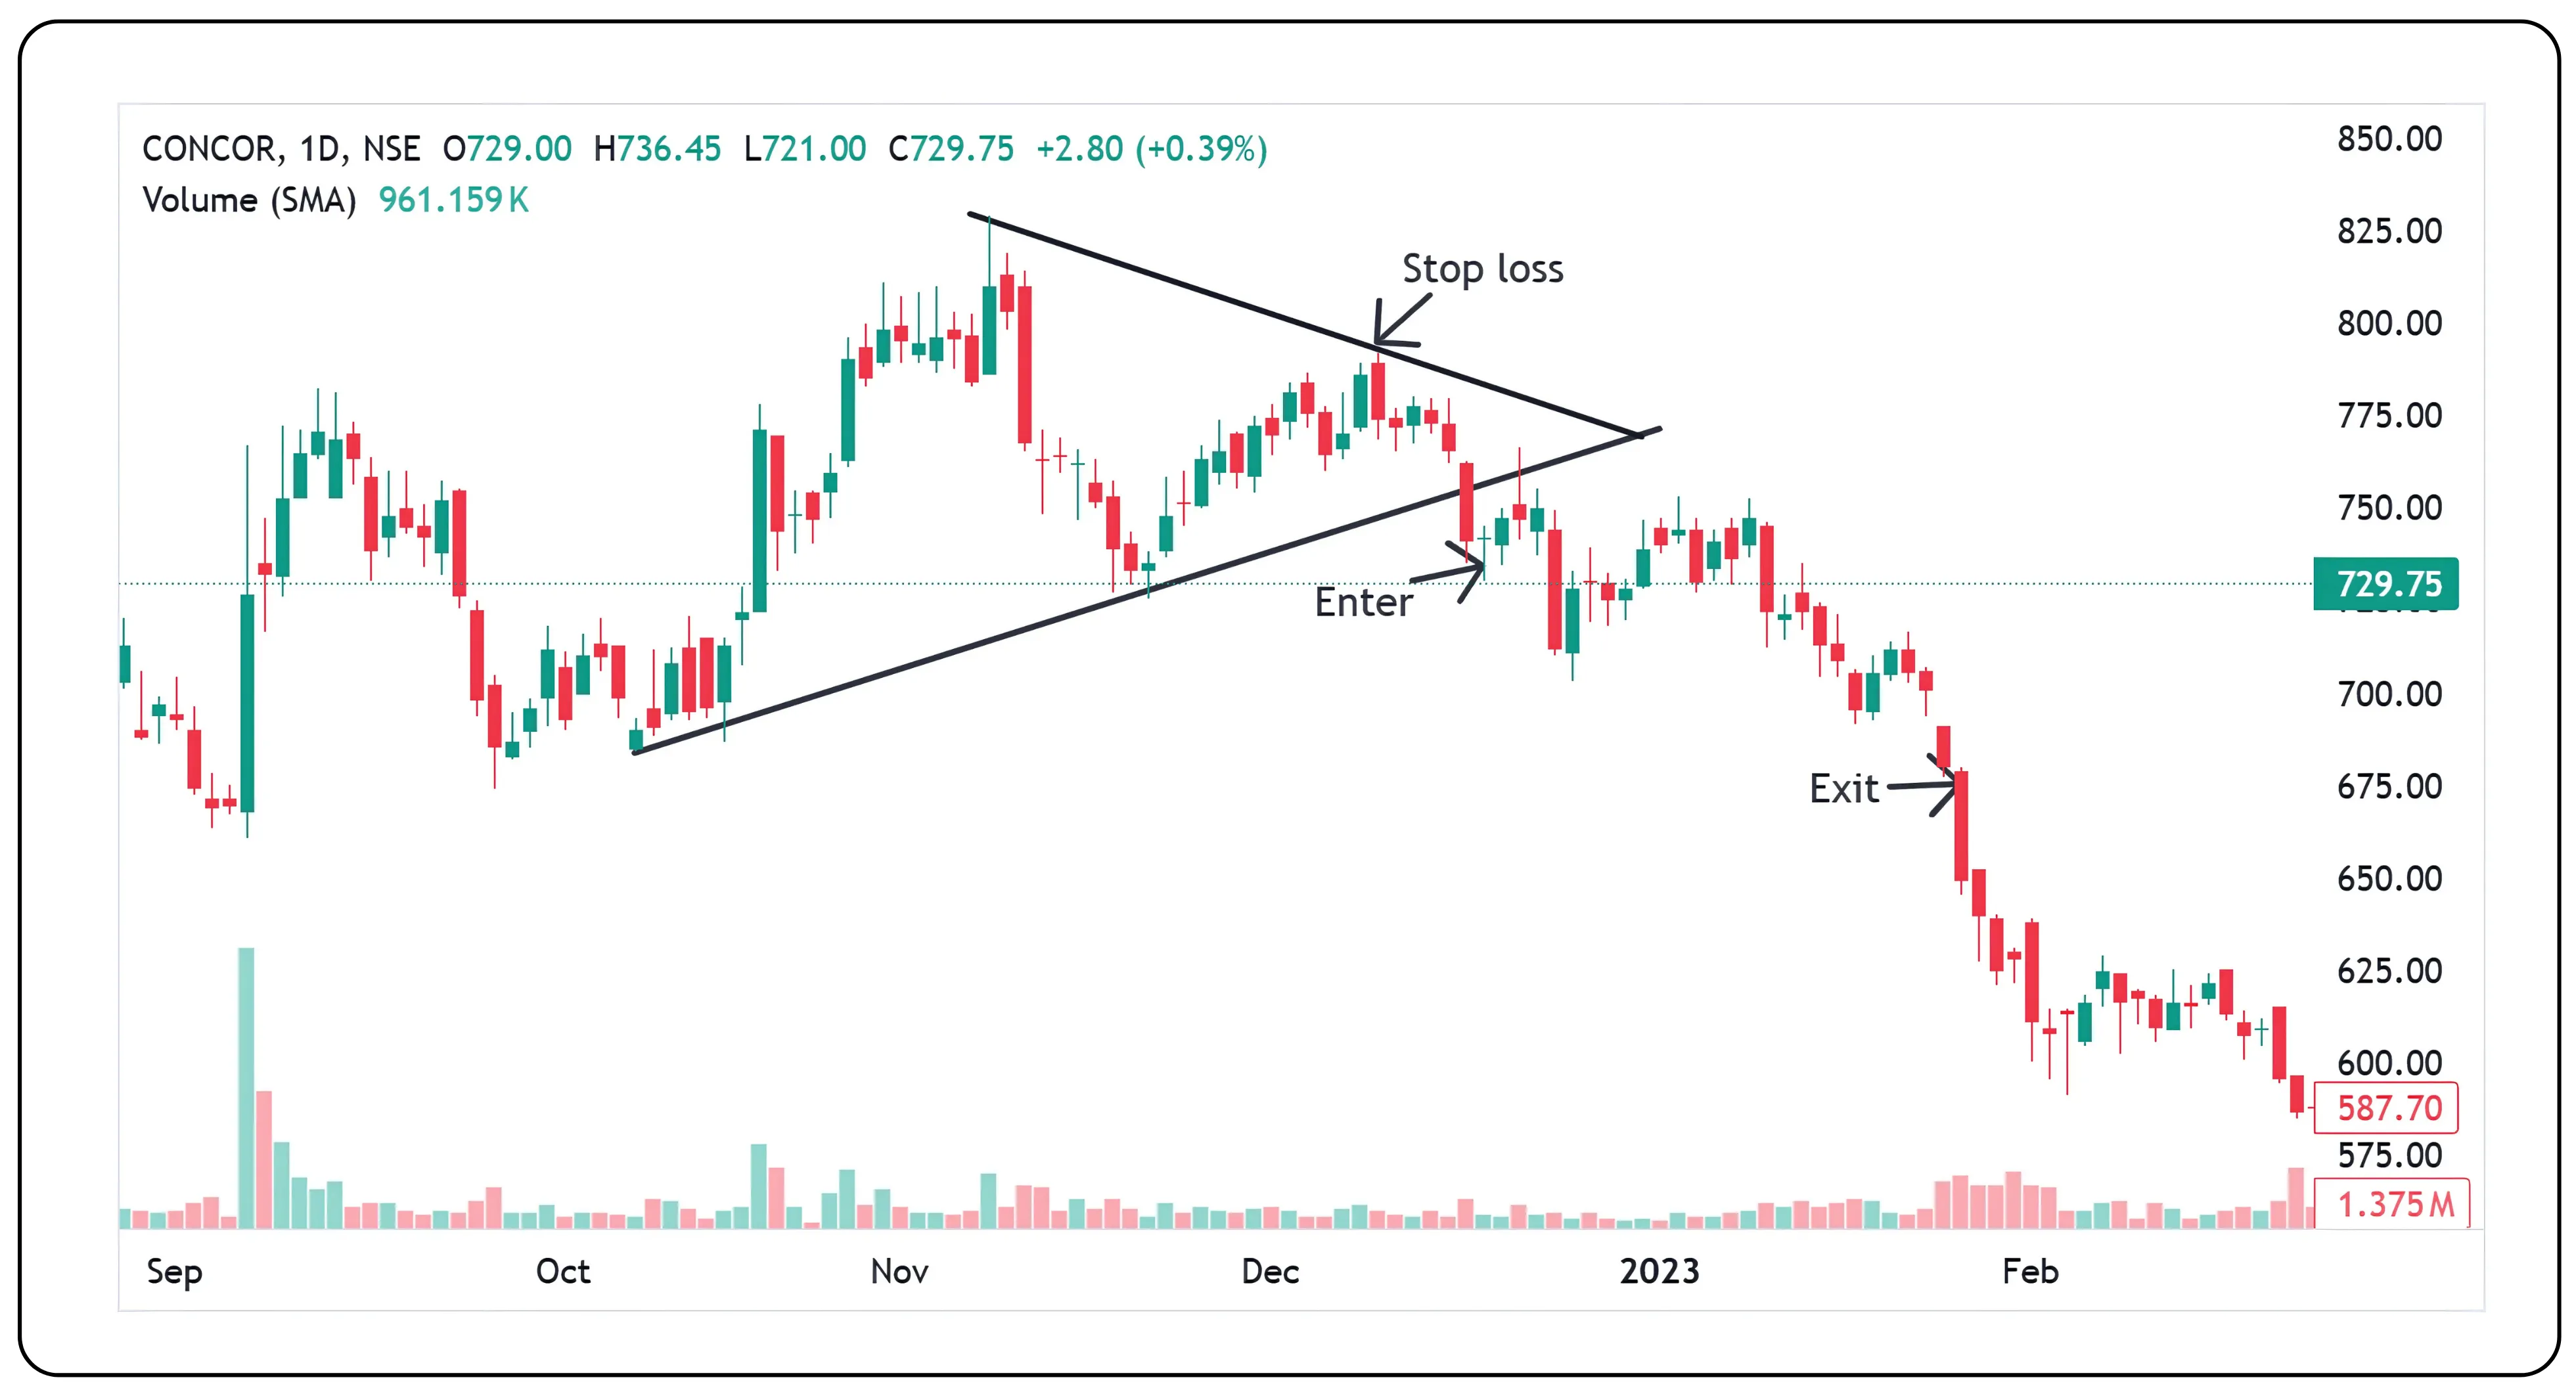
A symmetrical triangle pattern was observed on the CONCOR chart. The breakout triggered a sell position at ₹740 when the price broke below the converging trendlines, signaling bearish continuation. As often happens with symmetrical triangle breakouts, the price moved swiftly after the breakdown without retesting the breakout level.
Entry: ₹740, on breakdown confirmation
Stop Loss: Placed just above the recent swing high before the breakdown, at ₹792
Exit Strategy: Based on whichever occurred first —
The previous swing support
A 1:2 risk-to-reward ratio
The exit was successfully triggered at ₹672, which aligned with a prior swing support level and satisfied the risk-to-reward criteria.
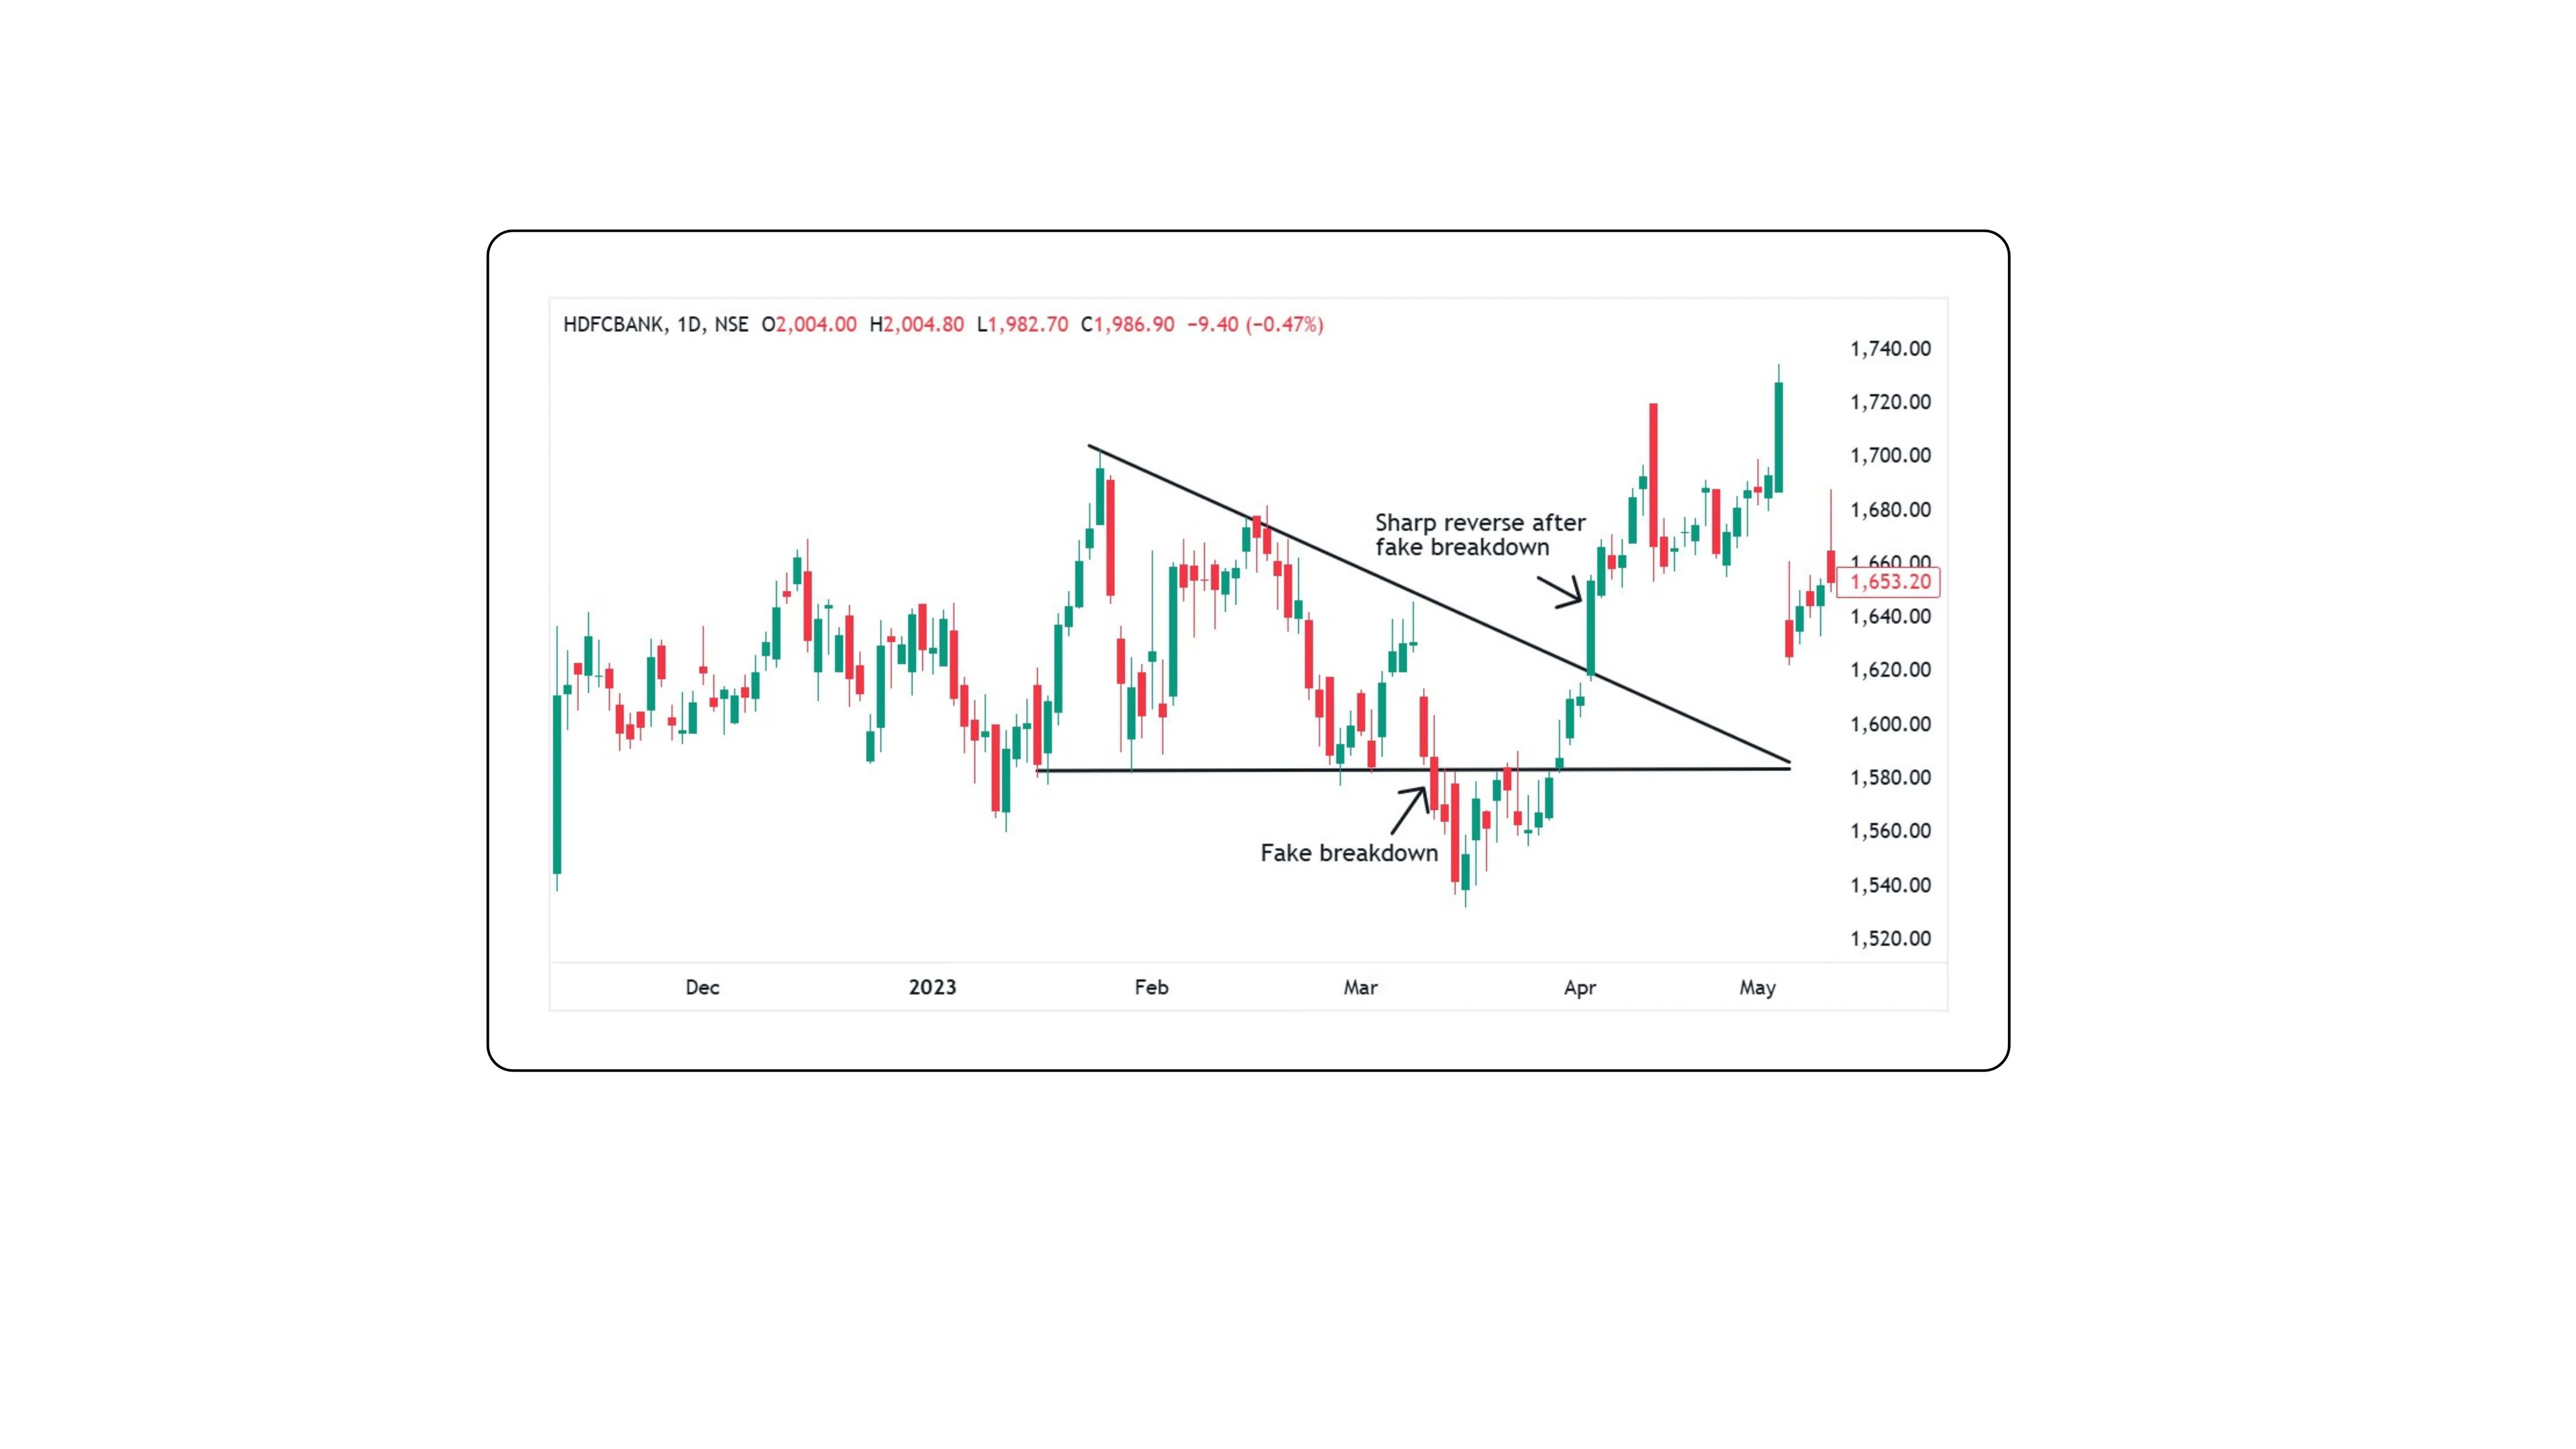
Busted Triangles: When the Market Fakes Out
Sometimes, triangles break in one direction and then reverse sharply. This is called a busted triangle. For example:
An ascending triangle breaks upward, but reverses and falls below support.
A descending triangle breaks downward, but reverses and rallies above resistance.
These are traps for traders. If you are caught on the wrong side, it is best to exit quickly.
Comparison of Triangle Chart Patterns: Ascending, Descending, and Symmetrical
| Feature | Ascending Triangle | Descending Triangle | Symmetrical Triangle |
|---|---|---|---|
| Top Line | Flat (resistance) | Falling (resistance) | Falling |
| Bottom Line | Rising (support) | Flat (support) | Rising |
| Bias | Bullish | Bearish | Neutral (depends on breakout direction) |
| Breakout Direction | Usually Up | Usually Down | Either Up or Down |
| Trend Continuation | In uptrends | In downtrends | In both uptrends and downtrends |
| Volume Pattern | Shrinks, spikes at breakout | Shrinks, spikes at breakdown | Shrinks, then spikes at breakout |
Also read: 5 Reasons Why Sensex Is Always Higher Than Nifty
Pro Tips for Trading Triangle Patterns
Use trendlines accurately — they should connect at least two points.
Do not force patterns — avoid triangles with uneven, jagged sides.
Wait for volume confirmation during breakout or breakdown.
Always use a stop-loss — especially in case of busted triangles.
Combine triangles with RSI, MACD, or volume indicators for stronger confirmation.
What Triangle Patterns Reveal About Market Psychology
Triangles may look like simple shapes, but they carry powerful clues about price behavior. The Ascending Triangle shows growing bullish pressure. The Descending Triangle warns of increasing bearish control. When used properly, these patterns can help you anticipate breakouts, manage risk, and enter high-probability trades. Think of them as market conversations: are buyers getting more confident or are sellers pressing harder? Learn to listen through the patterns.
Disclaimer: The information provided in our blogs is for informational purposes only and should not be construed as financial, investment, or trading advice. Trading and investing in the securities market carries risk. Always conduct your own research and consult with a qualified financial advisor before making any investment decisions. Past performance is not indicative of future results. Copyrighted and original content for your trading and investing needs.
© 2025 — Tradejini. All Rights Reserved.


